Embed Size (px)
Citation preview

1 | P a g e
Quality of service and product as the main factors influencing
customers’ satisfaction in the clothing retailing industry in
Ireland- case study of ZARA Plc.
Author: Justyna Jaskulska
Student Number:1659616
Course: MBA in Project Management
Supervisor: Ms Luciana Lolich
Word Count: 22,800
August, 16th
2013

i | P a g e
Abstract
This study intends to rank the dimensions and identify the best predictors of overall
service and product quality and customer satisfaction resulting from both. To achieve
this, a theoretical and empirical study was conducted. Different theories, concentrated
on customer satisfaction, quality itself, as well as service and product, were reviewed to
provide the background for the analysis.
In order to have the statistic data for this research, a questionnaire based on
SERVQUAL and Garvin’s eight dimensions of product quality was created and
distributed using a snowball method. As a result, 100 respondents answered the
questionnaire and the data obtained from them was transferred to SPSS 15.00.
The last two parts of this research analyse the results of the questionnaires as well as
provide some recommendations for management.
Key words: Customer Satisfaction, Service quality, SERVQUAL, Product quality,
Clothing Retailing Industry.

ii | P a g e
Declaration
I hereby would like to confirm that this material, which we now submit for assessment
on the programme of study leading to the award of MBA in Project Management, is a
presentation of my original research work.
Wherever contributions of others are involved, every effort was made to indicate this
clearly, with due reference to the literature, and acknowledgement of collaborative
research and discussions.
The work was done under the guidance of Ms Luciana Lolich at the Dublin Business
School.
Signed: Justyna Jaskulska
Date: 16.08.2013

iii | P a g e
Acknowledgments
First of all, I would like to thank The Dublin Business School for giving me the
opportunity to work on this research.
To my parents for support and constant push into the right direction. You have been
very understanding although demanding at times but then I value that a lot. I want to
thank you for reminding me where my goals lie and raising me to the stage where I was
able to set my own goals.
Special thanks to my fiancé Alessandro for his personal support and great patience at all
times.
Finally, to my supervisor Ms Luciana Lolich for her very valuable guidance and support
throughout this term.
16th
August, 2013
Dublin, Ireland
Justyna Jaskulska

i | P a g e
Table of Contents
Declaration……………………………………………… i
Abstract………………………………………………..... ii
Acknowledgements……………………………………… iii
1. Introduction……………………………………………. 1
1.2 Background……………………………………………………….... 1
1.3 Problem Statement, Structure and the Purpose of the Study……… 5
1.4 Objectives of the Study …………………………………………… 8
1.5 Purpose of the Study ……………………………………………… 9
1.6 Retailing Industry…………………………………………………. 10
1.6.1 Retail Sales in Ireland…………………………………………….. 10
1.6.2 ZARA (Inditex)…………………………………………………… 11
1.6.3 Global Sales ………………………………………………………. 12
1.6.4 Challenges to overcome for ZARA ……………………………… 13
1.6.5 Future challenges …………………………………………………. 14
2. Literature review………………………………………. 15
2.1 Introduction ……………………………………………………… 15
2.2 Customer Satisfaction ……………………………………………. 15
2.3 Satisfaction & Loyalty …………………………………………… 17
2.4 Theoretical frameworks………………………………………….. 18
2.4.1 Customer perceptions of Quality- Customer Satisfaction Model… 19
2.5 Quality ……………………………………………………………. 21
2.5.1 Approaches to define Quality…………………………………… 22
2.5.2 Service Quality vs. Product Quality …………………………… 23
2.6 Service Quality- characteristic…………………………………. 25
2.6.1 SERVQUAL- the model & critique……………………………… 28
2.7 Product Quality ……………………………………………… 31
2.7.1 Dimensions of product quality ……………………………… 31
2.7.2 Relationship between product quality and customer satisfaction … 38
2.8 What determines satisfaction? How needs shape customer
behaviour? ……………………………………………………….
40

ii | P a g e
2.9 Chapter Summary ………………………………………………. 41
3. Methodology …………………………………………. 42
3.1 Introduction……………………………………………………… 42
3.2 Research Questions………………………………………………. 42
3.3 Structure of research methods…………………………………. 48
3.3.1 Research Philosophy……………………………………………. 50
3.3.2 Research Approach……………………………………………… 51
3.3.3 Research Strategy ……………………………………………….. 53
3.3.4 Research choice…………………………………………………. 55
3.3.5 Time Horizons ………………………………………………….. 55
3.3.6 Sample………………………………………………………… 56
3.3.7 Techniques………………………………………………………. 57
3.3.7.1 Descriptive Statistics ……………………………………………. 57
3.3.7.2 Reliability Data Analysis ………………………………………… 57
3.3.7.3 Factor Analysis ………………………………………………… 59
3.3.7.4 Regression Analysis ……………………………………………... 60
3.4 Ethics …………………………………………………………… 60
3.5 Researcher bias ………………………………………………… 61
4 Data Analysis…………………………………………. 62
4.1 Introduction…………………………………………………….. 62
4.2 Demographic Profile…………………………………………….. 62
4.3 Descriptive Statistics…………………………………………….. 65
4.3.1 SERVICE……………………………………………………….. 65
4.3.1.1 Descriptive Statistics…………………………………………….. 65
4.3.1.2 Reliability Data Analysis ……………………………………… 66
4.3.1.3 Determinants of Service Quality in Clothing Industry ………….. 68
4.3.1.4 Regression Analysis…………………………………………….. 72
4.3.2 GARMENTS…………………………………………………. 77
4.3.2.1 Descriptive Statistics…………………………………………. 77
4.3.2.2 Reliability Data Analysis ……………………………………. 77
4.3.2.3 Determinants of Garments Quality in Clothing Industry ……… 80
4.3.2.4 Regression Analysis……………………………………………. 83
4.3.3 Overall Customer Satisfaction………………………………. 86

iii | P a g e
4.3.3.1 Descriptive Statistics ………………………………………… 86
4.3.3.2 T-Test (Gender & Nationality) ………………………………… 86
5 Conclusions & Recommendations ………………….. 88
5.1 Introduction…………………………………………………….. 88
5.2 Research questions- conclusions……………………………… 88
5.3 Recommendations …………………………………………….. 93
5.4 Limitations and recommendations for further research…………. 94
6 Reflections on learning 96
Bibliography 103
Appendices 112
Appendix A- Individual Customer Satisfaction 112
Appendix B- Goods vs. Services 114
Appendix C- Determinants of Service Quality 115
Appendix D- E-mail sent to respondents 117
Appendix E- Draft version of survey 118
Appendix F- SPSS Data 126
Appendix G-Glossary of Statistical Data 152
Appendix H- Determinants of service quality 154
Appendix I- Determinants of garments quality 155
Appendix J-Additional Statistics- Service 156
Appendix K-Additional Statistics-Garments 158
Appendix L-Approaches to Quality 160
Appendix M- ZARA focus on Customers 164

iv | P a g e
List of Figures 1.1 Master Thesis Structure 6
1.2 Sales by brand (Inditex) 11
1.3 Global Platform Sales year 2011 13
1.4 Global Platform Sales year 2012 13
2.1 The relationship between customer satisfaction and loyalty 17
2.2 Customer perception of quality 20
2.3 Eight dimensions of product quality 32
2.4 Purchase intentions initial model 39
3.1 The conceptual model based on the research objectives 48
3.2 Structure of research methods 51
3.3 Deductive approach model 55
6.1 Kano attractive quality 99
List of Tables
4.1 Demographic Data Summary 64
4.2 SERVQUAL- Descriptive Statistics 65
4.3 Reliability Statistics- SERVQUAL 66
4.4 Reliability Data Analysis for SERVQUAL 67
4.5 Summary Item Statistics for SERVQUAL 67
4.6 Reliability Statistics- SERVQUA 68
4.7 Communalities- SERVQUAL 69
4.8 Rotated Component Matrix- SERVQUAL 70
4.9 Reliability Statistics for new scale 71
4.10 Determinants of service quality in the retailing clothing industry 71
4.11 New Determinants of service quality 72
4.12 Variables used in Regression 73
4.13 Overall fit of the model 73
4.14 ANOVA 74
4.15 Coefficients for services 75

v | P a g e
4.16 Predictors of service quality in order of importance 76
4.17 Garvin’s Garments Quality- Descriptive Statistics 77
4.18 Reliability Statistics- Garvin’s dimensions 78
4.19 Reliability Data Analysis for Garments quality 78
4.20 Summary items statistics for Garments Quality 79
4.21 Reliability Statistics- Garvin’s model 79
4.22 Communalities- Garvin’s model 80
4.23 Rotated Component Matrix 80
4.24 Reliability Statistics for new scale 81
4.25 Determinants of garments quality in the retailing clothing industry 81
4.26 New Determinants of garments quality 82
4.27 Variables used in Regression 83
4.28 Overall fit of the model 83
4.29 ANOVA 84
4.30 Coefficients for garments 84
4.31 Predictors of garments quality in order of importance 85
4.32 Descriptive Statistics- Overall Customer satisfaction 86
4.33 T-Test- Gender 86
4.34 T-Test-Nationality 87

1 | P a g e
1. Introduction
1. 1 Introduction
This chapter presents the reader with an overview of the entire thesis. It covers the
Background to the Study, Problem Statement, Structure and the Purpose of the Study,
Research Questions as well as the Overview of Retailing Industry in Ireland.
1.2 Background
Most companies today face a two-fold dilemma. In many product and services
categories, competition based on both price and quality is increasing. Customers, faced
with so many good choices, are making decisions based on a variety of complex factors
(The Economist, 2007).They are the most essential part for the existence of every firm
in the world of business and it seems quite obvious that firms can be no longer
indifferent to their customers' expectations and demands. Companies must direct all
their activities and powers towards the customer satisfaction, because the customers are
the only source for return on investment (ROI) (Nazari and Divkolaei, 2012).
Billington &Nie (2009) argue that a successful company typically starts with a deep
understanding of customer needs is a segment and translates these needs into a value
proposition. Then it develops its supply chain capability to deliver on its value
proposition. The authors further debate that in a retail business; a customer wants the
right product, at the right time, in the right place, and at the lowest price.

2 | P a g e
To translate these needs into supply chain capabilities, mass retailers need to consider
the product variety, the type of brand, and the cost of goods sold (Billington &Nie,
2009).To know more about their costumers, to tailor their offering more specifically,
learning the customers become an essential marketing tool in attracting and retaining
customers. The companies are looking to entice their consumer to buy by offering more
benefits rather than the basic product. Therefore the idea of associating service and
product quality with customer satisfaction has been growing in its importance.
The phenomenon of customer satisfaction has been recognised as a significant factor in
the management processes and it has been extensively studied for the past few decades.
The subject of this study is based on ZARA Plc., and the justification for choosing this
company is that it gained a special attention when arrived to Ireland, and the
researcher’s first employment was as a sales assistant in one of ZARA’s boutiques in
Dublin. Moreover, the company, as explained later in this section, is one of the most
fascinating clothing retailers with its vertical integration. Unlike other apparel retailers,
ZARA manages most of the steps on the supply-chain (Capell, 2008).
ZARA entered Polish market in 1999 (Lopez et al., 2009), however few years ago when
the researcher still lived in the home country, ZARA had its shops only in the few, main
cities and the clothes were not affordable for the ‘average citizen’ taking into account
the middle class incomes. Whereas the Polish capital is marked by a strong luxury to
mid-range segment, however the share of this segment becomes lower and lower as the
relative importance and purchasing power of a city decrease.
While ZARA was the part of the high price segment in Poland, and was perceived as a
luxurious brand at the time, it was considered mid-range and accessible to the general
population in Ireland.

3 | P a g e
Fashion has a short life, especially at ZARA that has revolutionized the fashion industry
with its less than two weeks turnaround. On average that is the time that ZARA need to
spot, design, and ship one of the 300,000 new stock keeping units (SKUs) it sells in
stores each year (Crofton & Dopico, 2007). Thus, it routinely beats the high- fashion
houses to market with nearly identical products that are made with less expensive fabric
at much lower prices (Ferdows et al. 2004). This is undoubtedly merit of ZARA’s
creativity in supply-chain design. ZARA’s vertical integration of design, just-in-time
manufacturing, delivery and sales; flexible structure; low inventory rule; quick response
policy and advanced information technology enable a quick response to customer’s
changing demands (Johnson et al., 2011).A completely new piece of clothing can be
delivered in less than four weeks and that is much faster than the competition. It was
estimated that about 11, 000 items are launched every year (Hemantha, 2012).
Additionally, rather than chase economies of scale, ZARA manufactures and distributes
products in small batches twice a week avoiding large inventories and creating a
"climate of scarcity and opportunity" (Fedrows et al., 2004).ZARA manufactures 60%
of its own products, and by owing its in-house production is able to be flexible in the
variety, amount and frequency of the new styles they produce. The customers no longer
have to wait for the February’s Fashion Week, to get a glimpse at what will be available
in July from high-street designers like Marc Jacobs, Ralp Lauren or Dolce and Gabana
(Capell, 2008). This is another factor that makes the brand attractive for conducting the
study; owing to the fact that 85% of ZARA production is done through the season
allows the chain to provide its costumer continuously with the newest trends
(Hemantha, 2012).

4 | P a g e
In Ireland ZARA is considered as one of the most popular clothing brands with a very
fresh view on fashion and selling methods than other companies within its industry and
it is offering an original shopping experience to its customers.
ZARA’s production cycle starts with customers' judgements on the new designs of
clothes and the information collected by staff members who travel to fashion cities,
observing people on the streets (Hemantha, 2012).
Additional factor that makes ZARA an interesting subject for this research is that with
the time factor and the store as a source of information, the company demonstrate high
customer- orientation. ZARA tries to adapt to market demands, aims to deliver a unique
service to the customer. The quality of customer service and other variables like the
music, temperature, and layout are evaluated by using mystery shopper. When it comes
to pricing, ZARA also follows a market- based pricing strategy which sets the target
prices that the buyers are willing to pay (Hemantha, 2012). Inditex has conquered the
world by putting the customer at the centre of the story, and this customer centred
approach is making the brand even more interesting to investigate how the customers’
perceive ZARA’s quality and to which extent they are satisfied with quality of the
service and products. Therefore it came to the researcher attention and raised an interest
in finding out how other shoppers are satisfied with the company and what determines
such satisfaction.
The general purpose of this study is to rank the quality factors perceived to be most
important in relation to the use of ZARA services and products in Ireland. To measure
customers’ satisfaction quantitative research will be taken with the questionnaire based
on the SERVQUAL which is the instrument that identifies five broad quality
dimensions in service environments (Parasuraman et al. 1988).

5 | P a g e
Satisfaction with the product quality will be then evaluated with the help of eight
dimensions of product quality proposed by Garvin in 1984. These critical categories of
quality can serve as a framework for strategic analysis: performance, features,
reliability, conformance, durability, serviceability, aesthetics, and perceived quality. A
product can rank high on one dimension of quality and low on another, additionally any
improvement one may be achieved only at the expense of another. According to Garvin
(1987) this interplay makes strategic quality management possible; the challenge to
managers is to compete on selected dimensions.
1.3 Problem Statement, Structure and the Purpose of the Study
As indicated in the previous sections, ZARA has been very successful for the last
decades. However, the fashion industry is highly dynamic and competitive and raises
several challenges related to the company’s interest of expanding further into a
worldwide company. The companies must understand the importance of customer
satisfaction as well as service and product quality concepts if they want to remain
competitive and grow. In today’s competitive environment delivering high quality
products and service are the keys to a sustainable competitive advantage. Customer
satisfaction does have a positive effect on an organization’s profitability. Satisfied
customers form the foundation of any successful business as customer satisfaction leads
to repeat purchase, brand loyalty, and positive word of mouth (WOM) (Angelova and
Zekiri, 2011).

6 | P a g e
This led to the following problem statement:
Which dimensions of service and product quality generate highest level of customer
satisfaction in Zara?
In order to provide an eloquent answer to the problem statement a carefully considered
thesis structure needs to be introduced.
Figure 1.1: Master thesis structure
Source: Own creation
As illustrated in Figure 1.1 above, the thesis is divided into six chapters. In the Chapter
One the motivation for taking this study is briefly justified.
Chapter 1• Introduction
Chapter 2• Literature Review
Chapter 3• Methodology
Chapter 4 • Data Analysis: Discussions
Chapter 5• Conclusions & Recommendations
Chapter 6• Reflections on Learning

7 | P a g e
The concept of business within fashion industry is explained with some focus on the
competitive side within the industry and competitive advantage gained through
excellent service and product quality. In order to understand the clothing industry in
Ireland the Retailing Industry section with the special consideration of retail sales in
Ireland were presented.
Additionally, the company overview is included in the Introduction Chapter which
describes ZARA historical background, business plan, main criticisms; future
challenges as well as evaluates the company’s financial performance with the special
emphasis on the last two years. This will help to gain a better understanding of ZARA,
its expansion, and how the company has developed over time and responded to changes
in the market.
Chapter Two discusses available academic literature with the special consideration of
customer satisfaction concepts (dependent variable) and factors such as service quality
and product quality (independent variables). The essence of those variables is presented
in details, the circumstances that give rise to satisfaction, and the benefits to the
company of having satisfied customers. Concepts and Theoretical Frameworks:
customer, customer satisfaction and its significance, service and service quality and its
dimensions, product quality and its dimensions are presented in this chapter.
The subject of this study is shown with the special consideration, the general
background and methods of operations of this company are presented with some stress
on the competitiveness level in the markets it operates in. In this chapter the framework
of this study is presented with justification to why this framework is most suitable to the
purpose of this research. In addition, research theories, objectives, and scope of the
study are specified.

8 | P a g e
Chapter Three focuses on the methodology which has been chosen for this study. The
layers of the research process are described with the help of research onion which was
introduced by Saunders, Lewis and Thornhill (2009). The outer layers of the onion
contain thinking about research philosophies and approaches. The central layers reflect
the need to consider research strategies and choices; while at the centre of the onion
data collection and analysis are the central concern (Saunders et al., 2009).
Moreover, this chapter discusses how satisfaction and factors are to be researched in
order to gain an answer to issues formulates for this research.
Chapter Four is presentation of data and analysis of results, and conclusions with
further recommendations for management as well as limitations and recommendations
for further research that are presented in Chapter Five. Finally, Chapter Six consists
the reflections on learning and lessons learned.
1.4 Objectives of the Study
Based on the literature reviewed, the following are the specific objectives of this study:
1. To apply, rank and describe the impact of SERVQUAL factors on customer satisfaction
in ZARA Ireland.
2. To apply, rank and describe the quality dimensions of ZARA products in Ireland and
their impact on customer satisfaction using Garvin eight dimensions of Product Quality.
3. To measure and describe the overall customer satisfaction with ZARA services and
products in Ireland.

9 | P a g e
By answering the above questions it is aimed to contribute to the study of the
relationships between customer satisfaction and service quality and customer
satisfaction and product quality. Therefore by conducting this research it will be
possible for the author to confirm if and to which degree customer satisfaction is related
to the service and product quality dimensions for ZARA Plc.
1.5 Purpose of the study
The purpose of this study is to examine the relationships between customer satisfaction
and both service quality and product quality in the clothing retailing industry in Ireland.
To fulfil the gaps and to provide valuable information to ZARA management about the
customer perception of brand quality and both: products and service, this research will
help to identify the factors that influence the customers’ repurchase intention.
Additionally, the results can provide a great help to the producer as to which actions
need to be taken to put the company in a better competitive position, and help with
sustaining competitive advantage in the mid-range clothing sector in Ireland.
This exploratory study is unique in terms of assessing both quality of service and
product in apparel industry in Ireland, and to date, as far as the research concerned, no
similar study has been carried out.
In developing the retail service quality scale, the general SERVQUAL model introduced
by Parasuraman et al. (1988), has been adopted. The SERVQUAL scale is one of the
first measures to be developed specifically to measure service quality, and therefore
since its introduction, it has been tested and applied in diverse service settings including
apparel retailing (Gagliano and Hathcote, 1994).

10 | P a g e
The SERVQUAL scale has been chosen for this research over the Retail Service
Quality Scale (RSQS) as the applicability of the RSQS scale has not been tested in
apparel speciality stores in Irish context. Moreover, taking into account the time
constraint to this research the use of SERVQUAL scale is recognized by the author as
the safest approach. From the quality of the product this study intends to justify of how
eight dimensions of product quality affect customer satisfaction to product. Garvin
Eight Dimensions of Product Quality scale (1984) has been used to assess product
quality as it covers a broad range of concepts and shows the product dimensions from
basic to additional but equally important.
1.6 Retailing Industry
1.6.1 Retail Sales in Ireland
The retail sector is Ireland’s largest employer with over 14.5 per cent of Ireland’s total
workforce, and accounts for over 10 per cent of Ireland’s GDP.
In the recent years sales have fallen sharply, declining by 30 per cent since their peak in
2008.
The Irish Retail Industry Performance Review (Retail Excellence Ireland, 2012) shows
the worst performing sectors included garden centres, down 19.9 per cent compared to
the same quarter last year, furniture and flooring, down 9.5 per cent and ladies' fashion,
down 7 per cent. The biggest challenge to recovery in the retail sector is weak domestic
demand. Consumer spending has fallen every year since 2008 and Irish Business and
Employers’ Confederation (IBEC) predicts that it will fall by a further 2 per cent this
year (IBEC, no date).

11 | P a g e
1.6.2 ZARA (Inditex)
ZARA is a Spanish clothing and accessories retailer based in Galicia, and was founded
in 1975 (ZARA.com). The company was expanding in the domestic market during the
1980s by opening stores is all Spanish cities with a population greater than 100, 000
inhabitants (Ghemawat and Nueno, 2003).Internationally, ZARA started its expansion
by opening the first store in the city Oporto in Portugal in 1988.
ZARA is the flagship chain store of the Inditex group; the fashion group expanded over
the last 30 years and has built a brand portfolio mainly through brand acquisition. Each
chain of the stores in Inditex group is targeted at a specific segment: Massimo Dutti –
young businessmen; Pull & Bear – elegant male clothing; Bershka – elegant fashion for
young women; Brettos – trendy young suburban women; Oysho – lingerie; Stradivarius
– youthful fashion; Kiddy’s Class – trendy children (Kumar, 2006).By 2012, ZARA
made up close to 70 per cent of Inditex sales and led the group’s international
expansion.
Figure 1.2 Inditex-Sales by brand
Source: Inditex, FY2012 Results Presentation, 13 March 2013
66%7%
7%
9%
6%
2% 2% 1%
Sales by brand
ZARA
Pull and Bear
Massimo Dutti
Bershka
Stradivaldius
Oysho
Zara Home
Uterqüe

12 | P a g e
Only in 2012- 482 new stores have been opened, making for a total worldwide of 6,009
(rte, 2013). The group’s strongest brand- ZARA is one of the world’s most successful
fashion retailers operating in 89 countries and with 1,751 stores (9 of which are based in
Ireland) (Inditex, 2011).
According to Amancio Ortega, founder of Inditex, ZARA’s aim is to democratize
fashion by offering the latest fashion in medium quality at affordable prices.The
company estimates that customers visit store 17 times a year on average, compared to
merely four visits for other fashion firms (Hemantha, 2012).According to Inditex
Annual Report (2011) for Inditex business model customers are at the heart of any
activity (Appendix M).
ZARA outlets are situated in main commercial areas and the interiors are designed to
create a unique atmosphere with attractive window displays. The firm spends only 0.3%
percent of its annual turnover on advertising, normally at the beginning of the sales
season or the occasion of a new store opening.
The store is considered its most effective communication tool (Ghemawatet al.,
2003).The fashion designer- Louis Vuitton, described ZARA as ‘possibly the most
innovative and devastating retailer in the world (Hume, 2011).
1.6.3 Global Sales
Inditex, the Spanish clothes retailer which owns ZARA store chain, has noted a 22per
cent increase in net profit in 2012. This increase was mainly as a result of growth in
Eastern Europe and in online sales in Canada and China (rte, 2013).

13 | P a g e
According to Inditex reports, the profit for last year grew to €2.36 billion and sales were
up by 16 per cent to €15.9 billion, with Asia share growing to 20 per cent from 18 per
cent and the Americas expanding to 14 per cent from 12 per cent as per below diagrams.
Figures 1.3 & 1.4: Global Sales Platform- years 2011 & 2012
* Store sales: Includes sales in OMS and franchises
Source: Inditex, FY2012 Results Presentation, 13 March 2013
1.6.4 Challenges to overcome for ZARA
According to experts in the clothing industry "Low price plus expanding too fast will
definitely lead to the decline in quality of a company's products. The company will have
to reduce the cost of materials and human resources as market costs increase" (Global
Times, 2011). Too fast expansion in China led ZARA, into quality scandals that
occurred several times since August 2009. The Beijing Consumers’ Association has
called ZARA out for ignoring the “rights and interests of domestic consumers” and is
among 20 well-known brands that were declared substandard after a recent round of
quality tests by the watchdog group.
45%
21%
20%
14%
Global Sales Platform- FY2012
Europe ex-
Spain
Spain
Asia & RoW
Americas
45%
25%
18%12%
Global Sales Platform- FY2011
Europe ex-
Spain
Spain
Asia & RoW
Americas

14 | P a g e
Clothes sold by ZARA flunked three categories, more than any other brand examined.
In addition to floundering in color-fastness tests, the trousers also exceeded legal limits
of formaldehyde and alkalinity, both of which can irritate skin (Chua, 2011). In the
short term, these scandals are not likely to affect ZARA sales. Consumers would rather
care for the style of some clothes than their quality. He added that the quality is a factor
that can ensure the purchase instead of one that can stimulate purchasing behaviour
(Global Times, 2011).
1.6.5 Future challenges
Most importantly Inditex plans to continue its aggressive expansion in particular into
the Russian market, where it has been opening 50-60 new shops annually over the last
few years, and would like to maintain this place. Only by September 2012, Inditex had
expanded its network in Russia to 274 stores, including 58 ZARA shops and in 2013 the
company is planning to open a ZARA shop in Vladivostok, which is a milestone for the
company (Kreknina, 2012). Inditex plan to grow in the Americas by multi-concept
expansion: Massimo Dutti in US/ Canada, Stradivarius in Mexico and ZARA Home in
Brazil. Furthermore, there are the plans to expand its online sales: US for ZARA,
Massimo Dutti and ZARA Home/ Canada for ZARA as well as ZARA in Russia
(GrupoInditex press Annual, 2012).
Additionally, the group is planning to further enhance the customer in-store experience,
by creating larger, new stores and stronger visual merchandising.

15 | P a g e
2. Literature Review
2.1 Introduction
The literature review chapter will explore the theoretical side of the relationship
between both service and product quality and satisfaction. The first part will look at the
definition of the satisfaction and past researches that explored the major antecedents. It
will be also briefly presented the correlation between satisfaction and loyalty which then
may lead to profitability. Final part focuses on the aspect of the service and its
difference to product. In this part the framework for this research will be presented and
the antecedents explained with a main focus on both service quality and product quality,
which will be explored through SERVQUAL and Garvin’s Eight Dimensions of quality,
respectively.
2.2 Customer Satisfaction
Customer satisfaction is the individual consumer’s perception of the performance of the
product or service in relation to his or her expectations (Schiffman &Kanuk, 2010;
Armstrong & Kotler, 2010). Oliver (2010) thinks that satisfaction is the customer’s
fulfilment response. It is a judgement that a product or service feature, or the product or
service itself, provides a pleasurable level of consumption-related fulfilment. Zeithaml
et al. (2009) argue that failure to meet customer needs is assumed to result in
dissatisfaction with the product of service.

16 | P a g e
In today’s competitive market where companies are becoming similar with its offerings
and range of products it is crucial that they provide a differentiation through the delivery
channel or product itself. Nevertheless to achieve the desired competitiveness
companies would try to over deliver to its promises and that will take place when total
product performance exceeds expectations of a given consumer which then may result
in high satisfaction. Hoyer and MacInnis (2001) noticed that satisfaction can be
associated with feelings of acceptance, happiness, relief, excitement, and delight.
Satisfied customers will repeat the purchase, probably be brand loyal, and convey
positive word-of-mouth advertising, and all these will enhance sales (Almossawi,
2012).Customer’s satisfaction may also be associated with feelings of ambivalence
when there is a mix of positive and negative experiences associated with the product or
service (Zeithaml et al., 2009).According to Schneider and Bowen (1999), most
customers range from moderately dissatisfied to moderately satisfied and it is most
likely that with additional factors, like: better price or more convenient store location
the customer will eventually defect. Customers’ satisfaction and experience need to be
continually enhanced, and even then it is often not enough to retain them because even
satisfied customers are not always loyal, and what more defect at a high rate.
Heskett et al. (2008) is of the opinion that the relationship between scores and loyalty
depend on whether customers are “very satisfied” or only “satisfied” with the product or
service. Customers being “very satisfied” are 5 times more likely to repurchase.
The figure 2.1divides the customers into three groups, subdivided into 3 different zones,
and the service provider must try to achieve zero or a minimum number of customer
defections, as this will lead to more profitability in the long run.
Review of individual customers’ behaviour available in Appendix A.

17 | P a g e
Figure 2.1 The relationship between customer satisfaction & customer loyalty
Source: Heskett, J, Jones, T, Loveman, G, Sasser, J, & Schlesinger, L (2008)
Satisfaction is a dynamic, moving target that may evolve over time, and may be
influenced by a variety of factors, and these will be further investigated in this research
with respect to well-known retailer- ZARA.
2.3 Satisfaction and Loyalty
Customer loyalty plays a critical role in an organization’s success, because only loyal
customers provide firms a consistent source of revenue (repeat and increased purchases)
and for cost reduction (less promotional expenses), thus increasing profitability (Li et
al., 2010).Studies indicate that at the customer level there are links such as customer
delight leading to customer loyalty (Oliver et al., 1997); trust and satisfaction are linked
to customer loyalty (Liu et al., 2011), and customer information characteristics are also
strongly linked to the creation of customer loyalty (Leenheer et al.,2008).
0%
10%
20%
30%
40%
50%
60%
70%
80%
90%
100%
1 extremly
dissatisfied
2 somewhat
dissatisfied
3 slightly
dissatisfied
4 satisfied 5 very
satisfied
Lo
ya
lty
(R
eten
tio
n)
Satisfaction Measure
zone of defection
zone of indifference
zone of affection
appostle

18 | P a g e
Jones et al. (1995) argue that merely satisfying customers who have the freedom to
make choices is not enough to keep them loyal. The only truly loyal customers are
totally satisfied customers. Previous research in contradiction to recent studies, have
found that the customer satisfaction and customers’ repeat purchase behaviour may not
always result in customers loyalty (Jacoby et al., 1973).
2.4Theoretical frameworks
Customer satisfaction has been of interest of marketing academics over the past three
decades. Marketing literature provides many different models that investigate customer
satisfaction. As all these models are important to marketing practitioners and there is no
one generic framework for customer satisfaction, these the most important for the scope
of this research models will be critically evaluated with special consideration to the
model which will be the frame for this study.
There are many factors that affect customer satisfaction. According to Hokanson (1995)
these factors include friendly employees, courteous employees, knowledgeable
employees, helpful employees, accuracy of billing, billing timeliness, competitive
pricing, service quality, good value, billing clarity and quick service. Hokanson (1995)
postulates that the use of this model expects heavy interaction between variables, and
would be inappropriate if the elements of customer satisfaction were discrete and
separable.
During the researches in the 90’s several factors have been identified that play a
significant role in building customer satisfaction. Taylor and Baker (1994), Rust and
Oliver (1994) explain in detail those antecedents.

19 | P a g e
The service quality has been identified as a critical factor influencing customer
satisfaction and thus consumers’ purchase intentions. Taylor & Baker (1994) in their
study investigated the nature of the relationship between service quality perceptions and
consumer judgments in the formation of consumers’ purchase intentions. Rust & Oliver
(1994) think that an understanding of these relationships is necessary to effective
management.
Better understanding of how the perception of service quality and consumer satisfaction
judgments influence one another in the formation of consumers; purchase intentions is
crucial in services marketing discipline.
2.4.1Customer Perceptions of Quality and Customer Satisfaction Model -
Zeithaml et al. (2009)
Today’s big organizations try to better understand their customers, their needs,
expectations and whole decisions making processes; what make them buy this particular
product or choose that service over another?
Model introduced by Zeithaml et al. (2009) will be most appropriate to examine the
nature of this research since investigates in detail quality of service and product, and
how they affect customer satisfaction. Whereas four general antecedents based on work
of Taylor & Baker (1994) and Rust & Olivier (1994), are very broad and would require
more complex research. On the other hand, the satisfaction model proposed by
Hokanson (1995) is too detailed, and focuses largely on employees and their impact on
customer satisfaction rather than quality of service and product itself.

20 | P a g e
The following concept presented by Zeithlam et al. (2009, p.103) clearly shows that the
satisfaction is determined by the product or service specific features, customer
perception of service and its quality, product quality and price. Significant impacts on
the satisfaction have also personal factors (i.e. customer’s mood at the time of the
purchase) or situational factors like family or friends opinions about service or product.
Service quality is a focused evaluation that reflects the customer’s perception of the ten
dimensions.
For the purpose of this research eight determinants adopted from Parasuraman (1985)
will be further evaluated, and these dimensions will be then used as a base for the
questionnaire to measure level of customers’ satisfaction with ZARA services.
Figure 2.2 Customer Perceptions of Quality and Customer Satisfaction
Source: Zeithaml, Bitner and Gremler (2009)
Reliability
Responsiveness
Assurance
Empathy
Tangibles
Customer
Satisfaction
Service
Quality
Price
Product
Quality
Situational
Factors
Personal
Factors
Loyalty

21 | P a g e
The aim of this research is to explore the impact that the quality of service and product
may have on customers’ satisfaction. The researcher is not intending to concentrate on
the factors that stimulate customers’ decision making process or price, and therefore the
situational, personal factors as well as price will be excluded from the research
framework.
2.5 Quality
The word quality means different things to people according to the context. Quality is
an important strategic concept that can provide a company with lasting competitive
advantage in the market (Garvin, 1990). Koskennurmi-Sivonen & Pietarila (2009) argue
that quality, as a concept, is multidimensional and relative, and thus, difficult to
perceive. However, there is nothing fundamentally unclear or mystic about quality if we
keep in mind that quality can be seen from different viewpoints and if we understand its
relativity.
Quality not only plays a significant role in determining and influencing customer
satisfaction (Abdullah et al., 2010), but is perhaps the most important and complex
component of business strategy. Firms compete on quality, customers search for quality,
and marketers are transformed by quality (Golder et al., 2012).
Several studies have demonstrated that customer satisfaction and loyalty are dependent
on the customer’s perception of the quality of goods or services provided, and therefore
industries pursue quality in product and service in order to satisfy their customers (Gorst
et al., 1998).
During the last two decades, the set of quality management systems and standards, such
as QCC, ISO 9000, TQM, etc. have been implemented by different industries.

22 | P a g e
All of them were aiming to achieve customer satisfaction and to win their long-term
trust by creating products and supplying services that fulfil customer requirements
(Kano et al., 1996).
2.5.1 Approaches to defining quality
Brown et al. (2001) argue that quality is not a one-dimensional concept, and it is very
natural for managers to understand quality in different ways: managers perceive quality
in the context of their own work environment.
Garvin (1988) presented five different approaches to understanding quality as follows:
transcendent, product based, user based, manufacturing based and value based
(reviewed in Appendix L). According to Garvin (1984) most existing definitions of
quality fall into one of these five categories. Fiore et al. (1992) argue that the quality of
an apparel product can be approached either a manufacturing-based perspective or a
consumer- based perspective. In Manufacturing-based approach quality is based upon
conformance to manufacturing specifications pre-determined by managers or product
developers (Crosby, 1979).In a consumer-based approach to quality is more subjective
and more difficult to verify (Zeithaml, 1988). As the effect, the customers and
manufacturers (product developers) may define quality differently, and the established
product may not fully satisfy the customer ‘quality’ expectations (Fiore et al., 1992).
Managers need to show that quality has a substantial impact on the bottom line of the
company, and by improving quality must enable the company to enhance key measures
of performance such as productivity, cost reduction, profitability, and market share
(Brown et al., 2001).

23 | P a g e
2.5.2 Service Quality vs. Product Quality
Zeithaml et al. (2009) debate that there is general agreement that differences between
goods and services exist and that the distinctive characteristics result in challenges for
managers of services. Service quality is defined as the comparison customers make
between their expectations about a service and their perceptions of the actual service
performance (Parasuraman et al., 1988, 1985). Service quality is much more difficult to
evaluate than the quality of goods with the purchase of which, the consumer employs
the tangible cues like: colour, label, style, packaging, and fit. When purchasing services
tangible elements are limited to the provider’s equipment, personnel and facilities
(Parasuraman et al., 1985). Pre-purchase evaluation of service characteristics by
consumers is differing from products because of their intangibility, heterogeneity,
inseparability, perishability (Appendix B). The service characteristics have created
problems of definition and measurement of service quality for marketers (Bebko, 2000).
Intangibility
It is the most basic distinguishing characteristic of services, as services are
performances or actions rather than objects, they cannot be seen, felt, tasted or touched
in the same manner tangible goods can (Zeithaml et al., 2009).Miller & Foust (2003)
argue that this perception presents services marketers with special problems especially
in positioning and promoting their brands.
The marketers can overcome the problem of intangibility, but they need to develop and
employ strategies for overcoming consumers’ perceived intangibility of their offerings
in order to produce better consumer understanding and alleviate their perceived risk.
Shostack (1977) criticized intangibility because there are usually many tangible
elements involved in a service performance.

24 | P a g e
She recommended the set of strategies that were helpful with associating the service
with tangible cues or symbols as a means for overcoming the intangible elements in
positioning and promotion. The firm’s brand names, brand marks, and marketing
communications are tangible elements that convey information about both the offerings
attributes and benefits and help customer to associate intangible service with some
tangible elements.
Heterogeneity
Services are performances, produced by humans, and no two services will be exactly the
same. Heterogeneity also results because no two customers are precisely alike, each
customer will have different expectations and experience the service in very unique way
(Zeithaml et al., 2009). Heterogeneity is a problem with those services with high labour
content and is very challenging for every business service tasks. Heterogeneity has been
criticized in literature as not being characteristic of services because of the countless
possibilities of standardization in services which result in a reduction of heterogeneity
(Lovelock and Gummesson, 2004).
Inseparability
The concept of inseparability was introduced by Say in 1836. From that time the
production and consumption were perceived as an inseparable part of the service
(Moeller, 2010).Whereas most goods are produced first, then sold and consumed, most
services are sold first and then produced and consumed simultaneously. Customers are
often present while the service is being produced and may even take a part in the
production process as co-producers of the service. During the service production,
customers will also interact with each other, and thus may affect each other’s
experiences (Zeithaml et al., 2009).

25 | P a g e
The attribute of inseparability was criticized by Lovelock and Gummesson (2004). They
concluded that there are far too many separable services to justify the generalization that
inseparability is a distinctive characteristic of services.
Perishability
The attributes of perishability have been noted a long time ago, as mentioned by Adam
Smith in 1776 (Moeller, 2010).This quality refers to the fact that services cannot be
saved, stored, resold, or returned. Perishability is in contrast to goods that can be stored
in inventory, resold another day or returned if the customer is not satisfied (Zeithaml, et
al., 2009).
Perishability or the restricted option to stockpile or inventory services have also been
criticized. Edvardsson et al. (2005) relate the criticism of the restricted possibilities of
storage of services to the fact that memories of service provision can be kept for years.
Lovelock (2000) claims that time-defined perishability of performance should be
differentiated from continued benefits.
2.6 Service Quality- characteristic
Service quality is defined as the extent to which a service meets customers’ needs or
expectations (Lewis & Mitchell, 1990; Wisniewski & Donnelly, 1996). Perceived
service quality is subjective. It is the customers who evaluate service quality and it
therefore has to be researched from their point of view (Zeithaml, Bitner and Gremler,
2013).
Efforts in defining and measuring quality have come largely from the goods sector.
According to the pre-vailing Japanese philosophy, quality is "zero de-fects-doing it right
the first time.

26 | P a g e
"Edvardsen et al. (1994) argue that the starting point in developing quality in services is
analysis and measurement. Measurement allows for comparison before and after
changes and for the establishment of clear standards for service delivery.
Knowledge about goods quality, however, is in-sufficient to understand service quality.
According to Crosby (1979) quality can be defined as "conformance to requirements."
Garvin (1983) measures quality by counting the in-cidence of "internal" failures (those
observed before a product leaves the factory) and "external" failures (those incurred in
the field after a unit has been in-stalled).
Service quality is a critical element of customer perceptions, especially in the case of
pure services (for example health care, financial services), where it is the dominant
element in customers’ evaluations. Customer service or services can be also offered in
combination with a physical product (for example retail) (Zeithaml et al., 2013).
The SERVQUAL approach (reviewed in the next section) is the most common method
for measuring service quality. According to Parasuraman et al. (1985, 1988) the
attributes of customer service can be grouped into ten categories–drivers, as perceived
by service provider and the consumer namely; access, communication, competence,
courtesy, credibility, reliability, responsiveness, security, tangibles, and understanding
the customer and these formulate a service quality framework, SERVQUAL (Appendix
C). Identified ten dimensions associated with service quality from which eight were
used for this research are briefly discussed below. Full review of determinants of service
quality is available in Appendix C.
1. Reliability is defined as the ability to perform the promised service dependably and
accurately, that means that the company delivers on its promises about delivery,
problem resolution and pricing.

27 | P a g e
This dimension is extremely important for customers and they want to do business with
companies that keep their promises (Zeithaml, Bitner & Gremler, 2013).
2. Responsiveness is the willingness to help customers and to provide prompt service.
This dimension is communicated to customers by the length of time they have to wait
for assistance, answers to questions, or attention to problems (Zeithaml et al., 2013).
3. Courtesy is described as politeness, consideration, and friendliness of service
personnel (Kasper et al., 2006).
4. Communication involves keeping customers informed and listening to customers. It
also involves explaining the costs associated with service, explaining the service
process, and assuring the customer that a problem will be handled (Kasper et al., 2006).
5. Credibility refers to believability and honesty (Kasper et al., 2006). It involves
having customer’s best interest at heart. Contributing to credibility is a company
reputation, characteristics of the contact personnel (Parasuraman et al., 1985).
6. Security is described by Kasper et al. (2006) as’ freedom from danger’, risk, or
doubt. It also involves physical safety, financial security and confidentiality.
7. Understanding/ knowing the customer means making the effort to understand the
customer’s needs. Customers want to feel understood, unique and special to
organization (Zeithaml et al., 1996).

28 | P a g e
8. Tangibles are defined as the appearance of physical facilities, equipment, personnel,
and communication materials. Tangibles provide physical representation of images of
the service that customers will use to evaluate quality (Zeithaml et al., 2013).
The determinants of SERVQUAL represent how consumers organize information about
service quality in their minds (Zeithaml et al., 2013). The determinants range from easy
to evaluate (offering high in search properties) to difficult to evaluate (high in credence
properties). Most of the ten determinants, except tangibles and credibility, can only be
known as the customer is purchasing or consuming the service. Parasuraman et al.
(1985) argue that two of the determinants fall into the category of credence properties,
those which consumers cannot evaluate even after purchase and consumption. These
include competence and security and costumers are never certain of these attributes,
even after consumption of the service. On the basis of these dimensions it has been
shown how consumers organize information about service quality.
2.6.1 SERVQUAL- the model & critique
Measures of service quality have been developed during the years by many different
researchers. One of the most popular and general scales is SERVQUAL, other created
to measure specifically service quality in retail companies is RSQS (Retail Service
Quality Scale). RSQS model was introduced in 1996 by Dabholkar et al. and consists of
28questions; 17 of which come from SERVQUAL and has five dimensions: physical
aspects, reliability, personal interaction, problem solving and policy (Dabholkar, 1996).

29 | P a g e
Some researchers (Eysteinsson &Bjornsdottir, 2011; Bhaskar &Shekhar, 2011; Gaur &
Agrawal, 2006) argue that because RSQS has been designed in the United States it can
therefore be difficult to capture all the dimensions when doing service quality research
in retail companies in countries where the culture is different from the United States.
Another model, SERVQUAL is one of the most popular instruments designed to
measure both expectations and perceptions of service quality at the same time is the one
introduced by Parasuraman et al. in 1986. SERVQUAL is a 22-item scale introduced by
Parasuraman et al. in 1985 which examines the gap between customers’ expectations of
a service quality and their perceptions of the service received (Parasuraman et al.,1988).
Respondents are asked to provide the level of service expected from a service firm on a
set of 22 expectations items. Agreement with each item is assessed using a seven-point
scale from strongly agree to strongly disagree, without providing any verbal
descriptions (Brown et al., 1993). Afterwards respondents provide their evaluations of
the actual level of service provided by a specific firm on a corresponding set of 22
perceptions items. Customers’ perceptions of service performance are met or exceed if
the quality of the service is good.
Despite the fact that the SERVQUAL has been used commonly for different studies,
many researchers criticised the scale for a number of different reasons. According to
Carman (1990) the method is not generic and it needs to be customised to the service in
question in spite of the fact it was originally designed to provide a generic measure that
could be applied to any service. This can be done by adding items or changing the
wording of items. Carman´s (1990) and Vázques et al. (2001) find SERVQUAL
measurement model not suited to measure service quality in neither discount stores nor
specialty stores selling clothes because it concentrates only on service quality, and
therefore the customer satisfaction with products cannot be assessed.

30 | P a g e
The length of the survey is very often criticised as well (Gagliano and Hathcote,
1994).Finn and Lamb’s (1991) argue that retailers and consumer researchers should not
treat SERVQUAL as an ‘of the shelf’ measure of perceived service quality. They are of
the opinion that much more details and subtleties are needed for specific companies and
industries.
The services of retail companies are different from the services of other companies
because they sell both services and goods (Finn and Lamb, 1991). The customer
experiences differ as well. Because customers have to move along the store, find the
goods to buy interact with the staff, not always the same individuals, and sometimes
return goods they will perceive the service received in different way (Eysteinsson and
Bjornsdottir, 2011).
Parasuraman et al. (1988) modified later the SERVQUAL and ten dimensions have
been consolidated into five domains of service quality: reliability, responsiveness,
assurance, empathy, tangibles recognized as RATER (Burns 2003, p.4). These were
reported the most important dimensions of any service organization (Parasuraman et al.,
1988). Finn & Lam (1991), in a study of retailing, concluded that their results did not
support the belief that the RATER instrument could be used to assess quality in a wide
range of service firms. They found that the model’s five determinants of service quality
were insufficient to cover quality in a retailing setting.
ZARA is the Spanish retailer and because there was not enough research conducted to
examine the Retail Service Quality Scale (RSQS) applicability to European retail and
Irish market, and taking into account the time constraint to this research it is preferable
to concentrate on the scale that was found valid across different industries-
SERVQUAL.

31 | P a g e
Therefore, in order to conduct this study and evaluate customer satisfaction with service
quality the initial framework of Parasuraman et al. (1985) will be used with the
exception of competence and access determinants. The researcher was concerned that it
would be difficult for the respondent to answer the questions relating to competences
namely the possession of the required skills and knowledge to perform the service.
Similarly, access determinant has been excluded from this research as the researcher felt
that the questions were included while evaluating responsiveness determinant.
2.7 Product Quality
In the PDMA Handbook of New Product Development, the glossary contains the
following definition for product: A term used to describe all goods, services, and
knowledge sold.
A product is not always just a single product; there is usually a hierarchy of products
and services within a firm. A product may be a part of other products or products lines,
packaged with a group of products, or included in a product portfolio (Haines, 2009
p.3).
2.7.1 Dimensions of product quality
Garvin (1984, 1987) proposed eight critical dimensions or categories that be identified
as a framework for thinking about the basic elements of product quality: performance,
features, reliability, conformance, durability, serviceability, aesthetics, and perceived
quality (Figure 2.3).

32 | P a g e
Each of these dimensions is self-contained and distinct, for a product can be ranked high
on one dimension while being low on another; also an improvement in one may be
achieved only at the expense of another (Garvin, 1987). Garvin (1984) suggested that by
influencing or varying any one or more of these eight dimensions of quality, a company
can position itself in the market place, so quality is then a strategic variable. However, it
is important to pursue only those dimensions of quality that are unimportant to
consumers (Mehta, 1998).
Figure 2.3 Eight Dimensions of Product Quality
Source: Garvin (1984)
Despite the existence of many researches that were measuring how consumers evaluate
clothing, quality continues to be an elusive question. Hines et al. (2001) noted that
previous clothing studies suggested that consumers use a variety of informational cues
to judge clothing quality including concrete characteristics of the product such as fibre
content and price (intrinsic and extrinsic cues).
8 Dimensions of Quality
1. Performance
2. Features
3. Reliability
4. Conforman
ce
5. Duraibility
6. Serviceabili
ty
7. Aesthetics
8. Perceived Quality

33 | P a g e
Abstract features that are ascribed to the product by the user such as beauty and
durability (aesthetic and performance cues) seem to be equally important. These studies
however have been inconsistent, suggesting there are underlying factors that influence
why some consumers find some informational cues salient when evaluating quality
while other consumers do not. Determining these factors for evaluating clothing quality
is essential to better understand consumers’ perception of quality. Therefore, for the
purpose of this research, quality dimensions applicable to the clothing industry will be
evaluated.
1. Performance
Performance refers to a product’s primary operating characteristics and combines
elements of both the product and user-based approaches. Because this dimension of
quality involves measurable attributes, brands can usually be ranked objectively on
individual aspects of performance (Garvin 1984, 1987).
The connection between performance and quality is more ambiguous, and whether
performance differences are perceived as quality differences depends on individual
preferences. Consumers have a wide range of interests and needs, and each of them is
likely to equate quality with high performance in his or her area of immediate interest
(Garvin, 1984).
For clothing items, performance would mean shrinkage in laundering or dry cleaning,
colourfastness, abrasion resistance, strength, etc. (Mehta et al., 1998).
Consumers organize information at various levels of abstractions ranging from simple
product attributes to complex personal values. When it comes to performance,
dimensions the product has to fulfil functional and practical benefits of the customer
(Zeithaml, 1988).

34 | P a g e
2. Features
Features are the ‘’bells and whistles’’ of product, those characteristics that are part of
the physical product, and supplement their basic functioning.
These cannot be changed without also changing the physical product itself. The line
separating primary performance characteristics from secondary features is often difficult
to draw (Garvin, 1987). Features, like product performance, involve objective and
measurable attributes; their translation into quality differences is equally affected by
individual preferences (Garvin, 1984).
Mehta et al. (1998) argue that for clothing items, features will include some functional
fabric finishes, such as, durable press, stain/soil release, and odor resistance.
3. Reliability
Reliability is the third dimension of quality which reflects the probability of a product
malfunctioning or failing within specific period of time (Garvin, 1987). Garvin (1984,
1987) argues that among the most common measures of reliability are the mean time to
first failure, the mean time between failures, and the failure rate per unit time. He
continues that because these measures require product to be in use for as specific period,
they are more relevant to durable goods than to products and services that are consumed
instantly.
In the case of clothing, reliability is equally important for short and long term use.
This dimension of quality would mean how well an item would withstand effects of
daily wear and refurbishing (Mehta, 1998).Whenever clothes are made for one use only,
it is all the more probable that the occasion is extremely important, such as a wedding
(Koskennurmi-Sivonen et al., 2009).

35 | P a g e
4. Conformance
Conformance is a related dimension of quality and the degree to which a product’s
design and operating characteristics meet established standards. This dimension owes
the most to the traditional approaches to quality pioneered by experts like Juran
(Garvin, 1977). As per Garvin (1984) within the factory, conformance is commonly
measured by the incidence of defects: the proportion of all units that fail to meet
specifications, and so require rework or repair. In the field, data on conformance are
difficult to obtain, and proxies are frequently used.
Conformance is also akin to reliability but in a different sense. It refers to the degree to
which a product’s design and operating characteristics meet pre-established standards
and industry specifications. Dispersion within certain limits is ignored (Garvin, 1988).
Reliability and conformance are closely tied to the manufacturing-based approach to
quality.
For clothing items, conformance can mean how well an item meets design
specifications such as sizing and construction features (Mehta, 1998). Koskennurmi-
Sivonen et al. (2009) discuss that in small dressmaking businesses, standards can be
understood only metaphorically, yet conformance may be expected when products are
compared to other clothes from the same maker and to reputation, which is a promise of
quality.
5. Durability
Garvin (1988) contends that durability is very similar to reliability but is not quite the
same. Durability, a measure of product life, has both economic and technical
dimensions. Technically, durability can be defined as the amount of use one gets from a
product before it deteriorates (Garvin, 1984).

36 | P a g e
When it comes to clothing items durability would mean how long a clothing item lasts
before it must be discarded (Mehta, 1998). Moreover, in terms of durability, it would be
appropriate to consider at least technical (material and structural) and stylistic durability
(Koskennurmi-Sivonen et al.,2009).
Garvin (1984) argues that durability is much easier to interpret when repair is
impossible, and becomes difficult when repair is likely. Then the concept takes on an
added dimension, for product life will vary with changing economic conditions.
Durability becomes the amount of use one gets from a product before it breaks down
and replacement is regarded as preferable to continued repair (Garvin, 1987).
6. Serviceability
Serviceability, or the speed, courtesy, competence, and ease of repair, is a sixth
dimension of quality. Garvin (1984, 1987) argues that the consumers are concerned not
only about a product breaking down but also about the time before service is restored,
the nature of dealings with service personnel, and the frequency with which service calls
or repairs fail to correct outstanding problems. According to Garvin (1984) while some
of these variables reflect differing personal standards of what constitutes acceptable,
others can be measured quite objectively. Responsiveness is measured by the mean time
to repair, while technical competence is reflected in the incidence of multiple service
calls required to correct a single problem (Garvin, 1984).
Mehta (1998) thinks that serviceability has a slightly different meaning for clothing
items. Serviceability of a clothing item generally means how well a clothing item will
perform in daily wear and refurbishing. Clothing is often made of delicate materials,
service demands special attention.

37 | P a g e
There should be a special attention placed to clothes care labels and guarantees.
7. Aesthetics
According to Garvin (1984, 1988) the last two dimensions of quality are the most
subjective and are closely related to the user-based approach to quality. Aesthetics- how
a product looks, feels, sounds, tastes, or smells- is a matter of personal judgement and a
reflection of individual preference. Nevertheless, there appear to be some patterns in
consumers’ rankings of products on the basis of taste (Garvin, 1987).
For clothing items, aesthetics means how well a clothing item looks or how attractive it
appears, which would be influenced by drape, size of the garment or how well it fits the
wearer (Mehta, 1998).Koskennurmi-Sivonen et al. (2009) are confident that aesthetics is
not always, and sometimes not even primarily, a matter of the user. A maker may be
highly ambitious regarding aesthetics and a client may seek her/his way to a certain
maker just because of his/her trustworthy aesthetic judgment. The companies have to
realize that it is impossible to please everyone.
8. Perceived Quality
Perceptions of quality can be as subjective as assessments of aesthetics. Some of these
quality characteristics are inherent, while others are ascribed to the products.
As some real quality characteristics are difficult or impossible to observe directly, other
cues become important for drawing inferences about quality (Koskennurmi-Sivonen et
al., 2009).In these circumstances, products will be evaluated less on their objective
characteristics than on their images, advertising, or brand names (Garvin, 1984).
Recently, market research has found that a product’s country of manufacture is viewed
by many consumers as an indication of its quality (Mehta, 1998).

38 | P a g e
Reputation is the primary and powerful stuff of perceived quality. The costumers
believe that the quality of products today is similar to the quality of products yesterday.
Mehta (1998) debates, that when it comes to clothing, generally speaking, clothing
made in Italy, Germany, or Japan is perceived to be higher or better quality clothing
than that made in some of the Asian countries.
2.7.2 Relationship between product quality and customers satisfaction
As per Tsiotsou (2005) perceived product quality is one of the most important construct
in the marketing. Marketing managers are interested in consumer purchase intentions in
order to forecast sale of existing and/or new products and services (Tsiotsou, 2005).
Purchase intentions data can assist managers in their decisions related to product
demand (new and existing products), market segmentation and promotional strategies
(Tsiotsou, 2006).
Bitner and Zeithaml (2003) argue that satisfaction is the customers’ evaluation of a
product or service in terms of whether that product or service has met their needs and
expectations. Moreover, some scholars have found a direct relationship between
perceived quality and purchase intentions (Carman, 1990; Parasuraman et al., 1996).
Perceived product quality seems to play an important role in both consumer satisfaction
and purchase intentions (Tsiotsou, 2006). External cues like: price, brand name and
objective quality information have been found to be related to perceived product quality
and consumers’ product evaluations (Rao and Monroe, 1989; Dodds, 2002) and can be
used to enhance consumers’ product quality. Perceived product quality could be used by
marketers as a segmentation criterion in order to identify homogeneous groups of
consumers, and could assist managers in positioning their products in the consumers’
perceptional map (Tsiotsou, 2005).

39 | P a g e
Figure 2.4 Purchase intentions initial model
Source: Tsiotsou (2006)
Managers have to understand the role of involvement, perceived product quality and
satisfaction in order to be able to predict purchase intentions and consequently purchase
behaviour.
According to Shaharudin et al. (2010), product quality helps the firm to deliver goods
that can fulfil the needs and wants of the customer. It will also guarantee for a
continuous demand if the value of the product exceed the expectation and satisfaction of
the customer. Didier (2003) thinks that quality denotes a product’s ability to satisfy a
customer’s requirements. On this wise, this definition focuses entirely on the customer
and how the customer thinks a product will fit that purpose. Product quality is one of the
marketer’s major positioning tools. Quality has a direct impact on product or service
performance; thus it is closely linked to customer value and satisfaction. Quality can be
defined in terms of creating customer value and satisfaction (Armstrong et al., 2010
p.142).
Involvement
Perceived
product
quality
Purchase
intentions
Overall
satisfaction
Values

40 | P a g e
2.8 What determines satisfaction? How needs shape customer
behaviour?
Zeithaml et al. (2009) argue that customer satisfaction is influenced by specific product
or service features, perceptions of product and service quality, as well as price.
In addition to product and service features and one’s own individual feelings and
beliefs, consumer satisfaction is often influenced by other people (i.e. satisfaction can
be influenced by the reactions and emotions of individual family members).
Modi et al. (2012) thinks that not only the demographic characters and the economic
circumstances of the individual need to be taken into account, but also the more
powerful influences of prejudices, feelings, attitudes, opinions and beliefs.
Several internal and external factors affecting individuals in their daily lives also
influence their purchase activities (Modi et al., 2012).
The universal model of hierarchy of needs formulated by Abraham Maslow identifies
five basic levels of human needs (psychological, safety and security, social, ego self-
actualization needs), which rank in order of importance from lower- level (biogenic)
needs to higher level (psychogenic) needs (Schiffman et al., 2010). The theory
postulates that individuals seek to satisfy lower-level needs before higher-level needs
emerge. The need hierarchy has received wide acceptance in many social disciplines,
especially in evaluating consumers purchase behaviour. According to Schiffman et al.
(2010) the major problem with this theory however, is that it cannot be tested
empirically as it is almost impossible to measure precisely how satisfied one level of
need must be before the next higher need becomes operative. Despite this, the hierarchy
offers a highly useful framework for marketers trying to develop appropriate advertising
appeals for their products.

41 | P a g e
Modi et al. (2012) argue that consumers are heterogeneous in nature and they are all
different from each other in certain respects. Moreover, they often act emotionally
rather than rationally. The marketer makes decisions that will tie in more closely with
consumer needs and desires, by understanding how the consumer behaves but also the
way he behaves.
2.9 Chapter Summary
This research intends to measure customer satisfaction with service quality and product
quality delivered by apparel retailer ZARA in the context of Irish clothing retailing
industry. Customer satisfaction is described as the individual consumer’s perception of
the performance of the product or service in relation to his or her expectations and the
(Schiffman & Kanuk, 2010; Armstrong & Kotler, 2010) and customer’s fulfilment
response (Oliver, 2010). The three research objectives have been constructed for this
research, and these were fully reviewed with help of the academic theories.
This study combines multiple measures to assess and analyse customer satisfaction:
determinants of both service and product quality, theoretical frameworks (Taylor&
Baker, 1994; Rust & Oliver, 1994; Hokanson, 1995) with the special emphasis on the
model of the choice for this study introduced by Zeithaml et al. (2009). Among
different service quality scales SERVQUAL model (Parasuraman et al., 1985) was
adopted to analyse customer satisfaction with the service at ZARA. This scale has been
used because of its versatility as the scale has been tested in a number of studies
conducted in various service settings, geographical locations and different cultural
context. Another model, Garvin’s Eight Dimensions of Product Quality was reviewed to
measure customer satisfaction with product quality.

42 | P a g e
3. Methodology
3.1 Introduction
The methodology chapter begins with presentation of the research questions and the
creation of conceptual model for this research. Then research strategy with its different
approaches is briefly discussed. Continuing with presenting empirical data analysis and
method used to review this data.
3.2 Research Questions
One of the many challenges retailing clothing industry is facing in today’s competitive
environment is demand to provide quality service and products. Jones and Hill
(2010)suggest that only if a company has a sustained competitive advantage, it is likely
to gain market share from its rivals and thus grow its profits more rapidly than those of
rivals.
The purpose of this research is to explore the bond between service and product quality
resulting from it customer’s satisfaction. Nevertheless there was no focus put on its
relationship with loyalty. This research concentrates on quality of service and product,
focusing on the aspects that either diminish the feeling of satisfaction with the company
or contribute to improvement of such satisfaction. By measuring the quality of both
service and product quality it will be possible to outline the dimensions which need
improvements. This will provide the management with the valuable information of how
to train and allocate their resources and producers of which dimensions of the product
quality need to be ameliorated.

43 | P a g e
Because the respondents were also asked to assess their overall satisfaction and their
intention to shop again with ZARA the last research question is constructed.
This study has exploratory nature and therefore, the research hypotheses are formulated
as specific research objectives.
The study will analyse the following investigation research question:
The extent to which the quality of service and product are influencing customers’
satisfaction in the clothing retailing industry in Ireland
Based on the literature reviewed, the following are the specific objectives of this study:
1. To apply, rank and describe the impact of SERVQUAL factors on customer satisfaction
in ZARA Ireland.
2. To apply, rank and describe the quality dimensions of ZARA products in Ireland and
their impact on customer satisfaction using Garvin eight dimensions of Product Quality.
3. To measure and describe the overall customer satisfaction with ZARA services and
products in Ireland.
1. To apply, rank and describe the impact of SERVQUAL factors on customer
satisfaction in ZARA Ireland.
Traditionally, service quality has been conceptualized as the difference between
customer expectations regarding a service to be received and perceptions of the service
being received (Grönroos, 2001; Parasuraman, Zeithaml, and Berry, 1988 in Akbar and
Parvez, 2009). Service quality has been also referred as the extent to which a service
meets customers’ needs or expectations (Lewis and Mitchell, 1990). Customer service is
the most powerful stimulant of brand loyalty.

44 | P a g e
This research objective is aiming to apply, rank and describe factors of SERVQUAL
that affect the customer satisfaction and to which extent. The level of importance of
SERVQUAL dimensions towards customer satisfaction will be tested and the following
dimensions will be tested: reliability, responsiveness, courtesy, communication,
credibility, security, understanding/knowing the customer, tangibles.
The level of importance of eight dimensions of service quality towards customer
satisfaction will be tested as follow:
ZARA service performance (reliability, responsiveness, courtesy, communication,
credibility, security, and understanding) over a specific period of time is positively
related to the level of satisfaction toward the quality of ZARA services.
ZARA tangibles elements (i.e. stores atmosphere and décor) are positively related to the
level of satisfaction toward the quality of ZARA services.
These eight dimensions of service quality will be measured using several questions to
which respondents will be asked to rate their satisfaction on a five-point Likert scale:
Strongly Disagree, Disagree, Neutral, Agree, and Strongly Agree. Their numerical
values will range from one (1) Strongly Disagree to five (5) Strongly Agree.
The Likert scale seems to be the most relevant since the research intends to explore
customers’ attitudes towards retailer. Seale (2009) lists several key advantages of the
Likert scales. They perform very well when it comes to a reliable, rough ordering of
people with regard to a particular attitude; apart from their relative ease of construction,
the scales are also provide more precise information about the respondent’s degree of
respondent agreement or disagreement. Additionally, it becomes possible to include
items whose manifest content is not obviously related to the attitude in question, so that
the subtler and deeper ramifications of an attitude can be explored.

45 | P a g e
The five-point Likert scale has been applied as the use of seven-point scales has been
criticizes on several grounds. Lewis (1993) has criticized the use of seven-point Likert
scale for its lack of verbal labelling for points two to six. She believes this may cause
respondents to overuse extreme ends of the scale. Mangold and Babakus (1991) opted
to use five-point Likert scales on the grounds that it would reduce the ‘’frustration
level’’ of respondents and increase response rate and response quality.
One sample T-test will be used to test the significance of the means at a 0.05
significance level to evaluate service quality dimensions that are of main importance to
customers of ZARA. Then the dimensions will be ranked in order of magnitude to
indicate the importance of the dimensions to ZARA customers.
2. To apply, rank and describe the quality dimensions of ZARA products in Ireland and
their impact on customer satisfaction using Garvin eight dimensions of Product Quality.
Product quality is the only variable that has significant effect on the overall customer
satisfaction (Garvin, 1984). As already mentioned in the literature review Chapter, with
the higher quality of the goods customer satisfaction with services increases and in turn
with low quality of the products evaluation of the service in customer’s eyes will be
influenced negatively (Tsiotsou, 2005).
Therefore quality improvement has become the important tool in differentiating the
products and services in the competitive market.
Jones and Hill (2010) argue that in order to gain a competitive positioning the firm must
stress product innovation and quality- as- excellence.

46 | P a g e
This quality concept is defined by the author as a perspective that relates to product’s
design and styling, its aesthetic appeal, its functions and features and the level of service
associated with the delivery of the product. Nevertheless quality that bases on reliability
is another perspective.
This research objective intends to apply product attributes and evaluate the ones with
the most impact on assessing the overall quality by the customers. In addition, this
research aims to test Garvin product quality and to which extent these have an impact
on customer satisfaction with ZARA products.
The level of importance of eight dimensions of product quality towards customer
satisfaction will be tested as follow:
The Performance -Primary operating characteristic of ZARA products is positively
related to the level of satisfaction towards the quality of product.
The Features- Secondary characteristic of a product is positively related to the level of
satisfaction towards the quality of ZARA products.
The Reliability- ZARA failure-free product over a specific period of time is positively
related to the level of satisfaction towards the quality of ZARA products.
The Conformance- Degree to products physical and performance characteristics meet
design specification is positively related to the level of satisfaction towards the quality
of ZARA products.
The Durability- Measure of useful product life, before it deteriorates or must be
replaced is positively related to the level of satisfaction towards the quality of ZARA
products.
The Serviceability- courtesy and competence, possibility to exchange the product is
positively related to the level of satisfaction towards the quality of ZARA products.
The Aesthetics- Products look and feels are positively related to the level of satisfaction
towards the quality of ZARA products.
The Perceived quality & credibility- on image, brand name, and advertising is
positively related to the level of satisfaction towards the quality of ZARA products.

47 | P a g e
One sample T-test will be used to test the significance of the means at a 0.05
significance level to evaluate product quality dimensions that are of main importance to
customers of ZARA. Then these dimensions will be ranked in order of magnitude to
indicate the importance of the product dimensions to ZARA customers.
3. To measure and describe the overall customer satisfaction with ZARA services and
products in Ireland.
As discussed in the literature review section, customer satisfaction is a critical attribute
to be taken into account since it determines whether the customer is just satisfied or may
even become the apostle of the brand (Heskett et al., 1997).
According to Hanif, Hafeez and Riaz (2010) customer satisfaction is largely important
because that would create sense of belongingness, emotional binding and brand loyalty
among customers.
Evaluating overall customer satisfaction with both service and product quality dimensions is
one of the objectives of this research. The last part of the questionnaire developed for this
study contains two questions that aiming to assess the overall satisfaction with ZARA
garments and services.
Respondents will be asked to respond to questions on the questionnaire that ask:
1. Overall, you are very much satisfied with shopping in ZARA?
2. You are very much likely to shop in ZARA in the next months.
A five-point Likert-scale response will be given, coded from one (1) strongly disagree to
five (5) strongly agree.

48 | P a g e
Figure 3.1 The conceptual model based on the research objectives of this study
CVVV
Source: Own Creation based on the reviewed literature
3.3 Structure of research methods
Zeithmal et al. (2013) explains that research is only the first step in understanding the
customer, therefore the research needs to be appropriately designed, executed, and
presented. Academics disagree about the name, the order and the nature of research
stages.
Probably the most widespread framework for research methods of business scientists
has been developed by Saunders et al. in 1997 in the first edition of their book.
Reliability
Responsiveness
Courtesy
Communication
Credibility
Security
Understanding
Tangibles
Service
Quality
Customer
Satisfaction
Loyalty
Product
Quality
Perceived
Quality
Performance
Features
Reliability
Conformance
Durability
Serviceability
Aesthetics
Perceived Quality

49 | P a g e
Saunders et al. (2009) argue that there are relevant layers within each research
procedure, thus classified research into six stages and labelled the model which
presented them as ‘the research onion’ (Figure 3.2). The onion is a metaphor for
describing the layers of the research process. The outer layers of the onion contain
thinking about research philosophies and approaches, the central layers consider
research strategies and choices, while at the centre of the onion data collection methods
and analysis are the main importance (Saunders et al. 2009).
Figure 3.2 illustrates the research onion adapted to requirements of this thesis. The
name of the layer is highlighted in bold and underneath the approach used in this
research is given.
Figure 3.2 Structure of research methods
Source: Adapted from Saunders et al. (2009)
Philosophy:Positivism
Approach: Deductive
Strategy:Survey
Choice:Mono method
Time Horiozon:
Cross- sectional
Techniques:Data
collection and data analysis

50 | P a g e
3.3.1 Research Philosophy
Crossan (2003) argues that understanding the research philosophy has an essential role
in the choice of research methodology. Most importantly, it can help the researcher to
refine and specify the research methods to be used in a study, that is, to outline the
overall research strategy. Moreover, it enables to define the limitations of the particular
research approach and helps the researcher to be creative and innovative in the choice of
methods to approach the research.
The research philosophy adopted contains important assumptions about the way in
which the researcher view the world around. As per Saunders et al. (2012) this research
philosophy reflects the principles of positivism, and having said that the researcher
intends to adopt the philosophical stance of the ‘natural scientist’. It is preferable to
‘work with an observable social reality and that the end product of such research can be
law-like generalisations similar to those produced by the physical and natural scientists’
(Remenyi et al., 1998:32). The academic literature is rich in different definitions of the
term ‘positivism’. Jankowicz (2005) argues that positivism comprises several beliefs
about how the researcher can make sense to others, which have come into existence
because it is assumed that no-one is perfect and that all human beings are fallible. The
basic reasoning of positivism assumes that an objective reality exists which is
independent of human behaviour and is therefore not a creation of the human mind. All
real knowledge should be derived from human observation of objective reality. The
senses are used to accumulate objective and measurable data, anything else should be
rejected (Crossan, 2003).

51 | P a g e
3.3.2 Research Approach
There are several strategies to approach research whereas Saunders et al. (2012) present
two approaches, inductive (qualitative) and deductive (quantitative) methods. The main
difference between the two methods concerns the use of numbers and statistics
(Blumberg, 2008). Lancaster (2012) argues that both methods of data collection and
methods of data analysis would in part be determined by whether or not the researcher
was interested in qualitative or quantitative data. One method is not better than the
other, and the distinction between the two major categories of data is particularly
important when it comes to the data collection and analysis steps of the research.
Induction suggests a ‘bottom up’ approach to theory development, and moves from
specific observations to broader generalisations and theories (Saunders et al. 2012).
A deductive approach is the opposite, has a ‘top down’ flavour and involves the testing
of a theoretical proposition by using a research strategy designed to perform this test
(Saunders et al., 2012). Lancaster (2012) argues that it is essentially a set of techniques
for applying theories in the real world in order to test and assess their validity.
In deductive approach the researcher defines research questions, develops hypotheses
and by using existing theory, designs a research strategy to test and confirm these
hypotheses. This will lead to the further development of theory which may then be
tested by further research (Saunders et al., 2009).
Figure3.3 Deductive Approach
Source: Adopted from Saunders and Lewis (2012).
Theory Hypothesis Observation Confirmation

52 | P a g e
This research involves a deductive reasoning process which represents the main, and
some would say the only justifiable, method of research in the natural sciences.
Lancaster (2012) suggests that some, in addition, thinks that this is the only truly
‘scientific; approach to developing knowledge and therefore should be the only
approach that is used in the social sciences. Both methods have also its weak sides.
Cronbach (1975) pointed out, quantitative as opposed to qualitative is not a dichotomy,
and the researcher may often combine both quantitative and qualitative analysis of the
same data so as to develop a richer understanding of a phenomenon or issue through the
data collected, while at the same time being able to use a combination of techniques to
check data for aspects such as representativeness, reliability and validity.
Due to time constraint and the general difficulty in measuring the phenomenon of
customer satisfaction a method where information can be measured and valued
numerically is recognised as the safest approach, thus a deductive approach will be
conducted.
By applying this research approach it is aimed to relate the existing theory and data
obtained from a study. This study can be categorized as ‘exploratory’ and tends to
increase understanding of the given topic. The researcher intends to assess customer
satisfaction derived from both service and product quality provided by ZARA. The
social phenomena are service and product quality and customer satisfaction that will be
approached from the customers’ perspective.
There are several forms of data collection associated with deductive research paradigm,
one of them- survey will be used for the purpose of this study.

53 | P a g e
3.3.3 Research Strategy
Many studies (Parasuramanet al. 1985, Heskett et al. 1997, and many more) found that
there is a strong, positive correlation between customer satisfaction and theirs buying
behaviour.
This correlation is not completely reliable though; higher satisfaction levels may not
necessarily result in more sales and higher margins. For instance Griffin (1995) found
that, even when people claim to be satisfied in customer satisfaction surveys as high as
85 per cent of them would still be willing to change the supplier. This is the result of the
difficulty in general to accurately and reliably define and measure customer satisfaction.
Since customers tend to overrate their satisfaction in the surveys they fill in, the
reliability of satisfaction surveys as predictors of repeat purchase can be questioned.
In several ways the satisfaction ratings can be inflated: the formation of questions,
timing of the measurement, and even the mood of the respondents (Jankowicz, 2005).
Nevertheless, surveys are the most common tool when investigating this phenomenon
therefore it would be preferable to follow the previous research methods. The survey is
conducted in order to establish people’s views of what they think, believe, value or feel,
in order to discover these views for their own sake or to support an argument to
generalize conclusions more widely. Saunders et al. (2012) argue that one of the reasons
surveys are so popular is that they allow the collection of data about the same things
from a large number of people in a cost-effective manner. Blumberg et al. (2008) think
that a major limitation of self-administered surveys concerns the type and amount of
information that can be secured. Participants will generally refuse to cooperate with a
long questionnaire unless they perceive a personal benefit. Another major weakness of
this kind of study is non-response rate. Generally, better –educated participants and
those interested in the topic answer mail surveys (Blumberg et al., 2008).

54 | P a g e
Measuring the quality of a service can be a very difficult exercise. Unlike the quality of
product where there are specific specifications such as length, depth, weight, and colour
etc. a service can have numerous intangible or qualitative specifications.
In addition there is an expectation of the customer with regards to the service, which
can vary considerably based on a range of factors such as prior experience, personal
needs and what other people may have told them (Zeithaml, 2009).By applying the
questionnaire as the instrument for data collection any interaction will be limited to
physical distribution and this ensures that the researcher and the respondents will not
influence each other.
Questionnaire Design
As per framework for this research the researcher intends to concentrate on two
independent variables: service quality and product quality and one dependent variable
satisfaction.
The questionnaire consists of four parts.
- Part 1 Personal and Customer Information- this part of the questionnaire aims to
collect demographic information, and ask specifically about the gender, nationality
and age group.
- Part 2 Customer Satisfaction with ZARA services- this part of the questionnaire
consists eight sections that were adopted from SERVQUAL model. Each section
intends to measure the impact of service quality determinants on customer
satisfaction.
- Part 3 Customer Satisfaction with ZARA products- this part of questionnaire consists
eight sections that were adopted from Garvin Eight Dimensions of Quality (1984) to
measure the impact of product quality on customer satisfaction.

55 | P a g e
- Part 4 Overall Customer Satisfaction- this part estimates the overall level of customer
satisfaction with both product and service quality and the customer’s intention to
shop in ZARA again in the coming months.
All questions included in the survey are close-ended and the respondent was asked to
choose one option only.
3.3.4 Research choice
Taking into account the scope of this research, a mono method research is considered
the most appropriate. By choosing a mono method the researcher was intending to adopt
a single quantitative data collection technique- questionnaire.
3.3.5 Time Horizons
Saunders and Lewis (2012) suggest two types of time horizons cross sectional and
longitudinal studies. While longitudinal study is the study of a particular topic over an
extended period of time, cross sectional is time-constrained and is a ‘snapshot’ of a
particular research setting at a particular time (Saunders et al., 2012). This case study
will be based on quantitative data collected through cross- sectional surveys. The main
weakness of this type of research is that the survey is completed by a single respondent
at a single point in time.
To ensure the reliability and validity of this research the researcher was seeking to
acquire various people (in term of gender, age, occupation, and nationality), as well as
will slightly stretched the time of research.

56 | P a g e
The e-mails with link to surveys were distributed on the 3rd
of July 2013 and the
respondents were asked to complete them by the 20th
of July 2013.
3.3.6 Sample
The target population for this study comprises all ZARA customers that live in Ireland.
Out of all ZARA customers in Ireland, a sample size of one hundred (100) was selected
for this research. Using a larger sample in this survey would probably require more
time, and the time limit within which the research was to be completed would not
permit the use of larger sample size.
Sampling makes it possible to generate findings that are representative of the whole
population at a lower cost than collecting the data for the whole population. Therefore it
was possible to set a finite time span for this project which assisting in planning and
delivering end results.
The questionnaires were distributed using the snowball sampling method (Blumberg et
al. 2008), sending the link through e-mail among friends and co-workers (approximately
25-30 strong contacts) and by asking them to forward the link to any of their friends/
family member that are customers of ZARA. To draw a higher response rate it has been
decided to send the link to the questionnaire to as many contact as possible using not
only the e-mail but also social platforms like Facebook and Twitter.
The snowball method seems to be most suitable for this type of research since it helps to
save time and make it possible for surveys to be distributed among people who are not
necessary known by the authors therefore the findings are a subject of a huge curiosity
of the author.

57 | P a g e
In order to avoid confusions and collect fully completed questionnaires a short
explanation of the content of the questionnaire was included (Appendix D).
Additionally, one of the very first questions was asking the respondent not to continue
with the questionnaire if he/she is not a ZARA customer. By verifying this information
straight from the beginning the researcher tried to verify the respondents and to ensure
that the respondent is familiar with the scope of the research (questionnaire available in
Appendix E).
3.3.7 Techniques (Data Analysis)
Data Analysis phase is composed of few parts. The four steps were taken in order to
analyze the data obtained through questionnaires. Statistical terms that were used for
this analysis are available in Appendix G- Glossary of Statistical Concepts.
3.3.7.1 Descriptive statistics
The first step of the data analysis has shown item statistics that are conducted separately
for service and product variables. Mean values were calculated for both sets of data, as
well as overall customer satisfaction.
3.3.7.2 Reliability data analysis
The reliability of a measure refers to its consistency and is used to validate a
questionnaire to check the reliability of the scale (Field, 2005).

58 | P a g e
According to Bryman & Cramer (2009) this notion is often taken to entail two separate
aspects: external and internal reliability. Field (2005) argues that there are number of
procedures for estimating internal reliability; two of them can be easily computed in
SPSS:
- Split-half reliability is probably the simplest way to measure internal reliability
in practice. This method divides the items in a scale into two groups and the
relationship between respondents’ scores for the two halves is computed.
A correlation coefficient is then granted, which varies between 0 and 1 and the
nearer the result is to 1-and preferably at or over 0.8 –the more internally
reliable the scale is (Bryman et al., 2009).
- Cronbach’s alpha (α) is the second method and was created by Cronbach with
the idea of overcoming the above issue. In 1951 Cronbach came up with a
measure that is loosely equivalent to splitting data in two, and in every possible
way to compute the correlation coefficient for each split.
The average of these values is equivalent to Cronbach’s alpha (α)- the most
common measure of scale reliability (Field, 2005).
Two separate scales have been used as frames to build the questionnaire for this
research; for service and product quality, and they both were checked to confirm the
reliability and validity of the scales. The Cronbach’s alpha values inter-item correlation
as well as items total correlation.

59 | P a g e
3.3.7.3 Factor Analysis
Factor analysis is a technique for identifying groups or cluster of variables and
according to Field (2005) this technique has three main uses:
1. to understand the structure of a set of variables;
2. to construct a questionnaire to measure an underlying variable;
3. to reduce a data set to a more manageable size while retaining as much of the original
information as possible.
This technique can be seen as a tool to bring order to the way we see things by
determining which of them are related and which of them are not. Bryman et al. (2009)
distinguish two uses of factor analysis: exploratory and confirmatory perspectives. The
most commonly reported according to authors is the exploratory kind in which the
relationships between variables are examined without determining the extent to which
the results fit a particular model. This structure is recommended when no hypothesis
about the nature of the underlying factor structure of their measure was created. In this
study, an exploratory factor analysis was used as the aim of the research was to explore
the dimensions of both product and service quality in the clothing retailing industry.
For the purpose of this research with help of Varimax (orthogonal) rotation with Kaiser
Normalization the number of factors, separately for service and product quality will be
extracted, and then grouped into new loads. Variables with the values less than 0.5 will
be neglected.

60 | P a g e
3.3.7.4 Regression Analysis
Regression has become one of the most common used techniques in the analysis of data
in the social sciences. It is a powerful tool for summarizing the nature of the
relationship between variables and for making predictions of likely values of the
dependent variable (Brymar et al., 2009).
Field (2005) postulates that by producing a line which fits the data closely (line of best
fit), the regression summarize the relationship between two variables.
A good strategy to adopt with regression is to measure predictor variables for which
there are sound theoretical reasons for expecting them to predict the outcome.
The regression analysis is the last step that helped the researcher to identify the best
predictors of both service and product quality. The analysis has commenced with
analysing the ANOVA table. Then the strength of the relationship between the both
models and the dependent variable will be analysed using multiple correlation
coefficient. The analysis will be summarized with analysing factors standardized
coefficients and significance to determine the predictors of service and product quality
in the Irish clothing retailing industry.
3.4 Ethics
According to Blumberg et al. (2008) ethics is the study of the right behaviour and
addresses the question of how to conduct research in a moral and responsible way. He
continues by saying that ethics are moral principles, norms, or standards of behaviours
that guide moral choices about our behaviour and our relationships with others.
The questionnaires were anonymous, and no name/ surname were required in order to
participate in the survey, moreover the participants were guaranteed confidentiality.

61 | P a g e
Confidentiality is an important condition, and being aware of that all feedback received
is kept secure.
3.5 Researcher Bias
There is two main factors that can cause bias in any type of interviewing. One of them
is non-response which is a concern for all types of surveys. Some studies show that first
calls or distributions often secure less than 20 per cent of the designated participants.
The second factor is response error, which occurs when the participant fails to give a
correct or complete answer (Blumberg et al. 2008). The interviewer can provide a
solution for both types of errors.
All the questionnaires with the missing responses were excluded, and only fully
completed surveys were taken into consideration. The researcher bias can be easily
reduced by means of a careful design of the survey questions itself (Jankowicz, 2005).
The researcher put every effort to create clear and precise questions. The survey
questions were written so each respondent had a chance to interpret the meaning exactly
the same way. To avoid further confusion there were only closed type of questions with
the choice of answers from strongly agree to strongly disagree. By using the
SERVQUAL as the framework for the questionnaire the researcher intends to minimise
the impact of their own bias while creating the forms.

62 | P a g e
4. Data Analysis
4.1 Introduction
This Chapter presents results from the analysis conducted on the data collected through
quantitative survey. At first the demographics of ZARA customers are reviewed. These
includes: gender, age, nationality, duration of residence, customer duration and last visit
in the store. Then the descriptive statistics and reliability for ZARA services and
garments are analysed. Discussion of Factor Analysis and the linear regression follow
subsequently. The chapter is completed with the presentation of new determinants of
service and garments quality and evaluation of overall customer satisfaction with
ZARA.
4.2 Demographic Profile
Since the characteristics of the respondents have a significant impact on questionnaire
results, the descriptive data of participants of this study will be presented. The majority
of participants are found to be female with 69 per cent and 31 per cent are male. The
ratio of male-female population sample of this study is slightly different from the
proportion provided by the Central Statistics Office (CSO, 2011) in which females’
represent 50, 47 per cent of the population and males the remaining 49, 43 per cent.
Questionnaires flow was controlled by the researcher on a daily basis as the aim for this
research was to obtain a hundred fully completed questionnaires. Among 108
questionnaires a hundred was completed from the first to the last question and only
these were included in the evaluation of this study.

63 | P a g e
Most of the customers were found to be in the age group of 25-33 years old (65%)
followed by the age group of 33-42 years (24%). The remaining 11 percent of the
respondents falls on the remaining three age groups: 43-50, 18-24 and over 51
respectively. According to CSO (2011) Ireland’s total population of male-female
between 15 and 64 years old is 3,080,250. This number represents the total of the target
population object of this study.
The sample of this study differs significantly from the data provided by the CSO (2011)
according which 18.84 per cent of target population of both sexes is attributed to the age
group 15-24 years; almost 48.70 per cent of target population is between 25-44 years
and the remaining 32.46 falls into category between 45-64 years.
The nationality frequency shows that the majority of the respondents are Irish customers
(69%) followed by Non-Irish (31%) mainly: Polish, Italian and Spanish. According to
CSO (2011) Ireland’s population consist 3,927,143 (87.9 %) of Irish citizens and
544,357 (12.1%) of Non-Irish citizens. The ratio of this study differs from the ratio
provided by CSO due to the fact that the sample of this study was taken limited to
Dublin area.
The demographic variable ‘ResiDuration’ presented in Table 4.1 describes the length of
time the respondents live in Ireland from a hundred respondents; 92 per cent live in
Ireland for at least 6 years, and the remaining 8 per cent reside in Ireland for duration of
less than 6 years.
The aim of this study is to measure the level of customer satisfaction with ZARA
services and garments, therefore one of the very first questions in Section II was asking
the respondent: ‘Are you a Zara Customer?’ On negative answer to this question a
courtesy message prompted avoiding the respondent involvement from further
participation in this study.
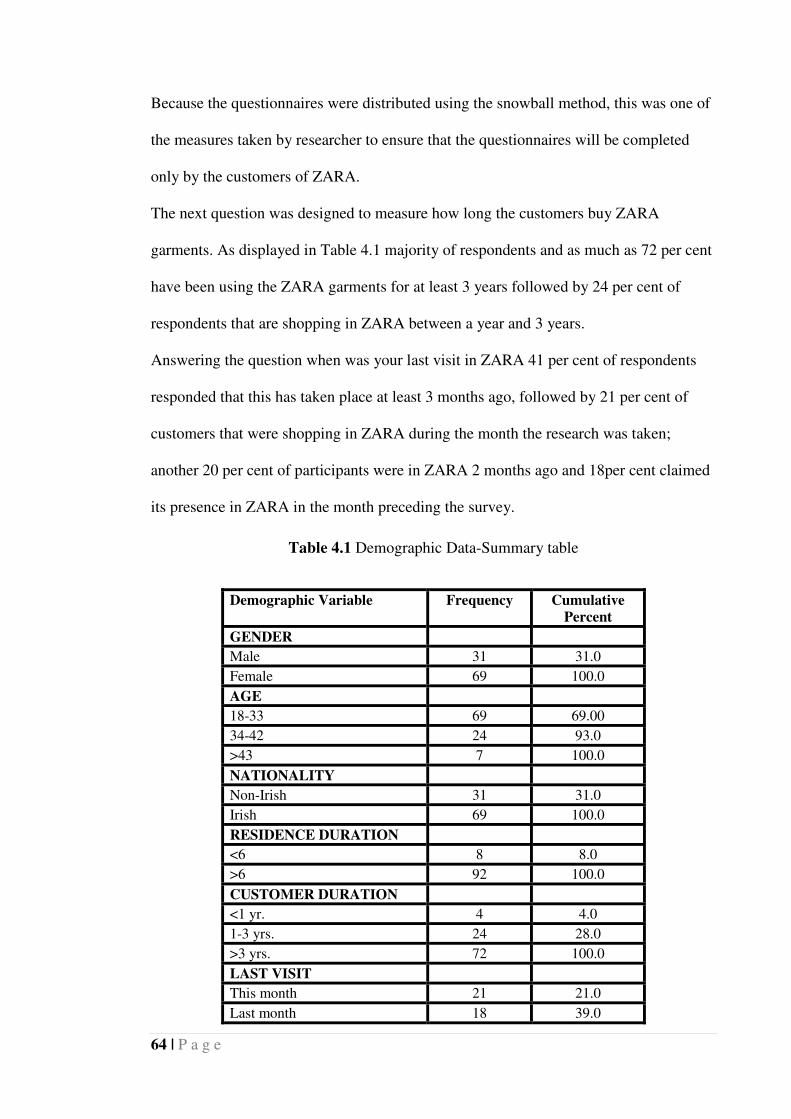
64 | P a g e
Because the questionnaires were distributed using the snowball method, this was one of
the measures taken by researcher to ensure that the questionnaires will be completed
only by the customers of ZARA.
The next question was designed to measure how long the customers buy ZARA
garments. As displayed in Table 4.1 majority of respondents and as much as 72 per cent
have been using the ZARA garments for at least 3 years followed by 24 per cent of
respondents that are shopping in ZARA between a year and 3 years.
Answering the question when was your last visit in ZARA 41 per cent of respondents
responded that this has taken place at least 3 months ago, followed by 21 per cent of
customers that were shopping in ZARA during the month the research was taken;
another 20 per cent of participants were in ZARA 2 months ago and 18per cent claimed
its presence in ZARA in the month preceding the survey.
Table 4.1 Demographic Data-Summary table
Demographic Variable Frequency Cumulative
Percent
GENDER
Male 31 31.0
Female 69 100.0
AGE
18-33 69 69.00
34-42 24 93.0
>43 7 100.0
NATIONALITY
Non-Irish 31 31.0
Irish 69 100.0
RESIDENCE DURATION
<6 8 8.0
>6 92 100.0
CUSTOMER DURATION
<1 yr. 4 4.0
1-3 yrs. 24 28.0
>3 yrs. 72 100.0
LAST VISIT
This month 21 21.0
Last month 18 39.0

65 | P a g e
2 months ago 20 59.0
3 months ago or more 41 100.0
Source: SPPS 15.0 Frequencies
4.3 Descriptive Statistics
4.3.1 Service
4.3.1.1 Descriptive Statistics
The customers’ perception of service quality was measured on the Likert scale from 1-
Strongly Disagree to 5- Strongly Agree. Twenty items that measure level of customer
satisfaction with dimensions of service quality (SERVQUAL) were present in the third
part of the questionnaire. Table 4.2 presents these items by using descriptive statistics.
SPPS output below shows mean value for twenty variables used to describe quality of
service. From this table, can be seen that service communication 1 (SERVCOMM 1)
was the lowest with its 3.55 (out of 5), while service security (SERVSEC 1, 2) were
both 4.41 (out of 5) and were rated by customers of ZARA as the highest score.
Table 4.2 SERVQUAL- Descriptive Statistics
Mean
ServREL1 4.3800
ServRES1 4.0600
ServRES2 3.7800
ServRES3 3.7100
ServRES4 3.8100
ServCOURT1 4.1800
ServCOURT2 4.0400
ServCOMM1 3.5500
ServCRED1 4.2200
ServCRED2 3.8300
ServCRED3 4.1100
ServSEC1 4.4100
ServSEC2 4.4100

66 | P a g e
ServUNDER1 3.5400
ServUNDER2 3.9100
ServUNDER3 3.6400
ServUNDER4 3.6000
ServTANG1 4.1300
ServTANG2 4.0700
ServTANG3 3.8300
Valid N (listwise) 100
*Full explanations of abbreviations and terms- Appendix H
4.3.1.2 Reliability Data Analysis
The main purpose for the reliability analysis of data is to verify the veracity of the data
Bryman et al. (2009). The reliability coefficient Cronbach’s Alpha for the SERVQUAL
scale is 0.923. Cronbach’s Alpha varies between 0 and 1 and the nearer the result is to
1- and preferably at over 0.8- the more internally reliable is the scale (Bryman, et al.
2009).
Table 4.3 Reliability Statistics- SERVQUAL
Cronbach's Alpha N of Items
.923 20
Table 4.4 presents what would happen to the scale after the deletion of each item. It can
be noticed that after deletion of any of the item the lowest value is 0.917 which is still
over the acceptable level of 0.8. That means that all items contribute equally to the scale
and a deletion of any item would not change significantly Cronbach’s alpha value. The
scale would still be reliable.

67 | P a g e
Table 4.4 Reliability Data Analysis for SERVQUAL (Internal Correlation)
Item-Total Statistics
Description of each item
Description of each
item
ServREL1
Consistency; the firm performs the service right the first time.
.924
ServRES1
Willingness or readiness of employees to provide service
.917
ServRES2 Employees respond to customers upon request. .919
ServRES3 Waiting time outside fitting room is acceptable .923
ServRES4 Waiting time taken at the billing counter is acceptable .920
ServCOURT1. Personnel always look professional. .919
ServCOURT2 Employees are consistently courteous with customers. .917
ServCOMM1 Personnel provide appropriate explanation on garments. .917
ServCRED1 Performs its service right the first time. .920
ServCRED2 Company shows a sincere interest in solving any problems. .920
ServCRED3 Company is known for keeping its promises .919
ServSEC1 Customers feel safe in transactions with ZARA .922
ServSEC2 Customers feel safe shopping at ZARA. .923
ServUNDER1 Employees provide customer individual attention. .918
ServUNDER2 Behaviour of employees instill confidence in customers. .917
ServUNDER3 Employees have the knowledge to answer customers’ enquiries. .919
ServUNDER4 Employees understand the specific needs of their customers. .918
ServTANG1 Stores atmosphere and decor are appealing. .920
ServTANG2 Employees’ uniforms appear neat. .920
ServTANG3 Materials associated with the service are visually appealing. .918
*Full explanations of abbreviations and terms- Appendix H
Table 4.5 Summary Item Statistics for SERVQUAL
Mean Min Max Rang
e Max / Min Variance N of
Items
Item Means 3.960 3.540 4.410 .870 1.246 .079 20
Item Variances .472 .265 .673 .408 2.543 .013 20
Inter-Item Correlations
.377 -.027 .964 .990 -36.263 .026 20

68 | P a g e
To check the reliability of SERVQUAL scale also inter-item correlations can be
analysed. In a reliable scale all items should correlate with the total. The item does not
correlate if the value is less than 0.30. Additionally, items with low correlations may
have to be dropped (Field, 2005). For this study the inter-item correlation is 0.377,
which is encouraging.
Table 4.6 Reliability statistics- SERVQUAL scale
Item Cronbach's
Alpha N of Items
Responsiveness .780 4
Courtesy .808 2
Credibility .670 3
Security .981 2
Understanding .881 4
Tangibility .802 3
Reliability & communication
.330 2
Table 4.6 presents eight SERVQUAL determinants that were taken into account in
order to conduct this study. Generally, alpha values for determinants of service quality
are high. Reliability and communication item scored low, and they were measured
together since both of them contained only one question which made it impossible to
analyze these items individually.
4.3.1.3 Determinants of Service Quality in Clothing Industry
The purpose of the factors analysis is to reduce the number of variables and to decide
which items need to be kept.

69 | P a g e
The average number of communalities found after adding up all communalities is
14.738 which after dividing by the number of communalities gives 0.7369, and which
as per Kraiser’s criterion is greater than 0.7.
Table 4.7 Communalities-SERVQUAL scale
Initial Extraction
ServREL1 1.000 .808
ServRES1 1.000 .678
ServRES2 1.000 .684
ServRES3 1.000 .729
ServRES4 1.000 .761
ServCOURT1 1.000 .761
ServCOURT2 1.000 .816
ServCOMM1 1.000 .711
ServCRED1 1.000 .757
ServCRED2 1.000 .641
ServCRED3 1.000 .629
ServSEC1 1.000 .860
ServSEC2 1.000 .873
ServUNDER1 1.000 .770
ServUNDER2 1.000 .683
ServUNDER3 1.000 .691
ServUNDER4 1.000 .726
ServTANG1 1.000 .692
ServTANG2 1.000 .790
ServTANG3 1.000 .678
Extraction Method: Principal Component Analysis.
*Full explanations of abbreviations and terms- Appendix H
The Varimax (orthogonal) rotation with Kaiser Normalization was used to extract the
number of factors for Service Quality.

70 | P a g e
Table 4.8 Rotated Component Matrix- SERVQUAL scale
Rotated Component Matrix(a)
Component
1 2 3 4 5
ServREL1 .008 .311 .021 .048 .842
ServRES1 .535 .144 .100 .489 .349
ServRES2 .634 -.085 .091 .500 .131
ServRES3 .231 -.353 .353 .281 .590
ServRES4 .321 -.181 .583 .015 .534
ServCOURT1 .275 .170 .348 .731 -.040
ServCOURT2 .522 .102 .083 .680 .252
ServCOMM1 .770 .005 .282 .060 .189
ServCRED1 .033 .382 .171 .508 .568
ServCRED2 .606 .436 .100 -.090 .256
ServCRED3 .374 .448 .357 -.026 .400
ServSEC1 .087 .892 .176 .145 .068
ServSEC2 .035 .900 .178 .148 .093
ServUNDER1 .839 .038 .074 .228 .083
ServUNDER2 .668 .172 .188 .397 .118
ServUNDER3 .786 .000 .210 .153 -.072
ServUNDER4 .816 .089 .172 .149 -.015
ServTANG1 .130 .385 .698 .077 .185
ServTANG2 .173 .255 .752 .342 -.108
ServTANG3 .329 .139 .691 .158 .219
*Full explanations of abbreviations and terms- Appendix H
Extraction Method: Principal Component Analysis.
Table 4.8 shows the rotated component matrix which is a matrix of the factor loadings
for each variable onto each factor (Field, 2005). SPSS extracted all factors with eigen
values greater than 1, which left the researcher with five factors. The highlighted items
were grouped to the five components and only loads that exceed 0.5 were taken into
account (Field, 2005). That means that one factor- service credibility (SERVCRED3) -
has been discarded, and this information will be lost.

71 | P a g e
Most of the items values have changed after excluding the factor with the lowest load
value- SERVCRED3 (Appendix G).
Table 4.9 Reliability Statistic for new scale (after extraction SERVCRED3)
Cronbach's Alpha N of Items
.919 19
Because the number of item in the scale has changed the reliability coefficient
Cronbach’s Alpha for the SERVQUAL scale has changed from 0.923 to 0.919 (Table
4.9). This is still over required 0.8 and this shows that the new scale is reliable.
Table 4.10 Determinants of Service Quality in the retailing clothing industry
New Factors Determinants of
SERVQUAL
Main Criterion
1. Understanding
customers needs
Responsiveness (2) Employees are always willing and ready to provide service;
Employees are never too busy to respond to your request.
Communication (1) Personnel provide appropriate explanation on garments.
Credibility (1) The co. shows a sincere interest in solving any problems.
Understanding (4) Employees provide you individual attention;
The behaviour of employees instill confidence in customers;
Employees have the knowledge to answer customers’
enquiries;
Employees understand the specific needs of their customers.
2. Security Security (2) You feel safe in your transactions with the retailer;
You feel safe shopping.
3. Tangibles Responsiveness (1) The waiting time taken at the billing counter is acceptable.
Tangibles (3) Stores atmosphere and decor are appealing;
Employees’ uniforms appear neat;
Materials associated with the service are visually appealing.
4. Courtesy Courtesy (2) Personnel always look professional.
Employees are consistently courteous with customers.
5. Serviceability Reliability (1) The billing is always accurate
Responsiveness (1) The waiting time outside fitting room is acceptable.
Credibility (1) The company performs its service right the first time.
Source: As per factor extraction- SPSS data

72 | P a g e
As per Total Variance Table (Appendix F) it can be seen that the dispersion of the five
factors accounts for 73.69% with the highest value of Factor 1 that accounts for 41.68%.
Table 4.10 presents factors, determinants of service quality in retailing clothing industry
which were established for this study after the factor extraction process.
Table 4.11 New Determinants of service quality
Determinants Mean Standard
Deviation
1.Understanding
(29.91/8)
3.738
4.508
2. Security (8.82/2)
4.410
1.038
3. Tangibles (15.84/4)
3.960
2.144
4. Courtesy (8.22/2)
4.110
1.124
5. Serviceability (12.31/3)
4.103
1.673
Table 4.11 presents new variables that were extracted from the factor analysis and
grouped into five main dimensions. All items have been computed using transform
option in SPSS and then the Descriptive Statistics (Appendix F) for new values were
adopted. This resulted in the new values for each determinant. The maximum score on
the scale is equal to five. ZARA customers are quiet fairly satisfied with the level of
service received in the store as most of the determinants except ‘understanding customer
needs’ and ‘tangibles’ with 3.73 and 3.96 respectively, are above the mean value 4 .
The highest scored ‘security’, and that means that the customers feel safe and secure
while making their transactions in ZARA. Likewise courtesy and serviceability follow
security. The customers seem to be satisfied with ZARA personnel and their willingness
to help, and they agree that serviceability such as reliability, responsiveness and
credibility are meeting their expectations.
Regression analysis will be used to further explore the best predictor of service quality.

73 | P a g e
4.3.1.4 Regression Analysis
The regression analysis was used to predict values of the dependent variable (DV)-
overall customer satisfaction from the independent variables (IVs)-determinants of
service and product quality. All new factors arising after the factor extraction analysis
were entered as independent variables and computed.
Table 4.12 Variables Entered/ Remover used in the Regression Analysis for Service
Model Variables Entered
Variables Removed Method
1
Serviceability, Security, Understanding, Tangibles, Courtesy(a)
. Enter
a All requested variables entered. b Dependent Variable: CUSTSAT1
Table 4.13 Overall fit of the model- Model Summary (b)
Model R R Square Adjusted R
Square Std. Error of the Estimate Durbin-Watson
1 .532(a) .283 .245 .48624 2.170
a. Predictors: (Constant) Serviceability, Security, Understanding, Tangibles, Courtesy b.Dependent Variable: CUSTSAT1
The model summary table provides the value of R and R2
for the model that has been
derived and reports the strength of the relationship between the model and the
dependent variable, customer satisfaction (Field, 2005). For the predictors a, R has a
value of .532 or 53% of variances in customer satisfaction.
The adjusted R2
gives researcher some idea of how well the model generalizes and
ideally this value should be very close to the value of R2
(Field, 2005).
In this model however the difference for the final model is significant:
.283- .245=3.8%

74 | P a g e
This means that if the model were derived from the population rather than a sample it
would account for approximately 3.8% less variance in the outcome.
The last value in Table 4.13- Durbin-Watson the closer to 2 the value is the better, and
for these data the value is 2.170, which is perfect and it is almost self-evident that the
assumption has been met (Appendix G).
Table 4.14 ANOVA (b)
Model Sum of
Squares Df Mean Square F Sig.
1 Regression 8.776 5 1.755 7.424 .000(a)
Residual 22.224 94 .236
Total 31.000 99
a Predictors: (Constant), Serviceability, Security, Understanding, Tangibles, Courtesy b Dependent Variable: CUSTSAT1
Table 4.14 illustrates analysis of variance (ANOVA) and tests whether the model is
acceptable from a statistical point of view. The most important part of the Table 4.14 is
the F-ratio that is 7.424which is significant at p<.001 (as the value Sig. is .000). This
tells us that there is a 0% chance that an F-ratio this large would happen by chance
alone (Field, 2005). This regression results in a much better prediction of overall
customer satisfaction than using the mean value of customer satisfaction.
The ANOVA model results in a good degree of prediction of the outcome variable, but
will not tell about the individual contributions of variables in the model.
Table 4.15 shows details of the model parameters (the beta values) and the significance
of these values.

75 | P a g e
Table 4.15 Coefficients-Service Quality
Model
Unstandardized Coefficients
Standardized Coefficients T Sig.
B Std. Error Beta B Std. Error
1 (Constant) 1.541 .518 2.975 .004
Understanding .033 .016 .268 2.083 .040
Security .025 .051 .047 .492 .624
Tangibles .048 .031 .185 1.542 .126
Courtesy -.069 .063 -.138 -1.093 .277
Serviceability .093 .036 .278 2.578 .012
a Dependent Variable: CUSTSAT1
The B-values show the individual contribution of each predictor to the model and tell us
about the relationship between overall customer satisfaction (CUSTSAT1) and each
predictor (Field, 2005). All predictors except courtesy have positive b-values indicating
positive relationships, and that means that once each of these values namely;
understanding/ security/ tangibles/courtesy/serviceability increases, customer
satisfaction increases. Moreover this value indicates that as for example understanding
of customers’ increases by one unit, overall customer satisfaction increase by .033 units
(B value for understanding). According to Field (2005) this interpretation is true only if
the effects of other predictors are held constant. T-tests measures of whether the
predictor contributing to the overall model. The predictor is making a significant
contribution to the model if the Sig. value is less than .05. The smaller the value of Sig.
and the larger the value of t the greater the contribution of that predictor (Field, 2005).
The coefficient table shows that serviceability (t (2.578), Sig.012) and understanding (t
(2.083), Sig.040) are both significant predictors of customer satisfaction with service
quality.
As the standardized β values are directly comparable, they can provide a better insight
into the importance of a predictor in the model (Bryan et al. 2009).

76 | P a g e
The standardized β values of understanding and serviceability are 278 and 268
respectively indicating that both variables have a comparable degree of importance in
the SERVQUAL model.
Summarizing, serviceability is the best predictor of customer satisfaction with service
quality with its highest standardized coefficient, T values and lowest significance.
Table 4.16 presents predictors of overall customer satisfaction with service quality
grouped in order of significance. Please refer to ‘Appendix J’ for Additional Statistics.
Table 4.16 Predictors of service quality in order of importance
Rank Predictor Items
1 Serviceability Accurate billing, acceptable waiting time outside
fitting rooms, good service.
2 Understanding Employees are willing to provide service, are not too
busy to respond to customer’s request, provide
explanation on garments, and show customers
individual attention.
3 Tangibles Acceptable waiting time at the billing counter,
Stores atmosphere and decor are appealing
Employees’ uniforms appear neat.
4 Courtesy Personnel look professional and are courteous with
customers.
5 Security Feeling safe with transactions and while shopping.

77 | P a g e
4.3.2 Garments
4.3.2.1 Descriptive Statistics
Fourteen items have been entered to measure level of customer satisfaction with
dimensions of product quality and were present in the fourth part of the questionnaire.
From the mean values calculated for each of the fourteen variables, perceived quality
(GARMPERCQL 1) was the lowest among all items with its 3.90 (out of 5), while
garments aesthetic (GARMAEST1) was 4.34 (out of 5) and was rated by customers of
ZARA with the highest value (Table 4.17).
Table 4.17 Garvin’s Product Quality- Descriptive Statistics
Mean
GarmPERF1 4.0000
GarmPERF2 4.2200
GarmPERF3 4.0100
GarmFEAT1 4.1000
GarmREL1 4.0900
GarmCONF1 4.1400
GarmCONF2 4.0700
GarmDURA1 4.0000
GarmSERV1 4.0800
GarmAEST1 4.3400
GarmAEST2 4.2500
GarmAEST3 3.9400
GarmPERCQ1 3.9000
GarmPERCQ2 3.9200
Valid N (listwise)
*explanations of abbreviations and terms- Appendix I
4.3.2.2 Reliability Data Analysis
Table 4.18shows that the reliability coefficient Cronbach’s Alpha for the fourteen items
created to describe product quality is 0.914 which is also above required 0.8. Therefore
the scale is reliable.

78 | P a g e
Table 4.18 Reliability Statistics- Garvin’s dimensions
Reliability Statistics
Cronbach's Alpha N of Items
.914 14
In Table 4.19 it can be noticed that after the removal of each item, the lowest value is
0.902 which is still over the acceptable level of 0.8. This indicates that all items
contribute equally to the Garvin’s scale and a deletion of any item will not change
significantly Cronbach’s alpha value. The scale will still be reliable.
Table 4.19 Reliability Data Analysis for Garments Quality (Internal Correlation)
Item-Total Statistics
Description of each item
Cronbach's Alpha if
Item Deleted
GarmPERF1 ZARA provide a variety of sizes. .913
GarmPERF2 ZARA garments are comfortable. .907
GarmPERF3 ZARA garments are ‘easy care’ (i.e. washing, ironing). .912
GarmFEAT1 Zara garments fit well. .907
GarmREL1 ZARA garments wear well within a specific period of time. .910
GarmCONF1 The ZARA branded garments are of good reputation. .908
GarmCONF2 The description of garments is consistent with product .910
GarmDURA1 ZARA garments are durable (considering material, structure) .902
GarmSERV1 ZARA garments have clear care labels and guarantees. .907
GarmAEST1 ZARA garments are stylish .910
GarmAEST2 ZARA garments look modern and are of original design. .910
GarmAEST3 ZARA garments fabric line/ details are of high quality. .906
GarmPERCQ1 ZARA brands garments are of high quality. .902
GarmPERCQ2 ZARA garments are good value for money. .909
* Full explanations of abbreviations and terms- Appendix I

79 | P a g e
Table 4.20 Summary Item Statistics for Garments Quality
For product quality the inter-item correlation is 0.440, which well above expected value
of 0.30.
Table 4.21 Reliability statistics- GARVIN dimensions
Item Cronbach's
Alpha N of Items
Performance .711 3
Conformance .758 2
Aesthetics .775 3
Perceived Quality .714 2
Reliability & Durability
.775 2
Features & Serviceability
.619 2
Table 4.21 presents Garvin’s Eight Dimensions of Product Quality which were taken
into account in order to conduct this study. Generally, the alpha values for determinants
of service quality are high, except for features and serviceability that are below required
0.7. These items as well as reliability & durability were measured together since both of
them contained only one question which made it impossible to analyze the items
separately. For this reason, the Cronbach’s Alpha value for these 4 dimensions may not
be reliable and the factor rotation will be conducted in order to extract all factors with
eigen values greater than 1 (Field, 2005).
Mean Min Max Range Max / Min Variance N of
Items
Item Means 4.076 3.900 4.340 .440 1.113 .017 14
Item Variances .371 .214 .495 .281 2.315 .010 14
Inter-Item Correlations
.440 .191 .795 .605 4.170 .015 14

80 | P a g e
4.3.2.3 Determinants of Garments Quality in Clothing Industry
Similar approach to service quality is taken to reduce the number of factors in Garvin’s
scale. The first Kaiser’s criterion for extraction has been met as the number of variables
is fourteen, and this criterion is accurate when there are less than 30 variables (Field,
2005).
Table 4.22 Communalities-Garvin dimensions
Initial Extraction
GarmPERF1 1.000 .729
GarmPERF2 1.000 .781
GarmPERF3 1.000 .602
GarmFEAT1 1.000 .625
GarmREL1 1.000 .726
GarmCONF1 1.000 .663
GarmCONF2 1.000 .478
GarmDURA1 1.000 .789
GarmSERV1 1.000 .554
GarmAEST1 1.000 .742
GarmAEST2 1.000 .704
GarmAEST3 1.000 .597
GarmPERCQ1 1.000 .683
GarmPERCQ2 1.000 .601
* Full explanations of abbreviations and terms- Appendix I
Table 4.23 Rotated Component Matrix- Garments
Component
1 2 3
GarmPERF1 .114 .121 .838
GarmPERF2 .306 .284 .779
GarmPERF3 .010 .667 .397
GarmFEAT1 .294 .350 .645
GarmREL1 .076 .823 .206
GarmCONF1 .708 .402 .017
GarmCONF2 .611 .206 .250
GarmDURA1 .486 .721 .180
GarmSERV1 .472 .484 .311

81 | P a g e
GarmAEST1 .843 .073 .161
GarmAEST2 .814 .065 .192
GarmAEST3 .562 .263 .460
GarmPERCQ1 .550 .502 .358
GarmPERCQ2 .301 .707 .107
Extraction Method: Principal Component Analysis. Rotation Method: Varimax with Kaiser Normalization.
.
For garments quality as illustrated in Table 4.23, after SPSS extraction the researcher
was left with three factors. The highlighted items were grouped to the three components
and similarly to service quality factors only loads that exceed 0.5 were taken into
account (Field, 2005). Garments serviceability (GarmSERV1) with its values below 0.5
has been discarded, and this information will be lost. New factor analysis has been
conducted after exclusion GARMSERV1 item (Appendix G).
Table 4.24 Reliability Statistic for new scale (after extraction GARMSERV1)
Reliability Statistics
Cronbach's Alpha N of Items
.907 13
Also Cronbach’s alpha value has changed with the new scale from .914 to .907 (Table
4.24).
Table 4.25 Determinants of Garments Quality in retailing clothing industry
New Factor Determinants of
Product Quality
Questions associated
1. Aesthetics Conformance (2) Garments are of good reputation;
The description of garments is consistent with the
actual product.
Aesthetic (3) Garments are stylish;
Garments look modern and are of original design;
Garments fabric line/ details are of high quality.
Perceived Quality Garments are of high quality.

82 | P a g e
2. Reliability Performance (1) Garments are ‘easy care’.
Reliability (1) Garments wear well within a specific period of time.
Durability (1) Garments are durable.
Perceived Quality (1) Garments are good value for money.
3.Performance Performance (2) The co. provide a variety of sizes;
Garments are comfortable.
Feature (1) Garments fit well.
Source: As per factors extraction- SPPS Data
As per Total Variance Table (Appendix F) it can be seen that the dispersion of the three
factors accounts for 66.23% with the highest value of Factor 1 that accounted for
48.49%.
Table 4.25 shows factors, dimensions of garments quality in retailing clothing industry
which were established for this study after the factor extraction process.
Table 4.26 Descriptive Statistic- New Determinants of garments quality
Determinants Mean Standard
Deviation
1. Aesthetics
4.106 2.709
2. Reliability 4.005 2.155
3.Performance 4.106 1.476
The table above presents new variables for garments quality that were extracted from
the factor analysis and grouped into three main determinants. Similarly to service
quality, using the transform option in SPSS all items have been computed for each
factor separately and then the Descriptive Statistics was used again for new factors
(Appendix F). Table 4.26 shows that ZARA customers are very satisfied with the
quality of ZARA garment as all factors were above the mean value 4 (maximum score
was 5).
The highest value is presented by two determinants ‘performance’ and aesthetics.

83 | P a g e
The customers appreciate diverse styles and designs of ZARA garments, as well as the
wide range of sizes that the brand is providing. The perception of brand, coolness, fit
and style were all ranked high among most of the customers. Determining which factors
are the most important for evaluating garments quality is essential, therefore the
regression analysis will be taken to identify the most significant dimensions.
4.3.2.4 Regression Analysis
The new factors arising after the factor extraction (except GARMSERV1) analysis,
were entered as independent variables, computed and renamed accordingly.
Table 4.27 Variables Entered/ Remover used in the Regression Analysis for Garments
Variables Entered/Removed(b)
Model Variables Entered
Variables Removed Method
1 Performance, Reliability, Aesthetics(a)
. Enter
a All requested variables entered. b Dependent Variable: CUSTSAT1
Table 4.28 Overall fit of the GARVIN model- Model Summary
Model Summary(b)
Model R R Square Adjusted R
Square Std. Error of the Estimate Durbin-Watson
1 .647(a) .418 .400 .43343 2.156
a. Predictors: (Constant) Performance, Reliability, Aesthetics
b. Dependent variable: CUSTSAT1
For the predictors a, R has a value of .647 or 64 % of variances in customer satisfaction,
and therefore it accounts for 64%. The adjusted R2
is very close to the value of R2
and
this shows that the model generalizes well (Field, 2005).

84 | P a g e
The difference for the final model is (.418-.400)1.8%and this means that if the model
were derived from the population rather than a sample it would account for
approximately 1.8% less variance in the outcome.
The Durbin-Watson statistic, as already mentioned-the closer to 2 the value is the better,
and for these data the value is 2.156, which is even better than for service quality, the
assumption has been met.
Table 4.29 ANOVA
Model Sum of
Squares df Mean Square F Sig.
1 Regression 12.965 3 4.322 23.004 .000(a)
Residual 18.035 96 .188
Total 31.000 99
a Predictors: (Constant), Performance, Reliability, Aesthetics b Dependent Variable: CUSTSAT1
The F-ratio value is 23.004 which is significant at p<.001 (as the value Sig. is .000), and
therefore there is a 0% chance that an F-ratio of this value would happen by chance
alone.
Table 4.30 shows details of the model parameters (the beta values) and the significance
of these values.
Table 4.30 Coefficients-Garments
Model
Unstandardized Coefficients
Standardized Coefficients T Sig.
B Std. Error Beta B Std. Error
1 (Constant) .588 .429 1.369 .174
Aesthetics .078 .022 .379 3.500 .001
Reliability .053 .028 .204 1.927 .057
Performance .060 .040 .157 1.500 .137
a Dependent Variable: CUSTSAT1

85 | P a g e
The B-values in this table show the individual contribution of each predictor to the
Garvin model and tell us about the relationship between overall customer satisfaction
(CUSTSAT1) and each predictor.
All garments predictors have positive b-values indicating positive relationships, and that
means that once each of them increases, customer satisfaction increases. Moreover these
values indicate that as for example one item- garments aesthetics increases by one unit,
overall customer satisfaction increase by .078 units (B value for aesthetics).
The coefficient table (Table 4.30) shows that aesthetics (t (3.500), Sig.001) and
reliability (t (1.927), Sig.057) are both significant predictors of customer satisfaction
with garments quality, as Sig. value is <.05.
As already explained the standardized β values can provide a better insight into the
importance of a predictor in the model. The standardized β values of aesthetics and
reliability are .379 and .204 respectively indicating the level of importance in the
garments quality model.
Aesthetics is the best predictor of customer satisfaction with garments quality with its
highest standardized coefficient, T values and lowest significance.
The Table 4.31 presents predictors of overall customer satisfaction with product quality
grouped in order of significance. Please refer to ‘Appendix K’ for Additional Statistics.
Table 4.31 Predictors of Garments Quality in order of importance
Rank Predictor Items
1 Aesthetics Good reputation of garments, consistent description on the
labels. Stylish, modern looking garments of high quality.
2 Reliability ‘Easy care’ garments that wear well within specific period
of time, good value for money.
3 Performance Comfortable garments; variety of sizes provided.
Source: as per factors extraction- SPSS

86 | P a g e
4.3.3 Overall Customer Satisfaction
4.3.3.1 Descriptive Statistics- Overall Customer Satisfaction
Two last questions of the questionnaire aiming to investigate the overall level of
customer satisfaction were not part of SERVQUAL or Garvin’s Eight Dimensions of
Product Quality and therefore are to be evaluated separately.
Table 4.32 Descriptive Statistics- Overall Customer Satisfaction
Mean
CUSTSAT1 4.1000
CUSTSAT2 4.1600
The overall level of customer satisfaction with ZARA services and garments is over
4.00 which means that most of the customers are fairly satisfied. The mean value of the
second item CUSTSAT2 is 4.16, that is, the customers expressed their intention to re-
visit the shop soon.
4.3.3.2 T-Test
To further investigate the levels of satisfaction the analysis based on the gender of
respondents was performed.
Table 4.33 T-Test- Overall Customer Satisfaction – Gender
Gender N Mean
CUSTSAT1 MALE 31 4.0000
FEMALE 69 4.1449

87 | P a g e
Data presented in Table 4.33 tell that female customers are slightly more satisfied with
ZARA services and products than males. This finding suggest that if there was more
focus on males satisfaction put in place by the company the average level would rise.
Because the results of this test have shown some differences when it comes to gender
and customer satisfaction, it has been decided to run another analysis based on
nationality.
Table 4.34 T-Test- Overall Customer Satisfaction – Nationality
Nationality N Mean
CUSTSAT1 NON-IRISH 31 4.0323
IRISH 69 4.1304
When it comes to customer satisfaction and nationality, again there is only a slight
difference between Irish and Non-Irish customers. Irish customers tend to be slightly
more satisfied with the level of customer service and product quality received in ZARA;
4.03 versus 4.13 in the scale of 1-5.
.

88 | P a g e
5. Conclusions and Recommendations 5.1 Introduction
This chapter will present the author’s conclusions and implications, based on the
analysis provided in Chapter 5, which aim to answer the research questions.
Implication for management and recommendations for future research will be addressed
at the end of this Chapter.
5.2 Research questions
The purpose of this study was to measure customer satisfaction with both service and
garments quality delivered by ZARA Ireland. The study examined customer
satisfaction with service quality determinants (SERVQUAL), product quality
dimensions (Garvin Eight Dimensions of Product Quality), and overall customer
satisfaction with ZARA Ireland.
The research aimed to answer the following research objectives that were constructed
specifically for this study:
1. To apply, rank and describe the impact of SERVQUAL factors on customer satisfaction
in ZARA Ireland.
2. To apply, rank and describe the quality dimensions of ZARA products in Ireland and
their impact on customer satisfaction using Garvin eight dimensions of Product Quality.
3. To measure and describe the overall customer satisfaction with ZARA services and
products in Ireland.

89 | P a g e
1. To apply, rank and describe the impact of SERVQUAL factors on customer
satisfaction in ZARA Ireland.
Traditionally, service quality has been conceptualized as the difference between
customer expectations regarding a service to be received and perceptions of the service
being received (Grönroos, 2001; Parasuraman, Zeithaml, and Berry, 1988).
Service quality has been also referred as the extent to which a service meets customers’
needs or expectations (Lewis and Mitchell, 1990).
Results from this study show that all factors selected affect the customer satisfaction to
the great extent. Customer service is the most powerful stimulant of brand loyalty.
After the data analysis it has been discovered that different aspects of customer service
such as understanding/knowing the customer, security, tangibles, courtesy, and
serviceability play a role in customer satisfaction and are valuable aspects to the
operations of retail services.
To investigate the dimensions of service quality in the retailing clothing industry in
Ireland the SERVQUAL scale was adopted. The validity and reliability of the scale was
estimated by providing the reliability data analysis (Table 5.6) and by checking the
Cronbach’s Alpha values for the scale and for each dimension of service quality. The
reliability coefficient for the SERVQUAL is 0.923 which is at over 0.8 and therefore
means that the scale is reliable (Bryman, et al., 2009).
Moreover, to further explore the determinants of service quality, a factor extraction
(varimax rotation) was executed. This analysis left researcher with five factors, and
helped to exclude loads with the value lower that 0.5 (Field, 2005). One factor out of 20
has been excluded from the research due to low reliability- service credibility
(SERVCRED3).

90 | P a g e
However, to determine which factors are the most important when evaluating the
quality of service, regression analysis was conducted. Serviceability (t (2.578), Sig.012)
and understanding (t (2.083), Sig.040) are both significant predictors of customer
satisfaction with service quality followed by tangibles, courtesy and security
respectively.
After the extensive review of the literature and the data analysis of this research it is
clear that service quality in its general aspect has a very significant role in creating
satisfaction of ZARA customers.
2. To apply, rank and describe the quality dimensions of ZARA products in Ireland and
their impact on customer satisfaction using Garvin eight dimensions of Product Quality.
Product quality is one of the most important construct in the marketing which has
significant effect on the overall customer satisfaction. According to Tsiotsou (2005), as
already mentioned in the Literature Review Chapter, with the higher quality of the
goods customer satisfaction with services increases and in turn with low quality of the
products evaluation of the service in customer’s eyes will be influenced negatively.
Therefore, quality improvement has become the important tool in differentiating the
products and services in the competitive market. As per Jones &Hill (2010) in order to
gain a competitive positioning the firm must stress product innovation and quality- as-
excellence which is defined by the author as a perspective that relates to product’s
design and styling, its aesthetic appeal, its functions and features and the level of service
associated with the delivery of the product.
Customers’ perception of clothing quality seems to be multidimensional and includes
both concrete and abstract features of the product.

91 | P a g e
Personal variables like knowledge, interest, and involvement may be all key factors in
determining how consumers evaluate quality (Hines & Swinker, 2001).
To investigate the dimensions of product quality in the retailing clothing industry in
Ireland the Garvin Eight Dimensions of Product quality was adopted. The validity and
reliability of the scale were estimated by providing the reliability data analysis (Table
5.6) and checking the Cronbach’s Alpha values for the scale and separately for each
dimension of product quality. The reliability coefficient for the Garvin’s scale is 0.914
which is at over 0.8 which means that the scale is reliable (Bryman, et al. 2009).
The garments dimensions factor analysis was conducted in the same way as for service
quality, which means by factor extraction using varimax rotation.
As a result of analysis the dimensions were grouped into three factors: Aesthetics,
Reliability and Performance. One item has been removed completely from the further
research garments serviceability 1 (GARMSERV1) because of the value lower that 0.5
which means that the item was not reliable (Field, 2005).
Regression analysis that was taken to determine which factors are the most important
when evaluating the quality of garments has shown that aesthetics, with its highest
value t and lowest significance (t (3.500), Sig.001) is the best predictor of customer
satisfaction with garments quality. This can be due to the fact that majority of
participants were found to be female (69 per cent) and they are generally follow fashion
and trends more than males.
Good reputation of garments, consistent description on the labels as well as stylish,
modern looking garments of high quality seem to be the most important factors of
satisfaction for ZARA customers.
Summarizing it is clear and appropriate to state that the higher the quality of the ZARA
products the higher the customers satisfaction with ZARA in general.

92 | P a g e
3. To measure and describe the overall customer satisfaction with ZARA services and
products in Ireland.
In order to reach the answer to that objective the analysis on the second last question
was adopted. Respondents were asked to assess their overall satisfaction by marking the
score in the scale of 1 to 5.
Data gained from analysing the statistical mean of overall satisfaction shows the
average satisfaction in the scale of 1 to 5 is 4.10, which is fairly high. The general level
of customers’ satisfaction at ZARA is very good but can still be improved. Satisfaction
level is very significant since it determines whether the customer is just satisfied or may
even become the apostle of the brand (Heskett et al., 1997).
When it comes to the influence of both gender and nationality on overall satisfaction, it
was found that these factors decide only marginally.
Females’ customers are only slightly more satisfied than males; females average
satisfaction level is 4.14 whereas males’ satisfaction is equal to 4.00. Also nationality
affects satisfaction only slightly. The data obtained shows that Irish customers are
satisfied at the level of 4.13 whereas non-Irish are satisfied at the level of 4.03 in the
scale of 1 to 5.

93 | P a g e
5.3 Recommendations
Quality is being considered by many as one of management’s top-most competitive
priorities and a prerequisite for sustenance and growth. The quest for quality
improvement has become a highly desired objective in today’s intensely competitive
global market-place (Sureshchandaret al.2010). Tsiotsou, (2006) found a positive direct
effect of perceived quality on purchase intentions. Perceived product quality seems to
play an important role in both customer satisfaction and purchase intentions.
All sets of data analysis conducted during this research bring a view on how to plan
marketing strategies when targeting the ZARA audience. After running the data analysis
it became clear to the author that aspects as age or nationality are not as significant to
customer satisfaction. One of the implications for ZARA management is to review the
company SWOT analysis with the special emphasis on the company strengths and
weaknesses. They should try to ameliorate their strengths while improving and
minimizing their weaknesses.
It would be suggested by the author of this study that more focus is in place on the male
gender since the level of satisfaction slightly drags the average satisfaction down. This
could be achieved through many strategies to be identified by a separate research that
would need to take place in order to analyse the reasons why males are less satisfied.
The author would suggest such research and act on the findings. The retailer should also
focus on the high and low scored determinants of both service and product quality.
Thus, critical factors of customer satisfaction with ZARA service quality are
serviceability and understanding while less important for the customer proved to be
security and courtesy. ZARA do not provide any additional services to customers.

94 | P a g e
In order to further increase customer satisfaction the researcher thinks that proper
additional services for example tailoring service would improve overall shopping
experience.
Findings of this research suggest that understanding/ knowing the customer is the
second most important determinant of ZARA customers ‘satisfaction. Customers
appreciate employees that are never too busy to respond to their queries, provide
appropriate explanation on garments, and when their needs are recognized. Therefore,
resources should be allocated to train employees, so they can feel more professional and
confident while dealing with customers.
The tangibles like stores atmosphere and décor, employees’ uniform appear to be also
important for customers. Management of ZARA should focus on clean, modern looking
arrangements and interior that should reflect the image of the brand.
Since the research was also assessing customer satisfaction with product quality, ZARA
garments dimensions were evaluated. The dimension of greatest importance is aesthetic.
It is extremely important for ZARA’s customers that the garments are stylish and of
original design, also the fabric line and the details are meeting their standards.
The designers and manufacturers should concentrate on running out of trends and
always astonish their customers.
5.4 Limitations and recommendations for further research
Due to time and resource constraints, it was possible to target only 100 people to
participate in the survey, which limited the generalisation of the result. Therefore, it is
recommended to the future study that more participants are appreciated in a survey like
this.

95 | P a g e
Furthermore, comparative studies might be conducted to assess customer satisfaction in
ZARA stores Ireland vs. ZARA stores in United Kingdom or comparing the gap
between perceived and received level of customer satisfaction.
The study was to measure how satisfied customers are with regards to ZARA and the
quantitative research has been adopted. It is recommended for the future study to adopt
a qualitative approach to understand better the consumer’s attitudes and experiences.

96 | P a g e
6. Reflections on learning
My personal thesis sentence:
Success consists of going from failure to failure without loss of enthusiasm.
(Winston Churchill)
These words are of great importance to me; to me they mean that one can learn from
failure if one doesn’t give up. The key being not giving up!
The whole dissertation process has been very important for me, especially when it came
to developing my independent working skills. It was, however, challenging at times.
In the beginning, I thought that everything would be straightforward and that I would be
able to manage my own time, but it was quiet hard juggling between full-time work,
part-time College and a “personal life”. In order to prioritise the dissertation, I started
my work on it from the onset of second semester of second year.
Learning Style
Rita and Kenneth Dunn describe Learning Styles as the way in which each learner
begins to concentrate process and retain new difficult information. Kolb (1984) suggests
that the leaning is a circular process and it happens in four stages in a learning cycle.
These four phases of the learning process are: feeling and sensing, watching, thinking,
doing (Kolb, 1984). Referring to the Kolb’s Learning Cycle the researcher considers
herself as a theorist that like to learn using abstract conceptualization and reflective
observation (Adults Learning Styles, 2008). This thesis process as well as Master
Program gave the researcher chance to focus more on ideas and abstract concept.

97 | P a g e
January 2013
I started to think about the potential thesis topic from December 2012 and wanted to
make my topic of the dissertation relevant to aspects of my personal interests, thus find
a topic that I would enjoy. The areas of the Services Marketing, Project Management, as
well as Consumer Behaviour were of interest to me, so I decided look at the concepts of
satisfaction/ loyalty as the foundation of my potential thesis topic. After the initial
research my interests were formed around Zara Ireland, which is a well known company
both worldwide and in the Irish market.
The title that I chose was a follows:
Quality of service and product as the main factors influencing customers’ satisfaction in
the clothing retailing industry in Ireland- case study of Zara Plc.
On the first meeting the tutor introduced the plan of the module for the Research Project
and distributed the forms to complete- Idea Generation Sheets. After receiving the
positive feedback for the topic of my interest I have decided to start my works on the
proposal project straight away. The thesis proposal feedback brought to my attention
some valuable comments/concerns. Dr Gross appreciated the positive aspects of my
work, but also noticed that the rationales, structure and methodology weren’t as clear as
it could be in other words that I would need to frame the project so that ends up being
something that can be measured/quantified or evaluated in some way. A more in-depth
structure would also be required.
The valuable thing I learnt from this instance was that it is really very important to show
your contribution in terms of questioning and answering everything from the very
beginning. I felt the comments received from Dr Gross reinforced me to work hard and
improve few aspects of my work.

98 | P a g e
If I had to do it again I would probably have put more effort and research into the
area/topic I want to explore with the special emphasis on past researches and the results
of these studies. This was an important thing to learn and something I will take with me
for the future, as it will save valuable time and effort.
After receiving the formal confirmation from the College that I have completed all
modules and I was granted a supervisor I decided to contact Ms Lolich the very same
day to arrange the first meeting. This proved to be great help. Ms Lolich approved the
title of my topic, gave me some tips in relation to the questionnaire and academic
sources I might find useful while formulating my objectives.
The title of the thesis covers the area which I personally have a general interest in, it is
also an area that can be measured easily thus the thought of researching and outlining
the thesis became less of a task.
I set personal deadlines that helped me to complete particular sections of the thesis. I
had four face to face meetings with my supervisor, each time coming away with a
distinctive plan of what I hoped to achieve and the steps necessary to ensure that this
happened. According to the principles of cognitive learning, the goals and expectations,
which created imbalance, and tension motivated me to act. The reward (award of a
Master’s degree) was not the most important at the time and not influenced this learning
process (McShane et al. 2006). This process helped me to achieve smaller goals. As a
result I personally have learned to be organised, self-disciplined, and become better at
time management. These are skills which I can confidently take with me in future
projects I undertake as well a potential future employment.
It was at times quite difficult and sometimes frustrating working on this task namely in
the beginning, as I was not sure if the direction which I am taking was the right one.

99 | P a g e
In developing my dissertation I firstly started to review again the questionnaire and
Literature Review Chapter as well as spent some time on reformulating the Research
Objectives.
I concentrated also on the project framework and the factors that may influence
customer satisfaction from both service quality and product quality. Trying to find a
framework for this thesis, I firstly started to search on the DBS databases (mainly: The
Academic Search Premier and The Emerald) and articles related to customer
satisfaction. In the beginning I was happy with the Kano’s model of customer
satisfaction (Theory of attractive quality), which I came across in the article by Kano
(1984) “Attractive quality and must-be quality”, The Journal of the Japanese Society for
Quality Control.
Figure 6.1 Kano model
Source: Kano, 1984
As well as after reviewing my framework, I started to think whether the factors that I
want to explore in ZARA are shown in the chosen graph.

100 | P a g e
I had some serious concerns as in my opinion the model was missing some important
factors that would have been crucial for measuring the product quality. I was happy
with the chosen framework, however after thinking about it more I realized some
important elements were missing. After the discussion with my supervisor, I decided to
search for another framework that would help me to concentrate on different dimensions
of product in the type of retail establishment
I researched a variety of sources such as industry journals and key texts. This at first felt
overwhelming. I asked the library staff for support in accessing the information I
required. I learnt that asking for help is a good thing.
Finally, I found a framework in the Marketing Journal by Garvin (1984) 'What Does
"Product Quality" Really Mean?', Sloan Management Review. As I now had my base, I
proceeded ahead with obtaining information around this. Primarily, I focused on the
dimensions of product quality (antecedents) that influence the customer satisfaction.
I had to also take into account the second framework for my thesis that concerned
service quality. I had to disregard information that I felt at the time that were not
relevant to my topic. Also as I found this content to be vague, and the ideas I felt didn’t
always follow logic.
I started my part of the literature review from exploring the antecedents of customer
satisfaction, moving toward determinants of service quality, SERVQUAL, differences
between goods and services, Garvin’s Eight Dimensions of Product Quality. The last
part of this section was to find the relevant literature that shows the relationship
between product quality and satisfaction.
July 2013
After the Introduction Chapter I started to think about the method which can help me
collect the necessary information.

101 | P a g e
I prefer to work with the numbers so from the beginning I wanted to work with the
statistics and decided to choose the quantitative rather than qualitative type of the
survey. I found a valid survey, the bases for my questionnaire questions. I decided to
formulate my questions based on SERVQUAL with determinants of service quality and
Garvin’s Eight Dimensions of Quality as a base for garments survey. The questionnaires
were distributed among my friends, co-workers using snow-bowling sampling method
and using https://www.esurveycreator.com.
The surveys have been distributed over a week period of 3rd of July 2013. The
collection of questionnaires lasted more than 2 weeks. I distributed over 100
questionnaires which were floated among the general public within the city of Dublin.
The e-mail with the link for the questionnaires was sent among my work colleagues and
asked them to fill the questionnaire in if they are ZARA customers. Survey was targeted
to the customers of ZARA services and products.
Data obtained in this regard was entered into the system and analysed through SPSS
15.0, starting from the Saturday, 20th July.
After all data obtained from my surveys was entered to SPSS 15.0 I could start to
analyse it. It was quite difficult at the time to analyse the statistical data; there was a
time that I was very confused as I was not sure if I fully understood the system. This
experience really helped me develop my analytical skills and search the answers for my
questions.
I personally have learned from this process that it is very important to trust you and
believe that we are able to work and manage our time properly.
During this time I was also working on improving the individual sections of the
dissertation as well as combining these sections together. Then I started to think about
the conclusion and recommendations chapter.

102 | P a g e
Moving through the research process helped me to comment on formulated research
objectives.
I also learned to appreciate the feedback that might have very powerful effect. The
feedbacks that I received from my supervisor caused me to continue to think more about
my topic and resulted in additional thinking.
August
After the Conclusion/ Introduction chapters were completed, I began to concentrate on
the graphical aspect of my thesis like formatting, graphs, tables, etc. Going from past
experiences I have learnt this part is very important and should be given necessary time
to review. Once again, time management, and the evaluation of the time is what is
needed, and this is for sure one of the lessons I have been taught.
The dissertation process has been very important for me personally. First of all I have
developed my independent learning skills.
I also strongly believe that this experience has improved my confidence in my ability, I
feel it was a great conclusion for the two years I spent in College, I am now really
excited and well-motivated for the tasks that lie ahead.
I am truly happy with the final outcome of this thesis, but I do appreciate even more the
lessons I have been taught and the feelings that accompanied with the creation and
completion of this process, from turning nothing into something valuable. It has shown
me that you can get wherever you want if you are working hard enough and you believe
in your dreams. It is my personal achievement and that is supporting my personal thesis
sentence which I have mentioned at the beginning of my personal journal.
I am very proud of where I am now and what I have done over the past two years. Time
has really flown by; it was not always easy to manage everything and to make
everything work but I believe it was worth it! And I would do it again in a heartbeat!

103 | P a g e
Bibliography
Abdullah, D. N. M &A and R, F (2010), Influence of Service and Product Quality
towards Customer Satisfaction: A Case Study at the Staff Cafeteria in the Hotel
Industry’, International Journal of Human and Social Sciences 5(7), pp. 1-6.
Almossawi, MM (2012), Customer Satisfaction in the Mobile Telecom Industry in
Bahrain: Antecedents and Consequences', International Journal Of Marketing Studies,
4, 6, pp. 139-156, Business Source Complete, EBSCOhost, viewed 10 March 2013.
Angelova, B, Zekiri, J (2011), Measuring Customer Satisfaction with Service Quality
Using American Customer Satisfaction Model (ACSI Model), International Journal of
Academic Research in Business and Social Sciences, 1-27, Business Source Complete,
EBSCOhost, viewed 10 March 2013.
Armstrong, G &Kotler, P (2010), Marketing- An Introduction, New Jersey: Pearson
(Global Edition).
Business Sector, Retail Ireland, available from:
http://www.ibec.ie/IBEC/BA.nsf/vPages/Business_Sectors~retail-ireland
[Accessed May, 15th
2013]
Bebko, Ch P (2000) Service intangibility and its impact on consumer expectations of
service quality, Journal of Service Marketing, 12 (1), 9-26
Bhaskar, N,U, Shekhar, B, R (2011), Impact of Service Quality on Apparel Retail
Customer Satisfaction - A Study of Select Metropolitan City Hyderabad, Journal of
Management Research, 3(2).
Billington, C &Nie, W (2009), The Customer Value proposition should drive supply
chain design: an example in mass retailing, Perspectives for Managers.
Bitner, M J &Zeithaml, V, A (2003) Service Marketing, 3rd
ed, McGraw Hill, New Delhi
in Akbar, M M and Parvez, N (2009) Impact of service quality, trust, and customer
satisfaction on customers’ loyalty, ABAC Journal, 29 (1), 24-38
Blumberg, B, Cooper D R, Schindler P S (2008) Business Research Methods, 2nd
ed.,
Berkshire: McGraw-Hill
Brown, T, Churchill Jr., G, & Peter, J (1993), 'Research Note: Improving the
Measurement of Service Quality', Journal Of Retailing, 69, 1, p. 127, Business Source
Complete, EBSCOhost, viewed 6 April 2013.
Bryman, A & Cramer, D (2009), Quantitative Data Analysis with SPSS 14, 15 & 16: A
guide for Social Scientists, 1st Edition, East Sussex: Routledge.
Burns, R. C (2003) Alternate Measurement Approaches to Recreational Customer
Satisfaction: Satisfaction- Only Versus Gap Scores, 25(4), 363-80

104 | P a g e
Carman, J.M. (1990) Consumer perceptions of service quality: An assessment of the
SERVQUAL dimensions, Journal of Retailing, 66, pp. 33± 55.
Capell, K (2008), ZARA thrives by breaking all the rules, BusinessWeek (October, 20th
)
Ching-Chow, Y 2005, 'The refined Kano's model and its application', Total Quality
Management & Business Excellence, 16, 10, pp. 1127-1137, Business Source Complete,
EBSCOhost, viewed 12 April 2013.
Chua, M J (2011), Beijing Watchdog Group Blasts ZARA for Failing Apparel Quality
Tests, available from:
http://www.ecouterre.com/beijing-watchdog-group-blasts-ZARA -for-failing-apparel-
quality-tests/ [Accessed May, 26th
2013]
Crofton S, O & Dopico, L, G (2007), Zara-Inditex and the growth of fast Fashion,
Essays in Economic & Business History- Vol. XXV.
Cronbach, L. J. (1975), Beyond the two disciplines of scientific psychology, American
Psychologist, 30(2), 116-127.
Crosby, Philip B. (1979), Quality Is Free: The Art of Making Quality Certain, New
York: New American Library.
Crossan, F. (2003), Research philosophy: towards an understanding, Nurse researcher,
11(1), 46-56.
Dabholkar, A.P., Thorpe, D.I. & Rentz, J.O. (1996), “A measure of service quality of
retail stores: Scale development and validation”, Journal of the Academy of Marketing
Science, Volume 24, Number 1, Pages 3-16.
Didier, S M , (2003) The marketing function and consumer satisfaction online, PhD
Thesis, Capella University.in Gocek, I, Kursun, S and Beceren, Y, I The Perception of
Customer Satisfaction in Textile Industry According to Genders in Turkey,
International Journal of Human and Social Sciences, 2:6 (2007), 341-44.
Dodds, W B (2002) The effects of perceived and objective market cues on consumers’
product evaluations, Marketing Bulletin, 13, 1–15.
Edvardsen, B., Tomasson, B. and Ovretveit , J. (1994), Quality of Service: Making it
Really Work, McGraw-Hill, New York, NY.
Edvardsson, B., Gustafsson, A. and Roos, I. (2005), “Serviceportraits in service
research: a critical review”, InternationalJournal of Service Industry Management, Vol.
16 No. 1,pp. 107-21.
Eysteinsson, F, & Bjornsdottir, B 2012, 'SERVICE QUALITY IN CONVENIENCE
STORES', Journal of The Academy of Business & Economics, 12, 3, pp. 85-90,
Business Source Complete, EBSCOhost, viewed 2 June 2013.

105 | P a g e
Ferdows, K, Lewis, M, &Machuca, J 2004, 'Rapid-Fire Fulfillment', Harvard Business
Review, 82, 11, pp. 104-110, Business Source Complete, EBSCOhost, viewed 24 March
2013.
Field, A (2005), Discovering Statistics Using SPSS, 2nd
Edition, London: SAGE
Publications.
Finn, D, & Lamb Jr., C 1991, 'An Evaluation of the SERVQUAL Scales in a Retailing
Setting', Advances In Consumer Research, 18, 1, pp. 483-490, Business Source
Complete, EBSCOhost, viewed 7 April 2013.
Fiore A.M, Damhorst M.L (1992), Intrinsic cues as predictors of perceived quality of
apparel, Journal of Consumer Satisfaction, Dissatisfaction and Complaining Behaviour,
V. 5, 168- 178.
Gagliano, K,B. & Hathcote, J (1994), Customer expectations and perceptions of service
quality in apparel retailing, Journal of Services Marketing, Vol. 8 No. 1, pp. 60-9.
Gaur, S.S. and Agrawal, R (2006), “Service quality measurement in retail store context:
A review of advances made using SERVQUAL and RSQS”, The Marketing Review,
Volume 6, Number 4, Pages 317-330.
Garvin, David A (1983), "Quality on the Line," Harvard Business Review, 61
(September-October), 65-73.
Garvin, DA 1984, 'What Does "Product Quality" Really Mean?',Sloan Management
Review, 26, 1, pp. 25-43, Business Source Complete, EBSCOhost, viewed 8 June 2013.
Garvin, DA 1987, 'Competing on the eight dimensions of quality', Harvard Business
Review, 65, 6, pp. 101-109, Business Source Complete, EBSCOhost, viewed 9 June
2013.
Garvin, D, A (1988)Managing Quality. The Strategic and Competitive Edge. The Free
Press, New York.
Garvin, D.A (1990), Competing Through Quality, Harvard Business Review, Business
Source Complete, EBSCOhost, viewed 9 March 2013.
Ghemawat, P & Nueno, J.L (2003), ZARA: Fast Fashion, Harvard Business School
Press. Case No 703-497.
Globaltimes.cn-Fast expansion leads to ZARA ’s bad look in quality, available from:
http://www.globaltimes.cn/business/industries/2011-04/644156.html
[Accessed May, 26th
2013]
Golder, P ,Mitra, D & Moorman, C (2012), 'What Is Quality? An Integrative
Framework of Processes and States', Journal of Marketing, 76, 4, pp. 1-23, Business
Source Complete, EBSCOhost, viewed 9 April 2013

106 | P a g e
Gorst J, Kanji G, Wallace W (1998) Providing customer satisfaction, Total Quality
Management, 9(4&5), pp. 100–103.
Griffin, J (1995) Customer loyalty: How to earn it, how to keep it. New York:
Lexington Books.
GrupoInditex press Annual, 2012, available from:
http://www.inditex.com/annual_report/en/ [Accessed May, 26th
2013]
Grönroos, Ch (2001), The perceived service quality concept – a mistake? Managing
Service Quality, Vol. 11 No. 3, pp. 150-2.
Haines, S (2009),The product manager’s desk reference, ed. 9th, New York: McGraw
Hill.
Hanif, M, Hafeez, S, and Riaz, A (2010) Factors Affecting Customer Satisfaction.
International Research Journal of Finance and Economics, 60, p. 44-52. Available
from: http://www.eurojournals.com/irjfe_60_04.pdf [Accessed 12 May 2013].
Hemantha, YY 2012, 'Indian Consumer's Perception of Spanish Fashion Brand ZARA ',
Advances In Management, 5, 4, pp. 52-58, Business Source Complete, EBSCOhost,
viewed 9 March 2013.
Heskett, J, Jones, T, Loveman, G, Sasser Jr., W, & Schlesinger, L (1994), 'Putting the
Service-Profit Chain to Work', Harvard Business Review, 72, 2, pp. 164-170, Business
Source Complete, EBSCOhost, viewed 21 March 2013.
Heskett, James L, Sasser, W Earl and Schlesinger, Leonard A (1997), The Service Profit
Chain, The Free Press, New York, USA
Heskett, J, Jones, T, Loveman, G, Sasser, J, & Schlesinger, L (2008), 'Putting the
Service-Profit Chain to Work', Harvard Business Review, 86, 7/8, pp. 118-129,
Business Source Complete, EBSCOhost, viewed 21 March 2013.
Hines, J, & Swinker, M (2001), 'Knowledge: a variable in evaluating clothing quality',
International Journal Of Consumer Studies, 25, 1, p. 72, Business Source Complete,
EBSCOhost, viewed 9 June 2013
Hokanson, S 1995, 'The deeper you analyze, the more you satisfy customers', Marketing
News, 29, 1, p. 16, Business Source Complete, EBSCOhost, viewed 17 March 2013.
Hoyer, W. D., & MacInnis, D. J. (2001), Consumer Behaviour, 2nd ed., Boston:
Houghton Mifflin Company.
Hume, M (2011), The secrets of ZARA's success, Available online:
http://fashion.telegraph.co.uk/news-features/TMG8589217/The-secrets-of-ZARA s-
success.html[Accessed on 24th
March, 2013]

107 | P a g e
Inditex, FY2012 Results Presentation 13 March 2013, available from:
http://www.google.ie/url?sa=t&rct=j&q=&esrc=s&frm=1&source=web&cd=1&ved=0
CCsQFjAA&url=http%3A%2F%2Fwww.inditex.com%2Fen%2Fdownloads%2Fpres_a
nual_12.pdf&ei=JGTUdjnAoyQ7Ab4yYGICw&usg=AFQjCNGhRyisM71UApvpKBV
KHed_gPPWcA [Accessed May, 15th
2013]
Inditex Annual Report (2011), available from: www.inditex.com[Accessed May,
15th
2013]
Jacoby, J& Kyner, D (1973), Brand Loyalty vs. Repeat Purchasing Behavior,Journal of
Marketing Research, 10 (February), 1–9.
Jankowicz, A.D (2005), Business Research Projects, 4th
ed, London: Thomson Learning
Johnson, G, Whittington, R & Scholes, K (2011), Exploring Strategy, London: Prentice
Hall.
Jones, T, &Sasser Jr., W 1995, 'Why Satisfied Customers Defect', Harvard Business
Review, 73, 6, pp. 88-91, Business Source Complete, EBSCOhost, viewed 19 March
2013.
Jones and Hill (2010), Theory of Strategic Management, 9th
ed, Washington: South-
Western Cengage Learning
Kano, N. (1984), Attractive quality and must-be quality, The Journal of the Japanese
Society for Quality Control, April, pp. 39-48.
Kano, N. et al. (1996) Attractive quality and must-be quality, The Best on Quality, 7
(Milwaukee, WI: ASQCQuality Press).
Kasper, H, Helsdingen, P, Gabbott, M (2006), Services Marketing Management, A
Strategic Perspective, 2nd
ed. West Sussex: Wiley.
Kelemen, M.L (2003), Managing Quality,University of Keele, Sage Publications Ltd.
Kolb, J. A. (1984) Experiential Learning experience as the source of Learning and
Development Prentice-Hall, Englewood Cliffs, NJ.
Koskennurmi-Sivonen, R, Pietarila, P (2009), Quality Clothes – An Outline of a Model
for Assessing the Quality of Customized Clothing, Nordes 1.
Kreknina, A (2012), ZARA plans to open over 50 shops in Russia every year, available
from:http://rbth.ru/articles/2012/10/25/ZARAplans_to_open_over_50_shops_in_russia_
every_year_19449.html [Accessed May, 15th
2013]

108 | P a g e
Kumar, N, & Linguri, S 2006, 'Fashion sense', Business Strategy Review, 17, 2, pp. 80-
84, Business Source Complete, EBSCOhost, viewed 15 May 2013.
Lancaster, G (2012), Research Methods in Management: A concise introduction to
research in management and business consultancy, Burlington:Butterworth-
Heinemann.
Leenheer, J &Tammo H.A. Bijmolt (2008), “WhichRetailers Adopt a Loyalty
Program?An Empirical Study, Journal of Retailing and Consumer Services, 15 (6),
429–42.
Lewis, B.R (1993), Service quality measurement, Marketing Intelligence and Planning,
Vol. 11 No. 4, pp 4-12.
Lewis, B.R. and Mitchell, V.W. (1990), "Defining and measuring the quality of
customerservice", Marketing Intelligence & Planning, Vol. 8, No. 6, pp. 11-17.
Liu CT, Guo YM, Lee CH (2011) The effects of relationship quality and switching
barriers on customer loyalty, International Journal of Inf. Management 31:71-79,
Business Source Complete, EBSCOhost, viewed 12 April 2013.
Lopez, C and Fan (2009), Internationalisation of the Spanish Fashion Brand ZARA,
Journal of Fashion Marketing and Management, 13:2, 279-296, Business Source
Complete, EBSCOhost, viewed 12 April 2013.
Lovelock, C. (2000), “Christopher Lovelock”, in Fisk, R.P.,Grove, S.J. and John, J.
(Eds), Service Marketing Selfportraits:Introspections, Reflections, and Glimpses from
theExperts, American Marketing Association, Chicago, IL.
Lovelock, C. & Gummesson, E. (2004),Whither service marketing? In search of a new
paradigm and fresh perspective”, Journal of Service Research, Vol. 7 No. 1, pp. 20-41.
Mangold, G.W & Babakus, E (1991), Service quality: the front stage- perspective vs the
back stage perspective, Journal of Services Marketing, Vol. 5 No. 4, Autumn, pp 59-70.
Mehta, Pradip V, Bhardwaj, Satish K. (1998), Managing Quality in the Apparel
Industry, National Institute of Fashion Industry and New Age International (P) Ltd.,
Publishers
McShane, S, L &Glinow, M, A (2006), Organizational Behaviour, 3rd
ed. McGraw Hill
Miller, D, & Foust, J 2003, 'Classifying Services by Tangibility/Intangibility of
Attributes and Benefits', Services Marketing Quarterly, 24, 4, pp. 35-56, Business
Source Complete, EBSCOhost, viewed 24 March 2013.
Modi S, & Jhulka D (2012),Consumer Buying Behaviour: Changing Shopping Patterns,
International Journal of Business Management, Vol 3(3),527-530, EBSCOhost, viewed
12 May 2013.

109 | P a g e
Moeller, S (2010) Characteristics of services – a new approach uncovers their value,
Journal of Services Marketing, 24/5, 359-68
Nazari, M, &Divkolaei, M (2012), 'Prioritizing the Effective Factors to Customer's
Satisfaction', International Journal Of Business & Management, 7, 2, pp. 236-242,
Business Source Complete, EBSCOhost, viewed 10 March 2013.
Oliver, Rust, and Varki (1997), “Customer Delight: Foundations, Findings, and
Managerial Insight,” Journal of Retailing, 73 (3), 311–36.
Oliver, R.L (2010) Satisfaction: A behavioural Perspective on the Consumer, 2nd
ed,
M.E Sharpe Inc., New York.
Parasuraman, A, Zeithaml, V, & Berry, L (1985), 'A Conceptual Model of Service
Quality and Its Implications for Future Research', Journal Of Marketing, 49, 4, pp. 41-
50, Business Source Complete, EBSCOhost, viewed 24 March 2013.
Parasuraman, A, Zeithaml, V A and Berry, L (1988) SERVQUAL: A multiple-item
scale for measuring consumer perceptions of service quality, Journal of Retailing,
64(1), 12 – 40, Business Source Complete, EBSCOhost, viewed 5 March 2013.
Parasuraman, A, Zeithaml, V and Berry, L (1996) The behavioral consequences of
service quality, Journal ofMarketing, 60, 31–46 in Tsiotsou, R(2006) The role of
perceived product quality and overall satisfaction on purchase intentions, International
Journal of Consumer Studies, 30 (2), 207–217
Project Management Institute, A Guide to the Project Management Body of Knowledge
(PMBOK Guide) (3rd
Ed.), Newtown Square, PA: Project Management Institute, 2000.
Rao, A R & Monroe, K B (1989), The effect of price, brand name, and store name on
buyers’ perceptions of product quality: an integrative review, Journal of Marketing
Research, 26, 351–357
Remenyi, D., Williams, B., Money, A. and Swartz, E. (1998) Doing Research in
Business and Management: An Introduction to Process and Method, London, Sage.
Retail Excellence, available from:
http://www.retailexcellence.ie/index.php/irish-retail-sector-in-decline
[Accessed May, 15th
2013]
Rust, R T and Oliver, R L (1994) Service quality insights and managerial implications
from the frontier, in Rust, R T and Oliver, R L, Service Quality New Directions in
Theory and Practice, Sage, CA
Saunders, M and Lewis, P (2012), Doing research in Business & Management (An
Essential Guide to Planning your Project, 10th
ed, Prentice Hall

110 | P a g e
Saunders, M, Lewis, P, Thornhill, A (2009), Research methods for business students,
Pearson Education Limited, 5th
ed, Essex: Prentice Hall.
Seale, C (2009), Social Research Methods, Routledge Student Readers, 2nd
ed, Oxon: A
Reader.
Schiffman, L G, Kanuk L L (2010), ‘Consumer Behavior, 10th
ed, Pearson, New York
Schneider, B, & Bowen, D (1999), 'Understanding Customer Delight and Outrage',
Sloan Management Review, 41, 1, pp. 35-45, Business Source Complete, EBSCOhost,
viewed 19 March 2013.
Shostack L, G (1977), Breaking free from product marketing, Journal of Marketing, 41,
73-80.
Shaharudin MR, Hassan AA, Mansor SW, Elias SJ, Harun EH, Aziz NA (2010), The
relationship between extrinsic attributes of product quality with brand loyalty on
Malaysia national brand motorcycle/scooter, Canadian Social Science, 6(3): 170-182.
Sower, V, & Fair, F (2005), 'There is More to Quality than Continuous Improvement:
Listening to Plato', Quality Management Journal, 12, 1, pp. 8-20, Business Source
Complete, EBSCOhost, viewed 9 June 2013.
Sureshchandar, G, Rajendran, C, &Anantharaman, R (2002), The relationship between
management's perception of total quality service and customer perceptions of service
quality, Total Quality Management, 13, 1, pp. 69-88, Business Source Complete,
EBSCOhost, viewed 24 February 2013.
Taylor, S, & Baker, T (1994), 'An assessment of the relationship between service
quality and customer satisfaction', Journal Of Retailing, 70, 2, p. 163, Business Source
Complete, EBSCOhost, viewed 18 March 2013.
The Economist (2007), Beyond loyalty, Meeting the challenge of customer engagement,
The Economist Intelligence Unit, 8th
June 2013 [Online]. Available at:
www.adobe.com/egagement/pdfs/part1.pdf (Accessed: 8 June 2013).
Tsiotsou, R (2005) Perceived Quality Levels and their Relation to Involvement,
Satisfaction, and Purchase Intentions, Marketing Bulletin, 16 (4), 1-10.
Tsiotsou, R(2006) The role of perceived product quality and overall satisfaction on
purchase intentions, International Journal of Consumer Studies, 30 (2), 207–17.
Vázques, R., Bosque, I.A.R.D., Díaz, A.M and Ruiz, A.V. (2001) “Service quality in
supermarket retailing: Identifying critical service experiences”, Journal of Retailing and
Consumer Services, Volume 8, Number 1, Pages 1-14.
Wisniewski, M. and Donnelly, M. (1996), "Measuring service quality in the public
sector: thepotential for SERVQUAL", Total Quality Management, Vol. 7, No. 4, pp.
357-365.

111 | P a g e
ZARA Website available from: www.zara.com[Accessed May, 15th
2013]
ZARA , Mango & Co. – a fitting retail range in Poland? Available from:
http://www.regioplan.eu/en/news/235-ZARA -mango-co-a-fitting-retail-range-in-poland
[Accessed March,6th
2013]
ZARA owner Inditex reports 22% rise in net profit, available from:
http://www.rte.ie/news/business/2013/0313/376427-ZARA -owners-2012-net-profits-
rise-by-22/ [Accessed May, 15th
2013]
Zeithaml, V. A. (1981), How Consumer Evaluation Processes Differ between Goods
and Service in Parasuraman, A, Zeithaml, V, & Berry, L 1985, 'A Conceptual Model of
Service Quality and Its Implications for Future Research', Journal Of Marketing, 49, 4,
pp. 41-50, Business Source Complete, EBSCOhost, viewed 24 March 2013.
Zeithaml V.A. (1988), Consumer Perceptions of Price, Quality, and Value: A Means-
End Model and Synthesis of Evidence, Journal of Marketing, Vol. 52, 2-22.
Zeithaml, V A, Bitner, M J, Gremler D D(2009) Services Marketing – Integrating
Customer Focus Across the firm, 5th
ed, McGraw- Hill (International Edition), New
York
Zeithaml, V A, Bitner, M J, Gremler D D(2013) Services Marketing – Integrating
Customer Focus Across the firm, 6th
ed, McGraw- Hill (International Edition), New
York
2008 Farmer Mentor Handbook, Adult Learning Styles, accessible from:
http://www.cultivatingsuccess.org/2008%20Farmer%20Mentor%20Handbook/06_FM2
008_ALS.pdf (accessed on11August 2013)
Central Statistic Office
http://www.cso.ie/Quicktables/GetQuickTables.aspx?FileName=CNA15.asp&TableNa
me=Population+by+Age+2011&StatisticalProduct=DB_CN
Population classified by Religion and Nationality 2011
http://www.cso.ie/en/statistics/population/populationclassifiedbyreligionandnationality2
011/
http://www.cso.ie/en/media/csoie/census/documents/census2011profile6/Profile,6,Migr
ation,and,Diversity,Tables,and,Appendices.pdf

112 | P a g e
Appendices
Appendix A- Individual Customer Satisfaction, Loyalty & Behaviour
Jones and Sasser (1995) argue that it is important to understand satisfaction and loyalty
of customers as a group, but it is equally critical to understand the attitudes of individual
customers. The authors think that the customers behave in one of four basic ways: as
loyalists, as defectors, as mercenaries, or as hostages (table below).
The loyalist is a customer who is completely satisfied and keeps returning to the
company. Within the loyalists are customers that are extremely satisfied and whose
experience so far exceeds their expectations, that they may become apostles and a
brand/ product ambassadors (Heskett et al., 1994, 1997).
Jones et al. (1995) think that defectors’ ranks include those customers who are more
than dissatisfied, quite dissatisfied, and neutral. The merely satisfied customers may
defect too, similarly to once highly satisfied customers who have encountered failures.
The most dissatisfied defectors can easily become the terrorists, spreading the negative
word of mouth through (Jones et al., 1995; Heskett et al., 1994, 1997). Because the
terrorist are more committed, they are also more effective at telling their stories than
apostles (Jones et al., 1995).
Another type of customer is the mercenary who may be very satisfied with the
product/service but show no interest in becoming loyal to the company. This type of
customer chase low prices, follow fashion or just like changes, and are often expensive
to acquire and quick to depart. Hostages as per Jones et al. (1995) are individuals that
experience the worst the company has to offer and must accept it. The companies that
operate in a monopolistic environment see little reason to respond to hostages, as these
customers cannot go anywhere.

113 | P a g e
These customers however, may take every possible opportunity to complain, and can
easily become terrorists (Jones et al., 1995).
Table Individual Customer Satisfaction, Loyalty, and Behaviour
Individual Customer Satisfaction, Loyalty, and Behaviour
Satisfaction Loyalty Behaviour
Loyalist/
Apostle
High High Staying and supportive
Defector Low to medium Low to medium Leaving or having left unhappy
Mercenary High Low to medium Coming and going; low
commitment
Hostage Low to medium High Unable to switch; trapped
Source:Jones and Sasser (1995)

114 | P a g e
Appendix B-Goods vs. Services- comparison table
Table Goods versus Services
Goods Services Resulting implications
Tangible Intangible Service cannot be inventoried.
Services cannot be easily patented.
Services cannot be readily displayed or communicated.
Pricing is difficult.
Standardized
Heterogeneous
Service delivery and customer satisfaction depend on
employee and customer actions.
Service quality depends on many uncomfortable factors.
There is no sure knowledge that the service delivered
matches what was planned and promoted.
Separable
Inseparability
Customers participate in and effect the transaction,
Customers affect each other.
Employees affect the service outcome. Decentralization
may be essential.
Mass production is difficult.
Non-
perishable
Perishable
It is difficult to synchronize supply and demand with
services.
Services cannot be returned or resold.
Source: Parasuraman, Zeithaml, Berry (1985) in Zeithaml, Bitner, Gremler (2009, p.20)

115 | P a g e
Appendix C- Determinants of Service Quality
Table Determinants of Service Quality
Determinants of Service Quality
RELIABILITY involves consistency of performance and dependability. It means that the firm
performs the service right the first time.
It also means that the firm honours its promises. Specifically, it involves:
- accuracy in billing;
- keeping records correctly;
- performing the service at the designated time.
RESPONSIVENESS concerns the willingness or readiness of employees to provide service. It
involves timeliness of service:
- mailing a transaction slip immediately;
-calling the customer back quickly;
-giving prompt service (e.g. setting up appointments quickly).
COMPETENCE means possessio of the required skills and knowledge to perform the service
iit involves:
- knowledge and skill of operational support personnel;
-research capability of the organization, e.g. securities brokerage firm.
ACCESS invloves approachability and ease of contact. It means:
- the service is easily accessible by telephone (lines are not busy, and they don’t put you on
hold);
- waiting time to receive service (e.g., at a bank) is not extensive;
- convenient location of service facility.
COURTESY involves politeness, respect, consideration, and friendliness of contact personnel
(including receptionists, telephone operators, etc.) It includes:
- consideration for the consumer’s property (e.g., no muddy shoes on the carpet);
- clean and neat appearance of public contact personnel.
COMMUNICATION means keeping customers informed in language they can understand
and listening to them. It may mean that the company has to adjust its language for different
consumers-increasing the level of sophistication with a well-educated customer and speaking
simply and plainly with a novice. It involves:
- Explaining the service itself;
- Explaining how much the service cost;
- Explaining the trade-offs between service and cost;
- Assuring the consumer that a problem will be handled.
CREDIBILITY involves trustworthiness, believability, honesty. It involves having the
customer’s best interest at heart. Contributing to credibility are:
- company name;
- company reputation;

116 | P a g e
- personal characteristics of the contact personnel;
- the degree of hard sell involved in interactions with the customer.
SECURITY is the freedom from danger, risk, or doubt. It involves:
- physical safety;
- financial security;
- confidentiality.
UNDERSTANDING/ KNOWING THE CUSTOMER involves making the effort to
understand the customer’s needs. It involves:
- learning the customer’s specific requirements;
- providing individualized attention;
- recognizing the regular customer.
TANGIBLES include the physical evidence of the service, physical facilities;
- appearance of personnel;
- tools or equipment used to provide the service;
- physical representations of the service, such as a plastic credit card or a bank statement;
- other customers in the service facility.
Source: Parasuraman, Zeithaml and Berry (1985)

117 | P a g e
Appendix D- E-mail sent to respondents
Re: You are invited to a research survey –(Quality of service and product as the
main factors influencing customers’ satisfaction in the clothing retailing industry in
Ireland- case study of ZARA).
Hi All,
As part of my Master Thesis, I am conducting a survey to investigate the factors that
may have an impact on customer satisfaction with the ZARA services and garments.
I am looking for as many responses as possible by Friday July, 19th so please forward
this link to any of your friends, who may be familiar with the company and ask them to
complete this survey.
To take the survey online, please go to the link below, and then follow the online survey
instructions.
https://www.esurveycreator.com/s/9dbc3aa
Your input is very important to me and will be kept strictly confidential (used only for
the purposes of research for this project). I estimate that it will take you approximately
15-20 minutes to complete the survey.
If you have any questions or would prefer to complete a paper survey please email me at
Thank you in advance for your participation.
Thank you,
Kind Regards
JustynaJaskulska

118 | P a g e
Appendix E- Draft version of Survey
SURVEY ON CUSTOMERS SATISFACTION AT ZARA
Dear Participant,
I am currently working on my Master Thesis at the Dublin Business School. The aim of
this research is to investigate the factors that may have an impact on your satisfaction
with the ZARA services and garments.
I would appreciate if you could, by taking few minutes, tell me about your experience
with ZARA Plc.
Thank you very much for your time and support!
JustynaJaskulska
Dublin Business School
MBA

119 | P a g e
I. PERSONAL INFORMATION
Gender
Female Male
Your age 18-24 25-33 34-42 43-50
51 and above
Your nationality?
Irish Other: ____________(please specify)
How long have you lived
in Ireland?
<1yr 2yrs 3yrs 4yrs 5yrs
>6 yrs
II. CUSTOMER INFORMATION
Are you a ZARA
customer?
Yes No*
*please note: if you are not a ZARA customer, please do not continue with
this questionnaire
How long have you been
using the ZARA
garments?
<1 month 2-6 months 7 to 11 months 1-3 years
>3 years
When was your last visit
in ZARA?
this month last month 2 months ago
3 months ago or more

120 | P a g e
For each statement please show the extent to which you believe the ZARA has the
feature described by the statement. Circling 1 means you strongly disagree with the
statement and circling 5 means that you strongly agree with the statement. Please circle
only one box. Please note there is no right and wrong answer.
III. YOUR SATISFACTION WITH ZARA SERVICES
Part 1
RELIABILITY Strongly
Disagree
Disagree Neutral Agree Strongly
Agree
The billing is always
accurate.
1
2
3
4
5
Part 2
RESPONSIVENESS Strongly
Disagree
Disagree Neutral Agree Strongly
Agree
ZARA employees are
always willing and ready to
provide service (i.e.
checking the sizes in the
stock room)
1
2
3
4
5
Employees are never too
busy to respond to your
request.
1
2
3
4
5
The waiting time outside
fitting room is generally
acceptable for customers
1
2
3
4
5
The waiting time taken at
the billing counteris
generally acceptable for
customers
1
2
3
4
5

121 | P a g e
Part 3
COURTESY Strongly
Disagree
Disagree Neutral Agree Strongly
Agree
ZARA personnel always
look professional.
1
2
3
4
5
ZARA employees are
consistently courteous with
customers.
1
2
3
4
5
Part 4
COMMUNICATION Strongly
Disagree
Disagree Neutral Agree Strongly
Agree
ZARA personnel provide
appropriate explanation on
garments.
1
2
3
4
5
Part 5
CREDIBILITY Strongly
Disagree
Disagree Neutral Agree Strongly
Agree
ZARA performs its service
right the first time. 1
2
3
4
5
When you have a problem
ZARA shows a sincere
interest in solving it.
1
2
3
4
5
ZARA is known for
keeping its promises (i.e.
exchange or full refund).
1
2
3
4
5

122 | P a g e
Part 6
SECURITY Strongly
Disagree
Disagree Neutral Agree Strongly
Agree
You feel safe in your
transactions with ZARA
(i.e. payment security)
1
2
3
4
5
You feel safe shopping at
ZARA.
1
2
3
4
5
Part 7
UNDERSTANDING/
KNOWING THE
CUSTOMER
Strongly
Disagree
Disagree Neutral Agree Strongly
Agree
The ZARA has employees
who provide you individual
attention.
1
2
3
4
5
The behaviour of ZARA
employees instill
confidence in customers.
1
2
3
4
5
ZARA employees have the
knowledge to answer
customers’ enquiries.
1
2
3
4
5
ZARA employees
understand the specific
needs of their customers.
1
2
3
4
5
Part 8
TANGIBLES Strongly
Disagree
Disagree Neutral Agree Strongly
Agree
ZARA stores atmosphere
and decor are appealing. 1
2
3
4
5
ZARA employees’
uniforms appear neat.
1
2
3
4
5

123 | P a g e
Materials associated with
the service (such as
pamphlets with promotions)
are visually appealing.
1
2
3
4
5
IV. YOUR SATISFACTION WITH ZARA GARMENTS
Part 1
PERFORMANCE Strongly
Disagree
Disagree Neutral Agree Strongly
Agree
ZARA provide a variety of
sizes.
1
2
3
4
5
ZARA garments are
comfortable. 1
2
3
4
5
ZARA garments are ‘easy
care’ (i.e. washing, ironing)
1
2
3
4
5
Part 2
FEATURES Strongly
Disagree
Disagree Neutral Agree Strongly
Agree
Zara garments fit well
1
2
3
4
5
Part 3
RELIABILITY Strongly
Disagree
Disagree Neutral Agree Strongly
Agree
ZARA garments wear well
within a specific period of
time
1
2
3
4
5

124 | P a g e
Part 4
CONFORMANCE Strongly
Disagree
Disagree Neutral Agree Strongly
Agree
The ZARA branded
garments are of good
reputation.
1
2
3
4
5
The description of ZARA
garments is consistent with
the actual product (i.e.
fabric, colour).
1
2
3
4
5
Part 5
DURABILITY Strongly
Disagree
Disagree Neutral Agree Strongly
Agree
ZARA garments are durable
(considering material,
structural and stylistic
durability)
1
2
3
4
5
Part 6
SERVICEABILITY Strongly
Disagree
Disagree Neutral Agree Strongly
Agree
ZARA garments have clear
care labels and guarantees. 1
2
3
4
5
Part 7
AESTHETIC Strongly
Disagree
Disagree Neutral Agree Strongly
Agree
ZARA garments are stylish
1
2
3
4
5
ZARA garments look
modern and are of original
design.
1
2
3
4
5
ZARA garments fabric line/
details (sewing and finishing
methods) are of high quality.
1
2
3
4
5

125 | P a g e
Part 8
PERCEIVED QUALITY Strongly
Disagree
Disagree Neutral Agree Strongly
Agree
ZARA brands garments are
of high quality. 1
2
3
4
5
ZARA garments are good
value for money.
1
2
3
4
5
V. CUSTOMER SATISFACTION
Strongly
Disagree
Disagree Neutral Agree Strongly
Agree
Overall, you are very much
satisfied with shopping in
ZARA?
1
2
3
4
5
You are very much likely to
shop in ZARA in the next
months.
1
2
3
4
5
Thank you very much for answering this questionnaire!

126 | P a g e
APPENDIX F- SPSS Data
FREQUENCIES
Gender Statistics Gender
N Valid 100
Missing 0
Gender
Frequency Percent Valid Percent Cumulative
Percent
Valid MALE 31 31.0 31.0 31.0
FEMALE 69 69.0 69.0 100.0
Total 100 100.0 100.0
Age Statistics Age
N Valid 100
Missing 0
Age
Frequency Percent Valid Percent Cumulative
Percent
Valid 18-24 4 4.0 4.0 4.0
25-33 65 65.0 65.0 69.0
34-42 24 24.0 24.0 93.0
43-50 5 5.0 5.0 98.0
>51 2 2.0 2.0 100.0
Total 100 100.0 100.0
Descriptive Statistics
N Minimum Maximum Mean Std. Deviation
Age 100 .00 4.00 1.3600 .73195
Valid N (listwise) 100
Nationality Statistics Nationality
N Valid 100
Missing 0
Mean .6900

127 | P a g e
Nationality
Frequency Percent Valid Percent Cumulative
Percent
Valid NON-IRISH 31 31.0 31.0 31.0
IRISH 69 69.0 69.0 100.0
Total 100 100.0 100.0
Statistics ResiDuration
N Valid 100
Missing 0
Mean 4.8100
ResiDuration
Frequency Percent Valid Percent Cumulative
Percent
Valid <1yr 1 1.0 1.0 1.0
2yrs 2 2.0 2.0 3.0
4yrs 1 1.0 1.0 4.0
5yrs 4 4.0 4.0 8.0
>6yrs 92 92.0 92.0 100.0
Total 100 100.0 100.0
Descriptives Descriptive Statistics
N Minimum Maximum Mean Std. Deviation
ResiDuration 100 .00 5.00 4.8100 .78746
Valid N (listwise) 100
Statistics CustDuration
N Valid 100
Missing 0
Mean 3.6600
CustDuration
Frequency Percent Valid Percent Cumulative
Percent
Valid 2-6 months 2 2.0 2.0 2.0
7-11 months 2 2.0 2.0 4.0
1-3 yrs 24 24.0 24.0 28.0
>3 yrs 72 72.0 72.0 100.0
Total 100 100.0 100.0

128 | P a g e
Descriptive Statistics
N Minimum Maximum Mean Std. Deviation
ResiDuration 100 .00 5.00 4.8100 .78746
Valid N (listwise) 100
Statistics LastVisit
N Valid 100
Missing 0
Mean 1.8100
LastVisit
Frequency Percent Valid Percent Cumulative
Percent
Valid this month 21 21.0 21.0 21.0
last month 18 18.0 18.0 39.0
2 months ago 20 20.0 20.0 59.0
3 months ago or more 41 41.0 41.0 100.0
Total 100 100.0 100.0
Descriptive Statistics
N Minimum Maximum Mean Std. Deviation
LastVisit 100 .00 3.00 1.8100 1.18658
Valid N (listwise) 100
N Mi. Max. Sum Mean Std.
Deviation Skewness Kurtosis
Stat Stat Stat Stat Stat Stat Stat Std. Error Stat
Std. Error
Gender 100 .00 1.00 69.00 .6900 .46482 -.834 .241 -1.331 .478
Age 100 .00 4.00 136.00 1.3600 .73195 1.368 .241 2.595 .478
Nationality 100 .00 1.00 69.00 .6900 .46482 -.834 .241 -1.331 .478
ResiDuration 100 .00 5.00 481.00 4.8100 .78746 -4.841 .241 23.960 .478
ZARACust 100 1.00 1.00 100.00 1.0000 .00000 . . . .
CustDuration 100 1.00 4.00 366.00 3.6600 .62312 -2.167 .241 5.508 .478
LastVisit 100 .00 3.00 181.00 1.8100 1.18658 -.400 .241 -1.386 .478
ServREL1 100 2.00 5.00 438.00 4.3800 .70754 -1.047 .241 1.090 .478
ServRES1 100 2.00 5.00 406.00 4.0600 .73608 -.560 .241 .345 .478
ServRES2 100 2.00 5.00 378.00 3.7800 .77303 -.533 .241 .200 .478
ServRES3 100 1.00 5.00 371.00 3.7100 .82014 -1.320 .241 2.476 .478
ServRES4 100 1.00 5.00 381.00 3.8100 .66203 -1.051 .241 3.108 .478
ServCOURT1
100 2.00 5.00 418.00 4.1800 .57525 -.340 .241 1.420 .478
ServCOURT2
100 2.00 5.00 404.00 4.0400 .65010 -.489 .241 .974 .478
ServCOMM1 100 1.00 5.00 355.00 3.5500 .72995 -.813 .241 .899 .478

129 | P a g e
Descriptive Statistics
N Minimum Maximum Mean Std. Deviation
ServREL1 100 2.00 5.00 4.3800 .70754
ServRES1 100 2.00 5.00 4.0600 .73608
ServRES2 100 2.00 5.00 3.7800 .77303
ServRES3 100 1.00 5.00 3.7100 .82014
ServRES4 100 1.00 5.00 3.8100 .66203
ServCOURT1 100 2.00 5.00 4.1800 .57525
ServCOURT2 100 2.00 5.00 4.0400 .65010
ServCOMM1 100 1.00 5.00 3.5500 .72995
ServCRED1 100 2.00 5.00 4.2200 .61266
ServCRED2 100 2.00 5.00 3.8300 .66750
ServCRED3 100 2.00 5.00 4.1100 .76403
ServSEC1 100 3.00 5.00 4.4100 .51434
ServSEC2 100 3.00 5.00 4.4100 .53362
ServUNDER1 100 1.00 5.00 3.5400 .79671
ServUNDER2 100 2.00 5.00 3.9100 .65281
ServCRED1 100 2.00 5.00 422.00 4.2200 .61266 -.430 .241 .823 .478
ServCRED2 100 2.00 5.00 383.00 3.8300 .66750 -.208 .241 .106 .478
ServCRED3 100 2.00 5.00 411.00 4.1100 .76403 -.467 .241 -.332 .478
ServSEC1 100 3.00 5.00 441.00 4.4100 .51434 .143 .241 -1.460 .478
ServSEC2 100 3.00 5.00 441.00 4.4100 .53362 -.038 .241 -1.151 .478
ServUNDER1
100 1.00 5.00 354.00 3.5400 .79671 -.561 .241 .345 .478
ServUNDER2
100 2.00 5.00 391.00 3.9100 .65281 -.576 .241 1.123 .478
ServUNDER3
100 2.00 5.00 364.00 3.6400 .68931 -.331 .241 .072 .478
ServUNDER4
100 2.00 5.00 360.00 3.6000 .71067 -.276 .241 -.060 .478
ServTANG1 100 2.00 5.00 413.00 4.1300 .70575 -.717 .241 1.003 .478
ServTANG2 100 2.00 5.00 407.00 4.0700 .59041 -.315 .241 1.124 .478
ServTANG3 100 2.00 5.00 383.00 3.8300 .75284 -.577 .241 .413 .478
GarmPERF1 100 2.00 5.00 400.00 4.0000 .61955 -.520 .241 1.423 .478
GarmPERF2 100 3.00 5.00 422.00 4.2200 .46232 .727 .241 .075 .478
GarmPERF3 100 1.00 5.00 401.00 4.0100 .70345 -1.258 .241 3.861 .478
GarmFEAT1 100 2.00 5.00 410.00 4.1000 .67420 -.726 .241 1.474 .478
GarmREL1 100 1.00 5.00 409.00 4.0900 .62109 -1.608 .241 7.479 .478
GarmCONF1 100 3.00 5.00 414.00 4.1400 .51286 .213 .241 .527 .478
GarmCONF2 100 3.00 5.00 407.00 4.0700 .51747 .104 .241 .772 .478
GarmDURA1 100 2.00 5.00 400.00 4.0000 .66667 -1.044 .241 2.557 .478
GarmSERV1 100 3.00 5.00 408.00 4.0800 .52570 .098 .241 .631 .478
GarmAEST1 100 3.00 5.00 434.00 4.3400 .49686 .432 .241 -1.205 .478
GarmAEST2 100 2.00 5.00 425.00 4.2500 .57516 -.386 .241 1.364 .478
GarmAEST3 100 2.00 5.00 394.00 3.9400 .69369 -.846 .241 1.560 .478
GarmPERCQ1
100 2.00 5.00 390.00 3.9000 .68902 -.624 .241 .966 .478
GarmPERCQ2
100 2.00 5.00 392.00 3.9200 .69165 -1.015 .241 1.960 .478
CUSTSAT1 100 1.00 5.00 410.00 4.1000 .55958 -1.376 .241 9.110 .478
CUSTSAT2 100 1.00 5.00 416.00 4.1600 .61496 -1.435 .241 7.330 .478
Valid N (listwise)
100

130 | P a g e
ServUNDER3 100 2.00 5.00 3.6400 .68931
ServUNDER4 100 2.00 5.00 3.6000 .71067
ServTANG1 100 2.00 5.00 4.1300 .70575
ServTANG2 100 2.00 5.00 4.0700 .59041
ServTANG3 100 2.00 5.00 3.8300 .75284
Valid N (listwise) 100
Descriptive Statistics
N Minimum Maximum Mean Std. Deviation
GarmPERF1 100 2.00 5.00 4.0000 .61955
GarmPERF2 100 3.00 5.00 4.2200 .46232
GarmPERF3 100 1.00 5.00 4.0100 .70345
GarmFEAT1 100 2.00 5.00 4.1000 .67420
GarmREL1 100 1.00 5.00 4.0900 .62109
GarmCONF1 100 3.00 5.00 4.1400 .51286
GarmCONF2 100 3.00 5.00 4.0700 .51747
GarmDURA1 100 2.00 5.00 4.0000 .66667
GarmSERV1 100 3.00 5.00 4.0800 .52570
GarmAEST1 100 3.00 5.00 4.3400 .49686
GarmAEST2 100 2.00 5.00 4.2500 .57516
GarmAEST3 100 2.00 5.00 3.9400 .69369
GarmPERCQ1 100 2.00 5.00 3.9000 .68902
GarmPERCQ2 100 2.00 5.00 3.9200 .69165
Valid N (listwise) 100
Descriptive Statistics
N Minimum Maximum Mean Std. Deviation
CUSTSAT1 100 1.00 5.00 4.1000 .55958
CUSTSAT2 100 1.00 5.00 4.1600 .61496
Valid N (listwise) 100
Group Statistics
Gender N Mean Std. Deviation Std. Error
Mean
CUSTSAT1 MALE 31 4.0000 .68313 .12269
FEMALE 69 4.1449 .49335 .05939
Independent Samples Test
CUST SAT1
Levene's Test for Equality of
Variances t-test for Equality of Means
F Sig. t df Sig. (2-tailed)
Mean Difference
Std. Error Difference
95% Confidence Interval of the
Difference
Upper Lower
Equal variances .821 .367 -1.200 98 .233 -.14493 .12072 -.38450 .09464

131 | P a g e
assumed
Equal variances not assumed
-1.063 44.626 .293 -.14493 .13631 -.41954 .12968
Group Statistics
Nationality N Mean Std. Deviation Std. Error
Mean
CUSTSAT1 NON-IRISH 31 4.0323 .75206 .13507
IRISH 69 4.1304 .45092 .05428
Independent Samples Test
CUST SAT1
Levene's Test for Equality of
Variances t-test for Equality of Means
F Sig. t df Sig. (2-tailed)
Mean Difference
Std. Error Difference
95% Confidence Interval of the
Difference
Upper Lower
Equal variances assumed
.542 .463 -.810 98 .420 -.09818 .12120 -.33870 .14235
Equal variances not assumed
-.674 40.013 .504 -.09818 .14557 -.39239 .19604
Case Processing Summary
N %
Cases Valid 100 100.0
Excluded(a)
0 .0
Total 100 100.0
a Listwise deletion based on all variables in the procedure. Reliability Statistics
Cronbach's Alpha
Cronbach's Alpha Based
on Standardized
Items N of Items
.923 .924 20
Item-Total Statistics
Scale Mean if Item Deleted
Scale Variance if
Item Deleted
Corrected Item-Total Correlation
Cronbach's Alpha if Item
Deleted
ServREL1 74.8300 71.860 .373 .924
ServRES1 75.1500 67.624 .716 .917

132 | P a g e
ServRES2 75.4300 68.227 .627 .919
ServRES3 75.5000 69.727 .470 .923
ServRES4 75.4000 70.081 .570 .920
ServCOURT1 75.0300 70.635 .607 .919
ServCOURT2 75.1700 68.587 .727 .917
ServCOMM1 75.6600 68.105 .680 .917
ServCRED1 74.9900 70.636 .565 .920
ServCRED2 75.3800 69.915 .580 .920
ServCRED3 75.1000 68.394 .622 .919
ServSEC1 74.8000 72.768 .433 .922
ServSEC2 74.8000 72.828 .409 .923
ServUNDER1 75.6700 67.456 .668 .918
ServUNDER2 75.3000 68.515 .730 .917
ServUNDER3 75.5700 69.460 .600 .919
ServUNDER4 75.6100 68.685 .649 .918
ServTANG1 75.0800 69.852 .550 .920
ServTANG2 75.1400 70.909 .561 .920
ServTANG3 75.3800 68.198 .649 .918
Summary Item Statistics
Mean Minimum Maximum Range Maximum / Minimum Variance
N of Items
Item Means 3.960 3.540 4.410 .870 1.246 .079 20
Item Variances .472 .265 .673 .408 2.543 .013 20
Inter-Item Correlations
.377 -.027 .964 .990 -36.263 .026 20
Case Processing Summary
N %
Cases Valid 100 100.0
Excluded(a)
0 .0
Total 100 100.0
a Listwise deletion based on all variables in the procedure. Reliability Statistics
Cronbach's Alpha
Cronbach's Alpha Based
on Standardized
Items N of Items
.780 .782 4
Item Statistics
Mean Std. Deviation N
ServRES1 4.0600 .73608 100
ServRES2 3.7800 .77303 100
ServRES3 3.7100 .82014 100
ServRES4 3.8100 .66203 100

133 | P a g e
Inter-Item Correlation Matrix
ServRES1 ServRES2 ServRES3 ServRES4
ServRES1 1.000 .645 .380 .335
ServRES2 .645 1.000 .408 .352
ServRES3 .380 .408 1.000 .716
ServRES4 .335 .352 .716 1.000
Item-Total Statistics
Scale Mean if Item Deleted
Scale Variance if
Item Deleted
Corrected Item-Total Correlation
Squared Multiple
Correlation
Cronbach's Alpha if Item
Deleted
ServRES1 11.3000 3.364 .563 .434 .738
ServRES2 11.5800 3.216 .581 .448 .729
ServRES3 11.6500 2.997 .618 .544 .710
ServRES4 11.5500 3.523 .589 .518 .728
Scale Statistics
Mean Variance Std. Deviation N of Items
15.3600 5.425 2.32909 4
Case Processing Summary
N %
Cases Valid 100 100.0
Excluded(a)
0 .0
Total 100 100.0
a Listwise deletion based on all variables in the procedure. Reliability Statistics
Cronbach's Alpha
Cronbach's Alpha Based
on Standardized
Items N of Items
.808 .812 2
Item Statistics
Mean Std. Deviation N
ServCOURT1 4.1800 .57525 100
ServCOURT2 4.0400 .65010 100
Inter-Item Correlation Matrix
ServCOURT1 ServCOURT2
ServCOURT1 1.000 .683
ServCOURT2 .683 1.000
Item-Total Statistics
Scale Mean if Item Deleted
Scale Variance if
Item Deleted
Corrected Item-Total Correlation
Squared Multiple
Correlation
Cronbach's Alpha if Item
Deleted

134 | P a g e
ServCOURT1 4.0400 .423 .683 .466 .(a)
ServCOURT2 4.1800 .331 .683 .466 .(a)
a The value is negative due to a negative average covariance among items. This violates reliability model assumptions. You may want to check item codings. Scale Statistics
Mean Variance Std. Deviation N of Items
8.2200 1.264 1.12439 2
Case Processing Summary
N %
Cases Valid 100 100.0
Excluded(a) 0 .0
Total 100 100.0
a Listwise deletion based on all variables in the procedure. Reliability Statistics
Cronbach's Alpha
Cronbach's Alpha Based
on Standardized
Items N of Items
.670 .670 3
Item Statistics
Mean Std. Deviation N
ServCRED1 4.2200 .61266 100
ServCRED2 3.8300 .66750 100
ServCRED3 4.1100 .76403 100
Inter-Item Correlation Matrix
ServCRED1 ServCRED2 ServCRED3
ServCRED1 1.000 .339 .379
ServCRED2 .339 1.000 .493
ServCRED3 .379 .493 1.000
Item-Total Statistics
Scale Mean if Item Deleted
Scale Variance if
Item Deleted
Corrected Item-Total Correlation
Squared Multiple
Correlation
Cronbach's Alpha if Item
Deleted
ServCRED1 7.9400 1.532 .417 .175 .656
ServCRED2 8.3300 1.314 .510 .270 .540
ServCRED3 8.0500 1.098 .535 .294 .505
Summary Item Statistics
Mean Minimum Maximum Range Maximum / Minimum Variance
N of Items
Item Means 4.053 3.830 4.220 .390 1.102 .040 3
Item Variances .468 .375 .584 .208 1.555 .011 3

135 | P a g e
Inter-Item Correlations
.404 .339 .493 .153 1.451 .005 3
Scale Statistics
Mean Variance Std. Deviation N of Items
12.1600 2.540 1.59367 3
Case Processing Summary
N %
Cases Valid 100 100.0
Excluded(a) 0 .0
Total 100 100.0
a Listwise deletion based on all variables in the procedure. Reliability Statistics
Cronbach's Alpha
Cronbach's Alpha Based
on Standardized
Items N of Items
.981 .982 2
Item Statistics
Mean Std. Deviation N
ServSEC1 4.4100 .51434 100
ServSEC2 4.4100 .53362 100
Inter-Item Correlation Matrix
ServSEC1 ServSEC2
ServSEC1 1.000 .964
ServSEC2 .964 1.000
Item-Total Statistics
Scale Mean if Item Deleted
Scale Variance if
Item Deleted
Corrected Item-Total Correlation
Squared Multiple
Correlation
Cronbach's Alpha if Item
Deleted
ServSEC1 4.4100 .285 .964 .929 .(a)
ServSEC2 4.4100 .265 .964 .929 .(a)
a The value is negative due to a negative average covariance among items. This violates reliability model assumptions. You may want to check item codings. Scale Statistics
Mean Variance Std. Deviation N of Items
8.8200 1.078 1.03845 2
Case Processing Summary
N %
Cases Valid 100 100.0
Excluded(a)
0 .0
Total 100 100.0
a Listwise deletion based on all variables in the procedure.

136 | P a g e
Reliability Statistics
Cronbach's Alpha
Cronbach's Alpha Based
on Standardized
Items N of Items
.881 .881 4
Item Statistics
Mean Std. Deviation N
ServUNDER1 3.5400 .79671 100
ServUNDER2 3.9100 .65281 100
ServUNDER3 3.6400 .68931 100
ServUNDER4 3.6000 .71067 100
Inter-Item Correlation Matrix
ServUNDER1 ServUNDER2 ServUNDER3 ServUNDER4
ServUNDER1 1.000 .735 .597 .724
ServUNDER2 .735 1.000 .556 .597
ServUNDER3 .597 .556 1.000 .693
ServUNDER4 .724 .597 .693 1.000
Item-Total Statistics
Scale Mean if Item Deleted
Scale Variance if
Item Deleted
Corrected Item-Total Correlation
Squared Multiple
Correlation
Cronbach's Alpha if Item
Deleted
ServUNDER1 11.1500 3.139 .794 .669 .828
ServUNDER2 10.7800 3.769 .717 .563 .857
ServUNDER3 11.0500 3.705 .691 .514 .866
ServUNDER4 11.0900 3.456 .777 .631 .833
Scale Statistics
Mean Variance Std. Deviation N of Items
14.6900 6.014 2.45235 4
Case Processing Summary
N %
Cases Valid 100 100.0
Excluded(a)
0 .0
Total 100 100.0
a Listwise deletion based on all variables in the procedure. Reliability Statistics
Cronbach's Alpha
Cronbach's Alpha Based
on Standardized
Items N of Items
.802 .806 3

137 | P a g e
Item Statistics
Mean Std. Deviation N
ServTANG1 4.1300 .70575 100
ServTANG2 4.0700 .59041 100
ServTANG3 3.8300 .75284 100
Inter-Item Correlation Matrix
ServTANG1 ServTANG2 ServTANG3
ServTANG1 1.000 .535 .612
ServTANG2 .535 1.000 .595
ServTANG3 .612 .595 1.000
Item-Total Statistics
Scale Mean if Item Deleted
Scale Variance if
Item Deleted
Corrected Item-Total Correlation
Squared Multiple
Correlation
Cronbach's Alpha if Item
Deleted
ServTANG1 7.9000 1.444 .647 .420 .733
ServTANG2 7.9600 1.716 .631 .401 .759
ServTANG3 8.2000 1.293 .689 .475 .690
Scale Statistics
Mean Variance Std. Deviation N of Items
12.0300 3.039 1.74341 3
Case Processing Summary
N %
Cases Valid 100 100.0
Excluded(a) 0 .0
Total 100 100.0
a Listwise deletion based on all variables in the procedure.
Reliability Statistics
Cronbach's Alpha
Cronbach's Alpha Based
on Standardized
Items N of Items
.330 .330 2
Item Statistics
Mean Std. Deviation N
ServREL1 4.3800 .70754 100
ServCOMM1 3.5500 .72995 100

138 | P a g e
Summary Item Statistics
Mean Minimum Maximum Range Maximum / Minimum Variance
N of Items
Item Means 3.965 3.550 4.380 .830 1.234 .344 2
Item Variances .517 .501 .533 .032 1.064 .001 2
Inter-Item Correlations
.198 .198 .198 .000 1.000 .000 2
Case Processing Summary
N %
Cases Valid 100 100.0
Excluded(a)
0 .0
Total 100 100.0
a Listwise deletion based on all variables in the procedure. Reliability Statistics
Cronbach's Alpha
Cronbach's Alpha Based
on Standardized
Items N of Items
.914 .917 14
Item-Total Statistics
Scale Mean if Item Deleted
Scale Variance if
Item Deleted
Corrected Item-Total Correlation
Cronbach's Alpha if Item
Deleted
GarmPERF1 53.0600 30.602 .495 .913
GarmPERF2 52.8400 30.560 .706 .907
GarmPERF3 53.0500 29.765 .537 .912
GarmFEAT1 52.9600 29.150 .656 .907
GarmREL1 52.9700 30.029 .582 .910
GarmCONF1 52.9200 30.559 .627 .908
GarmCONF2 52.9900 30.879 .562 .910
GarmDURA1 53.0600 28.400 .779 .902
GarmSERV1 52.9800 30.161 .683 .907
GarmAEST1 52.7200 30.870 .591 .910
GarmAEST2 52.8100 30.378 .579 .910
GarmAEST3 53.1200 28.834 .680 .906
GarmPERCQ1 53.1600 28.196 .780 .902
GarmPERCQ2 53.1400 29.374 .604 .909
Summary Item Statistics
Mean Minimum Maximum Range Maximum / Minimum Variance
N of Items
Item Means 4.076 3.900 4.340 .440 1.113 .017 14
Item Variances .371 .214 .495 .281 2.315 .010 14
Inter-Item Correlations
.440 .191 .795 .605 4.170 .015 14

139 | P a g e
Factor Analysis- EXTRACTED factor analysis for SERVICES Communalities
Initial Extraction
ServREL1 1.000 .808
ServRES1 1.000 .678
ServRES2 1.000 .684
ServRES3 1.000 .729
ServRES4 1.000 .761
ServCOURT1 1.000 .761
ServCOURT2 1.000 .816
ServCOMM1 1.000 .711
ServCRED1 1.000 .757
ServCRED2 1.000 .641
ServCRED3 1.000 .629
ServSEC1 1.000 .860
ServSEC2 1.000 .873
ServUNDER1 1.000 .770
ServUNDER2 1.000 .683
ServUNDER3 1.000 .691
ServUNDER4 1.000 .726
ServTANG1 1.000 .692
ServTANG2 1.000 .790
ServTANG3 1.000 .678
Extraction Method: Principal Component Analysis. Total Variance Explained
Component Initial Eigenvalues
Extraction Sums of Squared Loadings
Rotation Sums of Squared Loadings
Total % of Var Cum% Total
% of Var Cum% Total % of Var Cum %
1 8.338 41.689 41.689 8.338 41.689 41.689 4.893 24.467 24.467
2 2.537 12.683 54.371 2.537 12.683 54.371 2.735 13.674 38.142
3 1.591 7.953 62.325 1.591 7.953 62.325 2.564 12.820 50.962
4 1.179 5.893 68.218 1.179 5.893 68.218 2.284 11.420 62.382
5 1.096 5.478 73.695 1.096 5.478 73.695 2.263 11.313 73.695
6 .807 4.037 77.732
7 .718 3.592 81.324
8 .595 2.973 84.297
9 .497 2.483 86.780
10 .452 2.261 89.041
11 .414 2.069 91.110
12 .325 1.627 92.737
13 .307 1.537 94.274
14 .269 1.346 95.620
15 .237 1.187 96.808
16 .179 .895 97.702
17 .167 .833 98.536
18 .157 .783 99.319
19 .105 .523 99.842
20 .032 .158 100.000

140 | P a g e
Extraction Method: Principal Component Analysis. Component Matrix(a)
Component
1 2 3 4 5
ServREL1 .402 .428 .494 .443 .149
ServRES1 .761 -.106 .047 .244 -.162
ServRES2 .690 -.390 -.041 .122 -.199
ServRES3 .514 -.223 .641 -.018 -.067
ServRES4 .597 -.083 .544 -.223 .227
ServCOURT1 .667 -.001 -.114 -.153 -.530
ServCOURT2 .778 -.170 -.006 .226 -.363
ServCOMM1 .731 -.309 -.035 -.024 .281
ServCRED1 .599 .409 .280 .259 -.293
ServCRED2 .629 .108 -.189 .200 .397
ServCRED3 .658 .318 .057 .026 .301
ServSEC1 .474 .701 -.369 .082 .008
ServSEC2 .451 .741 -.337 .086 -.008
ServUNDER1 .732 -.396 -.209 .137 .123
ServUNDER2 .783 -.181 -.163 .077 -.065
ServUNDER3 .662 -.400 -.256 -.074 .148
ServUNDER4 .709 -.340 -.276 .005 .179
ServTANG1 .590 .409 .092 -.399 .096
ServTANG2 .616 .211 -.069 -.569 -.192
ServTANG3 .695 .110 .172 -.384 .078
Extraction Method: Principal Component Analysis. a 5 components extracted.
Rotated Component Matrix(a)
Component
1 2 3 4 5
ServREL1 .008 .311 .021 .048 .842
ServRES1 .535 .144 .100 .489 .349
ServRES2 .634 -.085 .091 .500 .131
ServRES3 .231 -.353 .353 .281 .590
ServRES4 .321 -.181 .583 .015 .534
ServCOURT1 .275 .170 .348 .731 -.040
ServCOURT2 .522 .102 .083 .680 .252
ServCOMM1 .770 .005 .282 .060 .189
ServCRED1 .033 .382 .171 .508 .568
ServCRED2 .606 .436 .100 -.090 .256
ServCRED3 .374 .448 .357 -.026 .400
ServSEC1 .087 .892 .176 .145 .068
ServSEC2 .035 .900 .178 .148 .093
ServUNDER1 .839 .038 .074 .228 .083
ServUNDER2 .668 .172 .188 .397 .118
ServUNDER3 .786 .000 .210 .153 -.072
ServUNDER4 .816 .089 .172 .149 -.015
ServTANG1 .130 .385 .698 .077 .185
ServTANG2 .173 .255 .752 .342 -.108

141 | P a g e
ServTANG3 .329 .139 .691 .158 .219
Extraction Method: Principal Component Analysis. Rotation Method: Varimax with Kaiser Normalization. a Rotation converged in 11 iterations.
Component Transformation Matrix
Component 1 2 3 4 5
1 .679 .290 .427 .404 .330
2 -.527 .794 .196 -.070 .219
3 -.325 -.492 .260 -.001 .765
4 .151 .188 -.841 .115 .471
5 .363 .093 .068 -.905 .189
Extraction Method: Principal Component Analysis. Rotation Method: Varimax with Kaiser Normalization.
Factor Analysis- EXTRACTED factor analysis for GARMENTS Communalities
Initial Extraction
GarmPERF1 1.000 .729
GarmPERF2 1.000 .781
GarmPERF3 1.000 .602
GarmFEAT1 1.000 .625
GarmREL1 1.000 .726
GarmCONF1 1.000 .663
GarmCONF2 1.000 .478
GarmDURA1 1.000 .789
GarmSERV1 1.000 .554
GarmAEST1 1.000 .742
GarmAEST2 1.000 .704
GarmAEST3 1.000 .597
GarmPERCQ1 1.000 .683
GarmPERCQ2 1.000 .601
Extraction Method: Principal Component Analysis.
Total Variance Explained
Component Initial Eigenvalues
Extraction Sums of Squared Loadings
Rotation Sums of Squared Loadings
Total
% of Varianc
e Cumulative % Total
% of Varianc
e Cumulative % Total
% of Variance
Cumulative %
1 6.789 48.492 48.492 6.789 48.492 48.492 3.616 25.825 25.825
2 1.404 10.030 58.522 1.404 10.030 58.522 3.128 22.341 48.166
3 1.080 7.714 66.236 1.080 7.714 66.236 2.530 18.069 66.236
4 .922 6.586 72.822
5 .759 5.420 78.242
6 .616 4.398 82.639
7 .492 3.517 86.156
8 .444 3.169 89.325
9 .370 2.642 91.967
10 .298 2.129 94.096
11 .261 1.861 95.957

142 | P a g e
12 .231 1.648 97.605
13 .209 1.491 99.095
14 .127 .905 100.000
Component Matrix(a)
Component
1 2 3
GarmPERF1 .559 .289 .577
GarmPERF2 .749 .205 .422
GarmPERF3 .594 .488 -.103
GarmFEAT1 .713 .199 .276
GarmREL1 .633 .449 -.351
GarmCONF1 .698 -.326 -.265
GarmCONF2 .636 -.267 .044
GarmDURA1 .823 .072 -.325
GarmSERV1 .741 .007 -.075
GarmAEST1 .663 -.548 .047
GarmAEST2 .656 -.518 .077
GarmAEST3 .742 -.122 .175
GarmPERCQ1 .824 -.026 -.052
GarmPERCQ2 .660 .179 -.366
Extraction Method: Principal Component Analysis. a 3 components extracted.
Rotated Component Matrix(a)
Component
1 2 3
GarmPERF1 .114 .121 .838
GarmPERF2 .306 .284 .779
GarmPERF3 .010 .667 .397
GarmFEAT1 .294 .350 .645
GarmREL1 .076 .823 .206
GarmCONF1 .708 .402 .017
GarmCONF2 .611 .206 .250
GarmDURA1 .486 .721 .180
GarmSERV1 .472 .484 .311
GarmAEST1 .843 .073 .161
GarmAEST2 .814 .065 .192
GarmAEST3 .562 .263 .460
GarmPERCQ1 .550 .502 .358
GarmPERCQ2 .301 .707 .107
Extraction Method: Principal Component Analysis. Rotation Method: Varimax with Kaiser Normalization. a Rotation converged in 5 iterations.
Component Transformation Matrix
Component 1 2 3
1 .641 .586 .496
2 -.767 .522 .373
3 -.040 -.620 .784
Extraction Method: Principal Component Analysis. Rotation Method: Varimax with Kaiser Normalization.

143 | P a g e
Reliability for single factors-GARMENTS
PERFORMANCE
Case Processing Summary
N %
Cases Valid 100 100.0
Excluded(a)
0 .0
Total 100 100.0
a Listwise deletion based on all variables in the procedure. Reliability Statistics
Cronbach's Alpha
Cronbach's Alpha Based
on Standardized
Items N of Items
.711 .742 3
Item Statistics
Mean Std. Deviation N
GarmPERF1 4.0000 .61955 100
GarmPERF2 4.2200 .46232 100
GarmPERF3 4.0100 .70345 100
Inter-Item Correlation Matrix
GarmPERF1 GarmPERF2 GarmPERF3
GarmPERF1 1.000 .600 .348
GarmPERF2 .600 1.000 .521
GarmPERF3 .348 .521 1.000
Item-Total Statistics
Scale Mean if Item Deleted
Scale Variance if
Item Deleted
Corrected Item-Total Correlation
Squared Multiple
Correlation
Cronbach's Alpha if Item
Deleted
GarmPERF1 8.2300 1.048 .510 .361 .647
GarmPERF2 8.0100 1.182 .679 .471 .513
GarmPERF3 8.2200 .941 .470 .274 .730
Scale Statistics
Mean Variance Std. Deviation N of Items
12.2300 2.078 1.44148 3
CONFORMANCE
Case Processing Summary
N %
Cases Valid 100 100.0
Excluded(a)
0 .0
Total 100 100.0
a Listwise deletion based on all variables in the procedure.

144 | P a g e
Reliability Statistics
Cronbach's Alpha
Cronbach's Alpha Based
on Standardized
Items N of Items
.758 .758 2
Item Statistics
Mean Std. Deviation N
GarmCONF1 4.1400 .51286 100
GarmCONF2 4.0700 .51747 100
Inter-Item Correlation Matrix
GarmCONF1 GarmCONF2
GarmCONF1 1.000 .610
GarmCONF2 .610 1.000
Item-Total Statistics
Scale Mean if Item Deleted
Scale Variance if
Item Deleted
Corrected Item-Total Correlation
Squared Multiple
Correlation
Cronbach's Alpha if Item
Deleted
GarmCONF1 4.0700 .268 .610 .372 .(a)
GarmCONF2 4.1400 .263 .610 .372 .(a)
a The value is negative due to a negative average covariance among items. This violates reliability model assumptions. You may want to check item codings. Scale Statistics
Mean Variance Std. Deviation N of Items
8.2100 .854 .92436 2
AESTHETIC Case Processing Summary
N %
Cases Valid 100 100.0
Excluded(a)
0 .0
Total 100 100.0
a Listwise deletion based on all variables in the procedure. Reliability Statistics
Cronbach's Alpha
Cronbach's Alpha Based
on Standardized
Items N of Items
.775 .798 3
Item Statistics
Mean Std. Deviation N
GarmAEST1 4.3400 .49686 100

145 | P a g e
GarmAEST2 4.2500 .57516 100
GarmAEST3 3.9400 .69369 100
Inter-Item Correlation Matrix
GarmAEST1 GarmAEST2 GarmAEST3
GarmAEST1 1.000 .795 .441
GarmAEST2 .795 1.000 .468
GarmAEST3 .441 .468 1.000
Item-Total Statistics
Scale Mean if Item Deleted
Scale Variance if
Item Deleted
Corrected Item-Total Correlation
Squared Multiple
Correlation
Cronbach's Alpha if Item
Deleted
GarmAEST1 8.1900 1.186 .701 .638 .630
GarmAEST2 8.2800 1.032 .709 .650 .589
GarmAEST3 8.5900 1.032 .481 .232 .881
Scale Statistics
Mean Variance Std. Deviation N of Items
12.5300 2.191 1.48021 3
PERCEIVED QUALITY Case Processing Summary
N %
Cases Valid 100 100.0
Excluded(a)
0 .0
Total 100 100.0
a Listwise deletion based on all variables in the procedure.
Reliability Statistics
Cronbach's Alpha
Cronbach's Alpha Based
on Standardized
Items N of Items
.714 .714 2
Item Statistics
Mean Std. Deviation N
GarmPERCQ1 3.9000 .68902 100
GarmPERCQ2 3.9200 .69165 100
Inter-Item Correlation Matrix
GarmPERCQ1 GarmPERCQ2
GarmPERCQ1 1.000 .555
GarmPERCQ2 .555 1.000
Item-Total Statistics
Scale Mean if Item Deleted
Scale Variance if
Item Deleted
Corrected Item-Total Correlation
Squared Multiple
Correlation
Cronbach's Alpha if Item
Deleted

146 | P a g e
GarmPERCQ1 3.9200 .478 .555 .308 .(a)
GarmPERCQ2 3.9000 .475 .555 .308 .(a)
a The value is negative due to a negative average covariance among items. This violates reliability model assumptions. You may want to check item codings. Scale Statistics
Mean Variance Std. Deviation N of Items
7.8200 1.482 1.21755 2
DURABILITY & RELIABILITY (single variables) Case Processing Summary
N %
Cases Valid 100 100.0
Excluded(a)
0 .0
Total 100 100.0
a Listwise deletion based on all variables in the procedure. Reliability Statistics
Cronbach's Alpha
Cronbach's Alpha Based
on Standardized
Items N of Items
.775 .776 2
Item Statistics
Mean Std. Deviation N
GarmREL1 4.0900 .62109 100
GarmDURA1 4.0000 .66667 100
Inter-Item Correlation Matrix
GarmREL1 GarmDURA1
GarmREL1 1.000 .634
GarmDURA1 .634 1.000
Item-Total Statistics
Scale Mean if Item Deleted
Scale Variance if
Item Deleted
Corrected Item-Total Correlation
Squared Multiple
Correlation
Cronbach's Alpha if Item
Deleted
GarmREL1 4.0000 .444 .634 .402 .(a)
GarmDURA1 4.0900 .386 .634 .402 .(a)
a The value is negative due to a negative average covariance among items. This violates reliability model assumptions. You may want to check item codings. Scale Statistics
Mean Variance Std. Deviation N of Items
8.0900 1.355 1.16424 2
FEATURES & SERVICEABILITY (single variables)
Case Processing Summary
N %

147 | P a g e
Cases Valid 100 100.0
Excluded(a)
0 .0
Total 100 100.0
a Listwise deletion based on all variables in the procedure. Reliability Statistics
Cronbach's Alpha
Cronbach's Alpha Based
on Standardized
Items N of Items
.619 .632 2
Item Statistics
Mean Std. Deviation N
GarmFEAT1 4.1000 .67420 100
GarmSERV1 4.0800 .52570 100
Inter-Item Correlation Matrix
GarmFEAT1 GarmSERV1
GarmFEAT1 1.000 .462
GarmSERV1 .462 1.000
Item-Total Statistics
Scale Mean if Item Deleted
Scale Variance if
Item Deleted
Corrected Item-Total Correlation
Squared Multiple
Correlation
Cronbach's Alpha if Item
Deleted
GarmFEAT1 4.0800 .276 .462 .213 .(a)
GarmSERV1 4.1000 .455 .462 .213 .(a)
a The value is negative due to a negative average covariance among items. This violates reliability model assumptions. You may want to check item codings. Scale Statistics
Mean Variance Std. Deviation N of Items
8.1800 1.058 1.02868 2
OVERALL CUSTOMER SATISFACTION Case Processing Summary
N %
Cases Valid 100 100.0
Excluded(a)
0 .0
Total 100 100.0
a Listwise deletion based on all variables in the procedure. Reliability Statistics
Cronbach's Alpha
Cronbach's Alpha Based
on Standardized
Items N of Items
.889 .892 2

148 | P a g e
Item Statistics
Mean Std. Deviation N
CUSTSAT1 4.1000 .55958 100
CUSTSAT2 4.1600 .61496 100
Inter-Item Correlation Matrix
CUSTSAT1 CUSTSAT2
CUSTSAT1 1.000 .804
CUSTSAT2 .804 1.000
Item-Total Statistics
Scale Mean if Item Deleted
Scale Variance if
Item Deleted
Corrected Item-Total Correlation
Squared Multiple
Correlation
Cronbach's Alpha if Item
Deleted
CUSTSAT1 4.1600 .378 .804 .647 .(a)
CUSTSAT2 4.1000 .313 .804 .647 .(a)
a The value is negative due to a negative average covariance among items. This violates reliability model assumptions. You may want to check item codings. Scale Statistics
Mean Variance Std. Deviation N of Items
8.2600 1.245 1.11573 2
SERVICES- Descriptive for reduced SERVQUAL SCALE
Descriptive Statistics
N Minimum Maximum Sum Mean Std. Deviation
Understanding 100 15.00 40.00 2991.00 29.9100 4.50834
Security 100 6.00 10.00 882.00 8.8200 1.03845
Tangibles 100 10.00 20.00 1584.00 15.8400 2.14486
Courtesy 100 5.00 10.00 822.00 8.2200 1.12439
Serviceability 100 6.00 15.00 1231.00 12.3100 1.67389
Valid N (listwise) 100
REGRESSION FOR REDUCED SERVQUAL SCALE Variables Entered/Removed(b)
Model Variables Entered
Variables Removed Method
1 Serviceability, Security, Understanding, Tangibles, Courtesy(a)
. Enter
a All requested variables entered. b Dependent Variable: CUSTSAT1

149 | P a g e
Model Summary(b)
Model
R R
Square
Adj R
Square
Std. Error of the
Estimate
Change Statistics
Durbin-Watson
R Square Change F change df1 Df2
Sig F change
1 .532(a) .283 .245 .48624 .283 7.424 5 94 .000 2.170
a Predictors: (Constant), Serviceability, Security, Understanding, Tangibles, Courtesy b Dependent Variable: CUSTSAT1 ANOVA(b)
Model Sum of
Squares df Mean Square F Sig.
1 Regression 8.776 5 1.755 7.424 .000(a)
Residual 22.224 94 .236
Total 31.000 99
a Predictors: (Constant), Serviceability, Security, Understanding, Tangibles, Courtesy b Dependent Variable: CUSTSAT1
Coefficients(a)
Model
Unstandardized Coefficients
Standardized Coefficients t Sig.
B Std. Error Beta B Std. Error
1 (Constant) 1.541 .518 2.975 .004
Understanding .033 .016 .268 2.083 .040
Security .025 .051 .047 .492 .624
Tangibles .048 .031 .185 1.542 .126
Courtesy -.069 .063 -.138 -1.093 .277
Serviceability .093 .036 .278 2.578 .012
a Dependent Variable: CUSTSAT1 Coefficient Correlations(a)
Model Serviceability Security Understan
ding Tangibles Courtesy
1 Correlations Serviceability 1.000 -.073 -.029 -.344 -.195
Security -.073 1.000 .017 -.217 -.097
Understanding -.029 .017 1.000 -.305 -.543
Tangibles -.344 -.217 -.305 1.000 -.091
Courtesy -.195 -.097 -.543 -.091 1.000
Covariances Serviceability .001 .000 -1.65E-005 .000 .000
Security .000 .003 1.36E-005 .000 .000
Understanding -1.65E-005 1.36E-005 .000 .000 -.001
Tangibles .000 .000 .000 .001 .000
Courtesy .000 .000 -.001 .000 .004
a Dependent Variable: CUSTSAT1 Residuals Statistics(a)
Minimum Maximum Mean Std. Deviation N
Predicted Value 3.2276 4.7932 4.1000 .29774 100
Residual -2.49189 .96669 .00000 .47380 100
Std. Predicted Value -2.930 2.328 .000 1.000 100
Std. Residual -5.125 1.988 .000 .974 100

150 | P a g e
a Dependent Variable: CUSTSAT1
GAMENTS – Descriptive for reduced GARVIN’s SCALE Descriptive Statistics
N Minimum Maximum Sum Mean Std. Deviation
Aesthetics 100 17.00 30.00 2464.00 24.6400 2.70995
Reliability 100 8.00 20.00 1602.00 16.0200 2.15547
Performance 100 8.00 15.00 1232.00 12.3200 1.47628
Valid N (listwise) 100
REGRESSION FOR REDUCED GARMENTS SCALE Variables Entered/Removed(b)
Model Variables Entered
Variables Removed Method
1 Performance, Reliability, Aesthetics(a)
. Enter
a All requested variables entered. b Dependent Variable: CUSTSAT1
Model Summary(b)
Model
R R
Square
Adj R
Square
Std. Error of the
Estimate
Change Statistics
Durbin-Watson
R Square Change F change df1 Df2
Sig F change
1 .647(a) .418 .400 .43343 .418 23.004 3 96 .000 2.156
a Predictors: (Constant), Performance, Reliability, Aesthetics b Dependent Variable: CUSTSAT1 ANOVA(b)
Model Sum of
Squares df Mean Square F Sig.
1 Regression 12.965 3 4.322 23.004 .000(a)
Residual 18.035 96 .188
Total 31.000 99
a Predictors: (Constant), Performance, Reliability, Aesthetics b Dependent Variable: CUSTSAT1
Coefficients(a)
Model
Unstandardized Coefficients
Standardized Coefficients t Sig.
B Std. Error Beta B Std. Error
1 (Constant) .588 .429 1.369 .174

151 | P a g e
Aesthetics .078 .022 .379 3.500 .001
Reliability .053 .028 .204 1.927 .057
Performance .060 .040 .157 1.500 .137
a Dependent Variable: CUSTSAT1 Coefficient Correlations(a)
Model Performance Reliability Aesthetics
1 Correlations Performance 1.000 -.336 -.389
Reliability -.336 1.000 -.412
Aesthetics -.389 -.412 1.000
Covariances Performance .002 .000 .000
Reliability .000 .001 .000
Aesthetics .000 .000 .001
a Dependent Variable: CUSTSAT1 Residuals Statistics(a)
Minimum Maximum Mean Std. Deviation N
Predicted Value 3.2698 4.8903 4.1000 .36188 100
Residual -2.41314 1.17434 .00000 .42682 100
Std. Predicted Value -2.294 2.184 .000 1.000 100
Std. Residual -5.568 2.709 .000 .985 100
a Dependent Variable: CUSTSAT1

152 | P a g e
Appendix G- Glossary of Statistical Data
1. Descriptive Statistics
Mean
The mean value is one of the simplest models used in statistics which represents a
summary of data. According to Field (2005) mean is a hypothetical value that can be
calculated for any set of data.
2. Reliability
A. service
Determinants of Service Quality in Clothing Industry
The choice of criterion may depend on the size of the average communalities and the
number of variables and participants. The Kaiser criterion has been recommended
where the number of variables is less than 30 and the average number of the
communalities is greater than 0.7 (Bryman et al. 2009).
Table Rotated Component Matrix- SERVQUAL scale (after removing SERVCRED3)
Rotated Component Matrix(a)
Component
1 2 3 4 5
Cronbach's Alpha .909 .981 .726 .808 .671
ServREL1 .018 .306 .023 .017 .832
ServRES1 .538 .146 .102 .468 .372
ServRES2 .625 -.094 .086 .508 .146
ServRES3 .245 -.342 .358 .222 .614
ServRES4 .336 -.181 .585 -.025 .530
ServCOURT1 .255 .155 .339 .767 -.016
ServCOURT2 .509 .091 .077 .695 .274
ServCOMM1 .776 .001 .282 .052 .181
ServCRED1 .052 .400 .181 .442 .609
ServCRED2 .615 .431 .103 -.092 .237
ServSEC1 .106 .900 .185 .114 .080
ServSEC2 .053 .907 .185 .118 .103
ServUNDER1 .841 .032 .073 .226 .085
ServUNDER2 .678 .180 .192 .368 .143
ServUNDER3 .789 -.004 .209 .155 -.071
ServUNDER4 .811 .076 .168 .173 -.025
ServTANG1 .139 .383 .701 .064 .184
ServTANG2 .172 .252 .752 .352 -.093
ServTANG3 .331 .133 .691 .159 .217
Extraction Method: Principal Component Analysis. Rotation Method: Varimax with Kaiser Normalization.
a Rotation converged in 11 iterations.

153 | P a g e
B. Garments
Table Communalities-Garvin’s scale (after extraction GARMSERV1)
Rotated Component Matrix(a)
Component
1 2 3
Cronbach's Alpha
.863 .816 .776
GarmPERF1 .110 .112 .843
GarmPERF2 .307 .285 .778
GarmPERF3 .017 .674 .395
GarmFEAT1 .297 .359 .639
GarmREL1 .078 .820 .209
GarmCONF1 .711 .400 .021
GarmCONF2 .610 .194 .260
GarmDURA1 .484 .710 .183
GarmAEST1 .843 .071 .160
GarmAEST2 .817 .069 .189
GarmAEST3 .566 .268 .458
GarmPERCQ1 .562 .520 .354
GarmPERCQ2 .306 .713 .102
Extraction Method: Principal Component Analysis. Rotation Method: Varimax with Kaiser Normalization.
a Rotation converged in 5 iterations.
3. Regression Analysis
Regression has become one of the most common techniques in the analysis of data in
the social sciences and can be used to explore relationships between pairs of variables
(Bryman et al. 2009).
• ANOVA- tests whether the model is better at predicting the outcome than using
the mean as’ best guess’.
As per Bryman et al (2009) there are two rows in the Model column; regression
(variation accounted for the model) and residual (variation that is not accounted
for by the model).
• Durbin-Watson statistic which says whether the assumption of independent
errors is tenable (Field, 2005).
• Coefficients - T-tests measures of whether the predictor contributing to the
overall model. The predictor is making a significant contribution to the model if
the Sig. value is less than .05 (Field, 2005).

154 | P a g e
Appendix H- Determinants of service quality- Data Analysis
Determinants of service quality
SERVREL (reliability) consistency of performance and dependability. It means that the firm
performs the service right the first time (accuracy in billing, keeping records correctly)
SERVRESP1 (responsiveness 1)- concerns the willingness or readiness of employees to provide
service (i.e. checking the sizes in the stock room).
SERVRESP2 (responsiveness 2)- employees are never too busy to respond to customers
request.
SERVRESP3 (responsiveness 3)-the waiting time outside fitting room is generally acceptable
for customers.
SERVRESP4 (responsiveness4) -the waiting time taken at the billing counter is generally
acceptable for customers.
SERVCOURT1 (courtesy 1)-ZARA personnel always look professional.
SERVCOURT2 (courtesy 2)-ZARA employees are consistently courteous with customers.
SERVCOMM1(communication 1)- ZARA personnel provide appropriate explanation on
garments.
SERVCRED1 (credibility 1)- ZARA performs its service right the first time.
SERVCRED2 (credibility 2)- when customer has a problem ZARA shows a sincere interest in
solving it.
SERVCRED3 (credibility 3)- ZARA is known for keeping its promises (i.e. exchange or full
refund).
SERVSEC1(security 1)- customers feel safe in transactions with ZARA (i.e. payment security)
SERVSEC2 (security 2)-customers feel safe shopping at ZARA.
SERVUNDER1 (understanding 1)-the ZARA has employees who provide customer individual
attention.
SERVUNDER2 (understanding 2)-the behaviour of ZARA employees instill confidence in
customers.
SERVUNDER3(understanding 3)-ZARA employees have the knowledge to answer customers’
enquiries.
SERVUNDER4 (understanding 4)- ZARA employees understand the specific needs of their
customers.
SERVTANG1 (tangibility 1)- ZARA stores atmosphere and decor are appealing.
SERVTANG2 (tangibility 2)-ZARA employees’ uniforms appear neat.
SERVTANG3 (tangibility 3)-materials associated with the service (such as pamphlets with
promotions) are visually appealing.

155 | P a g e
Appendix I- Garments dimensions of quality- Data Analysis
Garments dimensions of quality
GARMPERF1 (performance 1) -ZARA provide a variety of sizes.
GARMPERF2 (performance 2) -ZARA garments are comfortable.
GARMPERF3 (performance 3) -ZARA garments are ‘easy care’ (i.e. washing, ironing).
GARMFEAT1 (feature 1) -Zara garments fit well.
GARMREL1 (reliability 1) -ZARA garments wear well within a specific period of time.
GARMCONF1 (conformance 1)- The ZARA branded garments are of good reputation.
GARMCONF2 (conformance 2)-The description of ZARA garments is consistent with the
actual product (i.e. fabric, colour).
GARMDURA1 (durability 1)-ZARA garments are durable (considering material, structural
and stylistic durability).
GARMSERV1(serviceability 1)-ZARA garments have clear care labels and guarantees.
GARMAEST1 (aesthetics 1) - ZARA garments are stylish.
GARMAEST2 (aesthetics 2) - ZARA garments look modern and are of original design.
GARMAEST3 (aesthetics 3) -ZARA garments fabric line/ details (sewing and finishing
methods) are of high quality.
GARMPERCQ1 (perceived quality 1)-ZARA brands garments are of high quality.
GARMPERCQ2 (perceived quality 2) -ZARA garments are good value for money.

156 | P a g e
Appendix J- Additional Statistics- Service
To test the normality of residuals the histogram (Fig) and normal probability plot (Fig)
are checked.
The histogram looks like a normal distribution (a bell-shaped curve). The distribution is
roughly normal, although there are slight deficiencies in the residuals.
Figure Histogram-Regression Standardized Residual
Similarly, the normal probability plot (Fig. below) shows up small deviation from
normality. Normal distribution in this plot is represented by the straight line, and the
points represent the observed residuals. In a perfectly normally distributed data set, all
points lie on the line (Field, 2005). In this P-Plot some of the dots are distant from the
line, which indicates small variations from normality.
Regression Standardized Residual
20-2-4-6
Fre
qu
en
cy
40
30
20
10
0
Histogram
Dependent Variable: CUSTSAT1
Mean =1.42E-15 Std. Dev. =0.974
N =100

157 | P a g e
Figure P-Plot of Regression
Observed Cum Prob
1.00.80.60.40.20.0
Ex
pe
cte
d C
um
Pro
b
1.0
0.8
0.6
0.4
0.2
0.0
Normal P-P Plot of Regression Standardized Residual
Dependent Variable: CUSTSAT1

158 | P a g e
Appendix K- Additional Statistics- Garments
Similarly to the case of customer satisfaction with the quality of service, the histogram
for satisfaction with garments quality looks like a normal distribution (a bell-shaped
curve). The distribution is even closer to a perfect shape of the normal distribution.
Figure Histogram- Regression Standardized Residual-Garments
In this P-Plot not all points lie on the line, and it is noticeable that some of the dots are
distant from the line. This presents some deviation from normality.
Regression Standardized Residual
420-2-4-6
Fre
qu
ency
40
30
20
10
0
Histogram
Dependent Variable: CUSTSAT1
Mean =8.5E-17 Std. Dev. =0.985
N =100

159 | P a g e
Figure Figure P-Plot- Garments
Observed Cum Prob
1.00.80.60.40.20.0
Exp
ecte
d C
um
Pro
b
1.0
0.8
0.6
0.4
0.2
0.0
Normal P-P Plot of Regression Standardized Residual
Dependent Variable: CUSTSAT1

160 | P a g e
Appendix L-Approaches to Quality
Garvin (1984) framework concerning approaches to quality suggests that there are at
least four disciplines including philosophy, economics, marketing, operations
management, and each of them has viewed quality from a different perspective,
focusing on distinct aspects of quality.
The first major approach to the definition of quality identified by Garvin (1984) is the
transcendent approach of philosophy, according which quality is synonymous with
‘innate excellence’. According to Sower et al. (2005) the transcendent approach is the
least understood and least utilized of the five approaches identified by Garvin, and is
mentioned as being the realm of philosophers before discussion is quickly shifted to
more “practical” approaches. Proponent of this view claim that quality cannot be
defined precisely; rather it is a simple, analyzable property that we learn to recognize
only through experience (Brown et al., 2001). Sower et al. (2005) think that listening to
Plato and following the transcendent approach to quality enables one to advance to the
insight level of awareness and develop the breakthrough products and technologies of
the 21st century. This is the basis for technological leadership and quality leadership as
well.
A product based definition of quality views quality as a precise and measurable
variable. According to this view, differences in quality reflect differences in the quantity
of some ingredient or attribute possessed by a product (Mehta, 1998).
Garvin (1984) argues that this approach leads to vertical or hierarchical dimensions of
quality, for goods can be ranked according to amount of the desired attribute that they
possess. It is worth to mention that an unambiguous ranking is possible only if the
attributes in question are considered preferable by virtually all buyers.

161 | P a g e
A user based definition of quality simply means that quality is whatever the customer
says or wants - which goes back to meeting or exceeding customers’ requirements and
expectations (Mehta, 1998). Individual consumers however are assumed to have
different wants or needs, and those goods that best satisfy their preferences are those
that they regard as having the highest quality. This is idiosyncratic and personal view of
quality, and one that is highly subjective (Garvin, 1984). As per Kelemen (2003)
marketers have done a great deal to indentify the needs of the customers through
‘preference testing’ in order to sensitize the manufacturers to what is significant for
customers.
In contrast, manufacturing-based definitions focus on the supply side of the equation,
and are primarily concerned with engineering and manufacturing practices (Garvin,
1984). This managerial approach defines quality as the degree to which a specific
product conforms to a design or specification; where quality is defined as conformance
to requirements (Crosby, 1979).Process and design variation are seen to be a constant
thread to achieving conformance to requirements. Some researchers argue that
variations can be totally eliminated (i.e. Crosby’s ‘zero defects’ philosophy), others (i.e.
Deming) are of the opinion that only a certain type of variation is controllable.
It is generally accepted; however that if the design and the production process are stable
and reliable, quality is inherent (Kelemen, 2003). According to manufacturing-based
approach, improvements in quality lead to lower costs, for preventing defects is viewed
as less expensive than repairing or reworking them (Garvin, 1984). In order to achieve
consistency in design companies can employ Taguchi methods of designing engineering
that assume that any deviation from the centre, no matter how small, increases a
product’s ultimate cost, including warranty, liability, lost customer goodwill (Kelemen,
2003).

162 | P a g e
The last approach to the Garvin’s definition of quality is value- based approach that
takes the cost reduction goal one step further. This approach defines quality in terms of
costs and practices according which a quality product is one that provides performance
at an acceptable price or conformance at an acceptable cost (Garvin, 1984). The
relationship between quality and cost is very complex and in the western manufacturing
paradigm is held to be a direct one, that is, the better quality presupposes higher costs.
Additionally this relationship is fraught with difficulties, as it is widely accepted that
price affects people’s perceptions of quality; for some consumers, smaller prices (i.e.
‘value for money’) signal reasonable quality at competitive prices. On the other hand, at
the upper end of the market, high prices signal uniqueness and exquisite quality
reserved only for the few who can afford it (Kelemen, 2003).

163 | P a g e
Appendix M- ZARA- Focus on customers
According to Inditex Annual Report (2011) for Inditex business model customers are at
the heart of any activity. The following points are discussed in the report’s section
relating to customers;
• The group focus on its customers’ decisions and needs, not only from the fashion
point of view but all other aspects that complete the purchasing experience, including
quality, safe and sustainable products, local stores in the main shopping areas of
cities and customers care as well attention from the staff;
• The social responsibility policy consist the group’s commitment to the customer that
inspires all the activities of the Group. These are carried out in accordance with the
highest standards of quality, safety and environmental sustainability;
• Being obliged to their clients Inditex has developed two internal standards: Clear to
Wear (ensures the healthiness of the product) and Safe to Wear (guarantees its
safety) on product health and safety. These standards aim to meet the most exacting
requirements regarding product quality worldwide, and are necessary for all
suppliers.
In Inditex the products and processes are regularly inspected and as per the Annual
Report (2011) only in 2011 over 250,000 chemical analyses of products were carried
out, as well as 1,900 factory inspection visits and 17,000 tests and analyses.