Embed Size (px)
Citation preview
MEESOOK KIM and KYUNG-HO CHO
QUALITY OF LIFE AMONG GOVERNMENT EMPLOYEES
ABSTRACT. The main purpose of this study is to examine distinctive aspects ofthe quality of life (QOL) of Korean government employees utilizing in large partmany features of the 1999 QOL survey of Korean government and private sectoremployees. To this end, responses of government and private sector employeesregarding various dimensions of QOL are compared. This study finds that theQOL of government employees is significantly lower than that of private sectoremployees. The result of regression analysis of QOL dimensions shows that thelevel of satisfaction with one’s work environment is the most influential deter-minant of the overall QOL of Korean government employees. Based on thisfinding, this study recommends that the government agencies consider improvingtheir employees’ work-related environment.
I. INTRODUCTION
The roles of Korean government employees are very much intransition. Their behavior had always been in conformity with thedemands of policymakers and politicians. Recently, they becamemore assertive, however, about their own views and opinions indesigning various economic and political initiatives. It is becomingclear, furthermore, that many of the past human-resource manage-ment policies and programs in the public sector are inadequatefor any future work environment. Considerable attention is beingpaid, in particular, to the needs and expectations of governmentemployees regarding their attempts to balance their work and privatelives (Kim and Cho, 2000). Some observers and managers havefound that current government employees behave in their owninterests in the workplace, and perceive their job as not a mere partof public affairs, but as a place to enhance their individuality andpersonal development (Cho, 1997; Lim, 1995).
The importance of QOL in Korean government agencies isaccentuated, more than ever before, in the current era of glob-alization. If the government fails to respond to the demand for
Social Indicators Research 62, 63: 387–409, 2003.© 2003 Kluwer Academic Publishers. Printed in the Netherlands.
388 MEESOOK KIM AND KYUNG-HO CHO
QOL enhancement of public employees, it will eventually be placedat a competitive disadvantage compared private counterparts. AsCho (1997) pointed out, government manger typically regard them-selves as captives of a series of cumbersome internal management“systems” over which they have no control, and they believe thatthey are suffering form a lack of discretion, freedom, and individu-ality, some evidence suggest that the resulting erosion of the moraleand confidence among government employees may cause disruptionof public responsibilities and self-trust (Cho and Kim, 2000; Parkand Won, 2000). Many studies warn, moreover, that the currentsystem of government workers is losing high-quality employeesdue to its declining pay levels as well as the declining prestige oftheir occupation (Cho, 1997; Kim, 1994). For these reasons, Koreanpublic administration today faces a number of overriding issues;increasing one’s sense of personal commitment to their respectiveagencies.
The challenge of the Korean government is to respond to socialchanges that places emphasis on non-material benefits, especiallysocial relationships. QOL within many agencies today is much morethan a composite of material incentives for their employees; it isincreasing perceived as a pivotal element in fulfilling employees’need for self-actualization in an organization. Keeping this socialcontext in mind, the Civil Service Commission of Korea (hereinafterthe CSC of Korea), the government’s primary personnel manage-ment agency, conducted a nationwide survey in 1999 to assess thelevel of QOL of government employees, and the results were madepublic (Kim and Cho, 2000). With limited funding arranged by theNational Assembly, the CSC of Korea provides government-widehuman resource management policies, guidance, and oversight forsome one-half million central government employees.
This paper attempts to delineate the major dimensions of QOLfrom a subjective perspective, and thereby evaluate the quality of lifeexperienced by government employees. What constitutes the QOLpeople themselves experience on a daily basis? How do governmentemployees compare with private sector employees in the experienceof it? Do government employees really experience a lesser QOLthan private sector employees? If so, in what domains of QOL dothe two groups show a significant difference, and to what extent?
QUALITY OF LIFE AMONG GOVERNMENT EMPLOYEES 389
What factors determine the QOL government employees? These arethe specific questions we attempt to address in this paper.
There has been considerable research on the public-private differ-ences in work-related behaviors and attitudes (Cho, 2000; Cho andKim, 2000; Chubb and Moe, 1988; Posner and Schmidt, 1996;Rainey et al., 1995; Schmidt, 1996; Rainey et al., 1995; Schneiderand Vaught, 1993). Yet, few studies have investigated the differ-ences in QOL scores between the public and private sectors. Thepresent study, therefore, seeks to fill this gap in the literature byexamining the QOL differences between the two sectors, and also byinvestigating the various forces affecting the perceived QOL amongKorean government employees.
II. MODELS OF QUALITY OF LIFE
Approaches
The quality of life at community and individual levels has beenmeasured and evaluated from a variety of perspectives (Haas, 1999;Seed and Lloyd, 1997). In Korea, local governments have recentlyincreased their efforts to measure QOL by using objective indi-cators, such as average income, employment rate, and crime rates(Ha, 1996). Kim et al. (1998) examined the changing QOL in localcommunities by focusing on six domains, including educationalopportunity, sports and recreation, health, and safety. According tothe objective indicators of these life domains, the QOL in manyof those communities has deteriorated since the local autonomysystem was introduced in 1995. Unlike these studies that deal withthe objective conditions of local communities, Cho and Oh (1993)focused on the life experiences or perceptions of community resi-dents. They examined how residents of Kyungju perceived the heathand pleasure of their living environment, the providing of public andprivate services, and neighborhood safety.
There have also been two approaches to the study of QOLamong employees of the private and public sectors. The first oneis widely regarded as “objective” because it is based on a range ofthe economic and other resources those employees command. Thesecond approach involves efforts to understand to what degree theseemployees are satisfied with particular organized policies and living
390 MEESOOK KIM AND KYUNG-HO CHO
conditions. There have been, however, discrepancies in the QWOLbetween employees’ self-ratings and government statistics (or thestatistics of employing organizations). Despite the inconsistencybetween the objective and subjective results, many scholars agreewith the view that the employees’ subjective evaluation of QOL isvery important for continuing improvement in government adminis-tration (Poister and Henry, 1994; Gold and Wooldridge, 1995;United States Merit Systems Protection Board, 1991). Betweenthese two approaches, we employ the subjective one because peoplechoose or do not choose to work in government agencies on the basisof their perceptions of what is offered in those agencies.
A Multi-Dimensional Model
Under the guidance of its Civil Service Commission, the Koreangovernment recently began an innovative effort to enhance the QOLof its employees. Two projects have been initiated according to thisplan. One was to assess the needs for reinventing personnel prac-tices in Korea (Korean CSC, 1999); the other was to compare theperceptions of the QOL of government and private sector employees(Kim and Cho, 1999). These QOL programs were designed inorder to achieve three specific goals. They were to: (1) increasethe ability of government agencies to attract and retain employeesin critical occupations and positions, such as technical and scien-tifically research; (2) provide increased benefits for severely under-represented individuals, such as women and the handicapped; and(3) provide diverse opportunities to balance work responsibilitiesand family needs, which have generally been neglected in the studyof personnel administration.
Private firms in Korea are beginning to respond to the needs ofworking parents with new policies respecting child care, flexibilityin the workplace and scheduling, and other concerns. Governmentagencies rarely address these QOL issues through reforms in thearea of personnel and the work environment. Therefore, govern-ment agencies are at a competitive disadvantage in recruiting andmaintaining qualified employees. To redress this problem, the CSCdeveloped a multi-dimensional model of QOL among governmentemployees. This model, which reflects the private sector modelof QOL, consists of ten life domains. These domains include
QUALITY OF LIFE AMONG GOVERNMENT EMPLOYEES 391
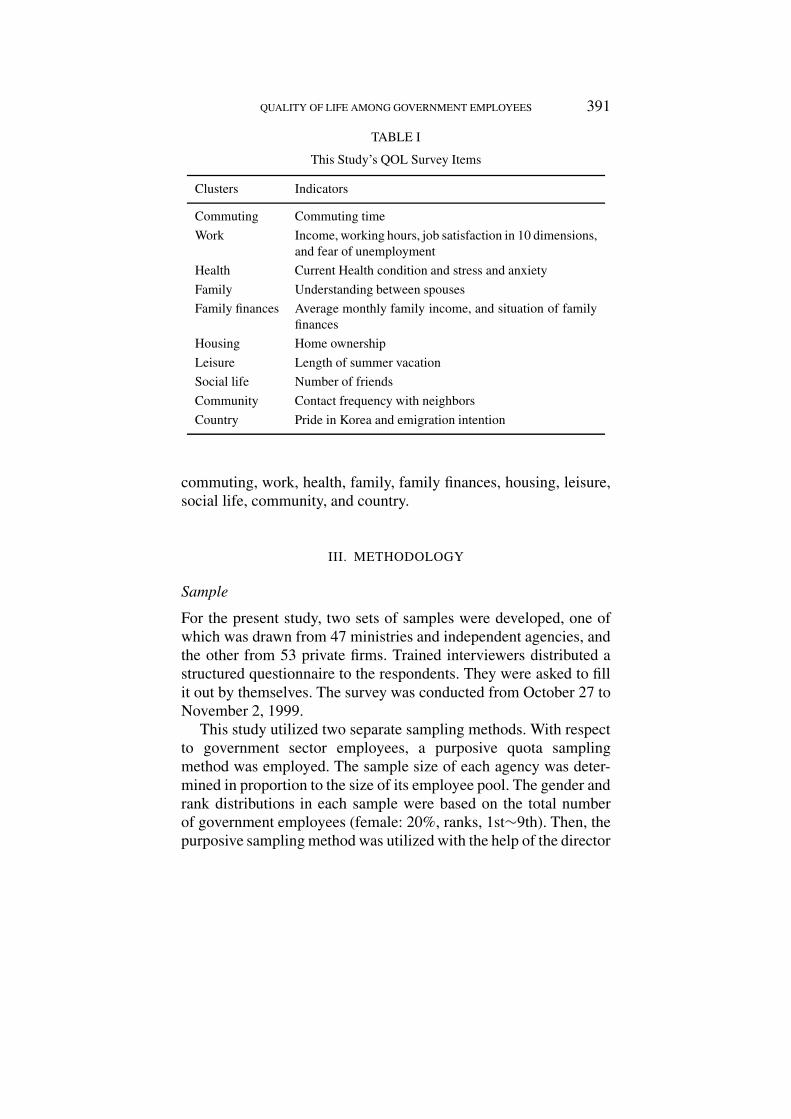
TABLE I
This Study’s QOL Survey Items
Clusters Indicators
Commuting Commuting time
Work Income, working hours, job satisfaction in 10 dimensions,and fear of unemployment
Health Current Health condition and stress and anxiety
Family Understanding between spouses
Family finances Average monthly family income, and situation of familyfinances
Housing Home ownership
Leisure Length of summer vacation
Social life Number of friends
Community Contact frequency with neighbors
Country Pride in Korea and emigration intention
commuting, work, health, family, family finances, housing, leisure,social life, community, and country.
III. METHODOLOGY
Sample
For the present study, two sets of samples were developed, one ofwhich was drawn from 47 ministries and independent agencies, andthe other from 53 private firms. Trained interviewers distributed astructured questionnaire to the respondents. They were asked to fillit out by themselves. The survey was conducted from October 27 toNovember 2, 1999.
This study utilized two separate sampling methods. With respectto government sector employees, a purposive quota samplingmethod was employed. The sample size of each agency was deter-mined in proportion to the size of its employee pool. The gender andrank distributions in each sample were based on the total numberof government employees (female: 20%, ranks, 1st∼9th). Then, thepurposive sampling method was utilized with the help of the director
392 MEESOOK KIM AND KYUNG-HO CHO
of the human resources department in each agency. The directorsassisted the interviewers in selecting respondents fitting into thegender and rank distributions.
As for private sector employees, two-stage cluster sampling andpurposive sampling methods were used. First, from a list of 679“outstanding firms” each with more than 100 full-time workers, 150private firms, all in cities where the government ministries and agen-cies were located, were selected randomly. After classifying theminto three groups based on the number of employees (large, medium,and small size firms), fifty-three firms were chosen for the survey:14 firms with 100–499 employees (small); 16 firms with 300–499employees (medium); and 23 firms with 500 or more employees(large). From each firm, respondents were selected in proportionto the gender and rank distributions within the public sector.1 Thenumber of selected employees varied depending upon the numberof employees in the firm: (19–21 respondents form lager firms, 9–11 respondents from medium-sized firms, and 4–5 respondents fromsmall firms). With the assistance of the directors of the respectivedepartments of human resources, respondents fitting into the genderand rank distribution were selected.
Characteristics of the Sample
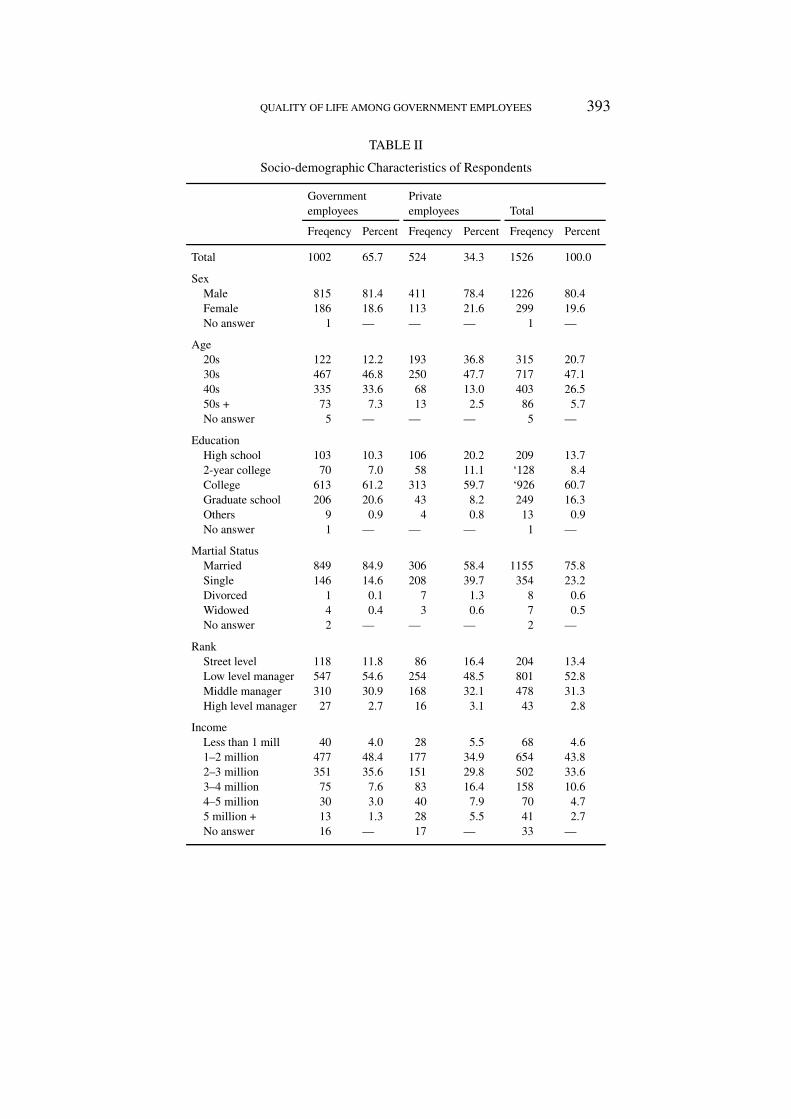
The two sectors were found to be slightly different from one anotherin terms of socio-demographic variables (see Table II). Governmentemployees were found to be older than their private sector coun-terparts (the average age of government employees was 37.9, whilethat of private sector employees was 32.4). More female employeeswere selected from private firms than the government (18.6% forthe government sector and 21.6% for the private sector). Govern-ment employees outstripped private sector employees in terms ofyears of educational and degrees earned. As for educational attain-ment, the proportion of those without a college education amonggovernment employees was much lower than that of the privatesector employees (10.3% versus 20.2%). The percentage distri-bution of college degrees was similar between the two groups:(government employees 68.2%; private employees 70.8%). Withrespect to graduate school, however, over 20 percent of government
QUALITY OF LIFE AMONG GOVERNMENT EMPLOYEES 393
TABLE II
Socio-demographic Characteristics of Respondents
Government Privateemployees employees Total
Freqency Percent Freqency Percent Freqency Percent
Total 1002 65.7 524 34.3 1526 100.0
SexMale 815 81.4 411 78.4 1226 80.4Female 186 18.6 113 21.6 299 19.6No answer 1 — — — 1 —
Age20s 122 12.2 193 36.8 315 20.730s 467 46.8 250 47.7 717 47.140s 335 33.6 68 13.0 403 26.550s + 73 7.3 13 2.5 86 5.7No answer 5 — — — 5 —
EducationHigh school 103 10.3 106 20.2 209 13.72-year college 70 7.0 58 11.1 ‘128 8.4College 613 61.2 313 59.7 ‘926 60.7Graduate school 206 20.6 43 8.2 249 16.3Others 9 0.9 4 0.8 13 0.9No answer 1 — — — 1 —
Martial StatusMarried 849 84.9 306 58.4 1155 75.8Single 146 14.6 208 39.7 354 23.2Divorced 1 0.1 7 1.3 8 0.6Widowed 4 0.4 3 0.6 7 0.5No answer 2 — — — 2 —
RankStreet level 118 11.8 86 16.4 204 13.4Low level manager 547 54.6 254 48.5 801 52.8Middle manager 310 30.9 168 32.1 478 31.3High level manager 27 2.7 16 3.1 43 2.8
IncomeLess than 1 mill 40 4.0 28 5.5 68 4.61–2 million 477 48.4 177 34.9 654 43.82–3 million 351 35.6 151 29.8 502 33.63–4 million 75 7.6 83 16.4 158 10.64–5 million 30 3.0 40 7.9 70 4.75 million + 13 1.3 28 5.5 41 2.7No answer 16 — 17 — 33 —
394 MEESOOK KIM AND KYUNG-HO CHO
employees had a graduate school degree, while only 8.2 percent ofprivate sector employees did.
With respect to martial status, government employees have ahigher marriage rate than private sector employees, which may beattributable to the age differences between the two groups. In termsof rank, public employees are crowed at the middle range ranks,whereas private employees are more evenly distributed. Govern-ment employees report a lower income than their private sectorcounterparts. Another difference between the two groups was thatgovernment employees were found to be in the middle incomerange, while private sector employees were more likely to earneither a low or high income.
In sum, government employees were: older; had a highermarriage rate, and a higher education level; but earned less thantheir private sector counterparts. Since these group characteristicsare likely to affect people’s QOL, a careful interpretation is neces-sary when comparing the two groups. Accordingly, we will take alook at the QOL of government employees in ten life domains.
IV. THE QOL OF GOVERNMENT EMPLOYEES IN TEN DOMAINS
Commuting
Since commuting affects the daily lives of workers, commuting timeis widely considered to be one of several important factors of QOL.One may assume at this point that a long commuting time is closelyrelated to high stress and fatigue, and thus may lead to poor QOL.The comparison of commuting time between the two groups hasrevealed that government employees spend less time on commutingthan their private sector counterparts. While 73.7 percent of govern-ment employees spend less than one hour on commuting, only 69.5percent of private employees spend the same amount of time on it.This indicates that government employees live closer to their work-places. Meanwhile, the proportion of employees, who spend morethan one-and-a-half hours commuting, is higher among govern-ment sector employees (6.3%), than among private sector employees(4.2%). This, however, constitutes only a small portion of the overalldistribution of commuting time.
QUALITY OF LIFE AMONG GOVERNMENT EMPLOYEES 395
Work
The fact that employees spend most of their daytime hours at workrequires us to take a comprehensive look at their work environ-ment. Here we measured work-related factors such as income levels,working hours, satisfaction levels and fear of unemployment invarious aspects of work and job security.
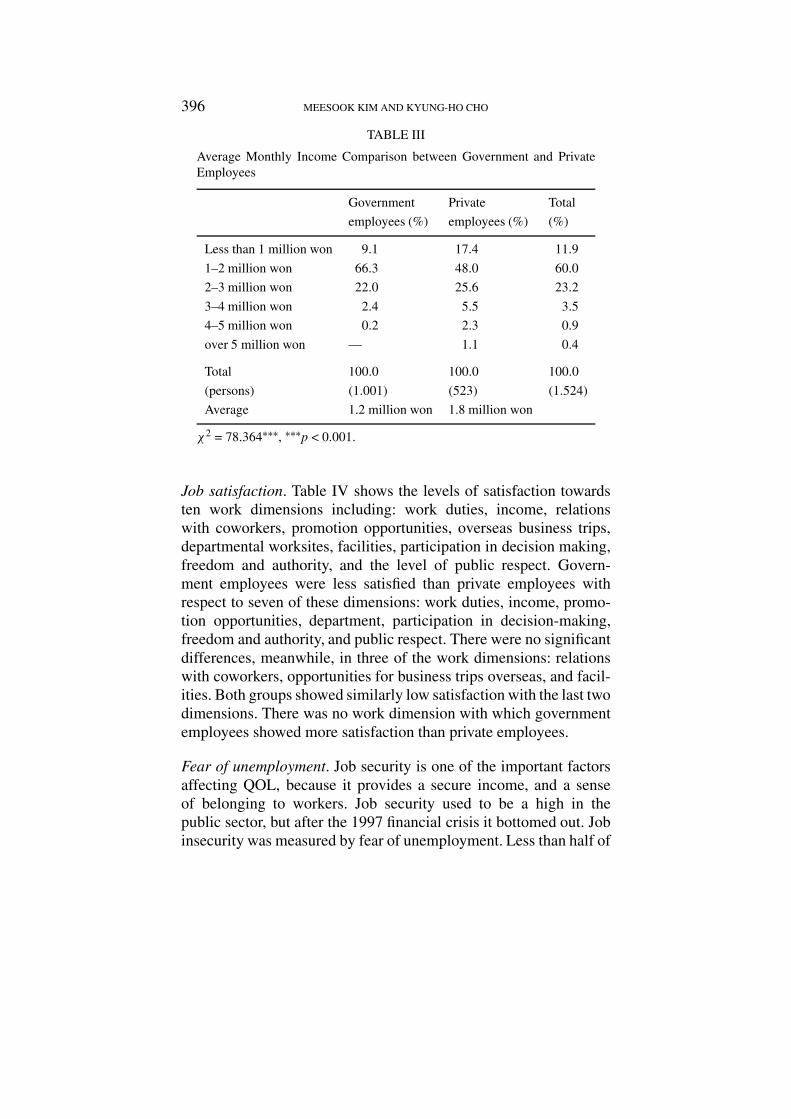
Income. The current survey shows that government employees earnless than private employees. The former earn about 1.2 million wona month on average, while the average income for the latter stands inthe range of 1.8 million won a month (see Table III). The proportionof those who earn less than one million won, however, is higheramong private employees. This may stem from the fact that theprivate sector, in comparison with the government sector, has morefemale workers, who are younger and less educated, than their malecounterparts. In the second lowest income level, the proportion ofgovernment employees (66.4%) is much higher than that of privateemployees (48.0%), which means that most government employeesearn a comparatively lower income. Furthermore, while only 2.6percent of government employees earn more than 3 million won,as much as 8.9 percent of private employees earn such an income.There are no government employees who earn more than 5 millionwon, but 1.1 percent of private employees earn that amount. Inter-estingly, the income distribution among government employees ismuch more concentrated than that among private employees.
Hours of work. Korean workers are known for working the longesthours in the world. When comparing work hours between govern-ment and private sector employees, the former work longer than thelatter. While only 18.7 percent of government employees stoppedworking within an hour after the end of working hours, as many as40.3 percent of the private employees stopped working within thesame period. In addition, the proportion of government employees,who worked four hours overtime was 20.4 percent, but the figure forprivate employees was only 7.6 percent. In other words, governmentemployees, despite their longer hours of work, received less incomethan the private sector workers did. Government employees face adoubly unfavorable work situation.
396 MEESOOK KIM AND KYUNG-HO CHO
TABLE III
Average Monthly Income Comparison between Government and PrivateEmployees
Government Private Total
employees (%) employees (%) (%)
Less than 1 million won 9.1 17.4 11.9
1–2 million won 66.3 48.0 60.0
2–3 million won 22.0 25.6 23.2
3–4 million won 2.4 5.5 3.5
4–5 million won 0.2 2.3 0.9
over 5 million won — 1.1 0.4
Total 100.0 100.0 100.0
(persons) (1.001) (523) (1.524)
Average 1.2 million won 1.8 million won
χ2 = 78.364∗∗∗, ∗∗∗p < 0.001.
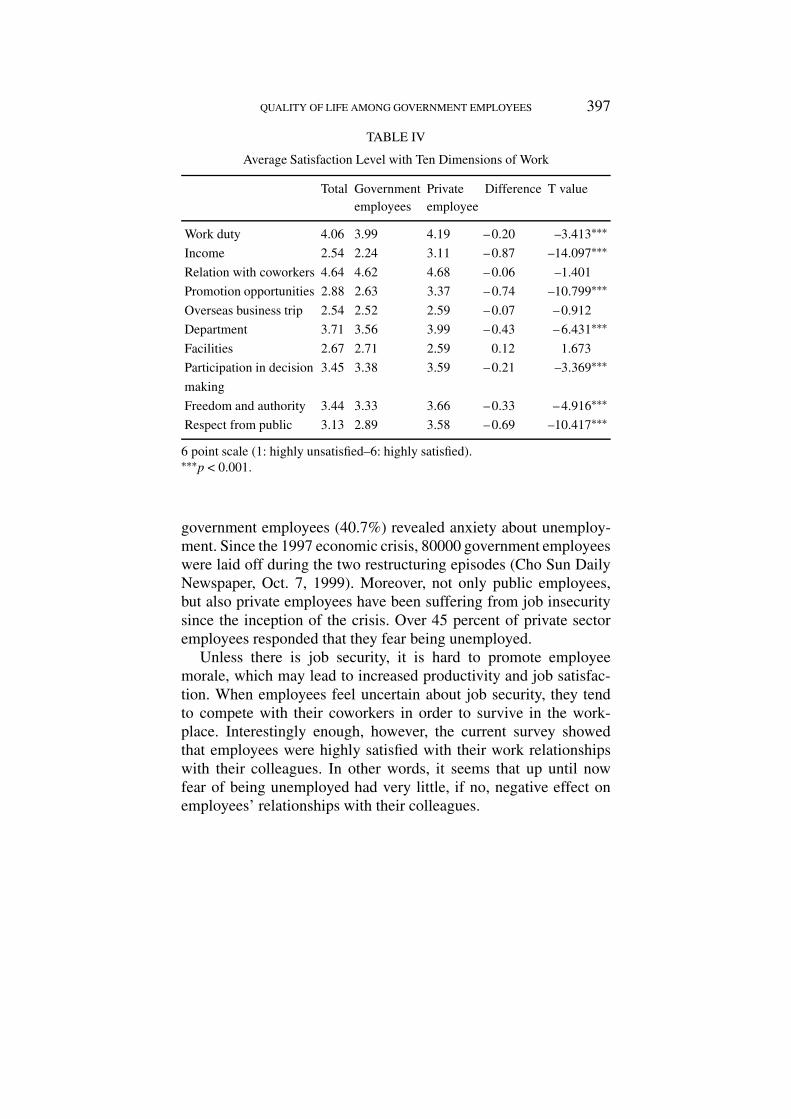
Job satisfaction. Table IV shows the levels of satisfaction towardsten work dimensions including: work duties, income, relationswith coworkers, promotion opportunities, overseas business trips,departmental worksites, facilities, participation in decision making,freedom and authority, and the level of public respect. Govern-ment employees were less satisfied than private employees withrespect to seven of these dimensions: work duties, income, promo-tion opportunities, department, participation in decision-making,freedom and authority, and public respect. There were no significantdifferences, meanwhile, in three of the work dimensions: relationswith coworkers, opportunities for business trips overseas, and facil-ities. Both groups showed similarly low satisfaction with the last twodimensions. There was no work dimension with which governmentemployees showed more satisfaction than private employees.
Fear of unemployment. Job security is one of the important factorsaffecting QOL, because it provides a secure income, and a senseof belonging to workers. Job security used to be a high in thepublic sector, but after the 1997 financial crisis it bottomed out. Jobinsecurity was measured by fear of unemployment. Less than half of
QUALITY OF LIFE AMONG GOVERNMENT EMPLOYEES 397
TABLE IV
Average Satisfaction Level with Ten Dimensions of Work
Total Government Private Difference T valueemployees employee
Work duty 4.06 3.99 4.19 – 0.20 –3.413∗∗∗
Income 2.54 2.24 3.11 – 0.87 –14.097∗∗∗
Relation with coworkers 4.64 4.62 4.68 – 0.06 –1.401
Promotion opportunities 2.88 2.63 3.37 – 0.74 –10.799∗∗∗
Overseas business trip 2.54 2.52 2.59 – 0.07 – 0.912
Department 3.71 3.56 3.99 – 0.43 – 6.431∗∗∗
Facilities 2.67 2.71 2.59 0.12 1.673
Participation in decision 3.45 3.38 3.59 – 0.21 –3.369∗∗∗
making
Freedom and authority 3.44 3.33 3.66 – 0.33 – 4.916∗∗∗
Respect from public 3.13 2.89 3.58 – 0.69 –10.417∗∗∗
6 point scale (1: highly unsatisfied–6: highly satisfied).∗∗∗p < 0.001.
government employees (40.7%) revealed anxiety about unemploy-ment. Since the 1997 economic crisis, 80000 government employeeswere laid off during the two restructuring episodes (Cho Sun DailyNewspaper, Oct. 7, 1999). Moreover, not only public employees,but also private employees have been suffering from job insecuritysince the inception of the crisis. Over 45 percent of private sectoremployees responded that they fear being unemployed.
Unless there is job security, it is hard to promote employeemorale, which may lead to increased productivity and job satisfac-tion. When employees feel uncertain about job security, they tendto compete with their coworkers in order to survive in the work-place. Interestingly enough, however, the current survey showedthat employees were highly satisfied with their work relationshipswith their colleagues. In other words, it seems that up until nowfear of being unemployed had very little, if no, negative effect onemployees’ relationships with their colleagues.
398 MEESOOK KIM AND KYUNG-HO CHO
Health
Current health condition. An overall review of their respectivehealth conditions was achieved by utilizing a six-point scale ques-tionnaire (1: very poor, 6: excellent). Over 70 percent of workersresponded that they were in good health, (70.9% for the governmentemployees, and 73.3% for the private employees). There are no stat-istically significant differences between the two groups regardingtheir respective states of health.
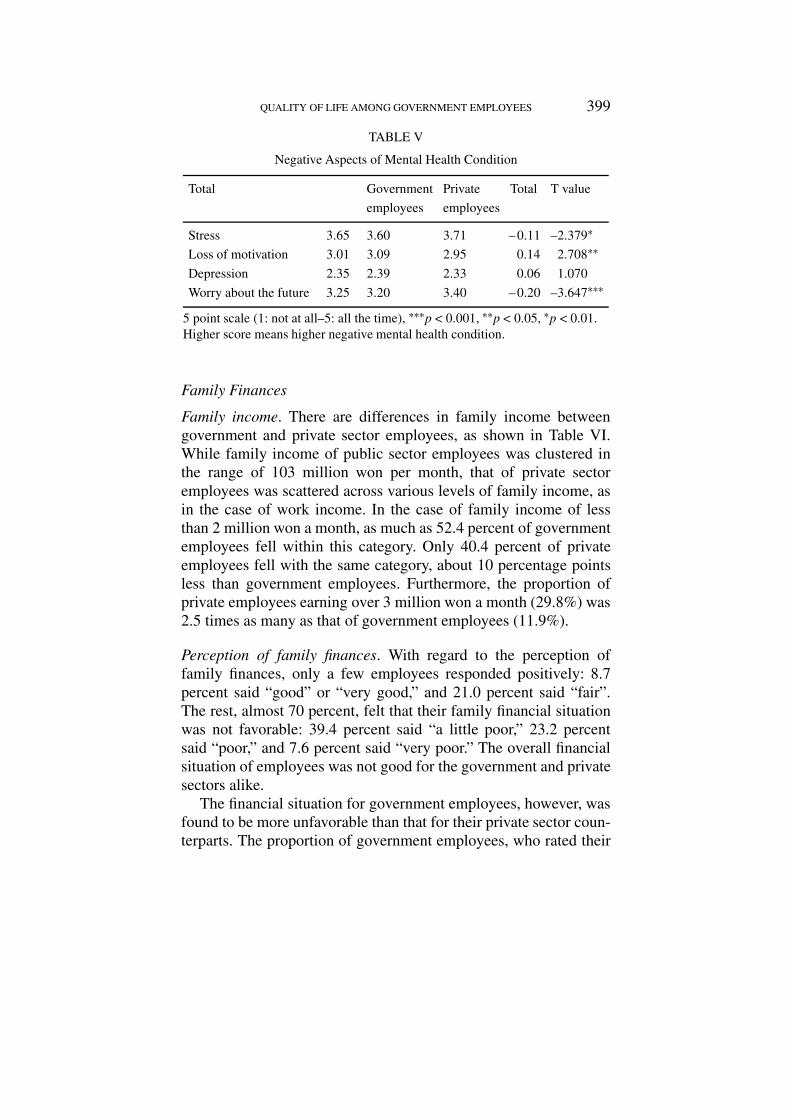
Stress and anxiety. Four factors – frequencies of stress, loss ofmotivation, depression, and fear of the future – were measured toexamine the negative aspects of their states of health. The resultis that to a certain degree both groups had stress, lacked motiva-tion, and worried about the future. As shown in Table V, out of thefour negative health indicators, “stress” was first (the average was3.65, based on a 5-point scale ranging from “no stress at all” to“stress all the time”), followed by “worry about the future” (3.23),and “loss of motivation” (3.01). It is only in the area of depressionthat these workers achieved a comparatively low score (2.35) withno group differences. What may be inferred from this is that jobinsecurity, at least after the massive restructuring in the public aswell as private sectors, had a negative effect on the psychologicalwell-being of employees in both sectors. In addition, governmentand private sector employees were shown to have different levels ofanxiety. For example, government employees suffered a significantloss in motivation as compared to their private sector counterparts,while private employees were more stressed and apprehensive abouttheir future. Even so, we learned that both of these groups “often”or “always” experience mental health problems.
Family
In the domain of family life, the interaction between husband andwife is believed to affect QOL. The study found that both govern-ment and private sector employees have a relatively high level ofmutual understanding with their respective spouses, showing nogroup differences. Only 5.9 percent of all the respondents had a lackof or minimal degree of understanding with their respective spouses.
QUALITY OF LIFE AMONG GOVERNMENT EMPLOYEES 399
TABLE V
Negative Aspects of Mental Health Condition
Total Government Private Total T value
employees employees
Stress 3.65 3.60 3.71 – 0.11 –2.379∗
Loss of motivation 3.01 3.09 2.95 0.14 2.708∗∗
Depression 2.35 2.39 2.33 0.06 1.070
Worry about the future 3.25 3.20 3.40 – 0.20 –3.647∗∗∗
5 point scale (1: not at all–5: all the time), ∗∗∗p < 0.001, ∗∗p < 0.05, ∗p < 0.01.Higher score means higher negative mental health condition.
Family Finances
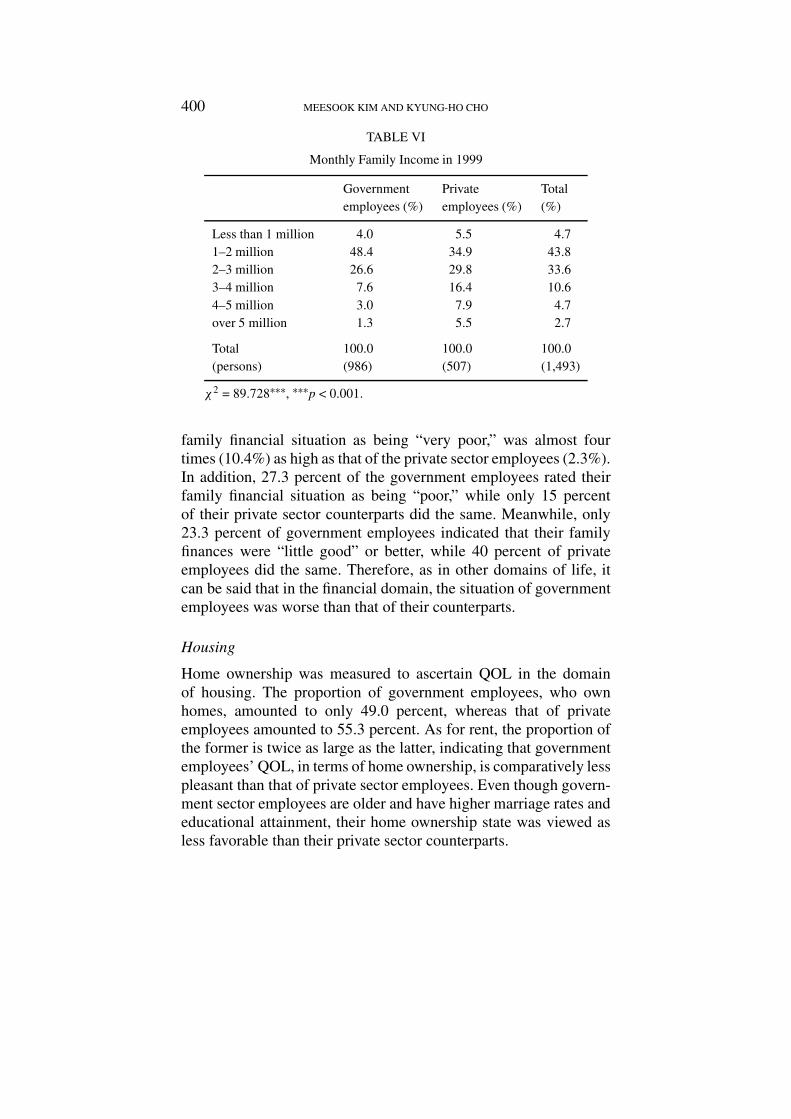
Family income. There are differences in family income betweengovernment and private sector employees, as shown in Table VI.While family income of public sector employees was clustered inthe range of 103 million won per month, that of private sectoremployees was scattered across various levels of family income, asin the case of work income. In the case of family income of lessthan 2 million won a month, as much as 52.4 percent of governmentemployees fell within this category. Only 40.4 percent of privateemployees fell with the same category, about 10 percentage pointsless than government employees. Furthermore, the proportion ofprivate employees earning over 3 million won a month (29.8%) was2.5 times as many as that of government employees (11.9%).
Perception of family finances. With regard to the perception offamily finances, only a few employees responded positively: 8.7percent said “good” or “very good,” and 21.0 percent said “fair”.The rest, almost 70 percent, felt that their family financial situationwas not favorable: 39.4 percent said “a little poor,” 23.2 percentsaid “poor,” and 7.6 percent said “very poor.” The overall financialsituation of employees was not good for the government and privatesectors alike.
The financial situation for government employees, however, wasfound to be more unfavorable than that for their private sector coun-terparts. The proportion of government employees, who rated their
400 MEESOOK KIM AND KYUNG-HO CHO
TABLE VI
Monthly Family Income in 1999
Government Private Totalemployees (%) employees (%) (%)
Less than 1 million 4.0 5.5 4.71–2 million 48.4 34.9 43.82–3 million 26.6 29.8 33.63–4 million 7.6 16.4 10.64–5 million 3.0 7.9 4.7over 5 million 1.3 5.5 2.7
Total 100.0 100.0 100.0(persons) (986) (507) (1,493)
χ2 = 89.728∗∗∗, ∗∗∗p < 0.001.
family financial situation as being “very poor,” was almost fourtimes (10.4%) as high as that of the private sector employees (2.3%).In addition, 27.3 percent of the government employees rated theirfamily financial situation as being “poor,” while only 15 percentof their private sector counterparts did the same. Meanwhile, only23.3 percent of government employees indicated that their familyfinances were “little good” or better, while 40 percent of privateemployees did the same. Therefore, as in other domains of life, itcan be said that in the financial domain, the situation of governmentemployees was worse than that of their counterparts.
Housing
Home ownership was measured to ascertain QOL in the domainof housing. The proportion of government employees, who ownhomes, amounted to only 49.0 percent, whereas that of privateemployees amounted to 55.3 percent. As for rent, the proportion ofthe former is twice as large as the latter, indicating that governmentemployees’ QOL, in terms of home ownership, is comparatively lesspleasant than that of private sector employees. Even though govern-ment sector employees are older and have higher marriage rates andeducational attainment, their home ownership state was viewed asless favorable than their private sector counterparts.
QUALITY OF LIFE AMONG GOVERNMENT EMPLOYEES 401
Leisure
In the domain of leisure, the length of summer vacation wasmeasured. Here we learned that government employees (84.3%)had either 1–5 days or 6–10 days of vacation per year, and lessthan two-thirds of private employees (69.5%) had a similar numberof vacation days. Over twice as many private employees (26.3%)spend more than 11 days on vacation, while only 10.3 percent ofgovernment employees did so. Moreover, the proportion of govern-ment employees, who had no vacation time, was slightly higher thantheir private counterparts (government employees: 5.9%, privateemployees: 4.2%). This shows that government employee’ vacationdays were shorter, and the number of vacation days of private sectoremployees was longer as well as relatively more widely spread out.
Social Life
With regard to one’s social life, the number of friends wasmeasured. The two groups were significantly different in terms ofnumber of friends to turn when having trouble. The percentage ofemployees with “a fair” number of friends was higher for govern-ment employees (70.1%) than for private employees (60.8%), butthe percentage of those with “many or very many” friends, to whomthey could turn to, was higher for private employees (25.1%) thanfor government employees (14.5%). Since government employeesspend a longer time at work, they may not have enough time to spendwith their friends.
Community
As is the case with relationships with friends, government em-ployees had fewer contacts with their neighbors than privateemployees. Even though both groups did not have frequent contactwith their neighbors (frequent contact: 15.4%), more privateemployees had frequent contact with their neighbor than the former.For instance, only 13.8 percent of government employees hadcontact with their neighbors “very often or often,” while as many as18.2 percent of private employees did. This lesser degree of contactseems to be related to some extent to the fact that governmentemployees lack free time due to a tight working schedule.
402 MEESOOK KIM AND KYUNG-HO CHO
Country
Pride in Korea. Both employee groups show fairly strong pride inKorea. Over 70 percent of employees from both sectors indicate alittle or fairly strong degree of pride in Korea. There are no statist-ically significant differences between the two sectors in the level ofpride individuals feel about their own country.
Emigration intensions. As for emigration intentions, as many as43.5 responded positively on emigration, indicating that a significantnumber of employees would like to go abroad. More private sectoremployees (51.8%), than government employees (39.2%), werefound to want to move to another country. This is a very interestingresult because private sector employees tend to experience morefavorable conditions in most domains of life than their governmentsector counterparts. This may reflect the fact that private employeesare more open to changes in life than government employees.
V. SATISFACTION LEVELS IN TEN DOMAINS
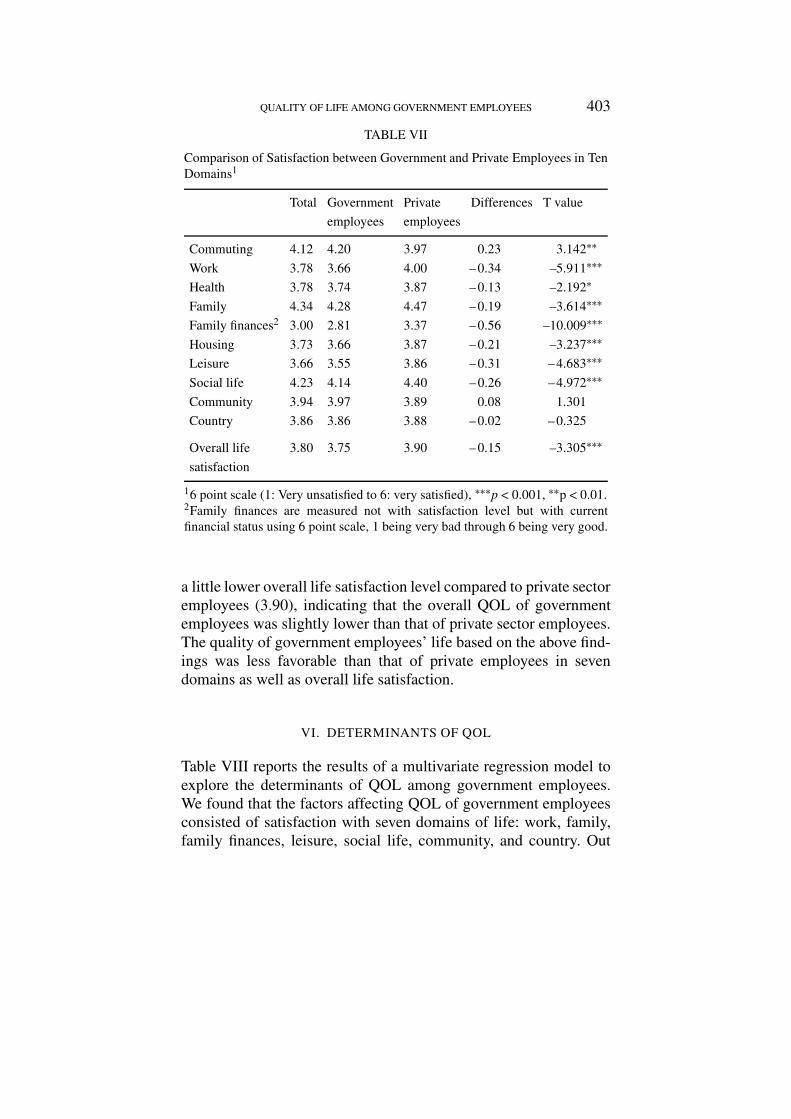
Satisfaction levels regarding ten domains of QOL were comparedto identify domain(s) with group differences. Seven domains(commuting, work, family, family finances, housing, leisure, andsocial life) show statistically significant group differences; thedomain of family finances revealed the greatest difference betweenthe two groups (see Table VII). Although satisfaction with familyfinances was the lowest in both groups, government employees’satisfaction with income was much lower than that of privateemployees (2.81 versus 3.37 based on a 6-point scale). This indi-cates that the financial situation of government employees was muchworse than that of their private sector counterparts. The only domainin which government employees outscored their private sector coun-terparts was in the domain of commuting. Their shorter commutingtime indicated that they were more satisfied with commuting. In thedomains of community and country, however, there are no statist-ically significant differences between the two groups. Both have afairly high satisfaction level regarding the two domains.
As for overall life satisfaction, the average score stood slightlyabove the midpoint (3.5) at 3.80. Government employees (3.75) had
QUALITY OF LIFE AMONG GOVERNMENT EMPLOYEES 403
TABLE VII
Comparison of Satisfaction between Government and Private Employees in TenDomains1
Total Government Private Differences T value
employees employees
Commuting 4.12 4.20 3.97 0.23 3.142∗∗
Work 3.78 3.66 4.00 – 0.34 –5.911∗∗∗
Health 3.78 3.74 3.87 – 0.13 –2.192∗
Family 4.34 4.28 4.47 – 0.19 –3.614∗∗∗
Family finances2 3.00 2.81 3.37 – 0.56 –10.009∗∗∗
Housing 3.73 3.66 3.87 – 0.21 –3.237∗∗∗
Leisure 3.66 3.55 3.86 – 0.31 – 4.683∗∗∗
Social life 4.23 4.14 4.40 – 0.26 – 4.972∗∗∗
Community 3.94 3.97 3.89 0.08 1.301
Country 3.86 3.86 3.88 – 0.02 – 0.325
Overall life 3.80 3.75 3.90 – 0.15 –3.305∗∗∗
satisfaction
16 point scale (1: Very unsatisfied to 6: very satisfied), ∗∗∗p < 0.001, ∗∗p < 0.01.2Family finances are measured not with satisfaction level but with currentfinancial status using 6 point scale, 1 being very bad through 6 being very good.
a little lower overall life satisfaction level compared to private sectoremployees (3.90), indicating that the overall QOL of governmentemployees was slightly lower than that of private sector employees.The quality of government employees’ life based on the above find-ings was less favorable than that of private employees in sevendomains as well as overall life satisfaction.
VI. DETERMINANTS OF QOL
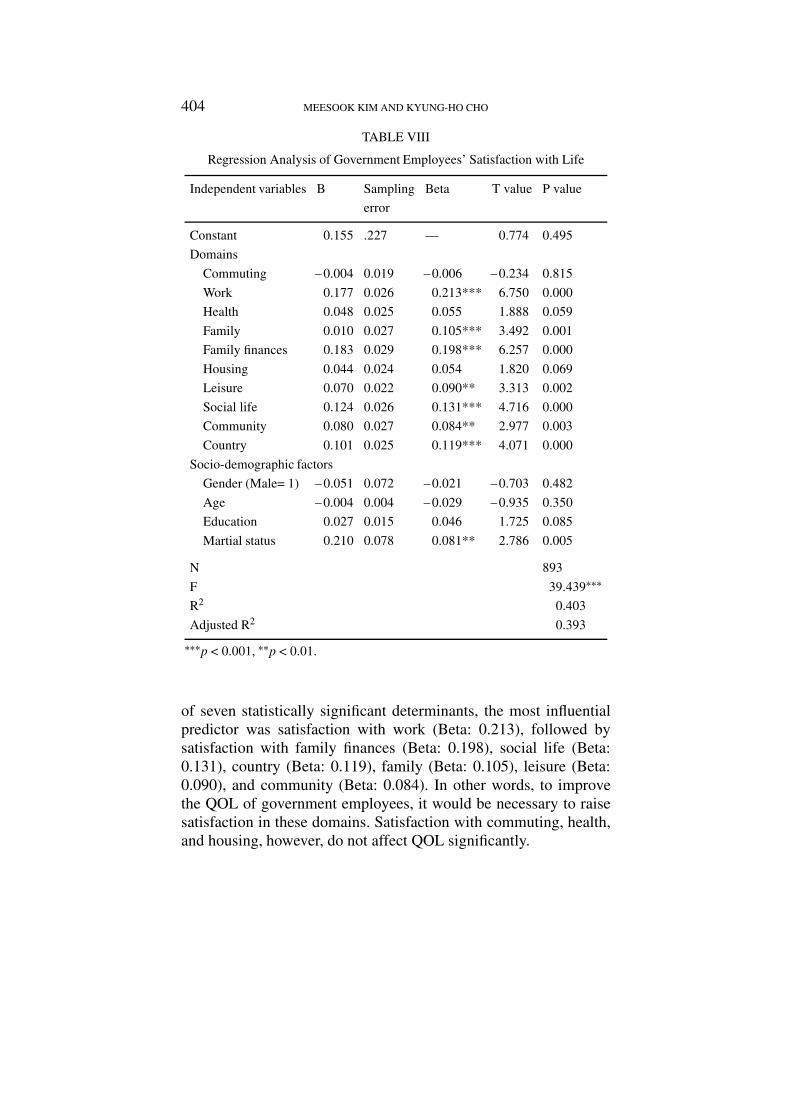
Table VIII reports the results of a multivariate regression model toexplore the determinants of QOL among government employees.We found that the factors affecting QOL of government employeesconsisted of satisfaction with seven domains of life: work, family,family finances, leisure, social life, community, and country. Out
404 MEESOOK KIM AND KYUNG-HO CHO
TABLE VIII
Regression Analysis of Government Employees’ Satisfaction with Life
Independent variables B Sampling Beta T value P value
error
Constant 0.155 .227 — 0.774 0.495
Domains
Commuting – 0.004 0.019 – 0.006 – 0.234 0.815
Work 0.177 0.026 0.213*** 6.750 0.000
Health 0.048 0.025 0.055 1.888 0.059
Family 0.010 0.027 0.105*** 3.492 0.001
Family finances 0.183 0.029 0.198*** 6.257 0.000
Housing 0.044 0.024 0.054 1.820 0.069
Leisure 0.070 0.022 0.090** 3.313 0.002
Social life 0.124 0.026 0.131*** 4.716 0.000
Community 0.080 0.027 0.084** 2.977 0.003
Country 0.101 0.025 0.119*** 4.071 0.000
Socio-demographic factors
Gender (Male= 1) – 0.051 0.072 – 0.021 – 0.703 0.482
Age – 0.004 0.004 – 0.029 – 0.935 0.350
Education 0.027 0.015 0.046 1.725 0.085
Martial status 0.210 0.078 0.081** 2.786 0.005
N 893
F 39.439∗∗∗
R2 0.403
Adjusted R2 0.393
∗∗∗p < 0.001, ∗∗p < 0.01.
of seven statistically significant determinants, the most influentialpredictor was satisfaction with work (Beta: 0.213), followed bysatisfaction with family finances (Beta: 0.198), social life (Beta:0.131), country (Beta: 0.119), family (Beta: 0.105), leisure (Beta:0.090), and community (Beta: 0.084). In other words, to improvethe QOL of government employees, it would be necessary to raisesatisfaction in these domains. Satisfaction with commuting, health,and housing, however, do not affect QOL significantly.
QUALITY OF LIFE AMONG GOVERNMENT EMPLOYEES 405
Among five socio-demographic variables, martial status wasfound to be the only significant determinant. Married governmentemployees were more satisfied with their lives than unmarriedgovernment employees. The other four socio-demographic variables– gender, age, education, and family income – were found to have nosignificant impact on QOL. There were no gender differences withrespect to satisfaction with life. Also, various age groups and groupsof various educational levels showed no differences in term of satis-faction with life. In addition, family income had no significantimpact on life satisfaction. Interestingly, even though satisfactionwith family finances, a subjective indicator of QOL, affected lifesatisfaction positively, the amount of family income, an objectiveindicator of QOL, had no impact on life satisfaction. Thus, we canconclude that the subjective perception of the life situation, ratherthan the objective condition, is an important factor in determiningQOL.
VII. DISCUSSION
Based on the above research findings, we can conclude that theQOL of Korean government employees was lower than that oftheir private sector counterparts. In both objective and subjectiveaspects of QOL, their QOL is less pleasant than that of their counter-parts in the private sector. Government employees earn less income,work longer hours, have less family income, are more likely torent housing, and have fewer summer vacation days than privatesector employees. In addition, the satisfaction level of governmentemployees was lower than that of private sector employees in sevenout of the ten life domains (work, health, family, family finances,housing, leisure, and social life). Only in the domain of commutingwere they more satisfied than private employees.
The results of the regression of QOL show that satisfaction withwork was the most influential determinant of QOL. Other significantfactors were satisfaction with family finances, family, leisure, sociallife, community, and country. This implies that attention shouldbe given to improving work-related factors in order to better theQOL of government employees. The second influential determ-inant of government employees’ QOL was satisfaction with family
406 MEESOOK KIM AND KYUNG-HO CHO
finances. Family income, however, did not significantly affect QOL.Subjective perception was more important than objective condi-tion. The level of satisfaction with family finances, however, couldbe improved by raising income, because the lack of income leadsto dissatisfaction with family finances. In turn, this would lead todissatisfaction with leisure and family life. Therefore, to improvesatisfaction with family finances, raising income would be the firststep to take.
Other statistically significant determinants were satisfaction withsocial life, country, family, leisure, and community. In the UnitedStates, the federal government provides its employees with variousoptions of working arrangements so that they can maintain a healthybalance between work and family. This practice is called “family-friendly policy.” Flexible work hours and workplace, and childcarefacilities at work are specific examples of these policy arrangements.Both the production rates of government employees, and their levelsof work satisfaction, were reported to have increased in the UnitedStates since the inception of this policy (United States Office ofPersonal Management, 1998). We can infer that this can also beconducive to job mobility and enhancement of satisfaction levelswith work.
In Korea, family life is becoming an increasingly importantsocial issue. The government, therefore, should consider devel-oping policies that help government employees manage work andfamily life, harmoniously. It may be too early at this juncture forKorea to follow all the policy initiatives, that the United Sates hastaken on behalf of its employees. Korea, however, should consideraccepting these family-friendly policies over time after weighingtheir merits. Policies concerning telecommuting, a flexible work-place, and work sharing are not easy to implement in Korea.Even so, on-site/near-site childcare centers, flexible work schedules,and part-time employment are among important policy measuresto be considered. With flexible working schedules, for instance,employees can have time for a social life and leisure. On the otherhand, on-site childcare centers should be more accessible for theincreasing number of double-income families.
As for leisure, even though Korean government employees havevacation days guaranteed by regulations, they are unable to use all
QUALITY OF LIFE AMONG GOVERNMENT EMPLOYEES 407
their vacation time. There is a disparity between the legal system andthe reality, where invisible office conventions forbid the using of allthe vacation days guaranteed by the regulations. Employees shouldbe allowed to use all their vacation days. They should, also, bepermitted to take their vacation at any time. Currently, most vacationdays are taken during the summer, between July and August.
Lastly, satisfaction with one’s country affected QOL signifi-cantly. Many government employees wanted to emigrate to anothercountry. This may result from economic hardships that the 1997economic crisis brought about, and the difficulties associated withraising school-aged children in Korea. The latter occurs as a resultof increasing fees for private after-school education that come aboutbecause of the fierce competition for gaining entrance to college.In addition, a stressful work life without much social life maycontribute to dissatisfaction within the country. To increase thedesire of government employees to remain in Korea would requirea wide range of changes in many areas including education.
NOTE
1 Classes 1, 2, 3 in government sector are equivalent to the management in privatesector; classes 4 and 5 to director position, classes 6 and 7 to entry level positionswith college degree; and classes 8 and 9 to entry level positions with high-schooldiploma.
REFERENCES
Cho, K.H.: 1997, The Values of Public Employees in the Era of Transformation(Jibmoon, Seoul, Korea).
Cho, K.H.: 2000, ‘An analysis of the prospects of success of entrepreneurialreform efforts in the public personnel administration’, Korean Public Admin-istration Review 34(3), pp. 39–56.
Cho, K.H. and M.S. Kim: 2000, ‘A comparative study of quality of life satis-faction between the public and private sector employees’, Korean PublicAdministration Review 34(3), pp. 27–45.
Cho, S.H. and W.Y. Oh: 1993, ‘An analysis of citizen satisfaction about urbanenvironments’, Land Development 28(4), pp. 161–182.
Chubb, J.E. and T.M. Moe: 1988, ‘Politics, markets, and the organization ofschools’, American Political Science Review 82, pp. 1065–1088.
408 MEESOOK KIM AND KYUNG-HO CHO
Gold, M. and J. Wooldridge: 1995, ‘Surveying consumer satisfaction to assessmanaged-care quality: Current practices’, Health Care Financing Review 16(4),pp. 155–173.
Ha, H.S.: 1996, ‘ “Local governments” policy outcomes’, unpublished doctoraldissertation (Seoul National University).
Haas, B.K.: 1999, ‘Clarification and integration of similar quality-of-lifeconcepts’, Journal of Nursing Scholarship 31, pp. 215–220.
Kim, B.S.: 1994, ‘Psychological burnout and job involvement for public officials’,Korean Public Administration Review 28, pp. 1279–1299.
Kim, M.S. and K.H. Cho: 2000, Administrative Reform and the Quality of Lifeof Public Employees (Nanam Publishing House, Seoul, Korea).
Kim, J.H. and associates: 1998, ‘A comparative study on the quality of urban life’,Regional Studies 14(1), pp. 21–45.
Korea Civil Service Commission: 1999, Improvement of Public Sector Classific-ation System (Seoul, Korea).
Lane, R.E.: 1994, ‘Quality of life and quality of persons: A new role forgovernment?’ Political Theory 22(2).
Lee, S.M.: 1997, ‘The quality of working life and the quality of life: A search ofan comprehensive model’, Social Science (Sung Kyun Kwan University, Seoul)45, pp. 107–131.
Lim, H.S.: 1995, Korean Social Change and the Values (Naman PublishingHouse, Seoul, Korea).
Park, T.H. and S.Y. Won: 2000, ‘Interpersonal trust and connections based on thesocial categorization in organizations’, Korean Public Administration Review34(2), pp. 101–121.
Posner, B.Z. and W.H. Schmidt: 1996, ‘The values of business and federalgovernment executives’, Public Personnel Management 25(3), pp. 277–289.
Poister, T.H. and G.T. Henry: 1994, ‘Citizen ratings of public and private servicequality: A comparative perspective’, Public Administration Review 54(2),pp. 155–160.
Rainey, H.G., S. Pandey and B. Bozeman: 1995, ‘Research note: Public andprivate managers’ perception of red tape’, Public Administration Review 55,pp. 567–574.
Schneider, D.S. and B.C. Vaught: 1993, ‘A comparison of job satisfaction betweenpublic and private sector managers’, Public Administration Quarterly, Spring,pp. 68–83.
Seed, P. and G. Lloyd: 1997, Quality of Life (Jessica Kingsley Publishers,London).
Shin, D.S.: 1981, ‘A study of quality of life of Koreans’, Jung-Kyung Moonwha,pp. 26–47.
United States Merit Systems Protection Board: 1991, Balancing Work Respons-ibilities and Family Needs: The Federal Civil Service Response.
United States Office of Personnel Management: 1998, A Review of FederalFamily-Friendly Workplace Arrangements.
QUALITY OF LIFE AMONG GOVERNMENT EMPLOYEES 409
Webb, K. and H.P. Hatry: 1973, Obtaining Citizen Feedback: The Applicationof Citizen Surveys to Local Governments (The Urban Institute, Washington,D.C.).
San 42–14, Eunpyung-Gu, Bulkwang-Dong Meesook KimKorea Institute for Health and Social AffairsSeoul, KoreaE-mail: [email protected]
Department of Public Administration Kyung-Ho ChoKookmin UniversitySeoul, Korea