Embed Size (px)
Citation preview

International Journal of Basic & Applied Sciences IJBAS-IJENS Vol:10 No:06 84
106706-2929 IJBAS-IJENS © December 2010 IJENS I J E N S
Quality of Information Supplied to Board of
Directors: a Case Study on a Malaysian Higher
Learning Institution
Mohd Yussoff Ibrahim1, Azrai Abdullah2,
Khalidah BT Khalid Ali3 and Abu Bakar Sedek B. Abdul Jamak4 1Mohd Yussoff Ibrahim, Assoc. Prof. Dr. is with the Centre of Postgraduate and Research, Kolej Universiti Insaniah, Alor Setar,
05350 Kedah, Malaysia. (phone: + 604-7323958/4405; Fax :+ 604 -7320164; email:[email protected]) 2Azrai Abdullah, Dr. is with the Department of Management and Humanities, Universiti Teknologi PETRONAS, Bandar Seri
Iskandar, Perak, 31750 Malaysia. (phone: + 605- 3657731/7755; Fax: + 605-3656280; email: [email protected] 3Khalidah Khalid Ali is with the Department of Management and Humanities, Universiti Teknologi PETRONAS, Bandar Seri
Iskandar, Perak, 31750 Malaysia. (phone: + 605-3687737; Fax: + 605-3656280; email: [email protected]) 4Abu Bakar Sedek Bin Abdul Jamak is with the Department of Management and Humanities, Universiti Teknologi PETRONAS,
Bandar Seri Iskandar, Perak, Malaysia. (phone: + 605- 3687764; Fax: + 605-3656280; email: [email protected])
Abstract-- Board of Directors (BOD) of corporations is
responsible for the company’s operational and financial
performance apart from its fiduciary duty to fulfill the needs of
all stakeholders. In executing their responsibilities, Board
members have to make strategic decisions on a broad spectrum
of business issues to survive in today’s challenging global
environment. The efficiency of BOD and effectiveness of their
decisions truly depend on the nature and quality of information
provided by the Management as they are not the implementers
but “overseers” in the management process. Much as the
information and communication technology (ICT) has facilitated
the flow of information in general, the extent, nature and quality
of information provided to BOD have often been in question.
This paper seeks to develop a research tool to measure the
adequacy of the internal reporting system that provides
information to companies’ BOD based on seven dimensions;
Relevant, Integrated, In perspective, Timely, Reliable, Comparable
and Clear. The efficiency and effectiveness of the internal
reporting system are evaluated by measuring the gap between
the levels of satisfaction that directors have on each of the
characteristics with that of the preparers’ perception. The
instruments to measure those constructs were developed and
tested based on a pilot study performed at a Malaysian higher
institution of learning. The result will be used to develop
measurement tools for evaluating the efficiency and effectiveness
of an internal reporting system of corporations.
Index Term-- Board of Directors, Malaysia, management,
quality of information, internal reporting system, efficiency,
effectiveness, level of satisfaction
I. INTRODUCTION
The fiduciary role of Board of Directors (BOD), being
responsible to all its stakeholders, is an important element of
corporate governance (CG). The BOD, among others, is also
responsible for establishing and maintaining internal financial
controls, communicating financial situations internally and
externally, establishing and revising where necessary the
firm’s code of ethics and ethical standards, selecting the
external auditor and establishing different board committees
including the audit committee to ensure good governance
(Stanwick and Stanwick, 2009).
In view of its strategic role and in order to effectively
exercise its responsibilities, the Board sets out the company’s
policies and guidelines, identifies short and long term
objectives and puts procedures into place. It is thus ultimately
accountable for the company’s goals as well as the means to
achieve it. To execute its responsibilities, the Board has to
monitor the performance of the company as well as make
decisions on diverse policy matters.
The efficiency of BOD and effectiveness of its decisions truly
depend on the nature and quality of information provided by
the Management as Board members are not the implementers
but “overseers” in the management process. Much as the
information and communication technology (ICT) has
facilitated the flow of information in general, the extent,
nature and quality of information provided to BOD have often
been in question. Questions have also been raised in literature
on the extent of the Board’s satisfaction on the information
provided to them in carrying out their responsibilities. One
recent example is Chartered Institute of Management
Accountant’s (CIMA) concern regarding the quality of board
reporting practice, which is crucial for good market
performance and sound corporate governance. The issue is
whether the BOD is being provided with the right type of
information to effectively perform its responsibility. The
Board needs information to steer the organization towards
achieving its goals and objectives. At the same time, the Board
members need to limit their exposure to any allegation that
they are not discharging their duties to the shareholders to
uphold their integrity.
This paper reports on a comparative study undertaken to
measure the gap between the satisfaction of directors and that
of the preparers’ perception on the quality of information
provided for making business decisions. The finding from this
research will provide basis for developing an instrument to
measure the quality of information prepared for the

International Journal of Basic & Applied Sciences IJBAS-IJENS Vol:10 No:06 85
106706-2929 IJBAS-IJENS © December 2010 IJENS I J E N S
companies’ Board of Directors. It will also provide hindsight
as to the actions necessary for the improvement of the
corporate internal reporting practice.
II. BACKGROUND
One of the main pillars of a nation’s economy is its corporate
governance (CG). The success or failure of a nation’s
economy, in its effort to achieve stable and continuous
economic development rests heavily on the existence and
effectiveness of its corporate governance. Various definitions
have been given to corporate governance. Corporate
governance has been defined as: “…the system of checks and
balances, both internal and external to the companies, which
ensures that companies discharge their accountability to all
their stakeholders and act in a socially responsible way in all
areas of their business activity” (Solomon & Solomon, 2004).
It is also defined as the system by which companies are
directed and controlled (Cadbury, 1992), a means by which
various stakeholders exert control over a corporation by
exercising certain rights as established in the existing legal
and regulatory frameworks as well as corporate bylaws (John
& Senbet,1998). Precisely, the definitions imply that corporate
governance deals with mechanism by which stakeholders or
owners of a company exercise control over management such
that their interests are protected. John and Senbet (1998)
define stakeholders of a company to include equity holders,
creditors and other claimants who supply capital, as well as
other stakeholders such as employees, consumers, suppliers
and the government.
Following the 1997 financial turmoil, Malaysia has developed
a code on corporate governance published in 2000 and revised
in 2007. Specifically, the code aims to set out principles and
best practices on structures and processes that companies may
use in their operation towards achieving the optimal
governance framework (Finance Committee on Corporate
Governance, 2000). With the principles and best practices, the
code aspires to achieve two primary inter-related objectives;
encourage disclosure by providing investors with timely and
relevant information and provide a guide to the Board of
Directors by clarifying their responsibilities and providing
prescriptions to strengthen their control (Najmuddin et al.
2002)
On the responsibilities of Board of Directors, Section D of the
Principles of Corporate Governance states inter-alia that the
Board ‘should present a balanced and understandable
assessment of the company’s position and prospects and
maintain a sound system of internal control’. The Best
Practice section of the Code details out the responsibilities as
follows;
Reviewing and adopting a strategic plan
Overseeing the conduct of the company’s business
Identifying and managing principle risk
Succession planning
Developing and implementing an investors’ relation
programme
Reviewing the integrity of the company’s internal
control
CG literature provides many explanations on the Board of
Director’s responsibilities. Board responsibility (roles) can be
classified into four: monitoring, service, strategy and resource
provision (Daily et al., 2003; Zahra and Pearce, 1989).
According to Lasfer (2004), the Board’s role comprises of
monitoring and advising.
Among the best practices suggested by the Code are related to
the quality of information provided to Board of Directors. The
third principle of corporate governance regarding directors
specifies that ‘the Board should be supplied in a timely
fashion with information in a form and of a quality appropriate
to enable it to discharge its duties’ (Finance Committee on
Corporate Governance, 2000). In the section on Best Practices
in Corporate Governance regarding Board of Directors, item
(xvii) further emphasized on the quality of information
supplied to the Board. ‘The Board should receive information
that is not just historical or bottom line and financial-oriented
but information that goes beyond assessing the quantitative
performance of the enterprise and looks at other performance
factors such as customer satisfaction, product and service
quality, market share, market reaction, environmental
performance..’(ibid. 2000). Hence, the Code does recognize
that it is crucial for the Board of Directors to have access to
quality information that allows them to exercise their duties
effectively. Furthermore, according to CIMA (as cited from
Starovic (2003), a good report should contain all the
information necessary to facilitate decision making at Board
level.
What constitutes quality information? There are various
prescriptions of quality characteristics. As mentioned in the
previous paragraph, the Malaysian Codes of Corporate
Governance defined information quality in terms of the scope
and form of its content. The Board should be provided with
financial and non-financial information that are historical as
well as futuristic. The Institute of Chartered Accountants in
England and Wales (as cited in Starovic, 2003) advocates five
characteristics of quality information as follows: material,
relevant, reliable, comparable and understandable. In contrast,
Metapraxis (as cited in Starovic, 2003) a management
consultancy organization, prescribes quality as having the
following characteristics: accuracy, relevance, timeliness,
clarity, risk assessment, depth and provision. Based on the
above definitions, CIMA (UK) outlined seven characteristics
essential to quality information: relevant, integrated, in
perspective, timely, reliable, comparable and clear (Starovic,
2003).
It is important for the Management to be aware of the
characteristics of information quality preferred by Board of
Directors in order to develop the perceived quality of
information. This is crucial because of the divergent
perceptions of the quality between the preparer and the user of
information (Parasuraman et al., 1985). An organization has to
define quality in accordance with users’ expectations, needs
and wants. Failure to do so will lead to a wasted effort on any
improvement initiative because the Management is not
focusing on the same characteristics preferred by the users. A
supplier of information aiming to provide high-quality

International Journal of Basic & Applied Sciences IJBAS-IJENS Vol:10 No:06 86
106706-2929 IJBAS-IJENS © December 2010 IJENS I J E N S
information thus needs to be familiar with the characteristics
of the information that are important to the consumers
(Parasuraman et al., 1988). Mapping all the significant
characteristics of information quality perceived by the Board
members would provide quality measurements and subsequent
quality improvements. The identification and assessment of
these attributes are thus important. However, to the best of our
knowledge, no studies have attempted to evaluate the quality
of information prepared for the Board of Directors and to
assess the gap between preparers’ and the users’ perceptions.
This paper attempts to describe the development of scale to
measure the level of quality of information provided by the
Management to Board of Directors as perceived by the
preparer and the user and to gauge the gap between them.
III. LITERATURE REVIEW
Corporate governance (CG) has become a research area since
early 80s.1 Among the areas focused in CG studies relate to;
Board of Directors, managerial incentives, capital structure,
by-laws and charter provision and internal control system
(Gillan, 2006). According to Gillan (2006) on the subject of
‘Board of Directors’, the focus of the researches is broad,
encompassing board size, structure, compensation,
independence, characteristics and expertise. Some of the
variables linked to the Board in past studies include firm
value, governance choice, investment and financing decisions,
activity of board sub-committee and CEO compensation,
firm’s performance, ownership structure, corporate fraud,
earning restatements and incentive compensation. Sample of
the previous studies (as cited from Gillan, 2006) that relates to
the Board of Directors are; board-size and the independence of
the board from corporate management (Rosenstein and Wyatt,
1990; Yermack, 1996), board activity (Vafeas, 1999), board
structure and activity of board sub-committees (Klein, 1998,
2002; Deli and Gillan, 2000), theoretical aspects of board
structure (Hermalin and Weisbach (1988), Warther (1998),
Adams and Ferreria (2003), Gillette et al. (2003), Harris and
Raviv (2005), and Raheja (2005)), the evolution of board
structure over time, and changes in board structure post-
Sarbanes–Oxley (SOX) (Chhaochharia and Grinstein,
2005a,b; Coles et al. 2005b; and Linck et al. (2005a,b).
There were few research carried out on the information
reported to the Board and information usage by the Board.
The quality of information provided to the Board is crucial to
ensure effectiveness in executing its roles and responsibilities.
Past studies have related the need for information by the
Board to their monitoring and advisory roles. Lorsch and
MacIver (1989) and Noe and Rebello (1997) as cited from
Lasfer (2004) argued that in order to undertake the advisory
role, information should flow from the managers or the CEO
to the Board members. Lasfer (2004) hinted that ‘in normal
circumstances, the monitoring and the advisory role are
1 A quick search using Science Direct (an e-library) in the
field of Art and Humanities, Business, Management and
Accounting, Economics, Econometrics and Finance and Social
Sciences.
complementary because the better the information disclosed,
the better will be the advice and the evaluation’. Past literature
suggested that the effectiveness of the Board depends on the
severity of the firm’s agency conflicts as well as on the
information disclosed by managers (Lasfer, 2004).
However, the information communicated to internal
management has attracted profound interest among
researchers. One aspect that has received strong criticism is
regarding the form of information used in making decision.
Accounting systems have produced numerous measures of
financial performance including costs, revenues and profits.
Each of these financial measures can be calculated at the firm-
wide level or at the segments level. However, there has been
criticism that traditional performance measures motivate
dysfunctional behaviour by causing managers to pay attention
to the ‘wrong’ things (Hirst, 1983).
Several studies have indicated that dysfunctional behaviour
among employees arises from using performance
measurement based on accounting data or the style adopted in
using the data. Hopwood (1972) found that the more the
emphasis given to accounting data in performance
measurement, the higher is the level of dysfunctional
behavior. Otley (1978) tested a similar relationship in a
different environment and found a contradictory result. His
sample included managers of profit centres in one particular
industry whereas Hopwood‘s sample comprised managers of
cost centres in a factory. Hirst (1983) expanded the findings of
Hopwood (1972) and that of Otley (1978) by testing the
relationship in different levels of task uncertainty. The
conclusion arrived is that ‘A medium to high (medium to low)
reliance on accounting performance measures minimizes the
incidence of dysfunctional behavior in situation of low (high)
task uncertainty’.
Many firms now are beginning to place greater emphasis on
non-financial measures such as quality, customer satisfaction,
on-time delivery, innovation measures, and on the attainment
of strategic objectives (Ittner et. al., 1997). Kaplan and Norton
(1992, 1993) have developed the notion of a ‘balanced
scorecard’ in an attempt to provide a multi-dimensional
measure of managerial performance and to capture the value
drivers that have been concealed in the conventional
accounting numbers. A recent study on the nature of the
information communicated internally by Yussoff, Daing and
Krishnan (2008) has found that the emphasis on non-financial
measure by Management in their decision making has positive
relationship with the effectiveness of management control
system. This research measures the impact of quality
information on the effectiveness of the BOD using the board
role performance (Ong & Wan, 2007) as the proxy measure.
Board role performance was defined as ‘board’s ability to
perform its role’ and four critical Board’s roles are
monitoring, service, strategy and resource provision (ibid,
2007).
Research on information quality heavily focused on the
quality of information produced by organizations’
Management Information System (MIS) for particular process
or industry. Examples of these are studies on the impact of
International Journal of Basic & Applied Sciences IJBAS-IJENS Vol:10 No:06 87
106706-2929 IJBAS-IJENS © December 2010 IJENS I J E N S
information quality on the order fulfillment process (Forslund,
2007), the export market assistance (Toften & Rustad, 2005)
and the strategic technology planning (Gelle & Karhu, 2003).
The issue focused by these studies relate to the criteria of
information quality for enhancement of the processes or
functions. Apart from that, several studies focused on
development of instrument to measure information quality.
Various dimensions of information quality were identified
either through empirical research (Wang and Strong (1996)
and Zmud, (1978) or from literature review (Jarke and
Vassiliou (1997); Delone and McLean (1992)).
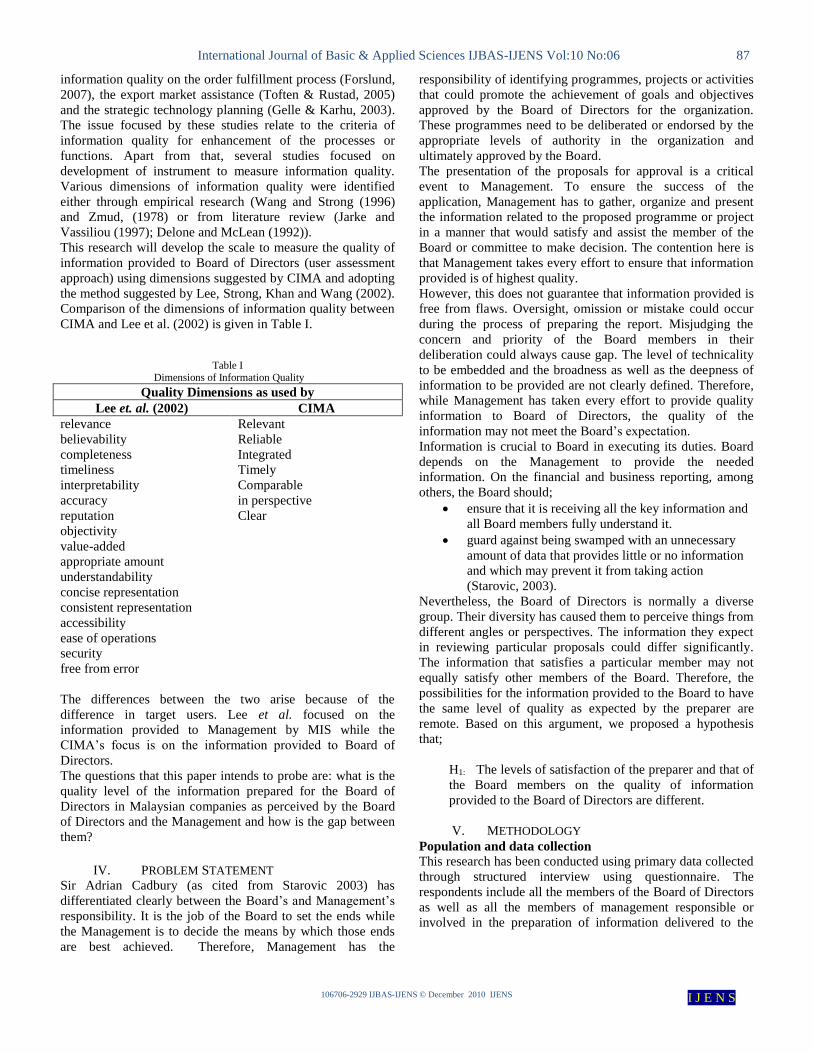
This research will develop the scale to measure the quality of
information provided to Board of Directors (user assessment
approach) using dimensions suggested by CIMA and adopting
the method suggested by Lee, Strong, Khan and Wang (2002).
Comparison of the dimensions of information quality between
CIMA and Lee et al. (2002) is given in Table I.
Table I Dimensions of Information Quality
Quality Dimensions as used by
Lee et. al. (2002) CIMA
relevance Relevant
believability Reliable
completeness Integrated
timeliness Timely
interpretability Comparable
accuracy in perspective
reputation Clear
objectivity
value-added
appropriate amount
understandability
concise representation
consistent representation
accessibility
ease of operations
security
free from error
The differences between the two arise because of the
difference in target users. Lee et al. focused on the
information provided to Management by MIS while the
CIMA’s focus is on the information provided to Board of
Directors.
The questions that this paper intends to probe are: what is the
quality level of the information prepared for the Board of
Directors in Malaysian companies as perceived by the Board
of Directors and the Management and how is the gap between
them?
IV. PROBLEM STATEMENT
Sir Adrian Cadbury (as cited from Starovic 2003) has
differentiated clearly between the Board’s and Management’s
responsibility. It is the job of the Board to set the ends while
the Management is to decide the means by which those ends
are best achieved. Therefore, Management has the
responsibility of identifying programmes, projects or activities
that could promote the achievement of goals and objectives
approved by the Board of Directors for the organization.
These programmes need to be deliberated or endorsed by the
appropriate levels of authority in the organization and
ultimately approved by the Board.
The presentation of the proposals for approval is a critical
event to Management. To ensure the success of the
application, Management has to gather, organize and present
the information related to the proposed programme or project
in a manner that would satisfy and assist the member of the
Board or committee to make decision. The contention here is
that Management takes every effort to ensure that information
provided is of highest quality.
However, this does not guarantee that information provided is
free from flaws. Oversight, omission or mistake could occur
during the process of preparing the report. Misjudging the
concern and priority of the Board members in their
deliberation could always cause gap. The level of technicality
to be embedded and the broadness as well as the deepness of
information to be provided are not clearly defined. Therefore,
while Management has taken every effort to provide quality
information to Board of Directors, the quality of the
information may not meet the Board’s expectation.
Information is crucial to Board in executing its duties. Board
depends on the Management to provide the needed
information. On the financial and business reporting, among
others, the Board should;
ensure that it is receiving all the key information and
all Board members fully understand it.
guard against being swamped with an unnecessary
amount of data that provides little or no information
and which may prevent it from taking action
(Starovic, 2003).
Nevertheless, the Board of Directors is normally a diverse
group. Their diversity has caused them to perceive things from
different angles or perspectives. The information they expect
in reviewing particular proposals could differ significantly.
The information that satisfies a particular member may not
equally satisfy other members of the Board. Therefore, the
possibilities for the information provided to the Board to have
the same level of quality as expected by the preparer are
remote. Based on this argument, we proposed a hypothesis
that;
H1: The levels of satisfaction of the preparer and that of
the Board members on the quality of information
provided to the Board of Directors are different.
V. METHODOLOGY
Population and data collection
This research has been conducted using primary data collected
through structured interview using questionnaire. The
respondents include all the members of the Board of Directors
as well as all the members of management responsible or
involved in the preparation of information delivered to the

International Journal of Basic & Applied Sciences IJBAS-IJENS Vol:10 No:06 88
106706-2929 IJBAS-IJENS © December 2010 IJENS I J E N S
Board. Since this is the pilot study and it involves only one
organization, no sampling will be performed.
Research instruments
The data collection process is conducted using questionnaire.
The questionnaire is developed using the principles for the
effective reporting of financial and non-financial reporting to
boards as outlined by CIMA (Starovic 2003). Seven proposed
dimensions of quality information include Relevant,
Integrated, In perspective, Timely, Reliable, Comparable and
Clear. The perceptions of the respondents on the quality levels
of each dimension are gauged using a 5-point Likert Scale.
Followings are discussion on the definition of each dimension
and the related measurements.
Relevant
Relevant is defined as the degree to which something is related
or useful to what is happening or being talked about
(Cambridge Advanced Learner's Dictionary). With respect to
information presented to the Board of Directors, information
is relevant if it is sharply focused and reflects the defined
objective and overall strategy of an organization (Starovic,
2003). With the information, the Board should be able to drill
down and seek further supplementary report if necessary. In
reviewing strategic proposals, Board may need to have
supplementary information to allow exploration of as many
alternatives as possible, necessary for unbiased information to
be made. Besides historical and quantitative data, forecast and
qualitative data are sometimes needed.
The dilemma that Management has to face in preparing the
information are striking the balance between insufficient and
excess information, historical and projected information,
quantitative and qualitative inputs and financial and non-
financial information. Imbalanced information will
unnecessarily burden, confuse and complicate the Board’s
function. To provide a clear definition of what each point
indicates, we develop the following scale to measure the
degree of relevancy.
It is difficult to find a perfect expression that could incorporate
all the concepts that relate to ‘Relevant’. In the questionnaire,
we use the expression ‘related to the decision’ as representing
‘Relevant’. A rating from 1 ‘extremely related’ to 5 ‘not
related’ has also been used as the assessment scale.
Integrated
Ideally information prepared for the Board of Directors should
be Integrated so that the information reported internally and
externally does not contradict. Since the interests of investors
and the directors are congruent, information reported in the
annual report and those supplied to Board of Directors should
be similar except for the degree of details. Therefore,
information needed for both purposes should come from the
same source i.e. the financial accounting system. However, the
additional information needed by Board of Directors may need
to be collected from external sources such as the information
on benchmarking of competitors’ performance. What
influences the integrity characteristic of information? The
assignment of responsibility on internal and external reporting
will determine the level of information integrity. The more it
is focused or concentrated to the financial accounting system,
the more Integrated the information will be.
Some of the aspects that portray the degree of integration that
the information exhibits are as follows:
provide link between activity data and financial
result.
provide sufficient non-financial information.
information received contradict with information
reported externally.
information received and information reported to
outside parties were prepared by same source.
In the questionnaire, we use the terms ‘contradict to’,
‘matches’ and ‘ in-line’ to indicate the degree of integration of
the information prepared for the Board and information
reported externally. The rating used is from 1 to indicate
‘totally contradicts’ to 5 to indicate ‘totally in line’.
In perspective
The information provided to Board of Directors should be In
perspective with reference to time context. It relates to how
the information presented to the Board is categorized by
period. Most of the problems deliberated by the Board are
strategic in nature and have long term perspectives. Having
information about the budget, actual as well as the forecast
would allow the Board to review progress or evaluate
performance of a project or transaction. This provides better
control on the company’s operations and performance.
Among the impressions related to In perspective are;
The information were classified by period
Cumulative position were highlighted
Variances from the budget were adequately explained
Trend and analysis were included
Full-year projections updated
To measure the degree that the information is In perspective,
we ask the respondent to assess the degree that the information
is categorized, from 1 ‘perfectly categorized’ to 5 ‘not
categorized’.
Timely
Information has time value. Information that reaches the
Board after the related decisions have been made has lost its
value no matter how relevant it is. The Board should be given
sufficient time to digest the information. As far as possible,
information should be Timely, i.e. available in parallel with
activities to which it relates (CIMA). The effect of not
providing the information timely is to deny the Board
members information needed to make decision.
Among the phrases related to ‘Timely’ are;
far in advance
in parallel with
information were denied
In the questionnaire, we use the phrases ‘late, timely and
appropriate time’ to differentiate the degree of timeliness of
information from 1 ‘very late’ to 5 ‘at the most appropriate
time’.

International Journal of Basic & Applied Sciences IJBAS-IJENS Vol:10 No:06 89
106706-2929 IJBAS-IJENS © December 2010 IJENS I J E N S
Reliable
The information prepared for the Board should be of
sufficiently high reliability to attain their confidence. Reliable
is defined as ‘suitable or fit to be relied on or dependable
(Merriam-Webster). The degree of confidence that the Board
has may come from past experience or the knowledge and
expertise of the Board members themselves.
To measure the degree of reliability of the information
provided to the Board in the questionnaire, we based on the
degree of confidence one has on the information from 1 ‘no
confidence’ to 5 ‘high confidence’.
Clear
Information provided to the Board must be simple and clear to
maximize its value for the Board’s deliberation and decision.
The preparer should avoid using jargon and acronyms when
everyday language is possible. Graph and chart can enhance
the effectiveness of the communication if wisely used. The
information may include financial and non-financial, and both
need to be presented clearly if they are to reflect the
performance of a company. This is especially true for large
organizations with many subsidiaries, where the layers of
management and the number of units/divisions may obscure
the relevant figures and breed a lack of common
understanding of what the key performance drivers are.
(Starovic, 2003)
We use the terms ‘Clear, confusing and distorted’ in the
questionnaire to assess the degree that the information is
clearly presented from 1 ‘very clear’ to 5 ‘very distorted’.
Comparable
To enhance its usefulness, the information provided to the
Board should be compared to some appropriate measure or
value wherever possible. Comparison provides the relative
value of measures and allows users to be aware of the real
situation. The actual financial performance of the company for
example can be compared with the budgeted (planned) or with
‘what should have happened’ or with the future performance.
The extent of and the choice of measure or value used for
comparison are critical in preparing information for the Board
as these would have an impact on the quality of monitoring
practice performed by the Board.
In the questionnaire, we ask the respondents to assess the
quality of measures or values used for comparison in terms of
the appropriateness of the choice using the scale of 1
‘extremely appropriate’ to 5 ‘highly inappropriate’.
The direction (forward or reverse) of the rating in the
questionnaire was randomly distributed. The assessments for
three (3) dimensions (i.e. reliable, integrated and timely) are
forward direction which means ‘5’ carries positive and ‘1’
carries negative meaning and the others are of reverse
direction. This will restrain respondents from entering the
score mechanically.
Analysis
The two objectives of the research are firstly to assess the
quality of the information disseminated to the Board of
Directors as perceived by the Board members and the preparer
and secondly to measure the gap between the Board of
Directors’ and the preparers’ assessment. For the first
objective, descriptive analysis to measure the Means and
Standard Deviation will be performed and T- test will be used
to determine the significance of the differences between the
Board and the preparers on the quality of the information.
Pilot study
In this pilot study, questionnaires were distributed and
administered for the members of the Management Committee
and the Board of Directors of a Malaysian higher institution of
learning. This institution was selected in view of its position
as a corporate entity and its accessibility to the researchers.
Information on the types of decisions made by the Board and
the types of information delivered to them was gathered. The
types of decisions the Board ordinarily makes include:
Approval of the University’s business plans and
annual budgets
Provides advice on the next steps to enhance the
University’s competitive advantage
Deliberates on the Internal Audit Report
Approves the audited financial accounts
Approves the manpower budget
Award, termination and reappointment of contractors
The information provided to the Board includes the following;
University’s business plans and annual budgets
Detail on the yearly objectives of each department
Performance reporting of the whole University
Internal Audit Report
Manpower budget of the University
Infrastructural development
As for the pilot test, the information deliberated by the Board
was classified into three items: Overall policies and
guidelines, Business plan and budget, and Overall
management and performance of the organization. For each
item, the seven characteristics of information quality are being
measured using a 5-point Likert scale. Refer to Appendix 4.
Out of the fourteen members (seven from the Management
group and seven from the Board of Directors), we received 11
responses (seven from the Management group and four from
the Board), which is equivalent to 78 percent response rate.
VI. RESULTS AND FINDINGS
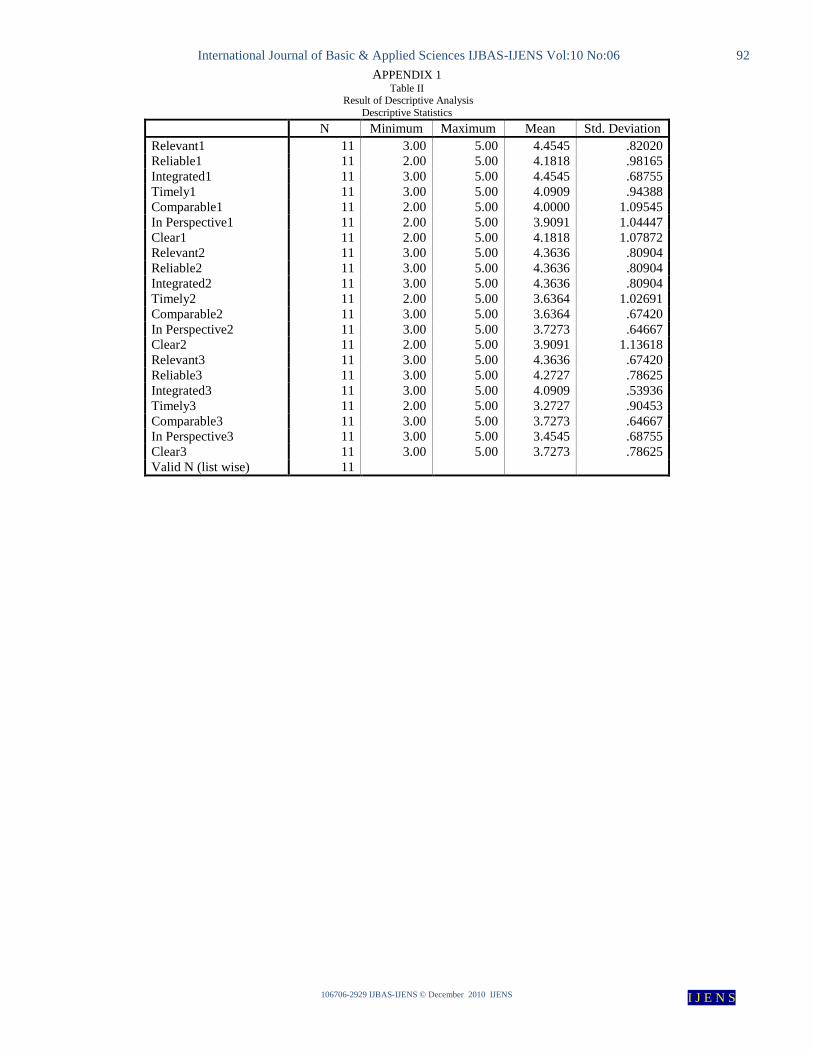
Using the SPSS Version 12, the data is analyzed. Table II (see
Appendix 1) shows the descriptive analysis of the responses.
The mean values of the responses range from the lowest 3.27
for the timeliness of the information related to the ‘Overall
management and performance of the organization’ to the
highest of 4.45 for the degree of relevancy and integrity of the
information related to the ‘Overall policies and guidelines’.
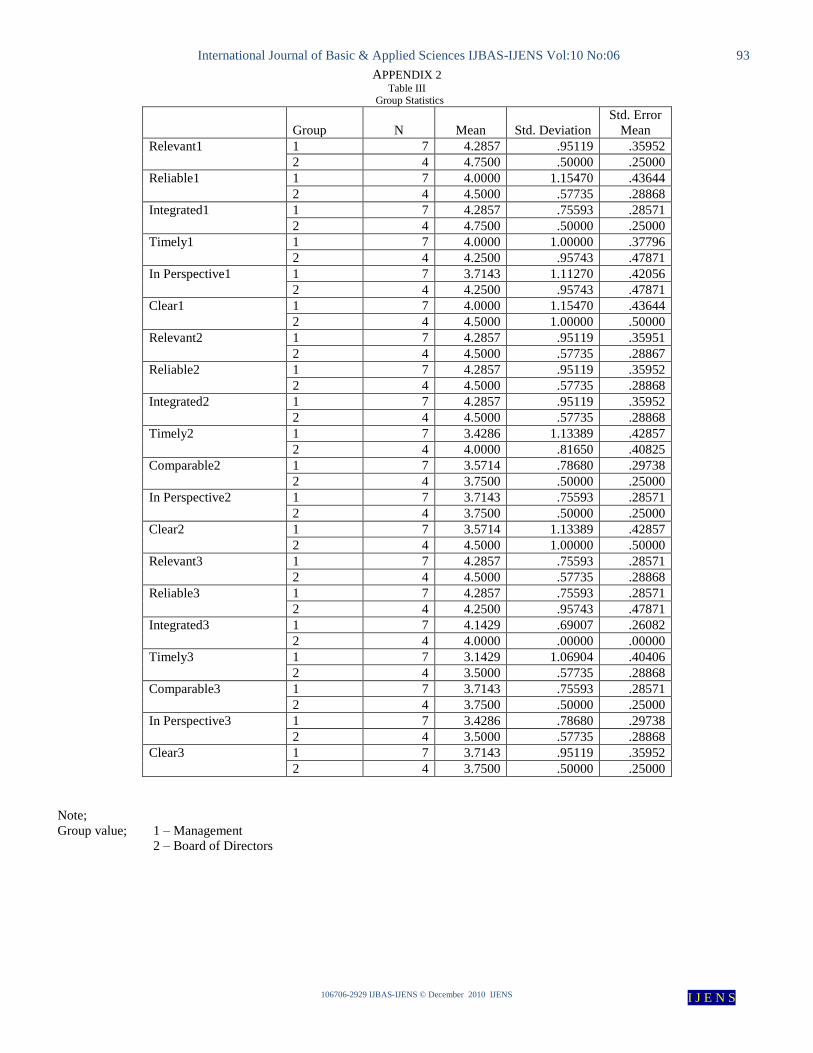
Table III (see Appendix 2) presents result of comparing the
mean scores of the Management (Group 1) and that of the
Board of Directors (Group 2). Comparing the means for each
characteristic of quality, we notice that the differences are
small and difficult to pick the extreme cases.
International Journal of Basic & Applied Sciences IJBAS-IJENS Vol:10 No:06 90
106706-2929 IJBAS-IJENS © December 2010 IJENS I J E N S
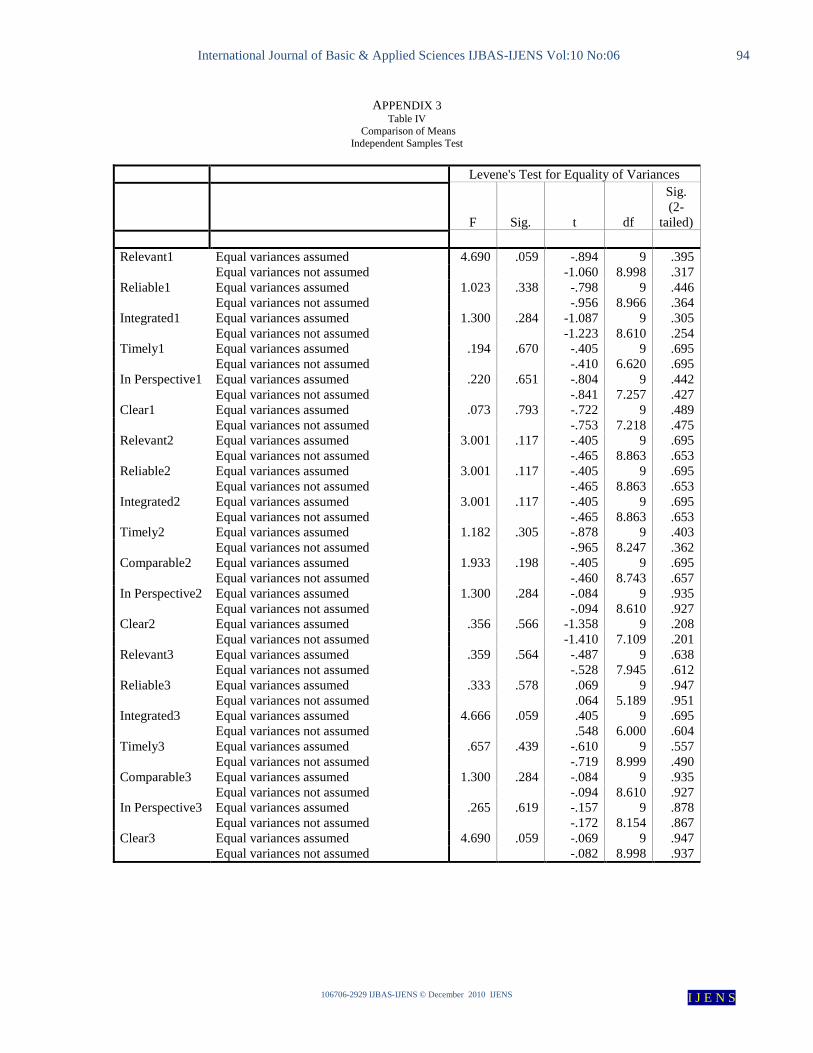
However, using the result of Levene’s test for equality of
variance, the degree of significance for each pair indicates that
there are significant differences between the means of the pair.
Three most significant differences are for the ‘Relevant
of information’ related to ‘Overall policies and guidelines’,
degree of Integrated and Clarity of information related to the
‘Overall management and performance of the organization’.
These are the three areas where the level of satisfaction with
the information quality differs greatly.
However, these three differences are only significant at 90%
confidence level.
VII. DISCUSSION
From the analysis discussed in the previous section, we can
deduce three points. Firstly, the quality of information
provided to Board of Directors is high. Secondly, there is a
convergence of opinion between the Management and BOD
on the above issue. Lastly, the satisfaction of BOD as the user
of the information is higher than that of the Management as
the preparer of that information. Following this, the higher
institution of learning where this research was conducted can
feel assured that Management understands its role and
responsibility with respect to providing of information to
BOD.
Although the scores for all the seven quality dimensions of
information are above average, on closer examination of the
mean scores in Table II, we notice that there is a quality
dimension that persistently scores lower than the rest.
‘Timeliness of the information’ scores lowest among the seven
dimensions in two items while third lowest in another. This
indicates that a possible room for improvement of the
information quality lies in improving the timeliness of the
information.
As mentioned in the introduction, the objective of this pilot
study is to evaluate the suitability of the instrument in
measuring the quality of information. From the descriptive
analysis, variation in the mean scores reflects the instrument’s
capability of capturing variations among respondents. The
five-point Likert scales used do provide reasonable choice to
respondents in deciding the quality level they select for a
given dimension.
Nevertheless, the major problem faced by the researchers is in
the administration of the instrument. It is a big challenge to get
the cooperation of Management as well as the BOD and a
much bigger challenge is in collecting the completed
questionnaires from the respondents. To overcome these
problems, in our future surveys, it is proposed that due
consent of top management of an organization or a group of
organizations be obtained accordingly, and secondly to
administer the data collection on the day of the Board sitting
i.e. when the Board concludes their meeting. This approach
will overcome the problems of collecting the questionnaires
from the respondents, and also the difficulty experienced by
the respondents in answering the questions.
VIII. CONCLUSION
Finally we conclude that the instrument is effective and
efficient in measuring the quality of information provided by
the Management to BOD. We may need to alter some of the
three items of information according to nature of the
organization tested or the order (reverse and forward) of the
questions.
REFERENCES [1] Adams, R., & Ferreria, D. (2003). A Theory of Corporate Boards,
Working Paper. SITE-Stockholm School of Economics.
[2] Cadbury, A. (1992). Report of the Committee on the Financial
Aspect of Corporate Governance, Gee. London. [3] Chhaochharia, V., & Grinstein, Y., (2005a). The Transformation
of US Corporate Boards: 1997–2003. Working Paper. Cornell
University. [4] Chhaochharia, V., & Grinstein, Y., (2005b). Corporate
Governance and Firm Value: The Impact of the 2002 Governance
Rules. Working Paper. Cornell University. [5] Coles, J.L., Daniel, N., & Naveen, L. (2005). Boards: Does One
Size Fit All? Working Paper. Arizona State University.
[6] Cornforth, C. (2001). What makes boards effective? An examination of the relationships between board inputs, structures,
processes and effectiveness in non-profit organizations’ Corporate
Governance: An International Review, Vol. 9 No. 3, pp. 217-27. [7] Daily, C., Dalton, D. & Cannella, A. (2003). Corporate
governance: decades of dialogue and data, Academy of Management Review, Vol. 28 No. 3, pp. 371-82.
[8] Deli, D.N., & Gillan, S.L. (2000). On the demand for independent
and active audit committees. Journal of Corporate Finance 6 (2), 427– 445.
[9] Delone, W.H. & McLean,E.R. (1992). Information systems
success: the quest for the dependent variable, Information systems research 3 (1), pp. 60–95.
[10] Finance Committee on Corporate Governance (2000). Malaysian
Code on Corporate Governance, Securities Commission. [11] Finance Committee on Corporate Governance (2001). Report on
Corporate Governance, Securities Commission.
[12] Forbes, D. and Milliken, F. (1999). ‘‘Cognition and corporate governance: understanding boards of directors as strategic
decision-making groups’’, Academy of Management Review, Vol.
24 No. 3, pp. 489-505. [13] Forslund, H. (2007). Measuring information quality in the order
fulfilment process, International Journal of Quality & Reliability
Management Vol. 24 No. 5, pp. 515-524 [14] Gelle. E. & Karhu. K. (2003) Information quality for strategic
technology planning Industrial Management and Data
Systems,Vol. 103, Issue 8-9, pp 633-643. [15] Gillan, S.L. (2006). Recent development in corporate governance:
an overview. Journal of Corporate Finance, 12 (2006) 381-402
[16] Gillette, A.B., Noe, T.H., & Rebello, M.J. (2003). Corporate board composition, protocols, and voting behavior: experimental
evidence. Journal of Finance 58 (5), 1997–2032
[17] Harris, M., & Raviv, A. (2005). A Theory of Board Control and Size. Working Paper. University of Chicago.
[18] Healy, P.M., & Palepu K.G. (2001). Information asymmetry,
corporate disclosure, and the capital market: A review of the empirical disclosure literature. Journal of Accounting and
Economics 31, 405–440.
[19] Hermalin, B., & Weisbach, M. (1988). The determinants of board composition. Rand Journal of Economics 19 (4), 589–606.
[20] Hirst, M. K. (1983). Reliance on Accounting Performance
Measures, Task Uncertainty, and Dysfunctional Behavior: Some Extensions, Journal of Accounting Research, Autumn, p. 596-605.
[21] Hopwood, A.G. (1972). An Empirical Study of the Role of
Accounting Data in Performance Evaluation. Empirical Research in Accounting, Supplement to Journal of Accounting Research, p.
156-182
[22] Ittner, C., D. Larcker and M. Rajan. (1997). The choice of performance measures in annual bonus contracts. The Accounting
Review (April): 231-255.

International Journal of Basic & Applied Sciences IJBAS-IJENS Vol:10 No:06 91
106706-2929 IJBAS-IJENS © December 2010 IJENS I J E N S
[23] Jarke,M. & Vassiliou,Y. (1997). Data warehouse quality: a review
of the DWQ project, Proceedings of the Conference on
Information Quality, Cambridge, MA, , pp. 299–313.
[24] John, K. & Senbet, L.W. (1998). Corporate governance and board
effectiveness. Journal of banking and Finance, 22, 371-403. [25] Kaplan, R., Norton, D. (1992). The balanced scorecard: Measures
that drive performance. The Harvard Business Review, January–
February, 71–79. [26] Kaplan, R., Norton, D. (1993). Putting the balanced scorecard to
work. The Harvard Business Review, September–October, 134–
147. [27] Klein, A. (1998). Firm performance and board committee
structure. Journal of Law and Economics, 137– 165.
[28] Klein, A. (2002). Economic determinants of audit committee independence. Accounting Review 77, 435–452.
[29] Lambert R.A. (2001). Contracting theory and accounting. Journal
of Accounting and Economics, 32, 3–8. [30] Lasfer, M. A. (2004). On the role of the board of directors: the
case of the adoption of Cadbury Recommendations in the
U.K.Corporate Governance, Advances in Financial Economics, Volume 9, 287–326
[31] Lee, Y.W., Strong, D. M., Kahn, B. K., and Wang, R.Y. (2002).
AIMQ: a methodology for information quality assessment. Information & Management 40,133–146
[32] Linck, J.S., Netter, J., & Yang, T. (2005a). The Determinants of
Board Structure. Working Paper. University of Georgia. [33] Linck, J.S., Netter, J., & Yang, T., 2005b. Effects and Unintended
Consequences of the Sarbanes Oxley Act on Corporate Boards. Working Paper. University of Georgia.
[34] Lorsch, J., & MacIver, E. (1989). Pawns or potentates. Boston,
MA: Harvard Business School Press. [35] Ong C.H. & Wan, D. (2008). Three conceptual models of board
role performance. Corporate Governance Vol 8 No. 3 2008, pp.
317-329 [36] Otley, D.T. (1978). Budget Use and Managerial Performance,
Journal of Accounting Research, p. 122-149.
[37] Parasuraman, A., Zeithaml, V.A. and Berry, L.L. (1985), “A conceptual model of service quality and its implications for future
research”, Journal of Marketing, Vol. 49, pp. 41-50.
[38] Parasuraman, A., Zeithaml, V.A. and Berry, L.L. (1988), “SERVQUAL: a multiple-item scale for measuring consumer
perceptions of service quality”, Journal of Retailing, Vol. 64 No.
1, pp. 12-40. [39] Price,R.; Shanks,G. (2005). A semiotic information quality
framework: Development and comparative analysis. Journal of
Information Technology, 2005, 20, 2, 88-102 [40] Raheja, C. (2005). Determinants of board size and composition: a
theory of corporate boards. Journal of Financial and Quantitative
Analysis 40 (2), 283– 306.
[41] Rosenstein, S., & Wyatt, J.G., 1990. Outside directors, board
independence and shareholder wealth. Journal of Financial Economics 26, 175– 191.
[42] Solomon, J. & Solomon A., (2004). Corporate Governance and
Accountability. John Wiley & Sons,Ltd. pp. 14 [43] Stanwick, P.A and Stanwick S.D.(2009), Understanding Business
Ethics, New Jersey; Pearson Education Inc, Prentice Hall
[44] Starovic, Danka. (2003). Performance Reporting to Boards: A Guide to Good Practice, The Chartered Institute of Management
Accountants . Retrieved November 4, 2008, from
http://www2.cimaglobal.com/cps/rde/xbcr/SID-0A82C289- 07A1F0A6/live/perfrpttoboards_techguides_2003.pdf
[45] Toften, K. & Rustad, K., (2005). Attributes of information
qualityof export market assistance: an exploratory study, European Journal of Marketing Vol. 39 No. 5/6, pp. 676-695
[46] Vafeas, N. (1999). Board meeting frequency and firm
performance. Journal of Financial Economics 53 (1), 113–142. [47] Van den Berghe, L. & Baelden, T. (2003). The monitoring role of
the board: one approach does not fit all. Corporate Governance:
An international review vol.13 pt 5 pp.680-690 [48] Wang, R.Y. & Strong, D.M. (1996). Beyond accuracy: what data
quality means to data consumers, Journal of Management
Information Systems 12 (4), pp. 5–34. [49] Warther, V.A. (1998). Board effectiveness and board dissent: a
model of the board’s relationship to management and shareholders.
Journal of Corporate Finance 4, 53– 70. [50] Westphal, J.D. (1999). Collaboration in the boardroom: the
consequences of social ties in the CEO/board relationship, Academy of Management Journal, Vol. 42, pp. 7-24.
[51] Yermack, D. (1996). Higher market valuation of companies with a
small board of directors. Journal of Financial Economics 40 (2), 185–213.
[52] Yussoff I., Daing , N. I., & Subramaniam S.P. (2008). Effect of
emphasis on non-financial indicators on management control system: Malaysian manufacturing experience. Working paper
presented at Global Management Accounting Research
Symposium, UNSW [53] Zahra, S. & Pearce, J (1989). Boards of directors and corporate
financial performance: a review and integrative model. Journal of
Management, Vol. 15 No. 2, pp. 291-334. [54] Zmud R. (1978). Concepts, theories and techniques: an empirical
investigation of the dimensionality of the concept of information,
Decision Sciences 9 (2), pp. 187–195.
International Journal of Basic & Applied Sciences IJBAS-IJENS Vol:10 No:06 92
106706-2929 IJBAS-IJENS © December 2010 IJENS I J E N S
APPENDIX 1 Table II
Result of Descriptive Analysis
Descriptive Statistics
N Minimum Maximum Mean Std. Deviation
Relevant1 11 3.00 5.00 4.4545 .82020
Reliable1 11 2.00 5.00 4.1818 .98165
Integrated1 11 3.00 5.00 4.4545 .68755
Timely1 11 3.00 5.00 4.0909 .94388
Comparable1 11 2.00 5.00 4.0000 1.09545
In Perspective1 11 2.00 5.00 3.9091 1.04447
Clear1 11 2.00 5.00 4.1818 1.07872
Relevant2 11 3.00 5.00 4.3636 .80904
Reliable2 11 3.00 5.00 4.3636 .80904
Integrated2 11 3.00 5.00 4.3636 .80904
Timely2 11 2.00 5.00 3.6364 1.02691
Comparable2 11 3.00 5.00 3.6364 .67420
In Perspective2 11 3.00 5.00 3.7273 .64667
Clear2 11 2.00 5.00 3.9091 1.13618
Relevant3 11 3.00 5.00 4.3636 .67420
Reliable3 11 3.00 5.00 4.2727 .78625
Integrated3 11 3.00 5.00 4.0909 .53936
Timely3 11 2.00 5.00 3.2727 .90453
Comparable3 11 3.00 5.00 3.7273 .64667
In Perspective3 11 3.00 5.00 3.4545 .68755
Clear3 11 3.00 5.00 3.7273 .78625
Valid N (list wise) 11
International Journal of Basic & Applied Sciences IJBAS-IJENS Vol:10 No:06 93
106706-2929 IJBAS-IJENS © December 2010 IJENS I J E N S
APPENDIX 2 Table III
Group Statistics
Group N Mean Std. Deviation
Std. Error
Mean
Relevant1 1 7 4.2857 .95119 .35952
2 4 4.7500 .50000 .25000
Reliable1 1 7 4.0000 1.15470 .43644
2 4 4.5000 .57735 .28868
Integrated1 1 7 4.2857 .75593 .28571
2 4 4.7500 .50000 .25000
Timely1 1 7 4.0000 1.00000 .37796
2 4 4.2500 .95743 .47871
In Perspective1 1 7 3.7143 1.11270 .42056
2 4 4.2500 .95743 .47871
Clear1 1 7 4.0000 1.15470 .43644
2 4 4.5000 1.00000 .50000
Relevant2 1 7 4.2857 .95119 .35951
2 4 4.5000 .57735 .28867
Reliable2 1 7 4.2857 .95119 .35952
2 4 4.5000 .57735 .28868
Integrated2 1 7 4.2857 .95119 .35952
2 4 4.5000 .57735 .28868
Timely2 1 7 3.4286 1.13389 .42857
2 4 4.0000 .81650 .40825
Comparable2 1 7 3.5714 .78680 .29738
2 4 3.7500 .50000 .25000
In Perspective2 1 7 3.7143 .75593 .28571
2 4 3.7500 .50000 .25000
Clear2 1 7 3.5714 1.13389 .42857
2 4 4.5000 1.00000 .50000
Relevant3 1 7 4.2857 .75593 .28571
2 4 4.5000 .57735 .28868
Reliable3 1 7 4.2857 .75593 .28571
2 4 4.2500 .95743 .47871
Integrated3 1 7 4.1429 .69007 .26082
2 4 4.0000 .00000 .00000
Timely3 1 7 3.1429 1.06904 .40406
2 4 3.5000 .57735 .28868
Comparable3 1 7 3.7143 .75593 .28571
2 4 3.7500 .50000 .25000
In Perspective3 1 7 3.4286 .78680 .29738
2 4 3.5000 .57735 .28868
Clear3 1 7 3.7143 .95119 .35952
2 4 3.7500 .50000 .25000
Note;
Group value; 1 – Management
2 – Board of Directors
International Journal of Basic & Applied Sciences IJBAS-IJENS Vol:10 No:06 94
106706-2929 IJBAS-IJENS © December 2010 IJENS I J E N S
APPENDIX 3 Table IV
Comparison of Means
Independent Samples Test
Levene's Test for Equality of Variances
F Sig. t df
Sig.
(2-
tailed)
Relevant1 Equal variances assumed 4.690 .059 -.894 9 .395
Equal variances not assumed -1.060 8.998 .317
Reliable1 Equal variances assumed 1.023 .338 -.798 9 .446
Equal variances not assumed -.956 8.966 .364
Integrated1 Equal variances assumed 1.300 .284 -1.087 9 .305
Equal variances not assumed -1.223 8.610 .254
Timely1 Equal variances assumed .194 .670 -.405 9 .695
Equal variances not assumed -.410 6.620 .695
In Perspective1 Equal variances assumed .220 .651 -.804 9 .442
Equal variances not assumed -.841 7.257 .427
Clear1 Equal variances assumed .073 .793 -.722 9 .489
Equal variances not assumed -.753 7.218 .475
Relevant2 Equal variances assumed 3.001 .117 -.405 9 .695
Equal variances not assumed -.465 8.863 .653
Reliable2 Equal variances assumed 3.001 .117 -.405 9 .695
Equal variances not assumed -.465 8.863 .653
Integrated2 Equal variances assumed 3.001 .117 -.405 9 .695
Equal variances not assumed -.465 8.863 .653
Timely2 Equal variances assumed 1.182 .305 -.878 9 .403
Equal variances not assumed -.965 8.247 .362
Comparable2 Equal variances assumed 1.933 .198 -.405 9 .695
Equal variances not assumed -.460 8.743 .657
In Perspective2 Equal variances assumed 1.300 .284 -.084 9 .935
Equal variances not assumed -.094 8.610 .927
Clear2 Equal variances assumed .356 .566 -1.358 9 .208
Equal variances not assumed -1.410 7.109 .201
Relevant3 Equal variances assumed .359 .564 -.487 9 .638
Equal variances not assumed -.528 7.945 .612
Reliable3 Equal variances assumed .333 .578 .069 9 .947
Equal variances not assumed .064 5.189 .951
Integrated3 Equal variances assumed 4.666 .059 .405 9 .695
Equal variances not assumed .548 6.000 .604
Timely3 Equal variances assumed .657 .439 -.610 9 .557
Equal variances not assumed -.719 8.999 .490
Comparable3 Equal variances assumed 1.300 .284 -.084 9 .935
Equal variances not assumed -.094 8.610 .927
In Perspective3 Equal variances assumed .265 .619 -.157 9 .878
Equal variances not assumed -.172 8.154 .867
Clear3 Equal variances assumed 4.690 .059 -.069 9 .947
Equal variances not assumed -.082 8.998 .937

International Journal of Basic & Applied Sciences IJBAS-IJENS Vol:10 No:06 95
106706-2929 IJBAS-IJENS © December 2010 IJENS I J E N S
APPENDIX 4
Information related to;
Quality Dimensions
Relevant Reliable Integrated
1. Overall policies and
guidelines1
2. Business Plan and
Budget2
3. Overall management
and performance of
the organization3
Rating What each rating means
1
The information
presented was
extremely related to the
decision.
I have no confidence in
the quality of the
information presented.
The information presented
totally contradicts with
information reported
externally.
2
This information
presented was
substantially related to
the decision.
I have little confidence
in the information
presented.
The information presented
slightly contradicts with
information reported
externally.
3
This information
presented was
moderately related to
the decision.
I have moderate
confidence in the
information presented.
The information presented
matches with information
reported externally.
4
This information
presented was least
related to the decision.
I have sufficient
confidence in the
information presented.
The information presented
is substantially in line
with information reported
externally.
5
This information
presented was not
related to the decision.
I have high confidence
in the information
presented.
This information is
totally in line with
information reported
externally.
Information related to;
Quality Dimensions
Timely Comparable In perspective Clear
1. Overall policies and
guidelines1
2. Business Plan and Budget2
3. Overall management and performance of the
organization3
Rating What each rating means
1
The information presented came very
late.
The comparative data provided was
extremely
appropriate.
The information provided was perfectly
categorized by period.
The information presented was very
clear.
2
The information
presented came a bit
late.
The comparative
data provided was
substantially
appropriate.
The information provided
was substantially well
categorized by period.
The information
presented was
moderately clear.
3
The information
presented came
timely.
The comparative
data provided was
appropriate.
The information provided
was well categorized by period.
The information
presented was clear.
4
The information
presented came quite
timely.
The comparative
data provided was
slightly
inappropriate.
The information provided
was barely categorized
by period.
The information
presented was
confusing.
5
The information
presented came at the
most appropriate
time.
The comparative
data provided was
highly
inappropriate.
The information provided
was not categorized by period.
The information
presented was very
distorted.