Embed Size (px)
Citation preview
Quality of Ground Water in Idaho
United States Geological SurveyWater-Supply Paper 2272
Quality of Ground Water in Idaho
By JOHNSON J. S. YEE and WILLIAM R. SOUZA
U.S. GEOLOGICAL SURVEY WATER-SUPPLY PAPER 2272
DEPARTMENT OF THE INTERIOR
DONALD PAUL MODEL, Secretary
U.S. GEOLOGICAL SURVEY
Dallas L. Peck, Director
UNITED STATES GOVERNMENT PRINTING OFFICE: 1987
For sale by the Books and Open-File Reports Section, U.S. Geological Survey, Federal Center, Box 25425, Denver, CO 80225
Library of Congress Cataloging in Publication Data
Yee, Johnson, J.S.Quality of ground waterin Idaho.
(U.S. Geological Survey water-supply paper; 2272)"July1984."
Bibliography: p.Supt.ofDocs.no.:! 19.13:2272 1. Water, underground Idaho Quality. I. Souza, William
R. II. Title. III. Series: U.S. Geological Survey water-supplypaper;2272.
TD224.I2Y44 1987 363.7394 84-600380
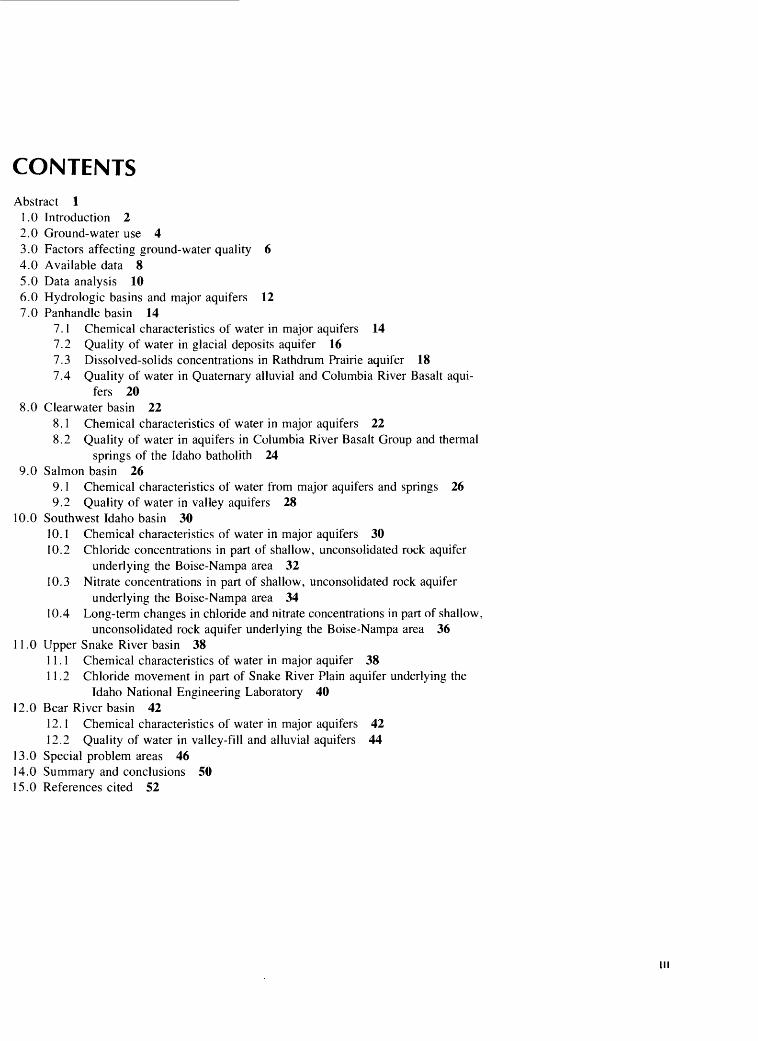
CONTENTS
Abstract 1 1.0 Introduction 2 2.0 Ground-water use 4 3.0 Factors affecting ground-water quality 6 4.0 Available data 8 5.0 Data analysis 106.0 Hydrologic basins and major aquifers 12 7.0 Panhandle basin 14
7.1 Chemical characteristics of water in major aquifers 147.2 Quality of water in glacial deposits aquifer 167.3 Dissolved-solids concentrations in Rathdrum Prairie aquifer 187.4 Quality of water in Quaternary alluvial and Columbia River Basalt aqui
fers 20 8.0 Clearwater basin 22
8.1 Chemical characteristics of water in major aquifers 228.2 Quality of water in aquifers in Columbia River Basalt Group and thermal
springs of the Idaho batholith 24 9.0 Salmon basin 26
9.1 Chemical characteristics of water from major aquifers and springs 269.2 Quality of water in valley aquifers 28
10.0 Southwest Idaho basin 3010.1 Chemical characteristics of water in major aquifers 3010.2 Chloride concentrations in part of shallow, unconsolidated rock aquifer
underlying the Boise-Nampa area 3210.3 Nitrate concentrations in part of shallow, unconsolidated rock aquifer
underlying the Boise-Nampa area 3410.4 Long-term changes in chloride and nitrate concentrations in part of shallow,
unconsolidated rock aquifer underlying the Boise-Nampa area 36 11.0 Upper Snake River basin 38
11.1 Chemical characteristics of water in major aquifer 3811.2 Chloride movement in part of Snake River Plain aquifer underlying the
Idaho National Engineering Laboratory 40 12.0 Bear River basin 42
12.1 Chemical characteristics of water in major aquifers 4212.2 Quality of water in valley-fill and alluvial aquifers 44
13.0 Special problem areas 46 14.0 Summary and conclusions 50 15.0 References cited 52
LIST OF ABBREVIATIONS USED IN THIS REPORT
EPA U.S. Environmental Protection Agency IDHW Idaho Department of Health and Welfare,
Division of EnvironmentID WR Idaho Department of Water Resources INEL Idaho National Engineering Laboratory NURE National Uranium Resource Evaluation STORET Storage and Retrieval System (EPA's computerized
data-management system)USER U.S. Bureau of Reclamation USGS U.S. Geological Survey W ATSTORE National Water Data Storage and
Retrieval System (USGS's computerizeddata-processing and retrieval system)
IV
QUALITY OF GROUND WATER IN IDAHO
By Johnson J. S. Yee and William R. Souza
ABSTRACT
The major aquifers in Idaho are categorized under two rock types, sedimentary and volcanic, and are grouped into six hydrologic basins. Areas with adequate, mini mally adequate, or deficient data available for ground- water-quality evaluations are described.
Wide variations in chemical concentrations in the water occur within individual aquifers, as well as among the aquifers. The existing data base is not sufficient to de scribe fully the ground-water quality throughout the State; however, it does indicate that the water is generally suit able for most uses. In some aquifers, concentrations of fluoride, cadmium, and iron in the water exceed the U.S. Environmental Protection Agency's drinking-water stan dards. Dissolved solids, chloride, and sulfate may cause problems in some local areas.
Water-quality data are sparse in many areas, and only general statements can be made regarding the areal distri
bution of chemical constituents. Few data are available to describe temporal variations of water quality in the aqui fers.
Primary concerns related to special problem areas in Idaho include (1) protection of water quality in the Rathdrum Prairie aquifer, (2) potential degradation of water quality in the Boise-Nampa area, (3) effects of widespread use of drain wells overlying the eastern Snake River Plain basalt aquifer, and (4) disposal of low-level radioactive wastes at the Idaho National Engineering Lab oratory.
Shortcomings in the ground-water-quality data base are categorized as (1) multiaquifer sample inadequacy, (2) constituent coverage limitations, (3) baseline-data de ficiencies, and (4) data-base nonuniformity.
1.0 INTRODUCTION
Report Summarizes Current Quality of Ground-Water Conditions in Idaho
This report provides information about the current quality of ground water in the major aquifers in Idaho and describes that quality on areal and temporal bases to the level of detail possible from the available data.
In Idaho, as in the rest of the Nation, the quality of ground-water resources can be degraded by human ac tivities. To describe current conditions of ground-water qual ity and to assess potential changes, an adequate data base is essential. Where sufficient data are available, water quality in the major aquifers can be described on areal and, in a few places, temporal bases. Where data are not sufficient, the water quality can be described only in general terms or not at all.
This report presents the results of a study whose primary objectives were to (1) obtain and examine existing water- quality data and assess their value for use in representing nat ural and current water-quality conditions in particular aquif ers or basins, (2) identify possible deficiencies in existing data, and (3) suggest ways to improve the data base.
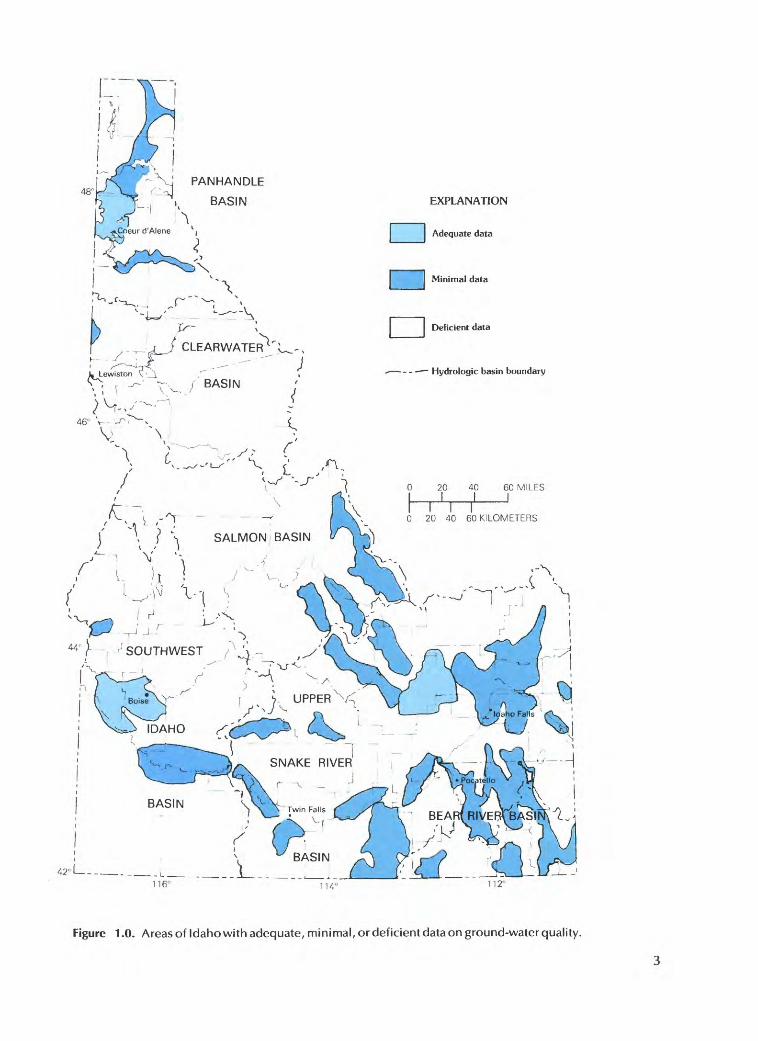
Areas of Idaho with adequate, minimally adequate, or deficient data are shown in figure 1.0. Specific statistical criteria could not be applied to every aquifer to assess current water-quality conditions or to judge adequacy of the data. Each major aquifer was evaluated individually in relation to areal extent and representativeness of data. Data are consid ered adequate where they are sufficiently abundant to confi dently define variations in one or more water-quality indi cators in space and time over a major part of an aquifer. Data are considered minimally adequate where they are sparse and where only general statements can be made regarding the areal distribution of the indicators. Data are deficient where they are absent or can be used only to indicate conditions at isolated sites and where no correlations can be made between sites.
PANHANDLE
BASIN
\
ur- x
CLEARWATEFT'v
-^ f' BASIN
EXPLANATION
Adequate data
Minimal data
Deficient data
Hydrologic basin boundary
t.
0 20 40 60 MILES II I
Tl I20 40 60 KILOMETERS
] \ SALMON BASIN / '
42° I - -
Figure 1.0. Areas of Idaho with adequate, minimal, or deficient data on ground-water quality.
2.0 GROUND-WATER USE
Ground-Water Sources Supply More Than One-Third of the Water Used in Idaho
Ground water is an important source for all major water uses and constitutes 90 per cent of the public water supply in Idaho.
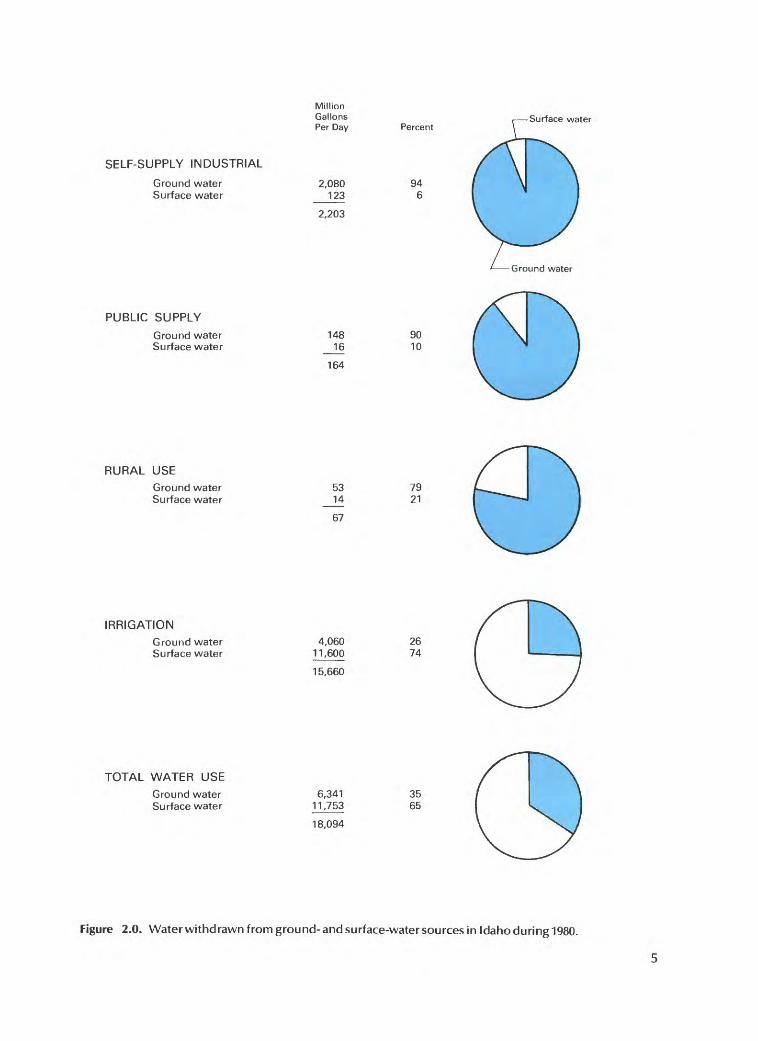
Ground water is the principal source of industrial, public, and rural water supplies in Idaho. In addition, ground water supplies an ever-increasing portion of the water used for irrigation. Ground-water resources can be divided into two major types cold water and thermal water. Thermal water is used for space heating, health spas, recreation, and irrigation. In 1980, the total rate of ground-water withdrawal from all sources was about 6,341 Mgal/d. Water for public supply and rural domestic uses serves the largest number of people and is potentially most sensitive to contamination. By far, the largest amount of water used in Idaho is for industry and agricul ture. For these uses, the quantity of water is generally more essential than quality but, because the water is drawn from the same sources as are public water supplies, the quality of ground water must be protected. As shown in figure 2.0, ground water supplies varying proportions of the water for the major water uses in Idaho. In 1980,
ground water's contribution ranged from 26 percent of the water used for irrigation to 94 percent of the water needed for industrial use.
Self-supply industrial use of water in Idaho is exceed ingly high in comparison to that of other States in the Na tion. This apparent high use occurs because the portion at tributed to ground water includes natural discharge from springs, some of which is used for fish farming.
Public water supply served a total of 709,000 people in Idaho during 1980 (K. J. Reid, oral commun., 1982), which accounts for 75 percent of the State population. Of the total number using public supplies, 592,000 persons, or 83 percent, were served from ground-water sources. Also, in 1980, 4 million acres of land were under irriga tion in Idaho, about one-third of which was irrigated with ground water. On the basis of 4,060 Mgal/d withdrawn for irrigation in 1980 (see fig. 2.0), withdrawal averaged about 0.003 (Mgal/d)/acre.
SELF-SUPPLY INDUSTRIAL
Ground water Surface water
PUBLIC SUPPLY
Ground water Surface water
Million Gallons Per Day
2,080123
2,203
14816
164
Percent
946
Surface water
9010
RURAL USE
Ground water Surface water
5314
67
7921
IRRIGATION
Ground water Surface water
4,06011,600
15,660
2674
TOTAL WATER USE
Ground water Surface water
6,34111,753
18,094
3565
Figure 2.0. Water withdrawn from ground-and surface-water sources in Idaho during 1980.
3.0 FACTORS AFFECTING GROUND-WATER QUALITY
Ground-Water Quality Affected by Natural Influences and Human Activities
Ground-water quality may vary greatly from aquifer to aquifer. Variations are caused by contact with the geologic environment and by man's activities.
The quality of ground water is affected by the process- Man's activities cause changes in water quality eitheres of nature and by man's activities. Natural factors that by withdrawing water from the ground-water system or byaffect the initial quality of the water include (1) chemistry adding chemicals and contaminants directly into the aqui-of precipitation, (2) dissolution of organic and mineral fers. Contaminants are added to the ground-water systemsubstances from vegetation, soil, and rocks as water infil- primarily through waste discharges from agricultural, in-trates the land surface and percolates through earth mate- dustrial, and urban sources. The sources of wastes and as-rials, and (3) length of time of contact with soil and rocks. sociated types of contaminants most likely to affectThese factors determine the concentrations of dissolved ground-water quality in Idaho are listed in table 3.0. minerals in ground water.
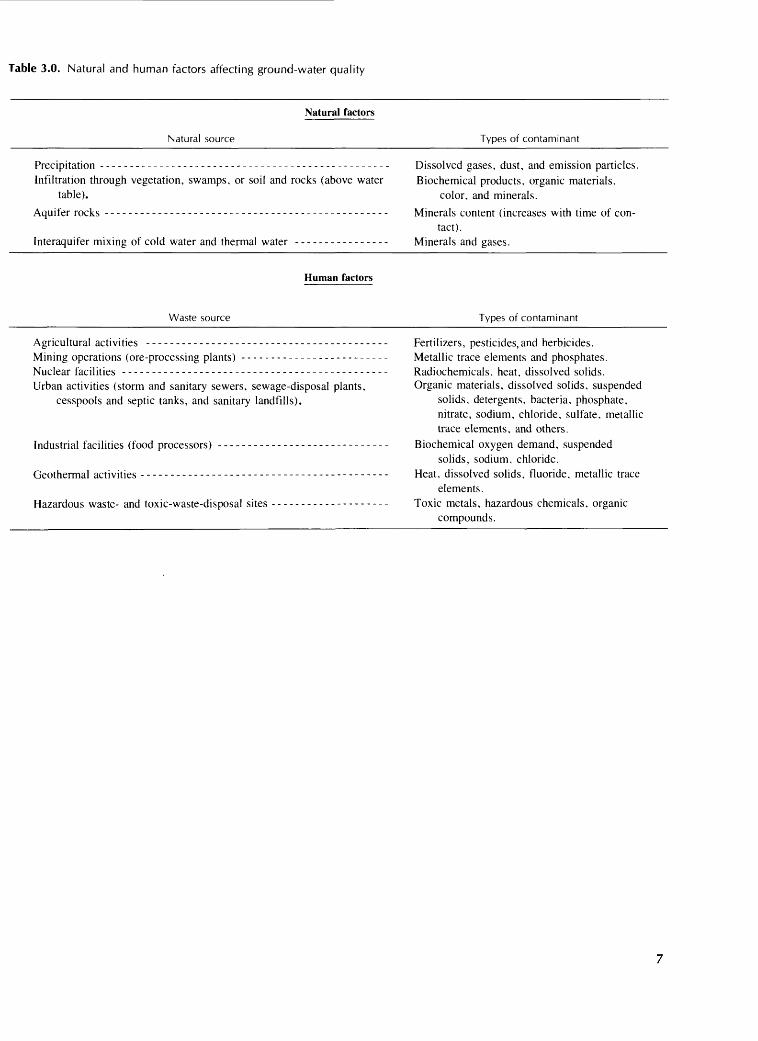
Table 3.0. Natural and human factors affecting ground-water quality
Natural factors
Natural source Types of contaminant
Precipitation ------------------------------------------------- Dissolved gases, dust, and emission particles.Infiltration through vegetation, swamps, or soil and rocks (above water Biochemical products, organic materials,
table). color, and minerals.Aquifer rocks ------------------------------------------------ Minerals content (increases with time of con
tact). Interaquifer mixing of cold water and thermal water ---------------- Minerals and gases.
Human factors
Waste source Types of contaminant
Agricultural activities ----------------------------------------- Fertilizers, pesticides, and herbicides.Mining operations (ore-processing plants) ------------------------- Metallic trace elements and phosphates.Nuclear facilities --------------------------------------------- Radiochemicals, heat, dissolved solids.Urban activities (storm and sanitary sewers, sewage-disposal plants. Organic materials, dissolved solids, suspended
cesspools and septic tanks, and sanitary landfills). solids, detergents, bacteria, phosphate,nitrate, sodium, chloride, sulfate, metallictrace elements, and others.
Industrial facilities (food processors) ----------------------------- Biochemical oxygen demand, suspendedsolids, sodium, chloride.
Geothermal activities ------------------------------------------ Heat, dissolved solids, fluoride, metallic traceelements.
Hazardous waste- and toxic-waste-disposal sites -------------------- Toxic metals, hazardous chemicals, organiccompounds.
4.0 AVAILABLE DATA
Computerized Data-Management Systems Provide Data on Ground-Water Quality
WATSTORE, the USGS's National Water Data Storage and Retrieval System was used as the primary source of data for evaluating ground-water quality in the State. Other sources of data included EPA's Storage and tfefrieval System (STORED, water-quality files of the Idaho Department of Water Resources and Idaho Department of Health and Welfare, and published reports by Idaho State and Federal agencies.
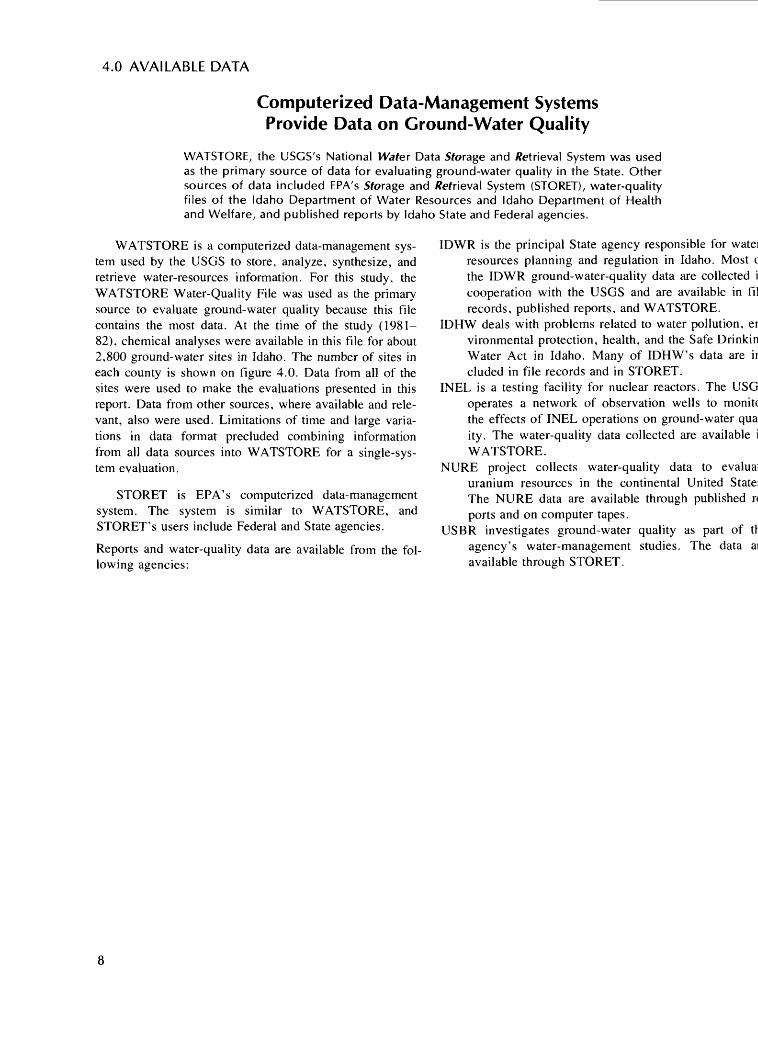
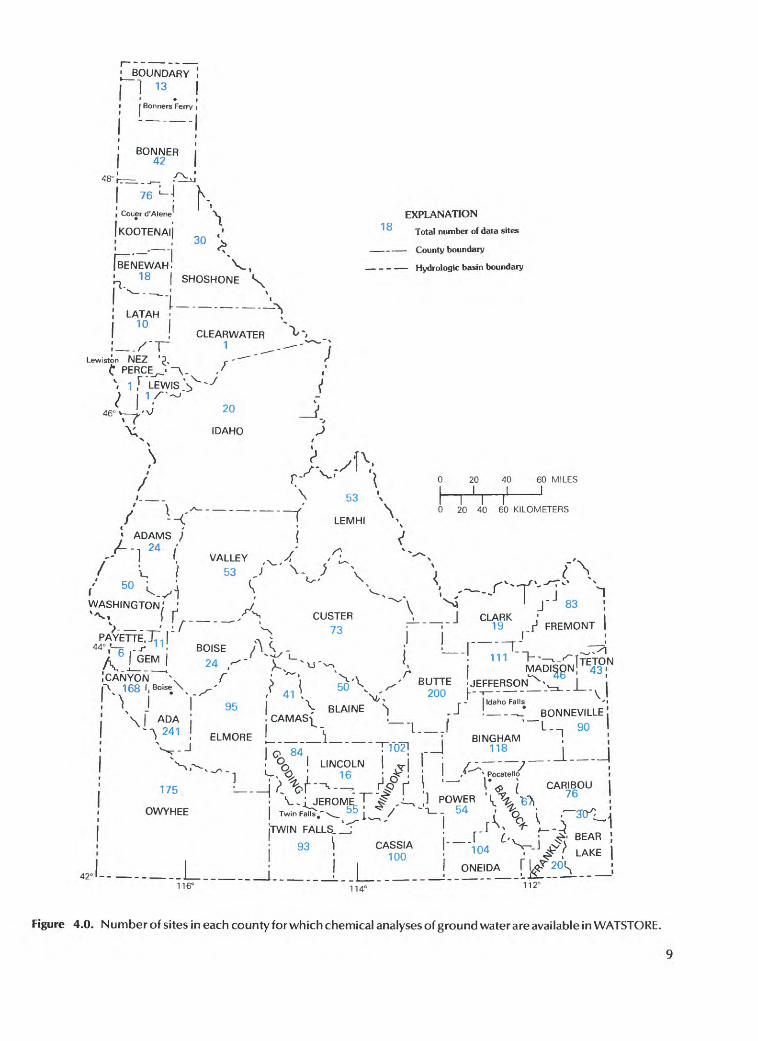
WATSTORE is a computerized data-management sys tem used by the USGS to store, analyze, synthesize, and retrieve water-resources information. For this study, the WATSTORE Water-Quality File was used as the primary source to evaluate ground-water quality because this file contains the most data. At the time of the study (1981- 82), chemical analyses were available in this file for about 2,800 ground-water sites in Idaho. The number of sites in each county is shown on figure 4.0. Data from all of the sites were used to make the evaluations presented in this report. Data from other sources, where available and rele vant, also were used. Limitations of time and large varia tions in data format precluded combining information from all data sources into WATSTORE for a single-sys tem evaluation.
STORET is EPA's computerized data-management system. The system is similar to WATSTORE, and STORET's users include Federal and State agencies.
Reports and water-quality data are available from the fol lowing agencies:
IDWR is the principal State agency responsible for watei resources planning and regulation in Idaho. Most c the IDWR ground-water-quality data are collected i cooperation with the USGS and are available in fil records, published reports, and WATSTORE.
IDHW deals with problems related to water pollution, er vironmental protection, health, and the Safe Drinkin Water Act in Idaho. Many of IDHW's data are ir eluded in file records and in STORET.
INEL is a testing facility for nuclear reactors. The USG operates a network of observation wells to monitc the effects of INEL operations on ground-water qua ity. The water-quality data collected are available i WATSTORE.
NURE project collects water-quality data to evaluai uranium resources in the continental United State: The NURE data are available through published r< ports and on computer tapes.
USER investigates ground-water quality as part of tf agency's water-management studies. The data ai available through STORET.
1 BOUNDARY !
I I « |i i . ,
I Bonners Ferry i
! BONNER 42
i Couer d'Alene
JKOOTENAIJ 3Q /
[BENEWAH. V,' 18 | SHOSHONE *
EXPLANATION18 Total number of data sites
- County boundary
- - Hydrologic basin boundary
,' LATAH I 10
Lewiston NEZ '^,
£ PERCE_^_- -\_
\ 1 [ LEWIS _ N̂
CLEARWATER 1
20
IDAHO
'J
r\/ { <1 ADAMS )^--1 24 /;
^ /50 : A
- ('
\53 \
VALLEY
53
LEMHI\
0 20 40 60 MILES III II rn r0 20 40 60 KILOMETERS
CUSTER 73
\ N} ' J 83J CLARK ; I
- ;- J 19 _|J FREMONT I19
111
! CANYON \ f|\ 168 I, Boise \ '
WASHINGTON; J
PAYETTE.I^r oT) 11 BOISE A {
I X VJL/ |_ i '111
" "" N^'X r \ MADISON!'^f^ I 50'^ S BUTTE JEFFERSON^^ I , '41 I V 200 L--T-- - Al
1 } I I oc I \ i. r- Idaho Falls '
J \ ADA M !cAMAS\ B^'NE ^_., ; J ! -;_BONNEVILLE :
' \ 241 I 1 I - L -n 90 ' ! > ^41 , ELMORE L _ __L _ _ _ I BINGHAM n, !
118 I iELMORE L- 1! - --,--^ " j
, 0 84 T102] ,.J^o 84 ! °n I LINCOLN
167
42-1
175
OWYHEE
116°
CARIBOU 76
'1 V> <^ 1 16 j <J ' __' \Pocatelto
L\t%t-^ ..^?/f !' <* ( CAR! n V.i JEROME^/ ,^ ,1 POWER \^L ^
| TwinF^.-v_ ^i^/ ~T-- 54 , % - ri *^^~ ' I r \ QL ' \TWIN FALLS.__J ! r-^ ^~^
; 93 \ CASSIA j- '', £ 'S^J ^
' I
.L.114°
1Q4
! ONEIDA112°
Figure 4.0. Number of sites in each county for which chemical analyses of ground water are available in WATSTORE.
5.0 DATA ANALYSIS
Water-Quality Data Analyzed by Using SAS to Produce Statistical Summaries
SAS1 (Statistical Analysis System) is used to compute descriptive statistics for selected water-quality constituents.
SAS is a computer-soft ware system that contains pro grams for statistical analysis of data. The system, avail able through WATSTORE or STORET, is used to retrieve and summarize data into interpretable formats. The SAS UNIVARIATE procedure was used to produce the de scriptive statistics of water-quality data in this report. (See
' The use of brand names in this report is for identification purposes only and does not constitute endorsement.
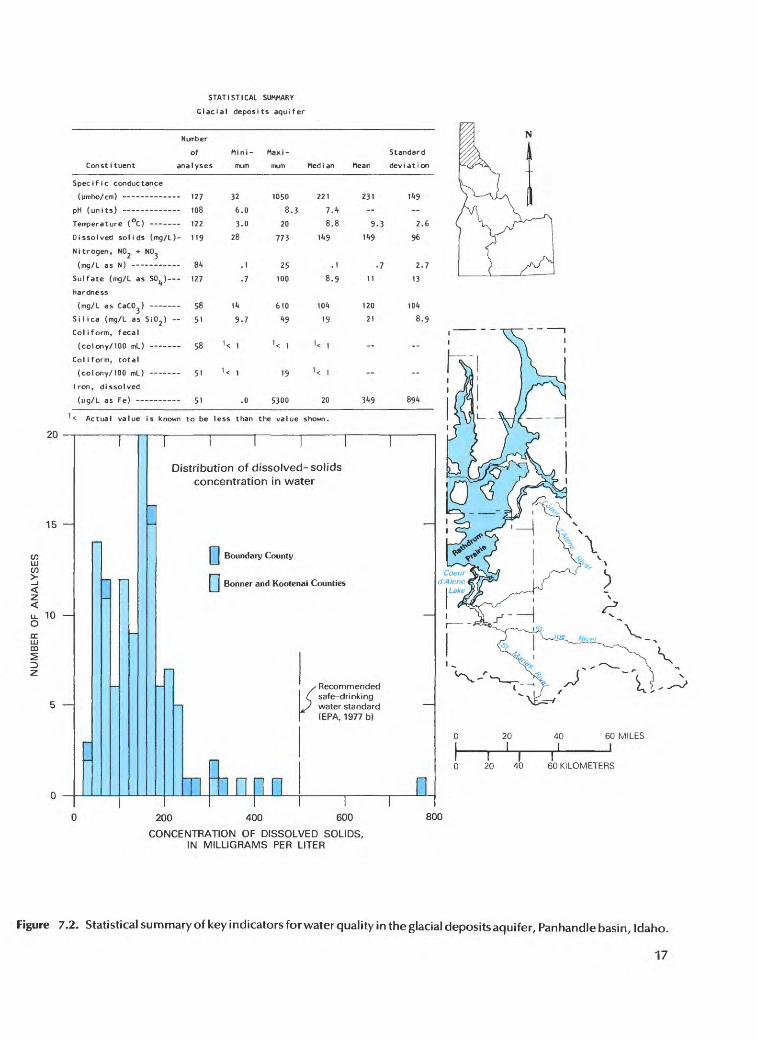
figure 7.2 for a statistical summary of key indicators for water in a glacial deposits aquifer. For each constituent within an aquifer, the summary lists the number of analyses evaluated, minimum and maximum values in the data, median or middle value of each data set, mean or arithmetic average, and standard deviation.)
Constituents selected for SAS evaluation and their sig nificance as water-quality indicators are listed in table 5.0.
10
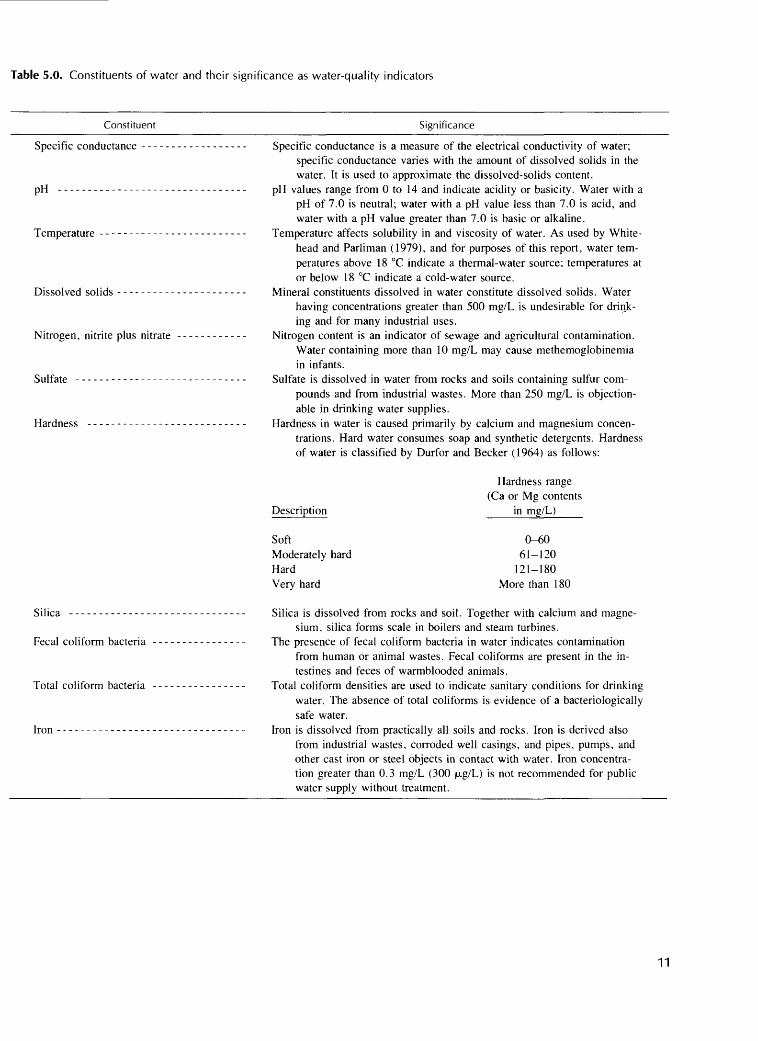
Table 5.0. Constituents of water and their significance as water-quality indicators
Constituent Significance
Specific conductance
pH
Temperature
Dissolved solids
Nitrogen, nitrite plus nitrate
Sulfate
Hardness
Silica --------------
Fecal coliform bacteria
Total coliform bacteria
Iron ----------------
Specific conductance is a measure of the electrical conductivity of water; specific conductance varies with the amount of dissolved solids in the water. It is used to approximate the dissolved-solids content.
pH values range from 0 to 14 and indicate acidity or basicity. Water with a pH of 7.0 is neutral; water with a pH value less than 7.0 is acid, and water with a pH value greater than 7.0 is basic or alkaline.
Temperature affects solubility in and viscosity of water. As used by White- head and Parliman (1979), and for purposes of this report, water tem peratures above 18 °C indicate a thermal-water source; temperatures at or below 18 °C indicate a cold-water source.
Mineral constituents dissolved in water constitute dissolved solids. Water having concentrations greater than 500 mg/L is undesirable for drink ing and for many industrial uses.
Nitrogen content is an indicator of sewage and agricultural contamination. Water containing more than 10 mg/L may cause methemoglobinemia in infants.
Sulfate is dissolved in water from rocks and soils containing sulfur com pounds and from industrial wastes. More than 250 mg/L is objection able in drinking water supplies.
Hardness in water is caused primarily by calcium and magnesium concen trations. Hard water consumes soap and synthetic detergents. Hardness of water is classified by Durfor and Decker (1964) as follows:
Description
SoftModerately hard Hard Very hard
Hardness range(Ca or Mg contents
in mg/L)
0-60
61-120121-180
More than 180
Silica is dissolved from rocks and soil. Together with calcium and magne sium, silica forms scale in boilers and steam turbines.
The presence of fecal coliform bacteria in water indicates contamination from human or animal wastes. Fecal coliforms are present in the in testines and feces of warmblooded animals.
Total coliform densities are used to indicate sanitary conditions for drinking water. The absence of total coliforms is evidence of a bacteriologically safe water.
Iron is dissolved from practically all soils and rocks. Iron is derived also from industrial wastes, corroded well casings, and pipes, pumps, and other cast iron or steel objects in contact with water. Iron concentra tion greater than 0.3 mg/L (300 (Jtg/L) is not recommended for public water supply without treatment.
11
6.0 HYDROLOGIC BASINS AND MAJOR AQUIFERS
Major Aquifers Categorized Under Two Rock Types, Sedimentary and Volcanic
Areas of similar geology and hydrology allow the major aquifers to be grouped into six hydrologic basins. Data are sufficient to describe water-quality conditions at vari ous levels of detail in only selected aquifer groups.
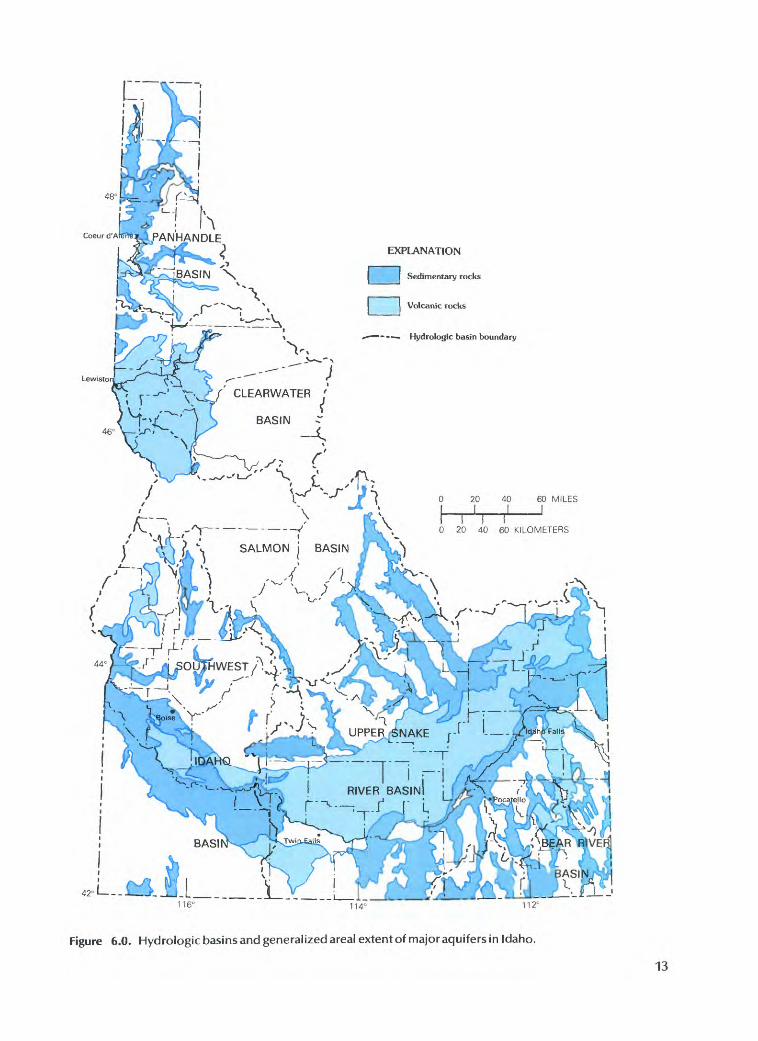
Seventy major ground-water flow systems have been identified in Idaho by Graham and Campbell (1981). Data are not sufficient to make water-quality evaluations for all of these systems. For this study, systems with similar geology and hydrology are combined into single aquifers and categorized under two rock types sedimentary and volcanic. To facilitate the evaluations and to allow ease of comparison, the aquifers are grouped within six hydro- logic basins, five of which drain to the Columbia River and one to the Great Salt Lake in Utah. The basin bound aries generally follow the divisions used by the IDHW (1980a); these divisions are based on hydrologic units (U.S. Geological Survey, 1975). The generalized areal ex tent of major aquifers and the boundaries of the hydro- logic basins are shown on figure 6.0. Data are sufficient to describe water-quality conditions at various levels of detail only in selected aquifer groupings; these groupings are discussed in sections 7.0 - 12.0 of this report.
The northernmost basin is the Panhandle basin, which consists of five counties and includes the important Rathdrum Prairie-Coeur d'Alene area. Data from this basin are minimal except for data for the glacial deposits aquifer (described in section 7.2 of this report).
The Clearwater and Salmon basins, which constitute the lower panhandle and north-central parts of the State, have limited water development, scant population, and lit tle agriculture. Data for these basins are too few to de scribe ground-water quality in any detail.
The Southwest Idaho basin is the most populous basin. A great deal of water-quality data is available, and most is from the Boise area. Water-quality conditions in parts of this basin can be described in some detail.
The Upper Snake River basin is the largest of the six basins. This area is farmed extensively and is heavily irri gated with both surface and ground waters. In addition to agriculture, phosphate ore-processing operations and nu clear reactor facilities are in the basin. Population centers, agricultural development, and water use are concentrated near the Snake River. Data are too few to make any de tailed descriptions of water quality except for the INEL area (for location, see fig. 11.2).
The Bear River basin, in the southeastern corner of Idaho, drains to the Great Salt Lake. Historically, the basin area has been heavily irrigated and, more recently, influenced by phosphate mining and waste disposal near Soda Springs. Data are generally minimal to describe ground-water quality.
12
EXPLANATION
I____ Sedimentary rocks
Volcanic rocks
-- Hydrologic basin boundary
in --iRIVER BASIN
0 20 40 60 MILES
116' 112°
Figure 6.0. Hydrologic basins and generalized areal extent of major aquifers in Idaho.
13
7.0 PANHANDLE BASIN
7.1 Chemical Characteristics of Water in Major Aquifers
Five Aquifers Ranging in Age from Quaternaryto Precambrian Have Been Identified
in the Panhandle Basin
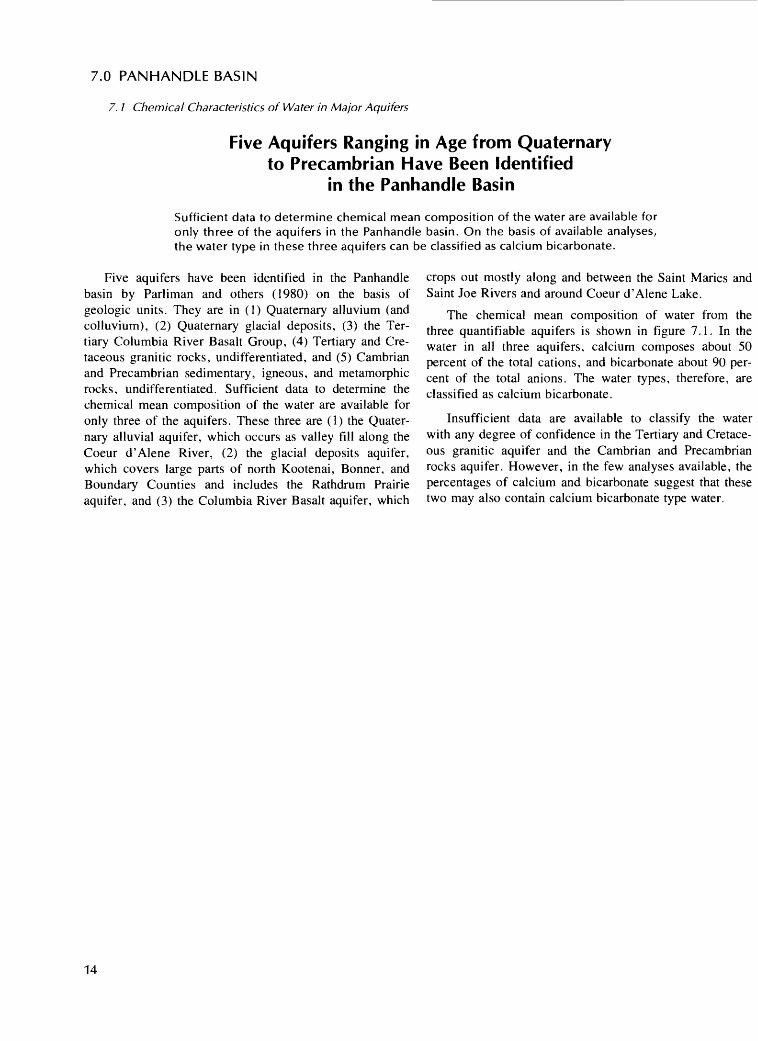
Sufficient data to determine chemical mean composition of the water are available for only three of the aquifers in the Panhandle basin. On the basis of available analyses, the water type in these three aquifers can be classified as calcium bicarbonate.
Five aquifers have been identified in the Panhandle basin by Parliman and others (1980) on the basis of geologic units. They are in (1) Quaternary alluvium (and colluvium), (2) Quaternary glacial deposits, (3) the Ter tiary Columbia River Basalt Group, (4) Tertiary and Cre taceous granitic rocks, undifferentiated, and (5) Cambrian and Precambrian sedimentary, igneous, and metamorphic rocks, undifferentiated. Sufficient data to determine the chemical mean composition of the water are available for only three of the aquifers. These three are (1) the Quater nary alluvial aquifer, which occurs as valley fill along the Coeur d'Alene River, (2) the glacial deposits aquifer, which covers large parts of north Kootenai, Bonner, and Boundary Counties and includes the Rathdrum Prairie aquifer, and (3) the Columbia River Basalt aquifer, which
crops out mostly along and between the Saint Maries and Saint Joe Rivers and around Coeur d'Alene Lake.
The chemical mean composition of water from the three quantifiable aquifers is shown in figure 7.1. In the water in all three aquifers, calcium composes about 50 percent of the total cations, and bicarbonate about 90 per cent of the total anions. The water types, therefore, are classified as calcium bicarbonate.
Insufficient data are available to classify the water with any degree of confidence in the Tertiary and Cretace ous granitic aquifer and the Cambrian and Precambrian rocks aquifer. However, in the few analyses available, the percentages of calcium and bicarbonate suggest that these two may also contain calcium bicarbonate type water.
14
100
Quaternaryalluvialaquifer
Glacialdepositsaquifer
Columbia RiverBasaltaquifer
80
OH CO
60
O O
40
20
Mean composition of ground water
EXPLANATION
Cations Anions
Sodium pluspotassium
Magnesium
Calcium
'^
::mp 1
s >
$1//j
Chloride plusfluoride
Sulfate
plus carbonate
1. Quaternary alluvial aquifer2. Glacial deposits aquifer3. Columbia River Basalt aquifer
40
30
CO
5 <OC
10
Silica
\
20 I
40 I
20 40 60 KILOMETERS
60 MILES I
Figure 7.1. Chemical characteristics of water in major aquifers, Panhandle basin, Idaho.
15
7.0 PANHANDLE BASIN (Continued)
7.2 Quality of Water in Glacial Deposits Aquifer
Aquifer Particularly Susceptible to Contamination from Surface Sources
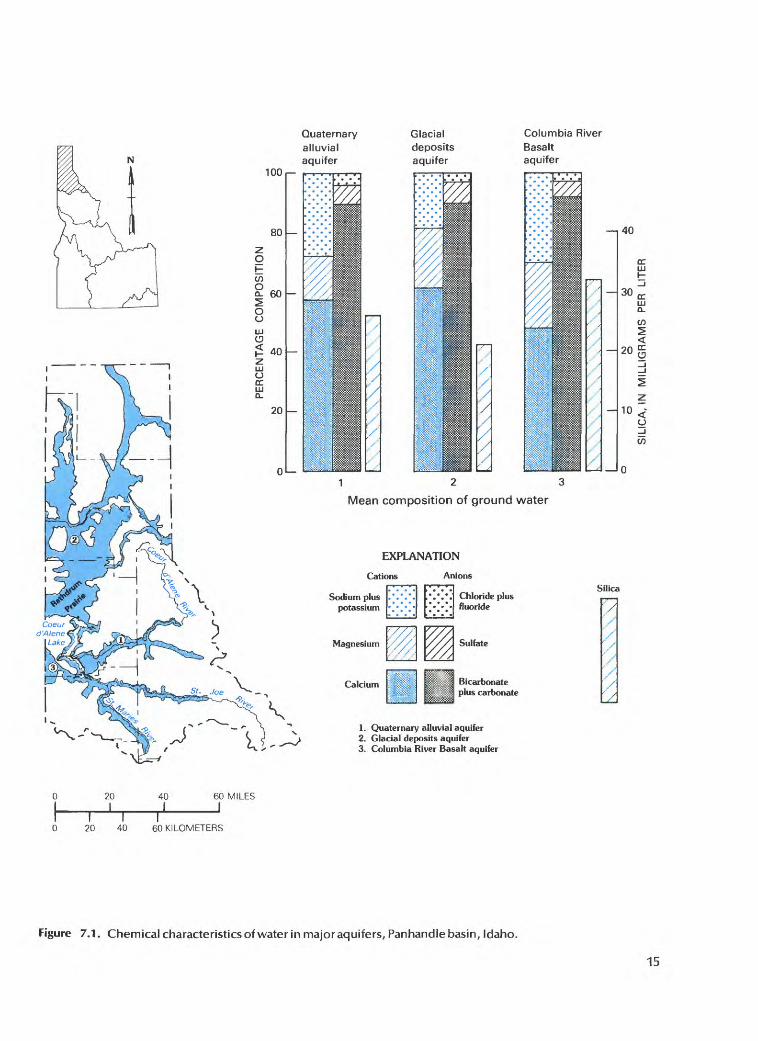
The glacial aquifer is composed, in large part, of coarse-grained, unconsolidated de posits and is the only aquifer in the Panhandle basin where data are sufficient to de scribe the water quality in some detail. The part of the aquifer in the Rathdrum Prairie area is designated as a "Sole or Principal Source Aquifer" and, because it is a drink ing-water supply, is monitored by the EPA.
The glacial deposits aquifer, underlying much of the northern part of the Panhandle basin, is north of the city of Coeur d'Alene and includes the important Rathdrum Prairie area. The aquifer is mainly glaciofluvial in origin and is composed, in large part, of coarse-grained, uncon solidated deposits that extend from near land surface to several hundred feet below. Vertical permeability of these deposits is high, and no known intervening areally exten sive confining beds are present. Therefore, water in the aquifer is particularly susceptible to contamination from surface pollutant sources.
The glacial deposits aquifer is the only aquifer with sufficient data to describe the water quality in some detail. Analyses totaling 127 were available, most of which de scribed water in the southern part of the aquifer. Only 10 analyses were available for Boundary County. Most of the analyses for Boundary County showed a high concentra tion of dissolved solids relative to concentrations in other parts of the aquifer (see fig. 7.2). The graph in figure 7.2 shows that seven of the nine highest concentrations (great er than 240 mg/L) of dissolved solids were from the part
of the aquifer located in Boundary County. The analysis having the highest dissolved solids also had a nitrogen concentration of 25 mg/L. The remaining analyses showed nitrogen concentrations of no more than 2.9 mg/L.
Within the glacial deposits aquifer, the Rathdrum Prairie area is of primary concern. Here, the aquifer, loc ally called Rathdrum Prairie aquifer, has been designated by the EPA as a "Sole or Principal Source Aquifer." Within this designated area, EPA monitors all federally assisted projects to assure that the projects will not de grade water quality or jeopardize the source as a drinking- water supply.
The quality of water in the glacial deposits aquifer within the Rathdrum Prairie area, as determined from WATSTORE data, is good and suitable for domestic use. Dissolved-solids concentrations, determined as the sum of constituents in the water, did not exceed 376 mg/L. Total and fecal coliform bacteria are seldom detected in the water. Concentrations of dissolved iron sometimes ex ceeded the secondary drinking-water standard of 300 |xg/L (Graham and Campbell, 1981).
16
STATISTICAL SUMMARY
Glacial deposits aquifer
Const i tuent
Number
of Mini- Maxi-
analyses mum mum Med i an Mean
Standard
deviation
Specific conductance
(timho/cm) - ---
pH (units) --------
Temperature (°C) --
127
108
122
Dissolved solids (mg/L)- 119
Nitrogen, N02 + NO
(mg/L as N) 84
Sulfate (mg/L as SC^) 127
Hardness
(mg/L as CaCO ) 58
32
6.0
3.0
28
Silica (mg/L as SiC> 2 ) 51
Col iform, fecal
(colony/100 mL) 58
Coli form, total
(colony/100 mL) 51
Iron, dissolved
(ng/L as Fe) 51
9.7
1050
8.3
20
773
25
100
610
19
5300
221
7.4
149
104
19
231
9.3
149
120
21
349
20
15
10
5
200 400 600
CONCENTRATION OF DISSOLVED SOLIDS, IN MILLIGRAMS PER LITER
149
2.6
96
2.7
13
104
8.9
894
'< Actual value is known to be less than the value shown.
INI i 1 1
Distribution of dissolved- solidsy§ concentration in water
-
111 Boundary County
Bonner and Kootenai Counties
-
rn
-,
Tl "innn1
s Recommended C safe-drinking
^/ water standard (EPA, 1977 b)
Ri i
20 40 60 MILES
I_______I_______IT I I
0 20 40 60 KILOMETERS
800
Figure 7.2. Statistical summary of key indicators for water quality in the glacial deposits aquifer, Panhandle basin, Idaho.
17
7.0 PANHANDLE BASIN (Continued)
7.3 Dissolved-Solids Concentrations in Rathdrum Prairie Aquifer
Data Collected from Wells Sampled BetweenJuly 1975 and April 1979 Used to Define
Dissolved-Solids Distribution
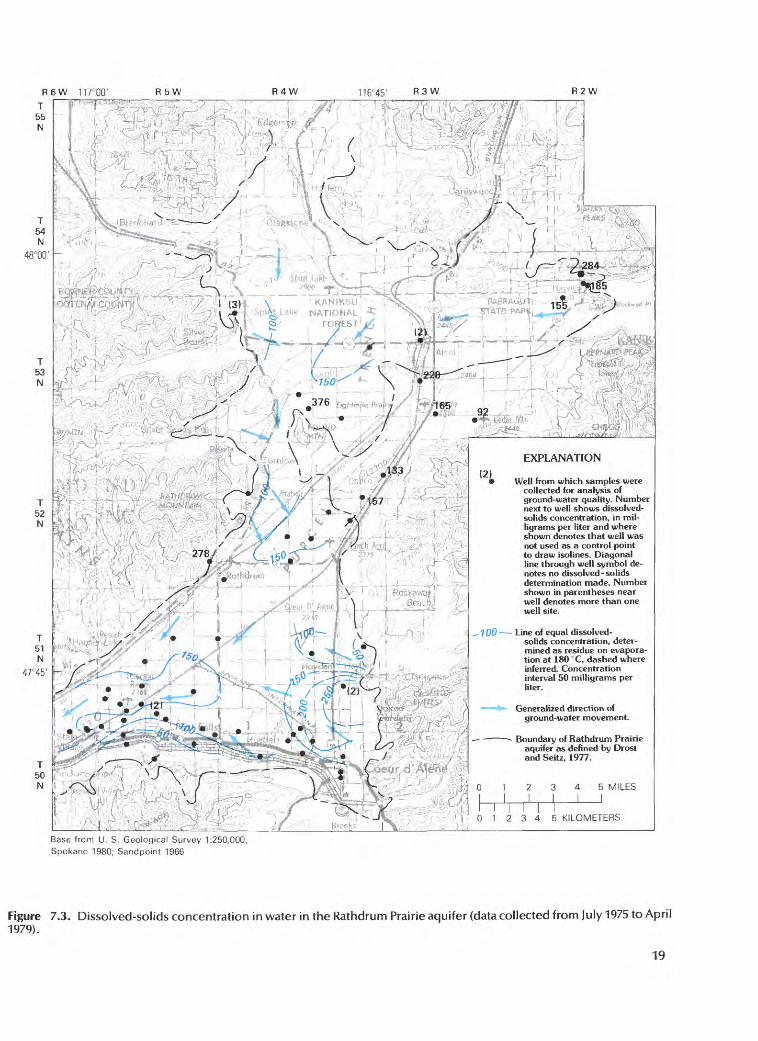
The distribution of dissolved solids shows that water of relatively low mineral content (dissolved-solids concentration less than 100 mg/L) is introduced into the aquifer at major places of recharge. As the water moves toward the central axis of the aquifer, dissolved-solids concentrations increase to levels generally near 150 mg/L. Relatively high concentrations occur near suburban areas.
The distribution of dissolved-solids concentrations, mea sured as residue on evaporation at 180° C, in water in the Rathdrum Prairie aquifer is shown in figure 7.3. Data for fig ure 7.3 were retrieved from STORET for 58 wells completed in the aquifer. Six of the wells are outside the boundary of the aquifer, as defined by Drost and Seitz (1977), and data from them are not used to define the equal-concentration lines in figure 7.3. Well sites for which no dissolved-solids data were available, but where other water-quality data are available in STORET, also are plotted in figure 7.3. The number of samples periodically collected and analyzed (July 1975-April 1979) for each site ranged from 1 to 22. For sites having two or more dissolved-solids analyses, an average value was calculated to define the distribution.
With the exception of a few locally high concentration levels, the distribution of dissolved solids shows a character istic pattern. Water of relatively low mineral content is in troduced to the aquifer at major places of recharge, which in clude the Spokane River and Coeur d'Alene, Hayden, Spirit, and Twin Lakes. (The data do not show this same occurrence
at Pend Oreille Lake; local conditions near the wells may be the reason.) As the water moves toward the central axis of the aquifer, dissolved-solids concentrations increase to levels generally near 150 mg/L. Concentrations in excess of 150 mg/L occur near the suburban areas of Post Falls and Dalton Gardens, where land-surf ace-derived wastes proba bly contribute to the excess. The mound of concentrations over 200 mg/L between Coeur d'Alene and Dalton Gardens is derived from only two data points, and so its areal extent is inferred.
Data from about 40 additional sites in the Rathdrum Prairie area having dissolved-solids determinations are avail able in WATSTORE. These data are included in the statisti cal summary shown on figure 7.2. They were not included in drawing the dissolved-solids-concentration lines shown on figure 7.3 because the determinations are reported as cal culated sum of constituents, not as residue on evaporation at 180 °C, as reported in STORET. Thus, although similar, the dissolved-solids data stored in these two different storage systems are not entirely comparable.
18
R6W 117°00' R 5W R4W 116°45' R3W R2 W
T,,'( "l'fV ' r'-C^r r'
EXPLANATION
Well from which samples were collected for analysis of ground-water quality. Number next to well shows dissolved- solids concentration, in mil ligrams per liter and where shown denotes that well was not used as a control point to draw isolines. Diagonal line through well symbol de notes no dissolved - solids determination made. Number shown in parentheses near well denotes more than one well site.^ ,#^
7 00 Line of equal dissolved-solids concentration, deter mined as residue on evapora tion at 180 °C, dashed where inferred. Concentration interval 50 milligrams per liter.
Generalized direction of ground-water movement.
^..« ^^,Boundary of Rathdrum Prairie
aquifer as defined by Drost and Seitz, 1977.
Base from U. S. Geological Survey 1:250,000, Spokane 1980; Sandpoint 1966
Figure 7.3. Dissolved-solids concentration in water in the Rathdrum Prairie aquifer (data collected from July 1975 to April 1979).
19
7.0 PANHANDLE BASIN (Continued)
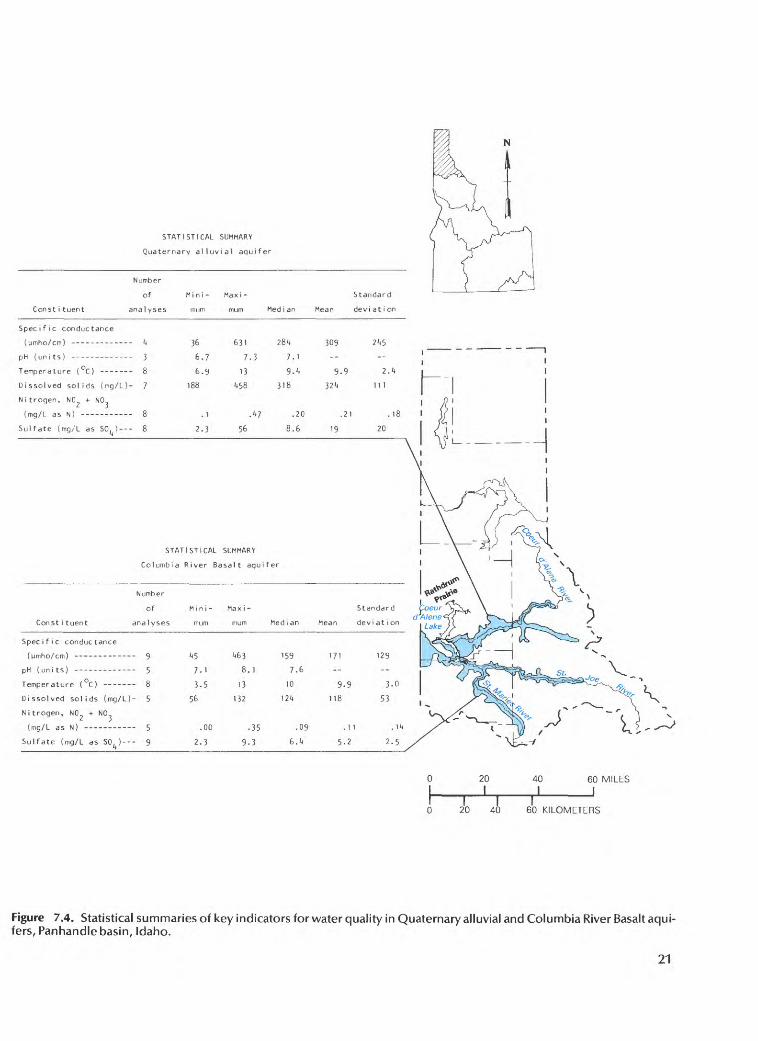
7.4 Quality of Water in Quaternary Alluvial and Columbia River Basalt Aquifers
Dissolved-Solids Concentrations in Water from theColumbia River Basalt Aquifer Are Much Lower
Than in Water from the Quaternary Alluvial Aquifer
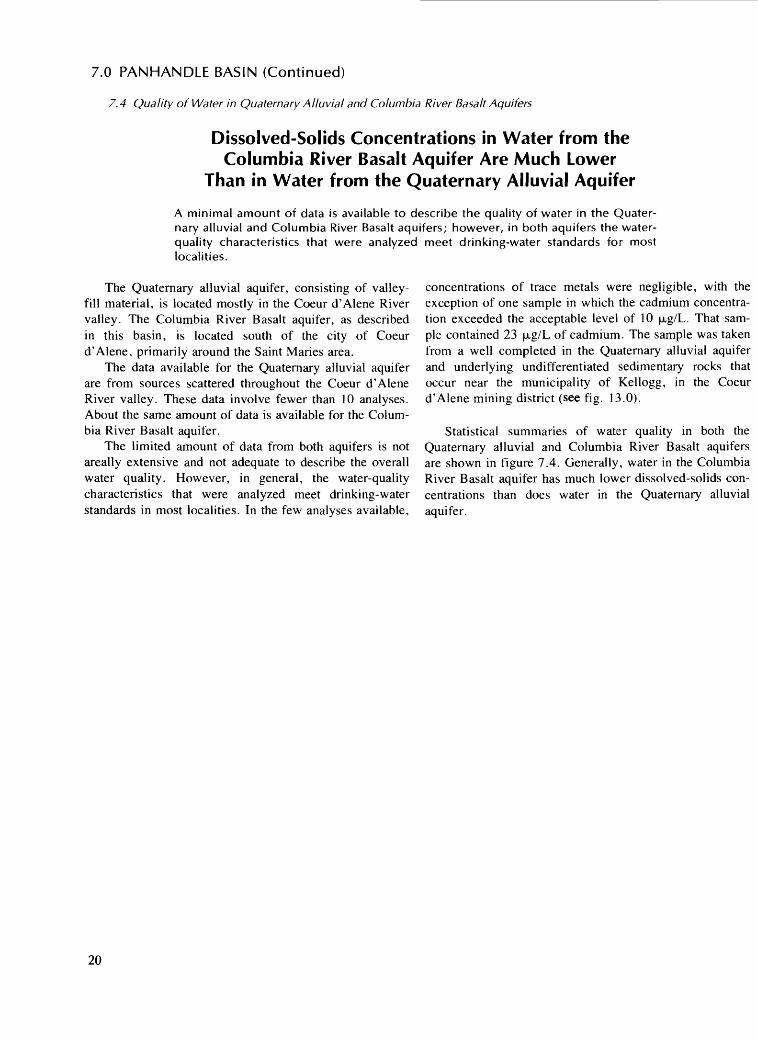
A minimal amount of data is available to describe the quality of water in the Quater nary alluvial and Columbia River Basalt aquifers; however, in both aquifers the water- quality characteristics that were analyzed meet drinking-water standards for most localities.
The Quaternary alluvial aquifer, consisting of valley- fill material, is located mostly in the Coeur d'Alene River valley. The Columbia River Basalt aquifer, as described in this basin, is located south of the city of Coeur d'Alene, primarily around the Saint Maries area.
The data available for the Quaternary alluvial aquifer are from sources scattered throughout the Coeur d'Alene River valley. These data involve fewer than 10 analyses. About the same amount of data is available for the Colum bia River Basalt aquifer.
The limited amount of data from both aquifers is not areally extensive and not adequate to describe the overall water quality. However, in general, the water-quality characteristics that were analyzed meet drinking-water standards in most localities. In the few analyses available,
concentrations of trace metals were negligible, with the exception of one sample in which the cadmium concentra tion exceeded the acceptable level of 10 jJtg/L. That sam ple contained 23 jJtg/L of cadmium. The sample was taken from a well completed in the Quaternary alluvial aquifer and underlying undifferentiated sedimentary rocks that occur near the municipality of Kellogg, in the Coeur d'Alene mining district (see fig. 13.0).
Statistical summaries of water quality in both the Quaternary alluvial and Columbia River Basalt aquifers are shown in figure 7.4. Generally, water in the Columbia River Basalt aquifer has much lower dissolved-solids con centrations than does water in the Quaternary alluvial aquifer.
20
STATISTICAL SUMMARY (
Quaternary alluvial aquifer
Number
of Mini- Maxi- Standard
Constituent analyses mum mum Median Mean deviation
Specific conductance
pH (units) -- 3 6.7 7.3 7-1 -- -- |
Temperature ( °C ) ---- 8 6.9 13 9- 1* 9.9 2. 1* i
Dissolved solids (mg/L)- 7 188 i*58 318 32 1* 111
Ni trogen. NO + NO
Sulfate (mg/'L as SO^)--- 8 2.3 56 8.6 19 20
'A N§v 'pkll\ y^i VX^
f) /d
^STATISTICAL SUMMARY
Columbia River Basalt aquifer
Const i tuent
Specific conductance
Temperature ( C) ------
Dissolved solids (mg/L)
Ni trogen, NO + NO
Sulfate (mg/L as SO )--
Number
of
ana 1 yses
- 9 - 5
- 8
- 5
- 5
- 9
Mini
mum
, _
7.1
3-5
56
.00
2.3
Maxi -
mum
^63
8.1
13
132
.35
9-3
Median
159
7.6
10
m
.09
6.1*
Standard i
Mean deviation
171 129
9.9 3-0
118 53
5.2 2.5 /
3
3 20
20
1
40
40 60 MILES 1 1
160 KILOMETERS
Figure 7.4. Statistical summaries of key indicators for water quality in Quaternary alluvial and Columbia River Basalt aqui fers, Panhandle basin, Idaho.
21
8.0 CLEARWATER BASIN
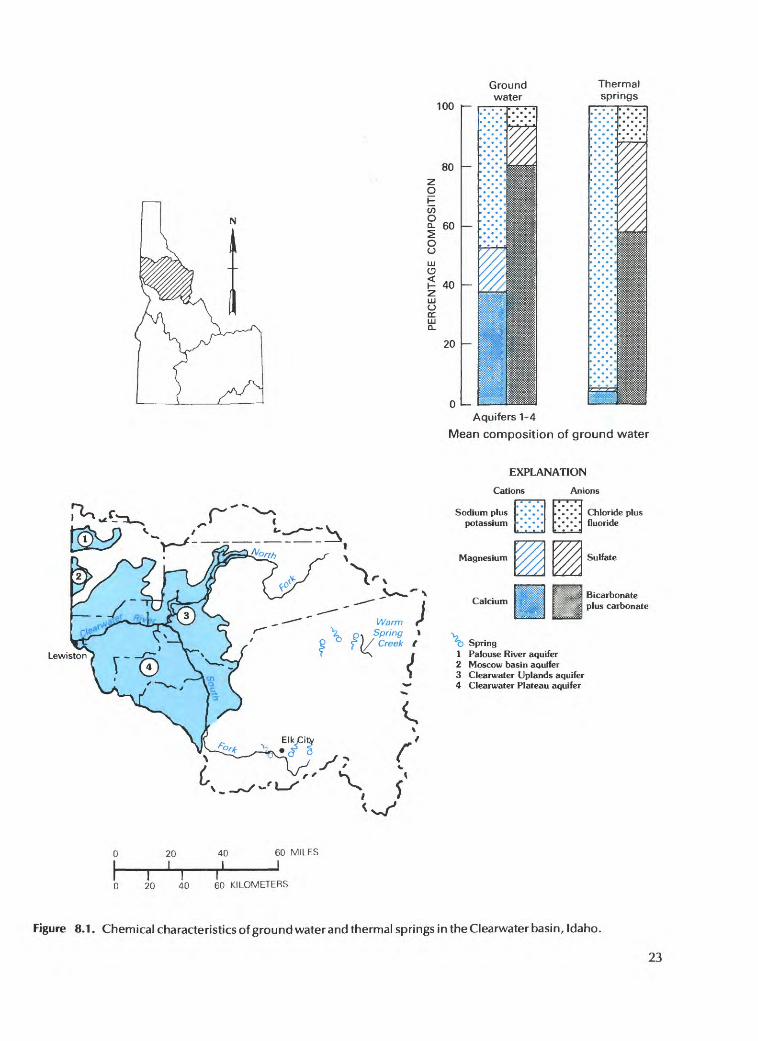
8.1 Chemical Characteristics of Water in Major Aquifers
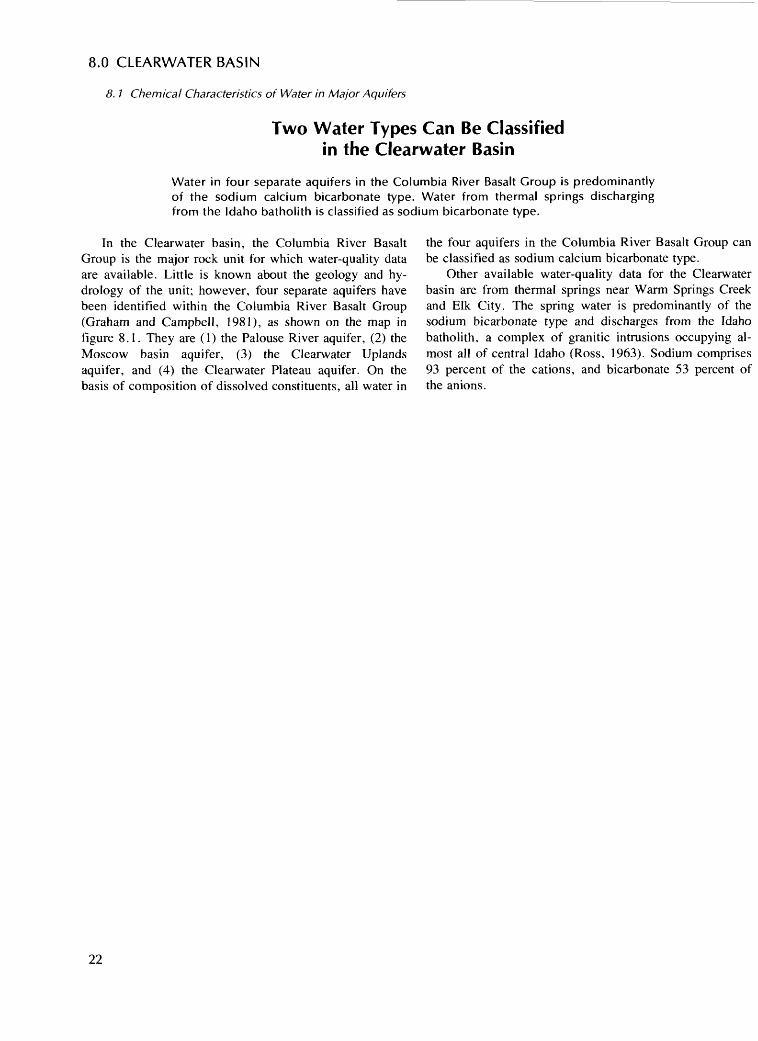
Two Water Types Can Be Classified in the Clearwater Basin
Water in four separate aquifers in the Columbia River Basalt Group is predominantly of the sodium calcium bicarbonate type. Water from thermal springs discharging from the Idaho batholith is classified as sodium bicarbonate type.
In the Clearwater basin, the Columbia River Basalt Group is the major rock unit for which water-quality data are available. Little is known about the geology and hy drology of the unit; however, four separate aquifers have been identified within the Columbia River Basalt Group (Graham and Campbell, 1981), as shown on the map in figure 8.1. They are (1) the Palouse River aquifer, (2) the Moscow basin aquifer, (3) the Clearwater Uplands aquifer, and (4) the Clearwater Plateau aquifer. On the basis of composition of dissolved constituents, all water in
the four aquifers in the Columbia River Basalt Group can be classified as sodium calcium bicarbonate type.
Other available water-quality data for the Clearwater basin are from thermal springs near Warm Springs Creek and Elk City. The spring water is predominantly of the sodium bicarbonate type and discharges from the Idaho batholith, a complex of granitic intrusions occupying al most all of central Idaho (Ross, 1963). Sodium comprises 93 percent of the cations, and bicarbonate 53 percent of the anions.
22
100 i
80
CO° 60
O o
Ground water
Thermal springs
40
20
0 L-
Aquifers 1-4
Mean composition of ground water
EXPLANATION
Cations Anions
\_
Sodium pluspotassium
Magnesium
Calcium
HIp&s
H^
«^jl
Chloride plusfluoride
Sulfate
Bicarbonate plus carbonate
^b Spring1 Palouse River aquifer2 Moscow basin aquifer3 Clearwater Uplands aquifer4 Clearwater Plateau aquifer
20 I
40I
60 MILES
J
0 20 40 60 KILOMETERS
Figure 8.1. Chemical characteristics of ground water and thermal springs in the Clearwater basin, Idaho.
23
8.0 CLEARWATER BASIN (Continued)
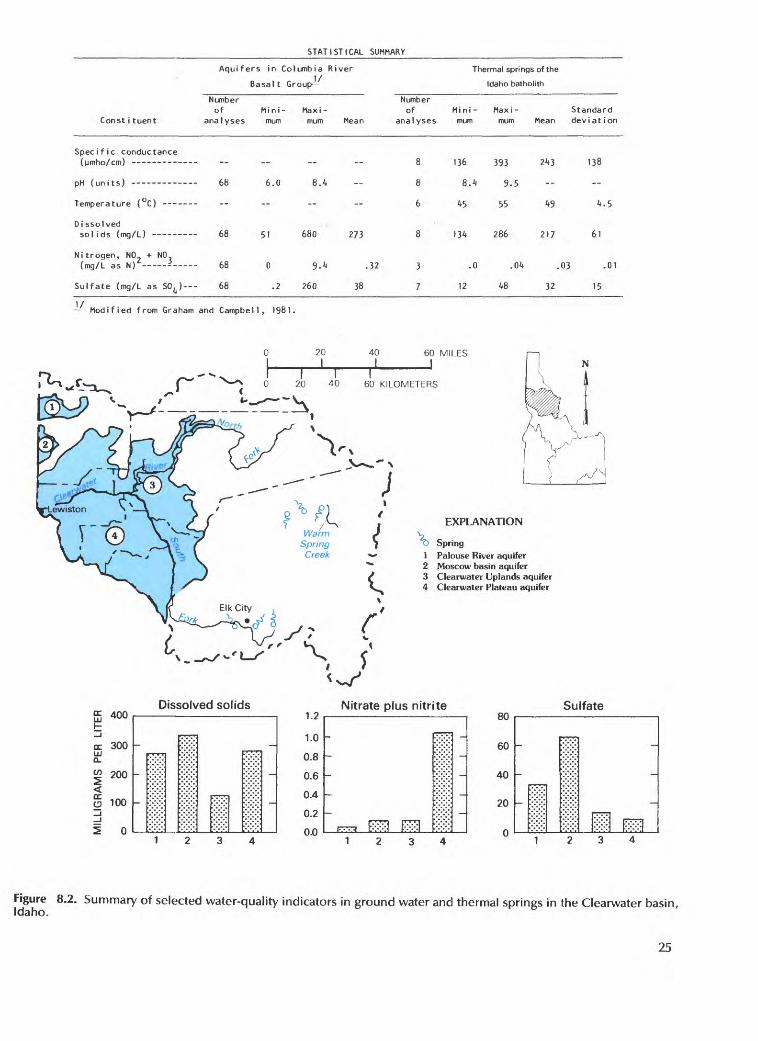
8.2 Quality of Water in Aquifers in Columbia River Basalt Group and Thermal Springs of the Idaho Batholith
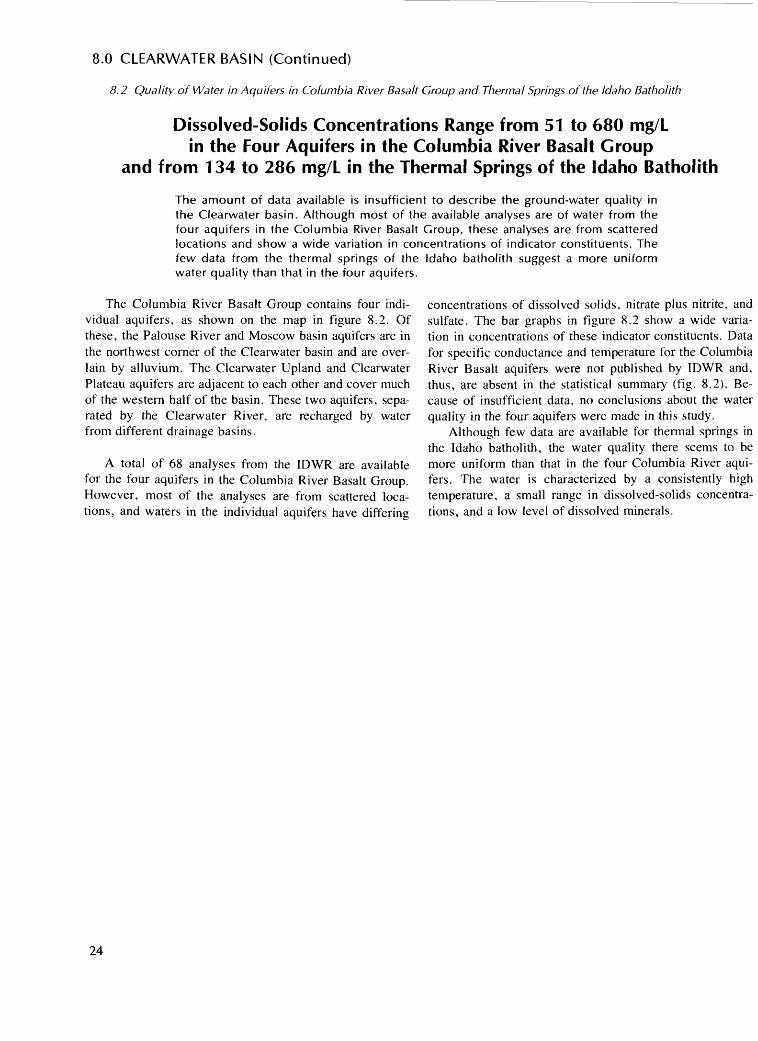
Dissolved-Solids Concentrations Range from 51 to 680 mg/Lin the Four Aquifers in the Columbia River Basalt Group
and from 134 to 286 mg/L in the Thermal Springs of the Idaho Batholith
The amount of data available is insufficient to describe the ground-water quality in the Clearwater basin. Although most of the available analyses are of water from the four aquifers in the Columbia River Basalt Croup, these analyses are from scattered locations and show a wide variation in concentrations of indicator constituents. The few data from the thermal springs of the Idaho batholith suggest a more uniform water quality than that in the four aquifers.
The Columbia River Basalt Group contains four indi vidual aquifers, as shown on the map in figure 8.2. Of these, the Palouse River and Moscow basin aquifers are in the northwest corner of the Clearwater basin and are over lain by alluvium. The Clearwater Upland and Clearwater Plateau aquifers are adjacent to each other and cover much of the western half of the basin. These two aquifers, sepa rated by the Clearwater River, are recharged by water from different drainage basins.
A total of 68 analyses from the IDWR are available for the four aquifers in the Columbia River Basalt Group. However, most of the analyses are from scattered loca tions, and waters in the individual aquifers have differing
concentrations of dissolved solids, nitrate plus nitrite, and sulfate. The bar graphs in figure 8.2 show a wide varia tion in concentrations of these indicator constituents. Data for specific conductance and temperature for the Columbia River Basalt aquifers were not published by IDWR and, thus, are absent in the statistical summary (fig. 8.2). Be cause of insufficient data, no conclusions about the water quality in the four aquifers were made in this study.
Although few data are available for thermal springs in the Idaho batholith, the water quality there seems to be more uniform than that in the four Columbia River aqui fers. The water is characterized by a consistently high temperature, a small range in dissolved-solids concentra tions, and a low level of dissolved minerals.
24
STATISTICAL SUMMARY
Aquifers in Columbia River Thermal springs of the
Basalt Group Idaho batholith
Number Numberof Mini- Maxi- of Mini- Maxi-
Constituent analyses mum mum Mean analyses mum mumStandard
Mean deviation
Specific conductance(pmho/cm) -
riLJ ( . tr. \ * c- ^
Q i 7/L 7O 7o 13b 393
(.ft f. n it 1. ft Q 1, o c
Temperature (°C) 6 45 55
D i ssol vedsol ids (mg/L)
Nitrogen, NO(mg/L as N) -
Sulfate (mg/L
68 51 680 273 8 134 286
+ NO,- - 68 0 9.4 .32 3 .0 .04
as SO^) 68 .2 260 38 7 12 48
243 138
49 4.5
217 61
.03 .01
32 15
Modified from Graham and Campbell, 1981.
f ..* ~ ^ ' ^
/} ^
y~&
0 20 40 60 MILES r\ \ \
_,-^^ 1 1 1|^ ^-^ 0 20 40 60 KILOMETERS
<** ( ^ 3
^£o~, [V~x / / f *.L^ f. EXPLANATION
V^^v/ Warm r \ Jk^s f Spring | o Spring
N
% :
vA i
) ^
A / ""^-^ / X^* V Creek +* I Palouse River aquifer2 Moscow basin aquifer3 Clearwater Uplands aquifer4 Clearwater Plateau aquifer
Elk City
Dissolved solids Nitrate plus nitrite SulfateCC ADD1-
OL 300Q.
^ 200
<S 100
^ 5 0
-
-
-
: :x
:?!
::::
.-.-. :: :-
-
-
-
1.2
1.0
0.8
0.6
0.4
0.2
nn
_ :
r^, ixxn m \:::::
_
on
60
40
20
n
-
-
-
-
-
-
M (xxil1234
Figure 8.2. Summary of selected water-quality indicators in ground water and thermal springs in the Clearwater basin, Idaho.
25
9.0 SALMON BASIN
9.1 Chemical Characteristics of Water from Major Aquifers and Springs
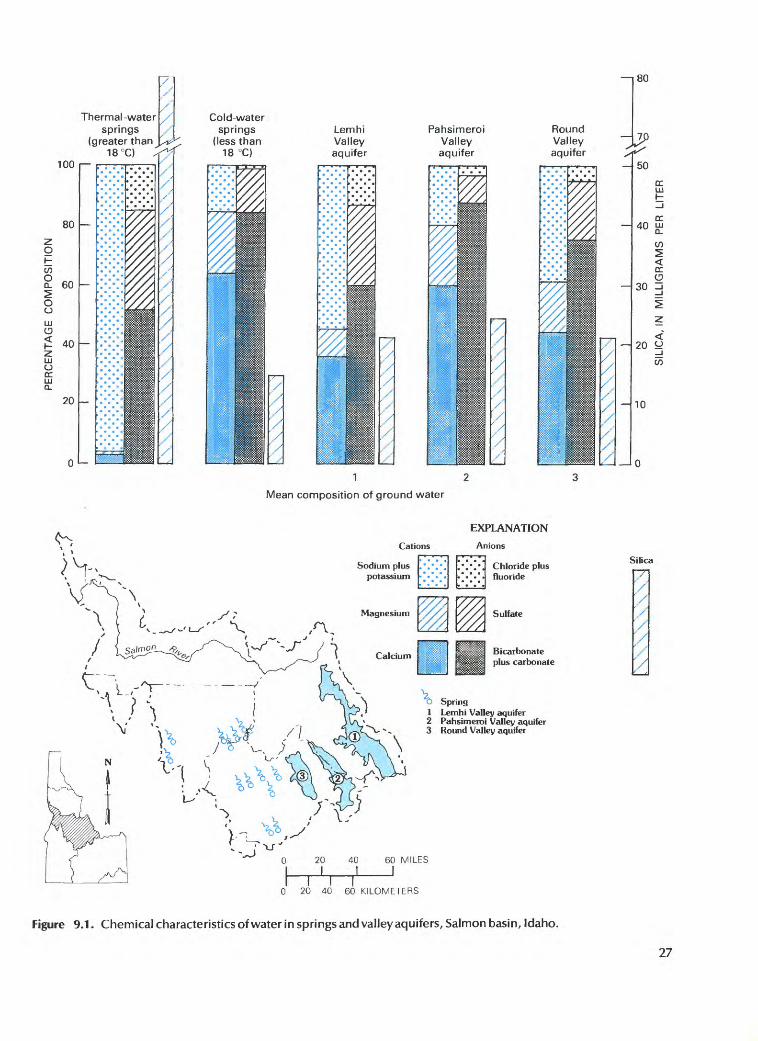
Three Different Types of Ground Water Classified in the Salmon Basin
Waters of different chemical composition occur in three different aquifers in the Salmon basin and are classified as sodium bicarbonate, calcium bicarbonate, and sodium cal cium bicarbonate types. Also, thermal-water springs contain sodium bicarbonate type water, and cold-water springs contain calcium bicarbonate type.
Most of the water-quality data available for the Salmon basin are from three aquifers in the eastern part of the basin. These aquifers are composed primarily of unconsolidated valley-fill deposits and are identified in this report as (1) Lemhi, (2) Pahsimeroi, and (3) Round Valley aquifers (see map, fig. 9.1).
The major source of recharge for all three aquifers is per colation of rain and snowmelt. Runoff from the surrounding mountains also contributes to recharge.
Each of the three aquifers contains water of a different chemical composition, which allows for classification of three different water types in the basin. In the Lemhi Valley aquifer, the water is predominantly sodium bicarbonate type; in the Pahsimeroi Valley aquifer, it is mostly calcium bicar bonate type; and, in the Round Valley aquifer, it is a sodium calcium bicarbonate type.
Many springs are located throughout the central part of the Salmon basin. They can be grouped into two
categories thermal-water and cold-water springs. The first category includes springs that have temperatures exceeding 18 °C. The water from these springs is similar in quality to the thermal-spring water from the Idaho batholith (sec. 8.2 of this report) and is classified as sodium bicarbonate. The silica concentration ranges from 18 to 95 mg/L, and the temperature of the water ranges from 28° to 78 °C.
The second category (cold-water springs) includes springs that have temperatures of 18 °C or less. Water from these is classified as calcium bicarbonate. Silica concentra tion of water in the cold-water springs averages less than one- fifth that of the thermal springs.
Areal distribution of the cold-water springs is similar to that of the thermal springs, and no geographic division can be made between the two categories. The chemical composi tions of water from both types of springs are shown in the bar graphs in figure 9.1.
26
Therm a I-water springs
100
80
oK CO
O u
LU Ucc.LU CL
60
40
20
Cold-watersprings
(less than18 °C)
i 80
Lemhi Valley aquifer
Pahsimeroi Valley aquifer
Round Valley aquifer
1
Mean composition of ground water
<s,1 1
^-v\ >^>
>/1
V>"\
t ^"^V v_^vX»-'L^^ ^
VNs-!2oa^.x^X\
Cations
EXPLANATION
Anions
A,
Sodium plus potassium
Magnesium
^
^ - , L_,-
Chloride plus fluoride
Sulfate
Bicarbonate plus carbonate
u Spring1 Lemhi Valley aquifer2 Pahsimeroi Valley aquifer3 Round Valley aquifer
20 40 60 MILES I I I
i i i r0 20 40 60 KILOMETERS
Silica
z /
'
Figure 9.1 . Chemical characteristics of water in springs and valley aquifers, Salmon basin, Idaho.
27
9.0 SALMON BASIN (Continued)
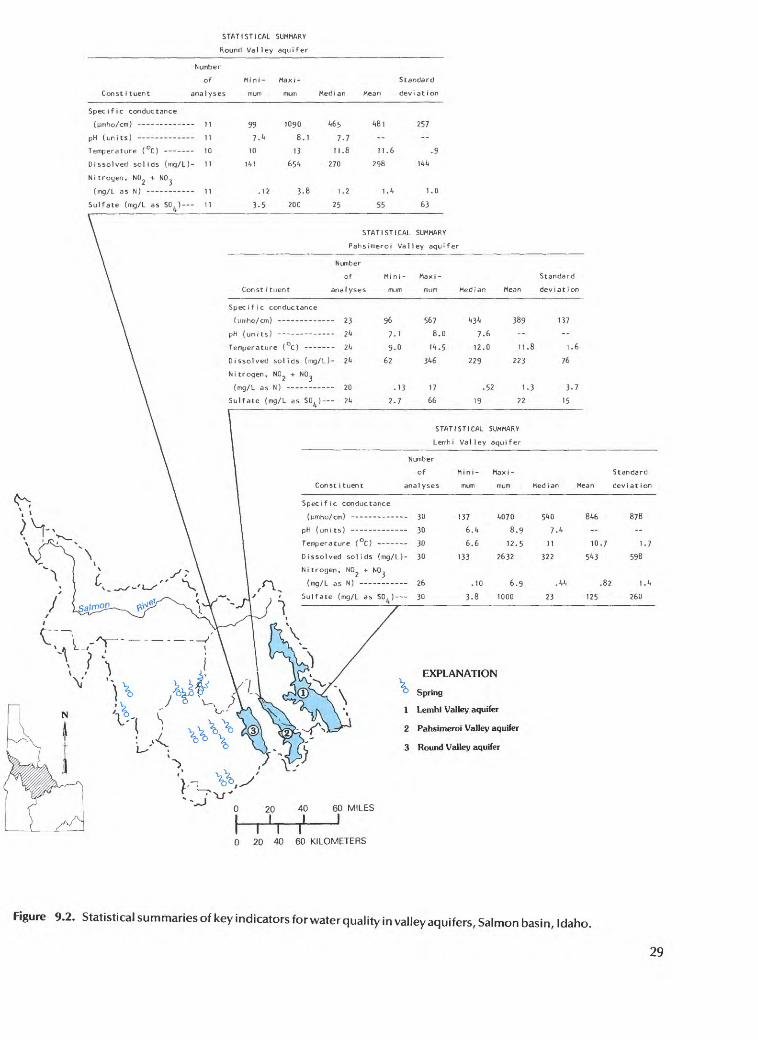
9.2 Quality of Water in Valley Aquifers
Dissolved-Solids Concentrations in Water in Three Valley Aquifers Range from 62 to 2,632 mg/L
The highest dissolved-solids concentrations occur in water in the Lemhi Valley aquifer, and the lowest occur in water in the Pahsimeroi Valley aquifer. The amount of data available to describe the quality of water in the valley aquifers in the basin is minimal.
Within the Salmon basin, water is derived mostly from aquifers in the valley-fill deposits within the Lemhi, Pahsimeroi, and Round Valley areas. Nearly 2,900 people there rely on ground water for their domestic water supply (Graham and Campbell, 1981). The quality of water is generally suitable for domestic use. In some local areas within Lemhi Valley, the dissolved-solids concentrations of ground water exceeded the EPA's 500-mg/L limit rec ommended for safe drinking-water standards. Water-qual ity conditions in these areas, however, may not be repre sentative of the entire aquifer (Whitehead and Parliman, 1979).
A total of 65 analyses is available in WATSTORE for the three valley aquifers. Most of these analyses are from scattered locations, and the waters in the individual aqui fers contain a wide range in concentrations of dissolved solids, sulfate, nitrate, and other constituents. Data from these analyses are not areally extensive; thus, the amount of data available to describe water quality in the valley aquifers is considered to be minimal.
Statistical summaries of water in the three valley aquifers, based on a minimal amount of data, are shown in figure 9.2
28
STATISTICAL SUMMARY
Round Valley aquifer
Const i tuent
Number
of Mini- Maxi-
analyses mum mum
Standard
Median Mean deviation
Specific conductance
(ymho/cm) 11
pH (units) 11
Temperature (°C) 10
Dissolved solids (mg/L)- 11
Nitrogen, NO + NO
(mg/L as N) 11
Sulfate (mg/L as SO.) 11
99
1 .k
10
ll*1
1090
8.1
13
65**
^65
7-7
11.8
270
257
11.6
298
STATISTICAL SUMMARY
Pahsimeroi Valley aquifer
Standard
Mean deviation
STATISTICAL SUMMARY
Lemhi Valley aquifer
Number
of Mini- Maxi-
analyses mum mum
Standard
deviation
137 WO 5^0
6.1* 8.9 7.1*
6.6 12.5 II
133 2632 322
EXPLANATION
Spring
1 Lemhi Valley aquifer
2 Pahsimeroi Valley aquifer
3 Round Valley aquifer
I I I0 20 40 60 KILOMETERS
Figure 9.2. Statistical summaries of key indicators for water quality in valley aquifers, Salmon basin, Idaho.
29
10.0 SOUTHWEST IDAHO BASIN
10. / Chemical Characteristics of Water in Major Aquifers
Ground-Water-Quality Analyses Available for 16Geologic Units. Most of the Analyses Are from
Five Major Units
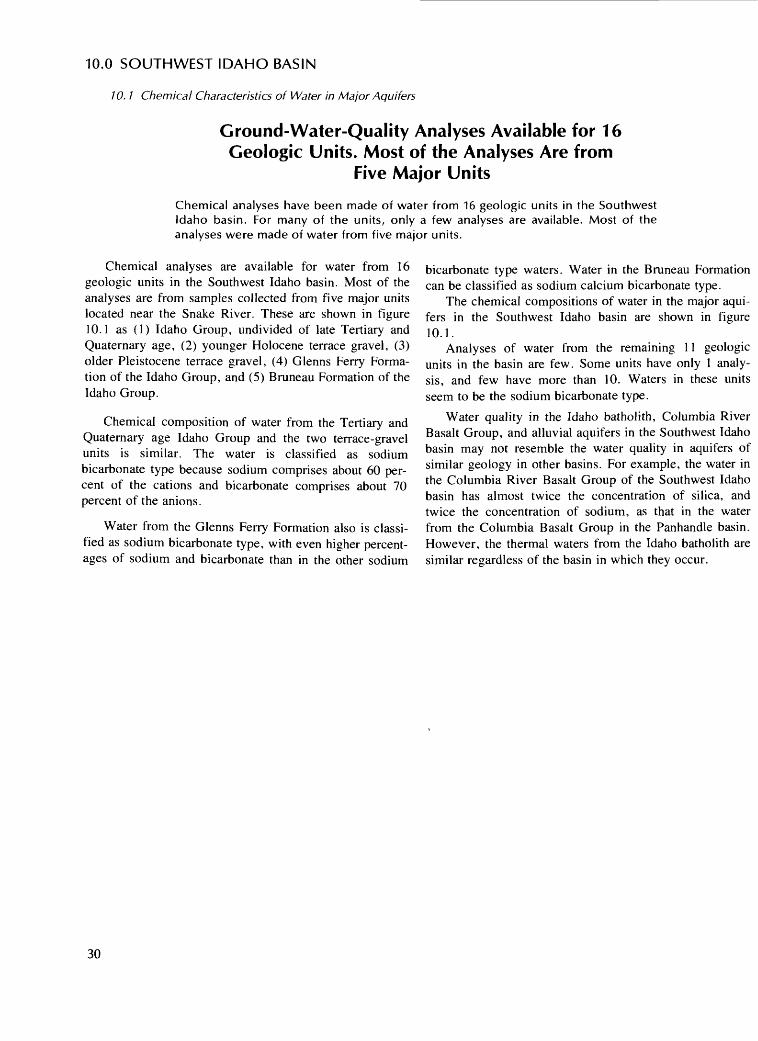
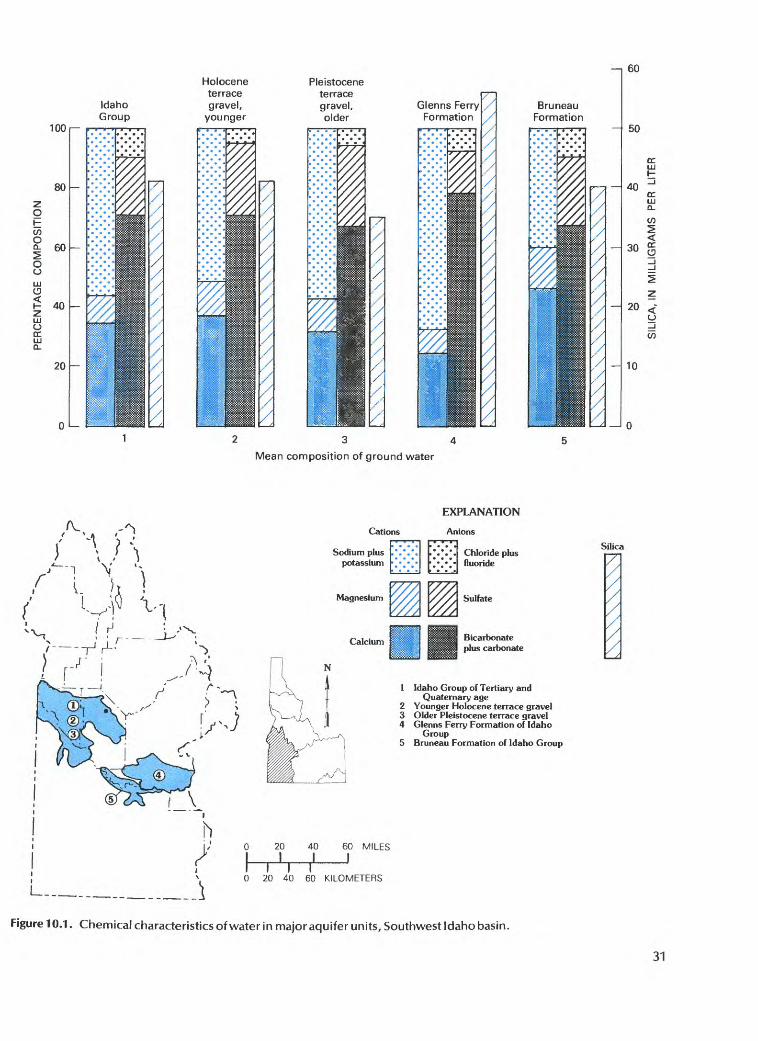
Chemical analyses have been made of water from 16 geologic units in the Southwest Idaho basin. For many of the units, only a few analyses are available. Most of the analyses were made of water from five major units.
Chemical analyses are available for water from 16 geologic units in the Southwest Idaho basin. Most of the analyses are from samples collected from five major units located near the Snake River. These are shown in figure 10.1 as CO Idaho Group, undivided of late Tertiary and Quaternary age, (2) younger Holocene terrace gravel, (3) older Pleistocene terrace gravel, (4) Glenns Ferry Forma tion of the Idaho Group, and (5) Bruneau Formation of the Idaho Group.
Chemical composition of water from the Tertiary and Quaternary age Idaho Group and the two terrace-gravel units is similar. The water is classified as sodium bicarbonate type because sodium comprises about 60 per cent of the cations and bicarbonate comprises about 70 percent of the anions.
Water from the Glenns Ferry Formation also is classi fied as sodium bicarbonate type, with even higher percent ages of sodium and bicarbonate than in the other sodium
bicarbonate type waters. Water in the Bruneau Formation can be classified as sodium calcium bicarbonate type.
The chemical compositions of water in the major aqui fers in the Southwest Idaho basin are shown in figure 10.1.
Analyses of water from the remaining 11 geologic units in the basin are few. Some units have only 1 analy sis, and few have more than 10. Waters in these units seem to be the sodium bicarbonate type.
Water quality in the Idaho batholith, Columbia River Basalt Group, and alluvial aquifers in the Southwest Idaho basin may not resemble the water quality in aquifers of similar geology in other basins. For example, the water in the Columbia River Basalt Group of the Southwest Idaho basin has almost twice the concentration of silica, and twice the concentration of sodium, as that in the water from the Columbia Basalt Group in the Panhandle basin. However, the thermal waters from the Idaho batholith are similar regardless of the basin in which they occur.
30
ocjLLJ d <
cj cc.
100
80
60
40
20
Idaho Group
Holocene terrace gravel,
younger
Pleistoceneterracegravel,older
Glenns Ferry Formation
234
Mean composition of ground water
Bruneau Formation
i 60
50
40
20
10
C/)
Cations
EXPLANATION
Anions
Sodium plus potassium
Magnesium
Calcium
Chloride plus fluoride
Sulfate
Bicarbonate plus carbonate
1 Idaho Group of Tertiary and Quaternary age
2 Younger Holocene terrace gravel3 Older Pleistocene terrace gravel4 Glenns Ferry Formation of Idaho
Group5 Bruneau Formation of Idaho Group
40 60 MILES I I
n i i0 20 40 60 KILOMETERS
Silica
v\
Figure 10.1. Chemical characteristics of water in major aquifer units, Southwest Idaho basin.
31
10.0 SOUTHWEST IDAHO BASIN (Continued)
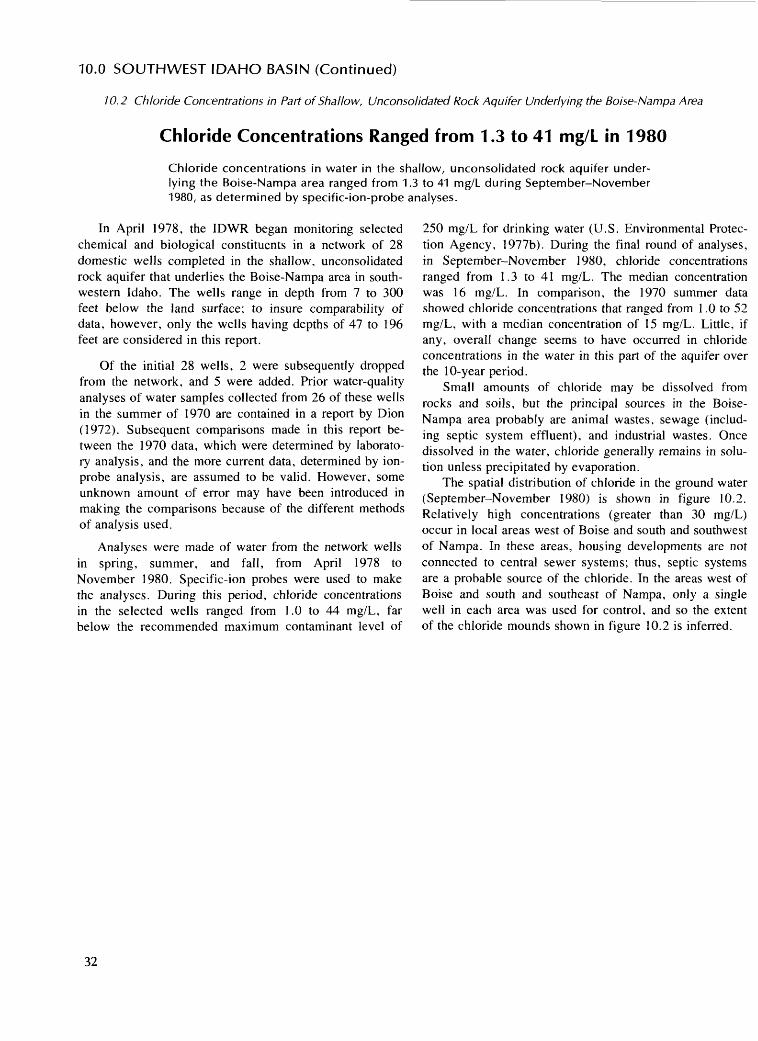
70.2 Chloride Concentrations in Part of Shallow, Unconsolidated Rock Aquifer Underlying the Boise-Nampa Area
Chloride Concentrations Ranged from 1.3 to 41 mg/L in 1980
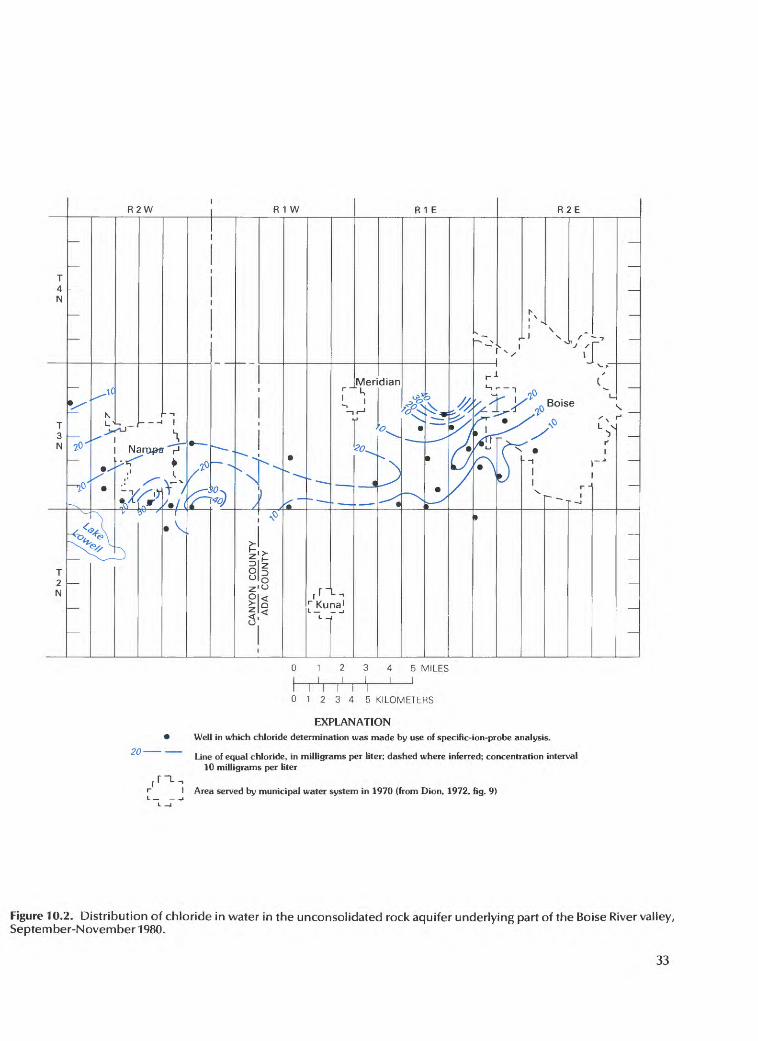
Chloride concentrations in water in the shallow, Unconsolidated rock aquifer under lying the Boise-Nampa area ranged from 1.3 to 41 mg/L during September-November 1980, as determined by specific-ion-probe analyses.
In April 1978, the IDWR began monitoring selected chemical and biological constituents in a network of 28 domestic wells completed in the shallow, Unconsolidated rock aquifer that underlies the Boise-Nampa area in south western Idaho. The wells range in depth from 7 to 300 feet below the land surface; to insure comparability of data, however, only the wells having depths of 47 to 196 feet are considered in this report.
Of the initial 28 wells, 2 were subsequently dropped from the network, and 5 were added. Prior water-quality analyses of water samples collected from 26 of these wells in the summer of 1970 are contained in a report by Dion (1972). Subsequent comparisons made in this report be tween the 1970 data, which were determined by laborato ry analysis, and the more current data, determined by ion- probe analysis, are assumed to be valid. However, some unknown amount of error may have been introduced in making the comparisons because of the different methods of analysis used.
Analyses were made of water from the network wells in spring, summer, and fall, from April 1978 to November 1980. Specific-ion probes were used to make the analyses. During this period, chloride concentrations in the selected wells ranged from 1.0 to 44 mg/L, far below the recommended maximum contaminant level of
250 mg/L for drinking water (U.S. Environmental Protec tion Agency, 1977b). During the final round of analyses, in September-November 1980, chloride concentrations ranged from 1.3 to 41 mg/L. The median concentration was 16 mg/L. In comparison, the 1970 summer data showed chloride concentrations that ranged from 1.0 to 52 mg/L, with a median concentration of 15 mg/L. Little, if any, overall change seems to have occurred in chloride concentrations in the water in this part of the aquifer over the 10-year period.
Small amounts of chloride may be dissolved from rocks and soils, but the principal sources in the Boise- Nampa area probably are animal wastes, sewage (includ ing septic system effluent), and industrial wastes. Once dissolved in the water, chloride generally remains in solu tion unless precipitated by evaporation.
The spatial distribution of chloride in the ground water (September-November 1980) is shown in figure 10.2. Relatively high concentrations (greater than 30 mg/L) occur in local areas west of Boise and south and southwest of Nampa. In these areas, housing developments are not connected to central sewer systems; thus, septic systems are a probable source of the chloride. In the areas west of Boise and south and southeast of Nampa, only a single well in each area was used for control, and so the extent of the chloride mounds shown in figure 10.2 is inferred.
32
rn.
1 I I012345 KILOMETERS
EXPLANATION
Well in which chloride determination was made by use of specific-ion-probe analysis.
Line of equal chloride, in milligrams per liter; dashed where inferred; concentration interval 10 milligrams per liter
I Area served by municipal water system in 1970 (from Dion, 1972. fig. 9)
Figure 10.2. Distribution of chloride in water in the unconsolidated rock aquifer underlying part of the Boise River valley, September-November 1980.
33
10.0 SOUTHWEST IDAHO BASIN (Continued)
/ 0.3 Nitrate Concentrations in Part of Shallow, Unconsolidated Rock Aquifer Underlying the Boise-Nampa Area
Nitrate Concentrations Ranged from 0.4 to 10.5 mg/L in 1980
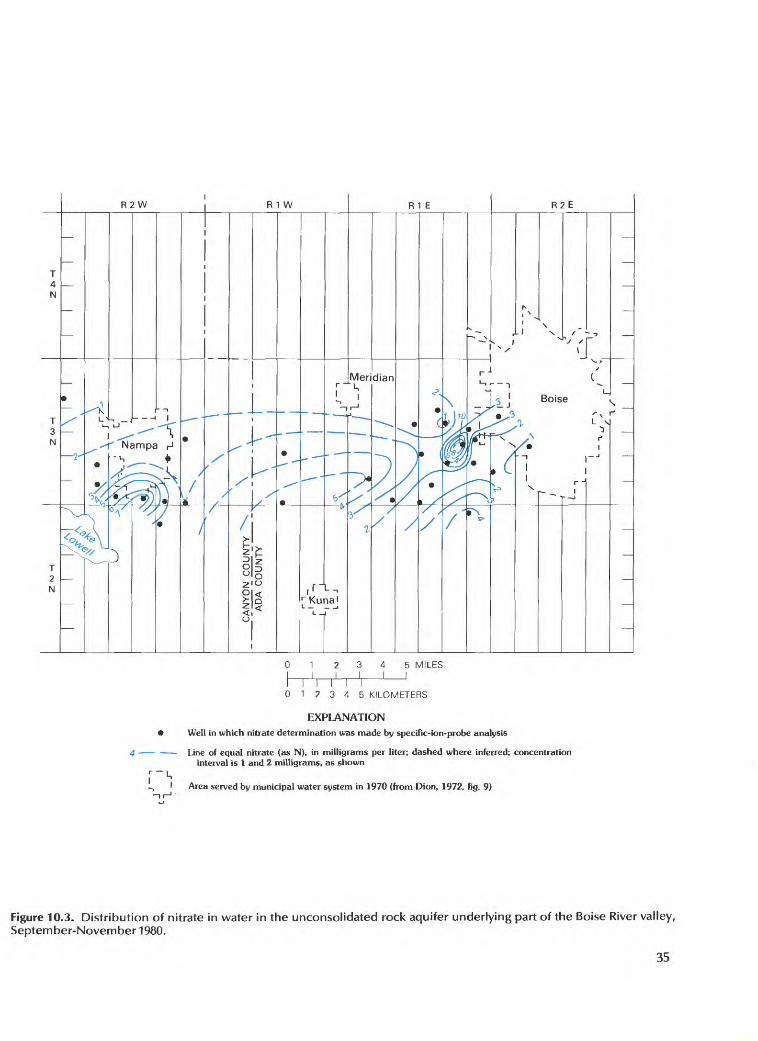
Nitrate concentrations in water in the shallow, Unconsolidated rock aquifer underlying the Boise-Nampa area ranged from 0.4 to 10.5 mg/L during September-November 1980 as determined by specific-ion-probe analyses.
For water in the same network of wells and under the same sampling conditions described in section 10.2 of this report, nitrate (as N) concentrations ranged from 0.2 to 14 mg/L during the period April 1978 to November 1980. Dur ing the final round of analyses made in these wells in Sep tember-November 1980, nitrate concentrations ranged from 0.4 to 10.5 mg/L. The median concentration was 2.6 mg/L. In comparison, data collected in the summer of 1970 show nitrate concentrations ranging from 0.2 to 13 mg/L, with a median concentration of 3.0 mg/L (Dion, 1972). Little, if any, overall change seems to have occurred in nitrate con centrations in this part of the aquifer over the 10-year period. However, changes have occurred locally. Nitrate concentra tions in the water have increased in some wells, whereas, in others, they have decreased. In only one well, from which periodic samples were taken during 1978-80, did the con centrations consistently remain slightly under or above the maximum contaminant level of 10 mg/L for public water supply (U.S. Environmental Protection Agency, 1977a).
Some small amount of nitrate may be derived from soils and aquifer rocks; however, principal sources in the
Boise-Nampa area include barnyard and feedlot wastes, closely spaced septic systems, and commercial fertilizers. Other sources may include buried garbage dumps and in dustrial wastes.
The spatial distribution of nitrate (as N) in the ground water (September-November 1980) is shown in figure 10.3. Historic (prior to land-use development) baseline levels of nitrate in the Boise-Nampa area have not been determined. Whitehead and Parliman (1979, p. 10) showed that, in 169 analyses of water samples from un- consolidated rock aquifers in Idaho, nitrate (as N) concen trations ranged from 0 to 19 mg/L and had a mean value of 2.20 mg/L, with a standard deviation of 3.3. Nitrate concentrations exceed this mean in some parts of the Boise-Nampa area (fig. 10.3), especially south of Nampa, and are cause for concern. In the high-nitrate area south west of Boise, only one well was used for control, so the extent of the nitrate mound shown in the figure is inferred.
34
i i r012345 KILOMETERS
EXPLANATION Well in which nitrate determination was made by specific-ion-probe analysis
4 Line of equal nitrate (as N), in milligrams per liter; dashed where inferred; concentration interval is I and 2 milligrams, as shown
^ I Area served by municipal water system in 1970 (from Dion, 1972, fig. 9)
Figure 10.3. Distribution of nitrate in water in the unconsolidated rock aquifer underlying part of the Boise River valley, September-November 1980.
35
10.0 SOUTHWEST IDAHO BASIN (Continued)
7 0.4 Long- Term Changes in Chloride and Nitrate Concentrations in Part of Shallow, Unconsolidated Rock Aquifer Underlying the Boise-NampaArea
Changes in Chloride and Nitrate Concentrations Not Exceedingly Great Over 10-Year Period (1970-80)
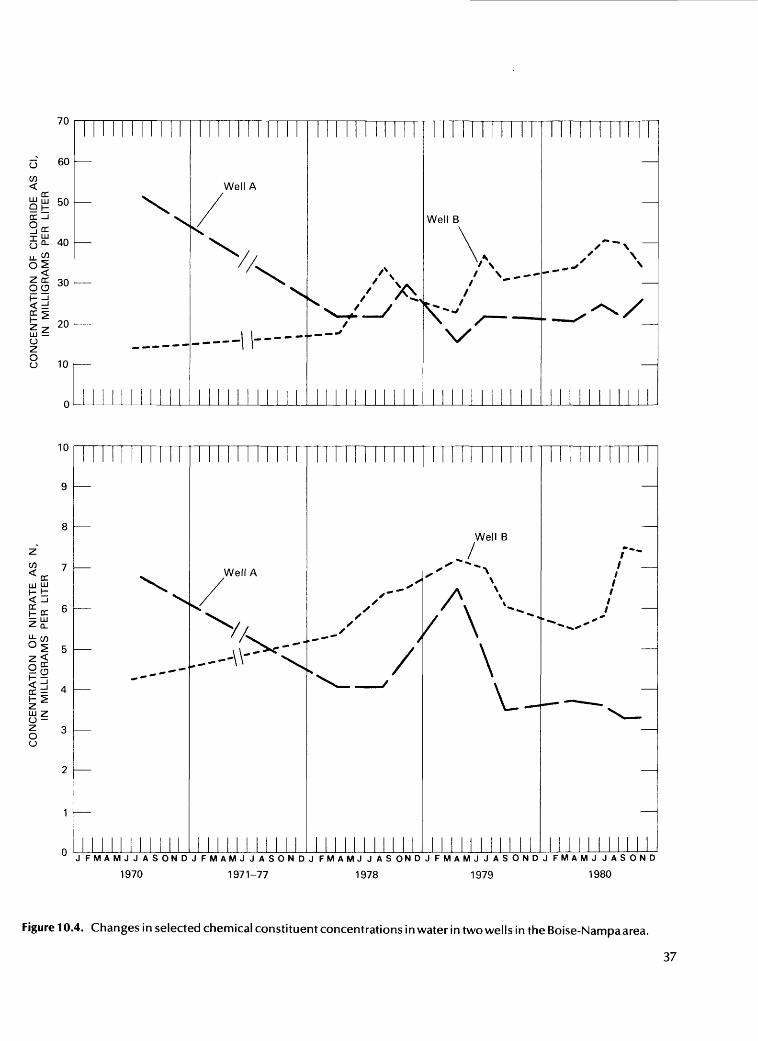
Changes in chloride and nitrate concentrations can be used as indicators of either degra dation or improvement in ground-water quality. In general, long-term (10-year) changes in these constituents were not great in the Boise-Nampaarea.
Changes in chloride and nitrate concentrations in the ground water underlying the Boise-Nampa area can be used as indicators of either degradation or improvement in water quality where that quality has been affected by waste-dis posal and land-use practices. In some wells (see sections 10.2 and 10.3), these concentrations show rising and falling trends over the long-term (10-year) period and fluctuate over the short-term (seasonal) period. However, in general, changes in the concentrations were not exceedingly great in the area.
In 14 wells, where 1970 data (Dion, 1972) represented one extreme in chloride concentrations (that is, the highest or lowest recorded value during the period of sampling, 1970-80), 7 wells showed increases in concentrations that ranged from 2.6 to 27 mg/L, and 7 showed decreases from 35 to 2.5 mg/L. In 11 wells, where 1970 data (Dion, 1972) represented one extreme in nitrate concentrations, 6 wells showed increases in concentrations that ranged from 1.1 to 4.2 mg/L, and 3 showed decreases from 3.5 to 2.4 mg/L.
Two wells showed an increase or decrease of 1 mg/L or less. Over the long-term period, only four wells showed increases in both constituents, and two wells showed decreases in both. No definite area of large extent was discer nible where both constituents either increased or decreased.
Changes in concentrations of these two constituents over long- and short-term periods are depicted in figure 10.4. Well A (SW1/4SE1/4NW1/4 sec. 18, T. 3 N., R. 2 E.) shows a general long-term decline in both con stituents. Well A is located in west Boise, where many residences were formerly dependent on individual septic systems for sewage disposal but now are connected to a central sewage system. Well B (NE1/4SE1/4SW1/4 sec. 34, T. 3 N., R. 2 W.) shows a general long-term rise in both constituents. Well B is located in south Nampa, where the municipal sewer system has recently (past 2 years) been extended to some residential subdivisions, but not to all.
36
70
60
50
40
00 30
20
z8 10
\Well A
Well B
v \x----
V
IU
9
8
z"
< 7LU LUh- H < -I
H tr 6
S 5
|I 4LU Z
Z 3oo
2
1
n
^>^
_ X
~ ,...
'
Well Ay. *^\
^ss"~
y
s "" /
'
I II
'
Well B
/^ ** »
s' \\
A \A '- \v_
I I
/*"""
/ /
'^^-**
-^. ~~^v
___
J FMAMJJASONDJFMAMJJASONDJ FMAMJJASONDJFMAMJJASONDJ FMAMJ JASOND
1970 1971-77 1978 1979 1980
Figure 10.4. Changes in selected chemical constituent concentrations in water in two wells in the Boise-Nampa area.
37
11.0 UPPER SNAKE RIVER BASIN
7 7.7 Chemical Characteristics of Water in Major Aquifers
Dissolved-Solids Concentrations Average 282 mg/Lin the Basalt of the Snake River Group and 263 mg/L
in the Quaternary Sediments
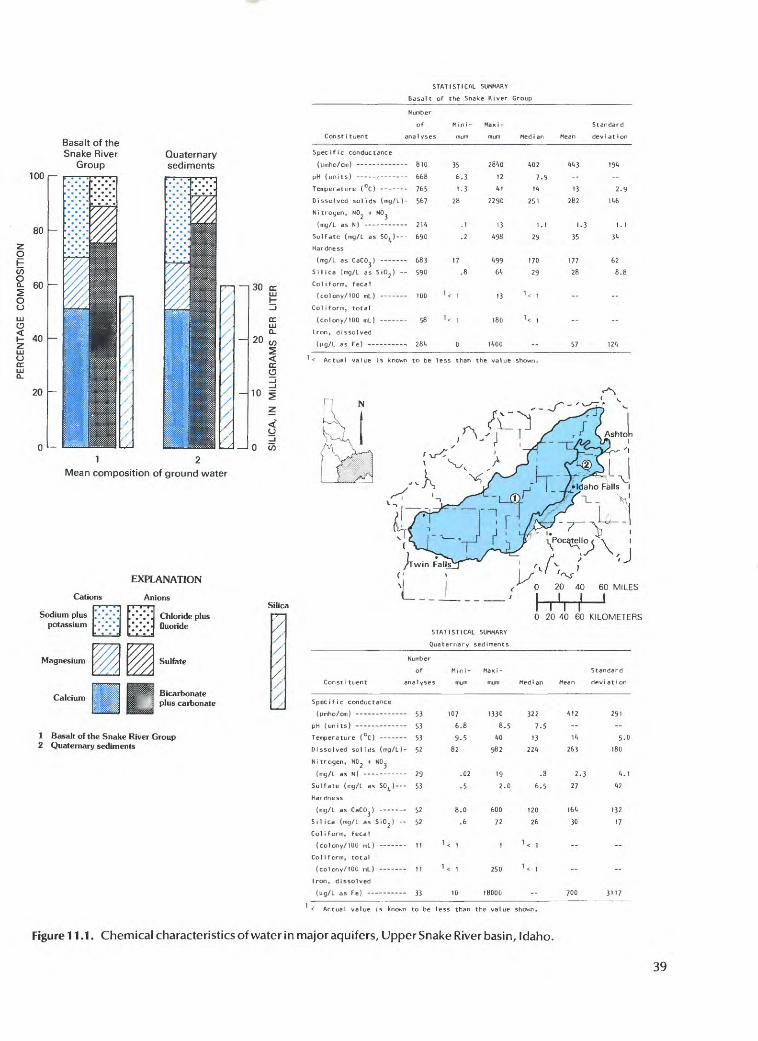
Water in the Snake River Plain aquifer occurs mostly within the basalt of the Snake River Group and in the Quaternary sediments. Dissolved-solids concentrations of the water average 282 mg/L in the basalt and 263 mg/L in the sedimentary materials. The water is mostly calcium bicarbonate type.
The Snake River Plain aquifer extends in a northeast erly direction, approximately 200 miles from Bliss to near Ashton (fig. 11.1). It is the highest yielding aquifer in Idaho and discharges about 6.5 million acre-ft of water annually into the Snake River (Norvitch and others, 1969). The aquifer is composed of basalt in the Quater nary age Snake River Group and interflow beds of Quater nary sediments.
Chemical characteristics of water in the aquifer are de termined primarily by the chemical characteristics of the water that recharges the aquifer. The sources of recharge are deep percolation from excess irrrigation water, seep age from streams, underflow from tributary basins, and precipitation. Most of the recharge water has low dis- solved-solids concentrations, which average less than 250
mg/L. The dissolved-solids concentrations average 282 mg/L for water in the basalt of the Snake River Group and 263 mg/L in the Quaternary sediments. These relatively low dissolved-solids concentrations indicate that the dis solution of minerals within the aquifer is slight.
Water in the Snake River Plain aquifer is primarily calcium bicarbonate type. The chemical characteristics of water from the basalt of the Snake River Group and from the Quaternary sediments are similar. Both contain about 50 percent calcium and about 80 percent bicarbonate. The bar graphs in figure 11.1 show the similarity in chemical composition of water from the two rock units. Statistical summaries of key indicator constituents for water from the two rock units are also presented in figure 11.1.
38
STATISTICAL SUMMARY
100 i
80 -
Basalt of theSnake River
Group
Const i tuerit analys
Quaternary sediments
i 30 rr
1 2
Mean composition of ground water
Catic
Sodium plus potassium
EXPLANATION
Anions
Magnesium
Calcium
Chloride plus fluoride
Sulfate
Bicarbonate plus carbonate
Silica
1 Basalt of the Snake River Group2 Quaternary sediments
Specific conductance
(umho/cm) 810
pH (units) 668
Temperature (°C) --- 765
Dissolved solids (mg/L)- 567
Nitrogen, NC> 2 + NO
(mg/L as N) 2\>t
Sulfate (mg/L as SO^) 690
Hardness
(mg/L as CaCO ) 683
Silica (mg/L as Si0 2 ) 590
Coliform, fecal
(colony/100 mL) 100
Coliform, total
(colony/100 mL) 58
Iron, dissolved
(ug/L as Fe) -. 28^
35
6.3
1.3
28
281*0
12
2290
13
<*99
61*
13
180
1*02
7.
170
29
13
282
177
28
19 1*
2-9
62
8.8
57 121*
1 < Actual value is known to be less than the value
n N
^
""> -i Poc^tello < \ i
^ j ' J
20 40 60 MILES I I I
I I I20 40 60 KILOMETERS
STATISTICAL SUMMARY
ts
Const ituent
Number
of Mi-ni- Maxi-
analyses mum mum Median
(umho/cm) 53pH (units) - - 53
Temperature (°C) 53
Dissolved solids (mg/L)- 52
Nitrogen, NC>2 + NO
(mg/L as N) 29
Sulfate (mg/L as SO^ ) 53
Hardness
(mg/L as CaCO ) 52
Silica (mg/L as Si0 2 > -- 52
Coliform, fecal
(colony/100 mL) 11
Coliform, total
(colony/100 mL ) 11
Iron, dissolved
107
6.8
9-5
82
.02
.5
8.0
.6
982
19
2.0
600
72
322
7.5
13
22<«
.5
6.5
120
26
263
2.3
27
(ug/L as Fe) 33 10 18000
5-0
180
132
17
700 3117
Actual vali
Figure 11.1. Chemical characteristics of water in major aquifers, Upper Snake River basin, Idaho.
39
11.0 UPPER SNAKE RIVER BASIN (Continued)
7 1.2 Chloride Movement in Part of Snake River Plain Aquifer Underlying the Idaho National Engineering Laboratory
Chloride Ions Move Slowly Through Aquifer
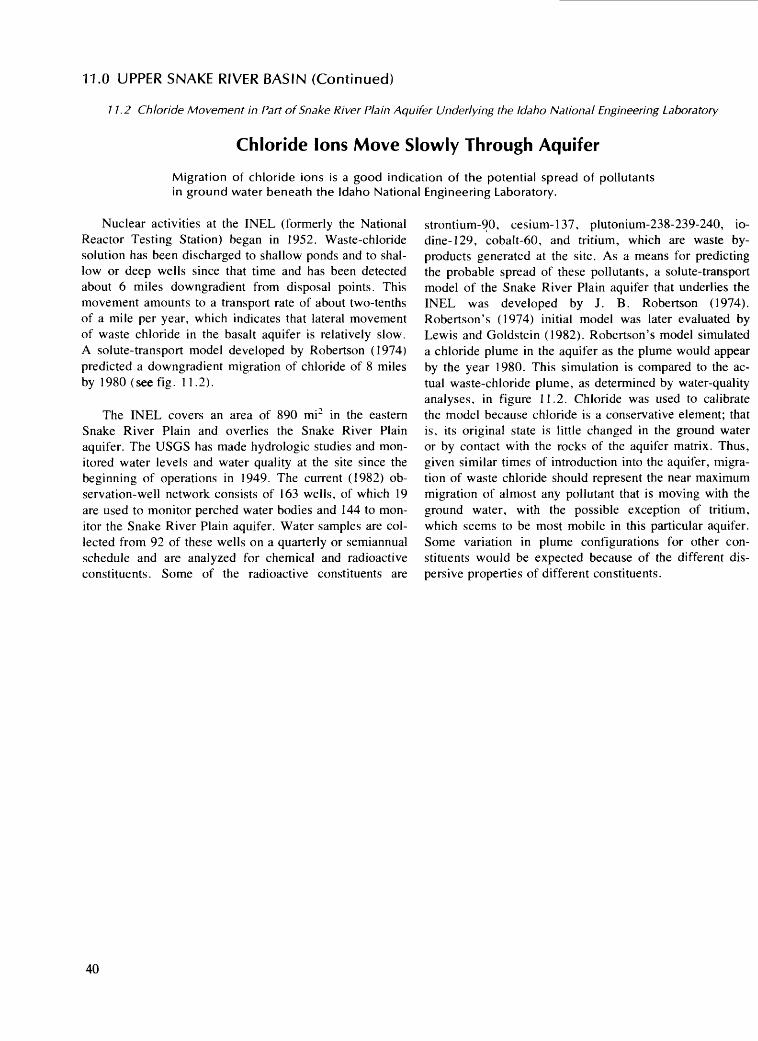
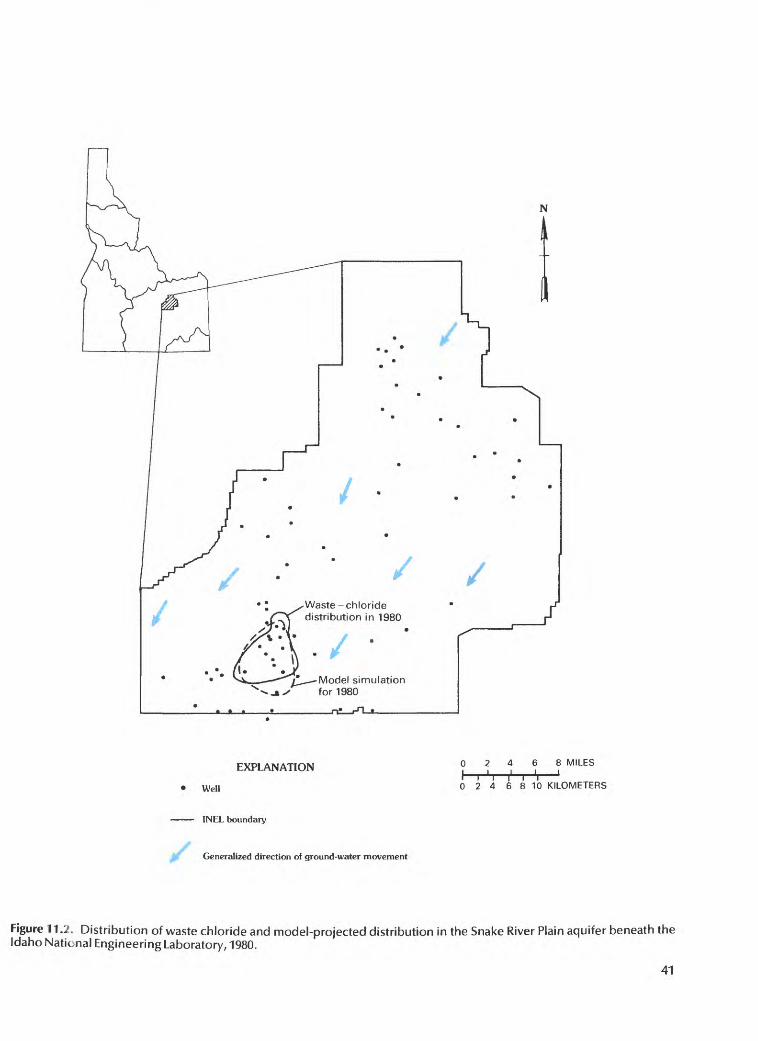
Migration of chloride ions is a good indication of the potential spread of pollutants in ground water beneath the Idaho National Engineering Laboratory.
Nuclear activities at the INEL (formerly the National Reactor Testing Station) began in 1952. Waste-chloride solution has been discharged to shallow ponds and to shal low or deep wells since that time and has been detected about 6 miles downgradient from disposal points. This movement amounts to a transport rate of about two-tenths of a mile per year, which indicates that lateral movement of waste chloride in the basalt aquifer is relatively slow. A solute-transport model developed by Robertson (1974) predicted a downgradient migration of chloride of 8 miles by 1980 (see fig. 11.2).
The INEL covers an area of 890 mi2 in the eastern Snake River Plain and overlies the Snake River Plain aquifer. The USGS has made hydrologic studies and mon itored water levels and water quality at the site since the beginning of operations in 1949. The current (1982) ob servation-well network consists of 163 wells, of which 19 are used to monitor perched water bodies and 144 to mon itor the Snake River Plain aquifer. Water samples are col lected from 92 of these wells on a quarterly or semiannual schedule and are analyzed for chemical and radioactive constituents. Some of the radioactive constituents are
strontium-90, cesium-137, plutonium-238-239-240, io dine-129, cobalt-60, and tritium, which are waste by products generated at the site. As a means for predicting the probable spread of these pollutants, a solute-transport model of the Snake River Plain aquifer that underlies the INEL was developed by J. B. Robertson (1974). Robertson's (1974) initial model was later evaluated by Lewis and Goldstein (1982). Robertson's model simulated a chloride plume in the aquifer as the plume would appear by the year 1980. This simulation is compared to the ac tual waste-chloride plume, as determined by water-quality analyses, in figure 11.2. Chloride was used to calibrate the model because chloride is a conservative element; that is, its original state is little changed in the ground water or by contact with the rocks of the aquifer matrix. Thus, given similar times of introduction into the aquifer, migra tion of waste chloride should represent the near maximum migration of almost any pollutant that is moving with the ground water, with the possible exception of tritium, which seems to be most mobile in this particular aquifer. Some variation in plume configurations for other con stituents would be expected because of the different dis persive properties of different constituents.
40
N
Waste-chloride distribution in 1980./
Model simulation for 1980
EXPLANATION
Well
02468 MILES
I I '. I 1 I 'l '0 24 6 8 10 KILOMETERS
INEL boundary
ff Generalized direction of ground-water movement
Figure 11.2. Distribution of waste chloride and model-projected distribution in the Snake River Plain aquifer beneath the Idaho National Engineering Laboratory, 1980.
41
12.0 BEAR RIVER BASIN
12.1 Chemical Characteristics of Water in Major Aquifers
Three Different Types of Ground Water Classified in the Bear River Basin
Waters of different chemical composition occur in the aquifers in Curlew, Cache, and Bear River Valleys and are classified as sodium bicarbonate chloride, sodium chloride, and calcium bicarbonate types, respectively.
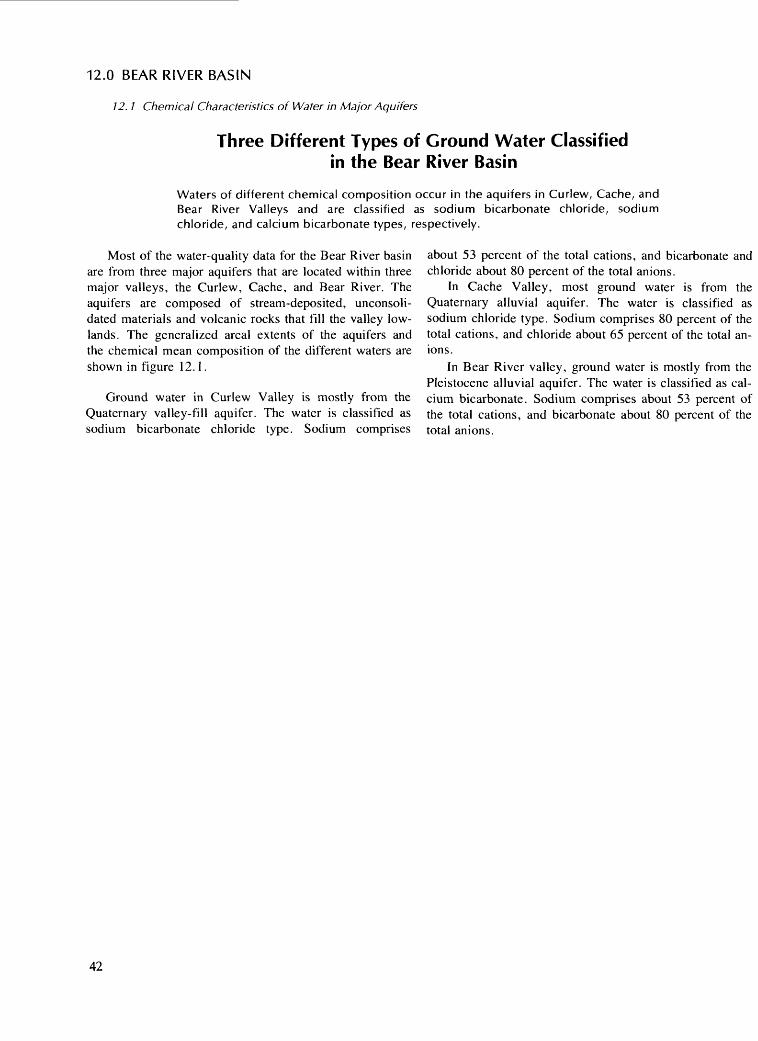
Most of the water-quality data for the Bear River basin are from three major aquifers that are located within three major valleys, the Curlew, Cache, and Bear River. The aquifers are composed of stream-deposited, unconsoli- dated materials and volcanic rocks that fill the valley low lands. The generalized areal extents of the aquifers and the chemical mean composition of the different waters are shown in figure 12.1.
Ground water in Curlew Valley is mostly from the Quaternary valley-fill aquifer. The water is classified as sodium bicarbonate chloride type. Sodium comprises
about 53 percent of the total cations, and bicarbonate and chloride about 80 percent of the total anions.
In Cache Valley, most ground water is from the Quaternary alluvial aquifer. The water is classified as sodium chloride type. Sodium comprises 80 percent of the total cations, and chloride about 65 percent of the total an ions.
In Bear River valley, ground water is mostly from the Pleistocene alluvial aquifer. The water is classified as cal cium bicarbonate. Sodium comprises about 53 percent of the total cations, and bicarbonate about 80 percent of the total anions.
42
20 I
100 r-
Quaternaryvalley- fill
aquifer
Quaternary alluvial aquifer
Pleistocene alluvial aquifer
80
60
CD < 40
cj crLLJCL
20
40 I
I I I0 20 40 60 KILOMETERS
60 MILES I
50
40 cr
1 2 3
Mean composition of ground water
Catio
Sodium plus potassium
Magnesium
Calcium
ns
H
t
EX
Ar
%
B
PLANATION
lions
Chloride plus fluoride
Sulfate
Bicarbonate plus carbonate
30
20
10
cc CD
z
CJ
Silica
v\
1 Quaternary valley-fill aquifer2 Quaternary alluvial aquifer3 Pleistocene alluvial aquifer
Figure 12.1 . Chemical characteristics of water in major aquifers, Bear River basin, Idaho.
43
12.0 BEAR RIVER BASIN (Continued)
12.2 Quality of Water in Valley-Fill and Alluvial Aquifers
Water in Bear River Valley Aquifer Has Much Lower Dissolved-Solids Concentrations Than Water in Curlew and Cache Valley Aquifers
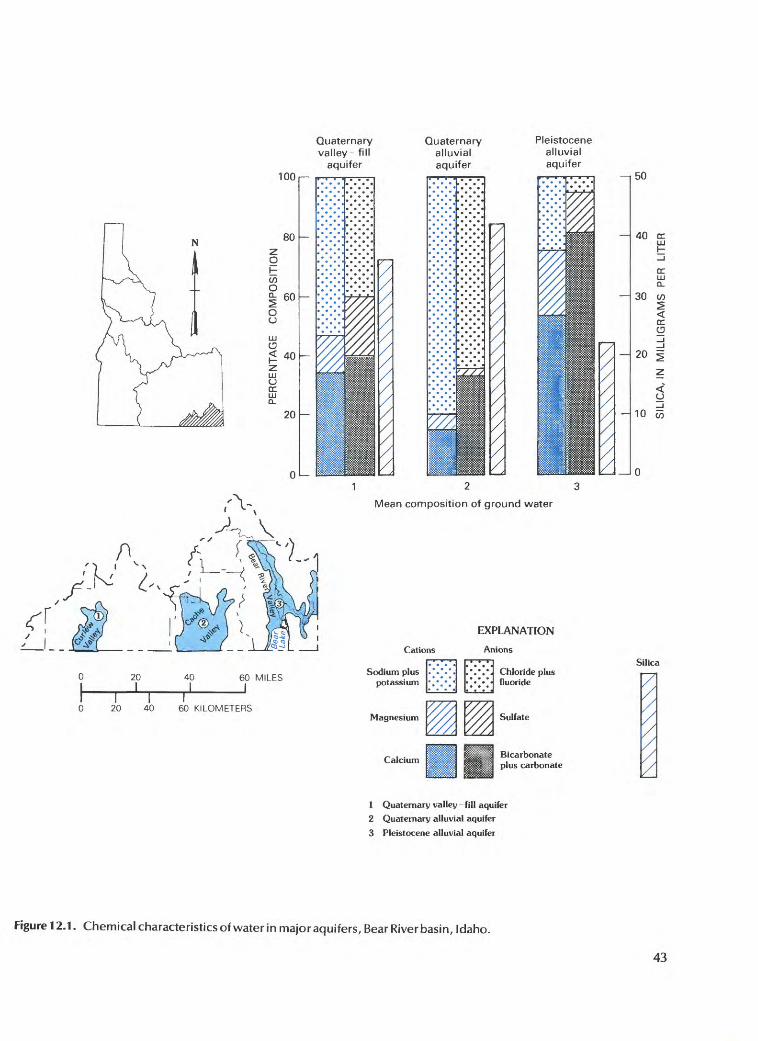
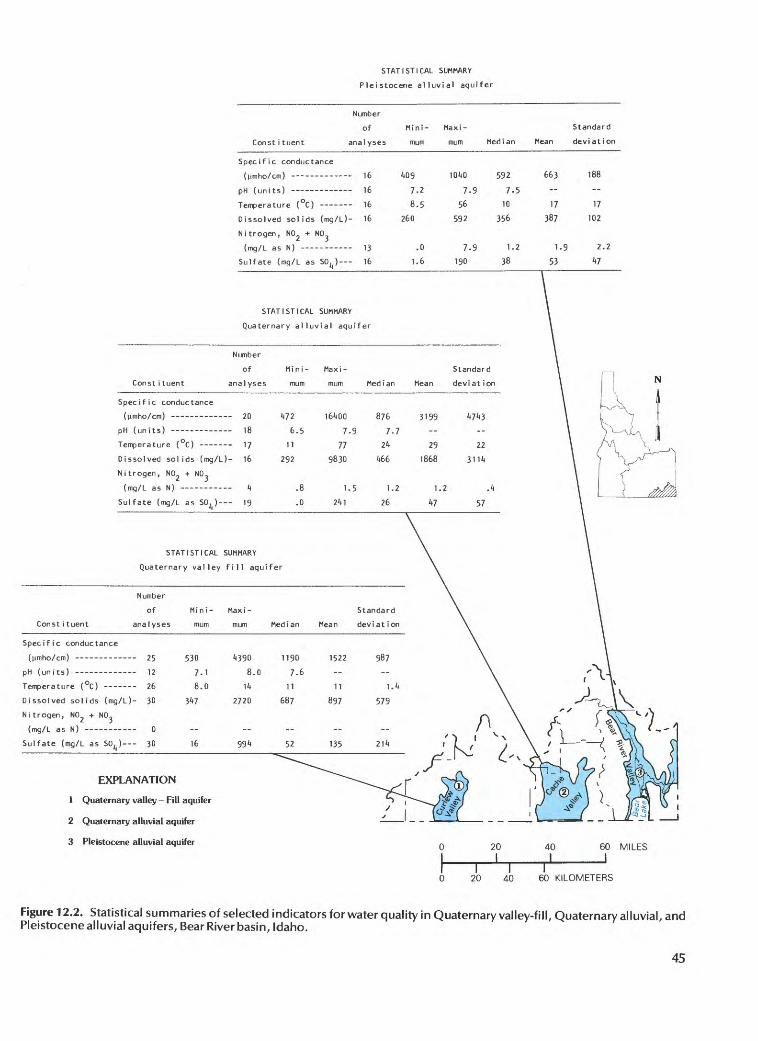
A minimal amount of data is available to describe the quality of water in the valley-fill and alluvial aquifers. Dissolved-solids concentrations range from 347 to 2,720 mg/L in the Quaternary valley fill, from 292 to 9,830 mg/L in the Quaternary alluvium, and from 260 to 592 mg/L in the Pleistocene alluvium. Water having the highest dissolved- solids concentrations is from thermal-water sources.
The Quaternary valley-fill aquifer in Curlew Valley is a source of domestic water supply for approximately 190 people. On the basis of available data, the quality of water is within the EPA's criteria for primary drinking-water standards. However, dissolved-solids, chloride, and sul- fate concentrations commonly exceeded the secondary standards (Graham and Campbell, 1981).
Within Cache Valley, water in the Quaternary alluvial aquifer is a source of domestic supply for about 8,100 people. The water is generally suitable for domestic use, but concentrations of dissolved cadmium occasionally ex ceeded the primary drinking-water standard (0.01 mg/L), and dissolved solids and dissolved iron frequently ex ceeded secondary standards (Graham and Campbell,
1981). Water with the highest dissolved solids is from thermal-water sources.
Water in the Pleistocene alluvial aquifer is a source of domestic supply for about 5,200 people. On the basis of the data available, the water is suitable for domestic use, but Graham and Campbell (1981) reported that concentra tions of nitrate sometimes exceeded the primary drinking- water standard (10 mg/L).
Figure 12.2 shows statistical summaries of water qual ity indicators in the three aquifers. Only a minimal amount of data is available to describe the water quality in these aquifers. Generally, the water in the Pleistocene alluvial aquifer in Bear River valley has a much lower dis solved-solids concentration than water in the Quaternary aquifers in Curlew and Cache Valleys has.
44
STATISTICAL SUMMARY
Pleistocene alluvial aquifer
Number
of
Constituent analyses
Specific conductance
Dissolved solids (mg/L)-
Ni trogen, NO + NO
Sulfate (mg/L as SO. ) ---
16
16
16
16
13
16
Mini- Maxi
mum mum
409 1040
7.2 7-9
8.5 56
260 592
.0 7-91.6 190
Standard
Median Mean deviation
592 663 188
7-5
10 17 17
356 387 102
1.2 1.9 2.2
38 53 47
STATISTICAL SUMMARY
Quaternary alluvial aquifer
Const i tuent
Number
of Mini -
analyses mum
Maxi
mum Median
Specific conductance
(ymho/cm) ----------- 20
pH (units) 18
Temperature (°C) 17
Dissolved solids (mg/L)- 16
472 16400
6.5 7-9
11 77
292 9830
Nitrogen, N02 + NO
(mg/L as N)
Sulfate (mg/L as SO. ) 19
(mg/L as N) 4 1.5
241
STATISTICAL SUMMARY
Quaternary valley fill aquifer
Const i tuent
Number
of
ana lyses
Specific conductance
Temperature (°C)
Di ssol ved sol ids
12
26
(mg/L)- 30
Mini
mum
530
7.1
8.0
347
Maxi
mum
4390
8.0
14
2720
Median
7.611
687
Mean
1522
11
897
Standard
dev i a t i on
987
1.4
579Nitrogen, NO + NO,
(mg/L as N) 0
Sulfate (mg/L as SO^) 30 16 99^ 52
EXPLANATION
1 Quaternary valley - Fill aquifer
2 Quaternary alluvial aquifer
3 Pleistocene alluvial aquifer20
I40 60 MILES
II
20I
40 60 KILOMETERS
Figure 12.2. Statistical summaries of selected indicators for water quality in Quaternary valley-fill, Quaternary alluvial, and Pleistocene alluvial aquifers, Bear River basin, Idaho.
45
13.0 SPECIAL PROBLEM AREAS
Ground-Water-Quality Problem Areas Identified in Idaho
Primary concerns in Idaho include (1) protection of water quality in the Rathdrum Prairie aquifer, (2) potential degradation of water quality in the Boise-Nampa area, (3) effects of widespread use of drain wells overlying the basalt in the eastern Snake River Plain aquifer, and (4) disposal of low-level radioactive wastes at the INEL.
Although the overall quality of ground water in Idaho is suitable for most uses, problem areas occur where the water in the aquifers is subject to degradation largely stemming from man's activities. The generalized location and extent of the more notable of these problem areas, as they occur in the six major drainage basins discussed previously in this report, are shown in figure 13.0. Also shown (seeexplanation, fig. 13.0) are the major contaminants that threaten the quality of ground water in these areas.
For purposes of this report, the sources of the contami nants are itemized under seven main categories: (1) sep
tic-tank drain fields, sewage-system leakage, sewage ponds, and sanitary landfills, (2) agricultural (mainly use of fertilizers and pesticides) and livestock wastes, (3) urban runoff, (4) industrial processing, (5) mining and re lated activities, (6) geothermal-resource development, and (7) nuclear activities. Items 1-5 are significant in all of the major drainage basins. Item 6 is significant mostly in the Southwest Idaho and Upper Snake River basins, and item 7 is significant only in the area of the INEL, in the Upper Snake River basin. A brief description of the spe cial problem areas in each of the major drainage basins follows.
46
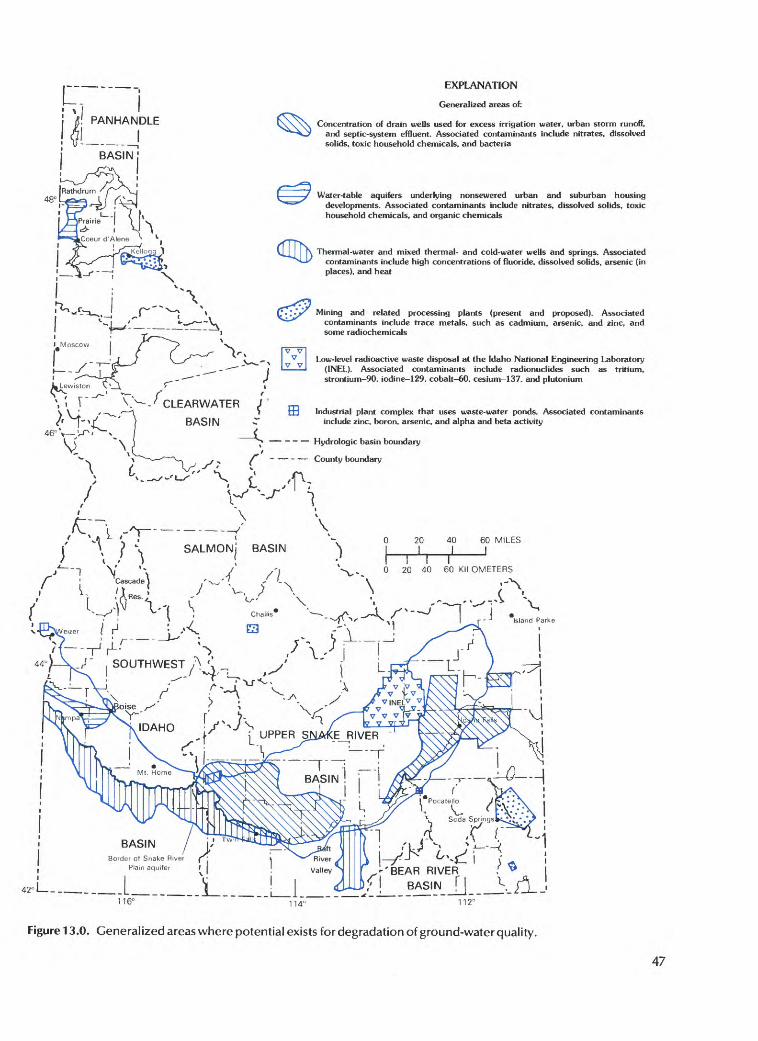
! PANHANDLE
BASIN !
V,
CLEARWATER
BASIN
EXPLANATION
Generalized areas of:
Concentration of drain wells used for excess irrigation water, urban storm runoff, and septic-system effluent. Associated contaminants include nitrates, dissolved solids, toxic household chemicals, and bacteria
Water-table aquifers underlying nonsewered urban and suburban housing developments. Associated contaminants include nitrates, dissolved solids, toxic household chemicals, and organic chemicals
Thermal-water and mixed thermal- and cold-water wells and springs. Associated contaminants include high concentrations of fluoride. dissolved solids, arsenic (in places), and heat
Mining and related processing plants (present and proposed). Associated contaminants include trace metals, such as cadmium, arsenic, and zinc, and some radiochemicals
Low-level radioactive waste disposal at the Idaho National Engineering Laboratory (1NEL). Associated contaminants include radionuclides such as tritium, strontium 90. iodine 129. cobalt 60. cesium 137, and plutonium
Industrial plant complex that uses waste-water ponds. Associated contaminants include zinc, boron, arsenic, and alpha and beta activity
^ Hydrologic basin boundary
. ^ f - - County boundary
"X ]_
I I I
0 20 40 60 KILOMETERS
» ' ^^-r
^/ ^^,, I
bAbllN / I
rder of Snake River f'
-'BEAR RIVER
BASIN f| __^._ - L_.._..L116° 114° 112°
Figure 13.0. Generalized areas where potential exists for degradation of ground-water quality.
47
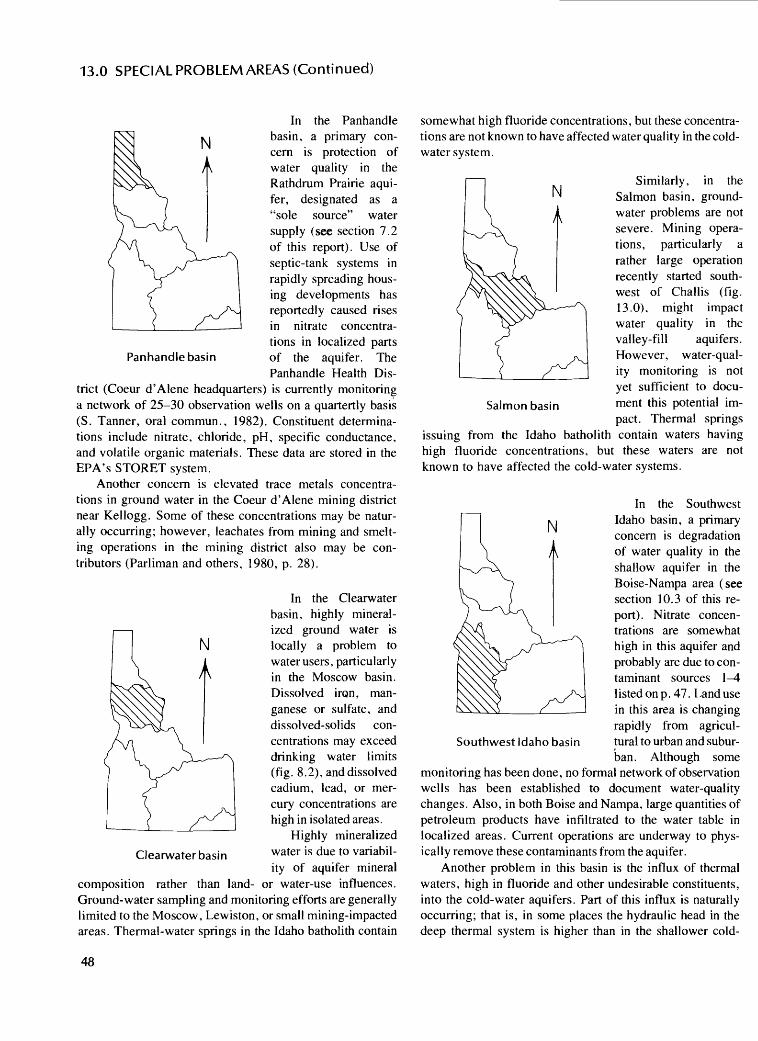
13.0 SPECIAL PROBLEM AREAS (Continued)
N
Panhandle basin
In the Panhandle basin, a primary con cern is protection of water quality in the Rathdrum Prairie aqui fer, designated as a "sole source" water supply (see section 7.2 of this report). Use of septic-tank systems in rapidly spreading hous ing developments has reportedly caused rises in nitrate concentra tions in localized parts of the aquifer. The Panhandle Health Dis
trict (Coeur d'Alene headquarters) is currently monitoring a network of 25 30 observation wells on a quartertly basis (S. Tanner, oral commun., 1982). Constituent determina tions include nitrate, chloride, pH, specific conductance, and volatile organic materials. These data are stored in the EPA's STORET system.
Another concern is elevated trace metals concentra tions in ground water in the Coeur d'Alene mining district near Kellogg. Some of these concentrations may be natur ally occurring; however, leachates from mining and smelt ing operations in the mining district also may be con tributors (Parliman and others, 1980, p. 28).
In the Clearwater basin, highly mineral ized ground water is locally a problem to water users, particularly in the Moscow basin. Dissolved iron, man ganese or sulfate, and dissolved-solids con centrations may exceed drinking water limits (fig. 8.2), and dissolved cadium, lead, or mer cury concentrations are high in isolated areas.
Highly mineralized water is due to variabil ity of aquifer mineral
composition rather than land- or water-use influences. Ground-water sampling and monitoring efforts are generally limited to the Moscow, Lewiston, or small mining-impacted areas. Thermal-water springs in the Idaho batholith contain
somewhat high fluoride concentrations, but these concentra tions are not known to have affected water quality in the cold- water system.
Clearwater basin
NSimilarly, in the
Salmon basin, ground- water problems are not severe. Mining opera tions, particularly a rather large operation recently started south west of Challis (fig. 13.0), might impact water quality in the valley-fill aquifers. However, water-qual ity monitoring is not yet sufficient to docu ment this potential im pact. Thermal springs
issuing from the Idaho batholith contain waters having high fluoride concentrations, but these waters are not known to have affected the cold-water systems.
Salmon basin
N
In the Southwest Idaho basin, a primary concern is degradation of water quality in the shallow aquifer in the Boise-Nampa area (see section 10.3 of this re port). Nitrate concen trations are somewhat high in this aquifer and probably are due to con taminant sources \-4 listed on p. 47. Land use in this area is changing rapidly from agricul tural to urban and subur ban. Although some
monitoring has been done, no formal network of observation wells has been established to document water-quality changes. Also, in both Boise and Nampa, large quantities of petroleum products have infiltrated to the water table in localized areas. Current operations are underway to phys ically remove these contaminants from the aquifer.
Another problem in this basin is the influx of thermal waters, high in fluoride and other undesirable constituents, into the cold-water aquifers. Part of this influx is naturally occurring; that is, in some places the hydraulic head in the deep thermal system is higher than in the shallower cold-
Southwest Idaho basin
48
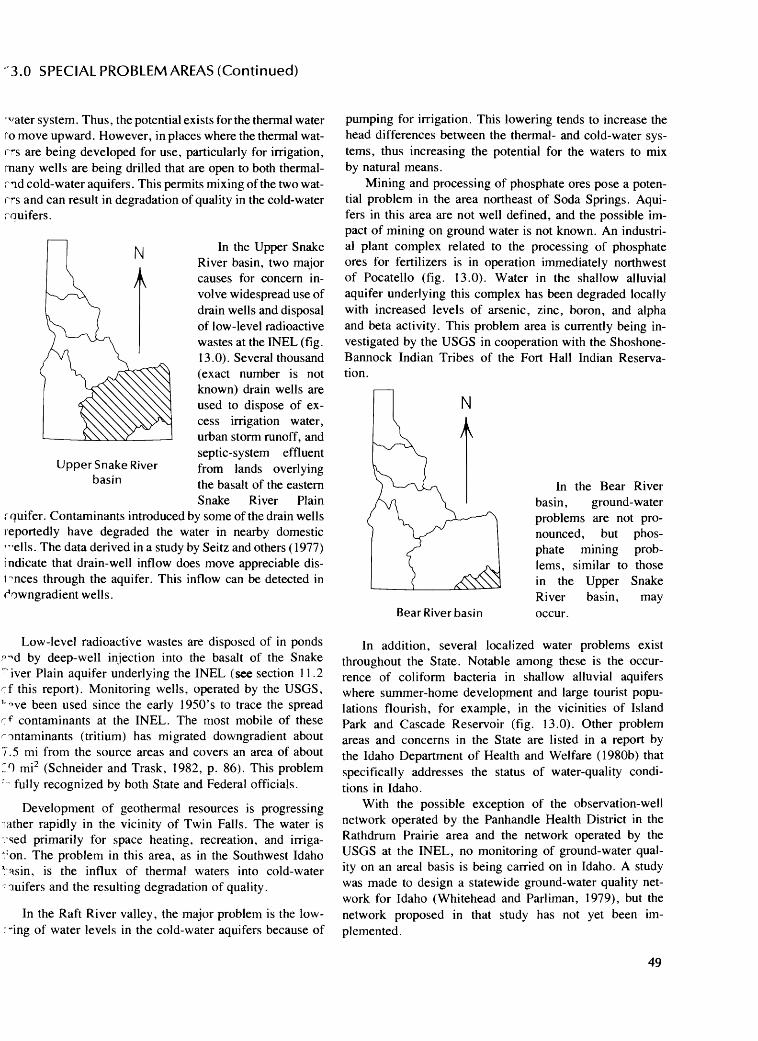
3.0 SPECIAL PROBLEM AREAS (Continued)
Upper Snake River basin
vater system. Thus, the potential exists for the thermal water fo move upward. However, in places where the thermal wat ers are being developed for use, particularly for irrigation, many wells are being drilled that are open to both thermal- nd cold-water aquifers. This permits mixing of the two wat ers and can result in degradation of quality in the cold-water rquifers.
In the Upper Snake River basin, two major causes for concern in volve widespread use of drain wells and disposal of low-level radioactive wastes at the INEL (fig. 13.0). Several thousand (exact number is not known) drain wells are used to dispose of ex cess irrigation water, urban storm runoff, and septic-system effluent from lands overlying the basalt of the eastern Snake River Plain
r quifer. Contaminants introduced by some of the drain wells reportedly have degraded the water in nearby domestic iTiells. The data derived in a study by Seitz and others (1977) i ndicate that drain-well inflow does move appreciable dis- l ^nces through the aquifer. This inflow can be detected in r'owngradient wells.
Low-level radioactive wastes are disposed of in ponds ?^d by deep-well injection into the basalt of the Snake " iver Plain aquifer underlying the INEL (see section 11.2 cf this report). Monitoring wells, operated by the USGS, '"*ve been used since the early 1950's to trace the spread c f contaminants at the INEL. The most mobile of these contaminants (tritium) has migrated downgradient about 7.5 mi from the source areas and covers an area of about :0 mi2 (Schneider and Trask, 1982, p. 86). This problem ' fully recognized by both State and Federal officials.
Development of geothermal resources is progressing rather rapidly in the vicinity of Twin Falls. The water is vsed primarily for space heating, recreation, and irriga- t : on. The problem in this area, as in the Southwest Idaho tasin, is the influx of thermal waters into cold-water 'luifers and the resulting degradation of quality.
In the Raft River valley, the major problem is the low- : -ing of water levels in the cold-water aquifers because of
pumping for irrigation. This lowering tends to increase the head differences between the thermal- and cold-water sys tems, thus increasing the potential for the waters to mix by natural means.
Mining and processing of phosphate ores pose a poten tial problem in the area northeast of Soda Springs. Aqui fers in this area are not well defined, and the possible im pact of mining on ground water is not known. An industri al plant complex related to the processing of phosphate ores for fertilizers is in operation immediately northwest of Pocatello (fig. 13.0). Water in the shallow alluvial aquifer underlying this complex has been degraded locally with increased levels of arsenic, zinc, boron, and alpha and beta activity. This problem area is currently being in vestigated by the USGS in cooperation with the Shoshone- Bannock Indian Tribes of the Fort Hall Indian Reserva tion.
Bear River basin
In the Bear River basin, ground-water problems are not pro nounced, but phos phate mining prob lems, similar to those in the Upper Snake River basin, may occur.
In addition, several localized water problems exist throughout the State. Notable among these is the occur rence of coliform bacteria in shallow alluvial aquifers where summer-home development and large tourist popu lations flourish, for example, in the vicinities of Island Park and Cascade Reservoir (fig. 13.0). Other problem areas and concerns in the State are listed in a report by the Idaho Department of Health and Welfare (1980b) that specifically addresses the status of water-quality condi tions in Idaho.
With the possible exception of the observation-well network operated by the Panhandle Health District in the Rathdrum Prairie area and the network operated by the USGS at the INEL, no monitoring of ground-water qual ity on an areal basis is being carried on in Idaho. A study was made to design a statewide ground-water quality net work for Idaho (Whitehead and Parliman, 1979), but the network proposed in that study has not yet been im plemented.
49
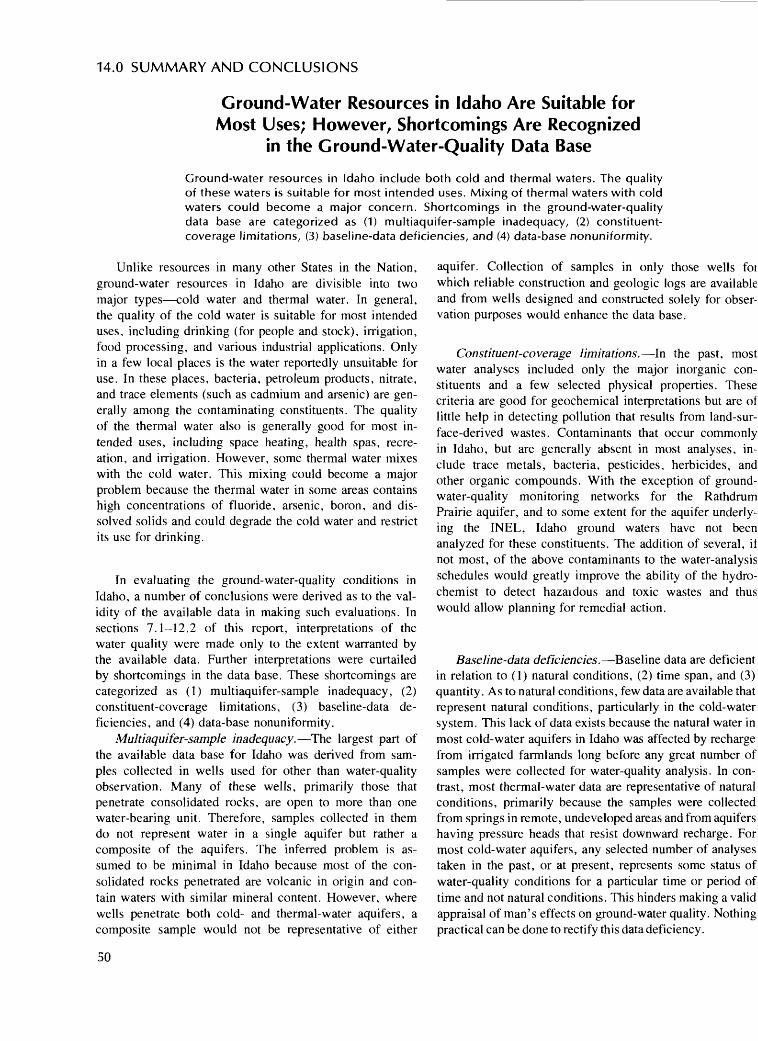
14.0 SUMMARY AND CONCLUSIONS
Ground-Water Resources in Idaho Are Suitable forMost Uses; However, Shortcomings Are Recognized
in the Ground-Water-Quality Data Base
Ground-water resources in Idaho include both cold and thermal waters. The quality of these waters is suitable for most intended uses. Mixing of thermal waters with cold waters could become a major concern. Shortcomings in the ground-water-quality data base are categorized as (1) multiaquifer-sample inadequacy, (2) constituent- coverage limitations, (3) baseline-data deficiencies, and (4) data-base nonuniformity.
Unlike resources in many other States in the Nation, ground-water resources in Idaho are divisible into two major types cold water and thermal water. In general, the quality of the cold water is suitable for most intended uses, including drinking (for people and stock), irrigation, food processing, and various industrial applications. Only in a few local places is the water reportedly unsuitable for use. In these places, bacteria, petroleum products, nitrate, and trace elements (such as cadmium and arsenic) are gen erally among the contaminating constituents. The quality of the thermal water also is generally good for most in tended uses, including space heating, health spas, recre ation, and irrigation. However, some thermal water mixes with the cold water. This mixing could become a major problem because the thermal water in some areas contains high concentrations of fluoride, arsenic, boron, and dis solved solids and could degrade the cold water and restrict its use for drinking.
In evaluating the ground-water-quality conditions in Idaho, a number of conclusions were derived as to the val idity of the available data in making such evaluations. In sections 7.1 12.2 of this report, interpretations of the water quality were made only to the extent warranted by the available data. Further interpretations were curtailed by shortcomings in the data base. These shortcomings are categorized as (1) multiaquifer-sample inadequacy, (2) constituent-coverage limitations, (3) baseline-data de ficiencies, and (4) data-base nonuniformity.
Multiaquifer-sample inadequacy. The largest part of the available data base for Idaho was derived from sam ples collected in wells used for other than water-quality observation. Many of these wells, primarily those that penetrate consolidated rocks, are open to more than one water-bearing unit. Therefore, samples collected in them do not represent water in a single aquifer but rather a composite of the aquifers. The inferred problem is as sumed to be minimal in Idaho because most of the con solidated rocks penetrated are volcanic in origin and con tain waters with similar mineral content. However, where wells penetrate both cold- and thermal-water aquifers, a composite sample would not be representative of either
aquifer. Collection of samples in only those wells for which reliable construction and geologic logs are available and from wells designed and constructed solely for obser vation purposes would enhance the data base.
Constituent-coverage limitations. In the past, most water analyses included only the major inorganic con stituents and a few selected physical properties. These criteria are good for geochemical interpretations but are of little help in detecting pollution that results from land-sur face-derived wastes. Contaminants that occur commonly in Idaho, but are generally absent in most analyses, in clude trace metals, bacteria, pesticides, herbicides, and other organic compounds. With the exception of ground- water-quality monitoring networks for the Rathdrum Prairie aquifer, and to some extent for the aquifer underly ing the INEL, Idaho ground waters have not been analyzed for these constituents. The addition of several, if not most, of the above contaminants to the water-analysis schedules would greatly improve the ability of the hydro- chemist to detect hazaidous and toxic wastes and thus would allow planning for remedial action.
Baseline-data deficiencies. Baseline data are deficient in relation to (1) natural conditions, (2) time span, and (3) quantity. As to natural conditions, few data are available that represent natural conditions, particularly in the cold-water system. This lack of data exists because the natural water in most cold-water aquifers in Idaho was affected by recharge from irrigated farmlands long before any great number of samples were collected for water-quality analysis. In con trast, most thermal-water data are representative of natural conditions, primarily because the samples were collected from springs in remote, undeveloped areas and from aquifers having pressure heads that resist downward recharge. For most cold-water aquifers, any selected number of analyses taken in the past, or at present, represents some status of water-quality conditions for a particular time or period of time and not natural conditions. This hinders making a valid appraisal of man's effects on ground-water quality. Nothing practical can be done to rectify this data deficiency.
50
14.0 SUMMARY AND CONCLUSIONS
As to time span, the bulk of data used to make the evalua tion of this report spanned about a 25-year period, from the mid-1950's to 1980. Ideally, an evaluation of ground-water quality should be made with data collected in as short a time period as possible. In addition, water-quality conditions in many aquifers change seasonally, particularly in aquifers that underlie irrigated lands. These changes can be substan tial locally, but they are or have been monitored (see fig. 10.4) in only a few places. This deficiency can be alleviated by establishing water-quality-monitoring networks that are operated on a scheduled basis. One such network of statewide scale is proposed by Whitehead and Parliman (1979).
As to quantity, data are insufficient for all aquifers except the Rathdrum Prairie aquifer. The data are insufficient on areal, vertical, and temporal bases. Implementation of a statewide network would be a good start in solving this defi ciency.
Data-base nonunifortuity. Ground-water-quality data are collected by different agencies for different purposes. This multiple collection results in difficulties when any one agency attempts to assimilate all data from all data bases for a single purpose. Each group of collectors uses its own sam pling techniques, analytical methods, and quality-control procedures; this leads to incompatibility of data and pre cludes the use of all available data for certain interpretations
and appraisals. Sampling techniques, analytical methods, and accuracy standards are continually improving. These changes result in doubt, even within groups, when making comparisons between old and new data. For example, appar ent changes in constituent concentrations determined from repeated sampling may actually be caused by improved accu racy in laboratory determinations. Therefore, time-trend analyses made of long-term (10 years or more) data are sometimes suspect.
In addition to the above, data-management systems dif fer. For example, data in two of the largest water-quality sys tems, STORET and WATSTORE, are difficult to merge. Programs used in one system will not work in the other with out considerable adaptation. A more cumbersome problem is that data available from some sources are not stored in computers; this discourages any massive use of these data.
The above difficulties could be alleviated by standardiza tion of all water-quality sampling and analysis techniques, use of similar quality-control standards, complete merger of data files among computer systems, and computerization of all data.
In spite of the recognized shortcomings, the evaluation made on the current quality of Idaho's ground water is reasonably accurate and will be of practical value to water managers and users.
15.0 REFERENCES CITED
Dion, N. P., 1972, Some effects of land-use changes on the shallow ground-water system in the Boise-Nampa area, Idaho: Idaho Department of Water Administration Water Information Bulletin no. 26, 47 p.
Drost, B. W., and Seitz, H. R., 1977, Spokane Valley- Rathdrum Prairie aquifer, Washington and Idaho: U.S. Geological Survey Open-File Report 77-829, 79 p.
Durfor, C. N., and Becker, Edith, 1964, Public water supplies of the 100 largest cities in the United States, 1962: U.S. Geological Survey Water-Supply Paper 1812, 264 p.
Graham, W. G., and Campbell, L. J., 1981, Groundwater re sources of Idaho: Idaho Department of Water Resources, 100 p.
Idaho Department of Health and Welfare, 1980a, Idaho water quality standards and waste treatment requirements: Divi sion of Environment, 56 p.
1980b, Idaho water quality status report 1980: Division of Environment, 65 p.
Lewis, B. D., and Goldstein, F. J., 1982, Evaluation of a pre dictive ground-water solute-transport model at the Idaho National Engineering Laboratory, Idaho: U.S. Geologi cal Survey Water-Resources Investigations 82-25, 78 p.
Norvitch, R. F., Thomas, C. A., and Madison, R. J., 1969, Ar tificial recharge to the Snake Plain aquifer in Idaho; an evaluation of potential and effect: Idaho Department of Reclamation Water Information Bulletin no. 12, 59 p.
Parliman, D. J., Seitz, H. R., and Jones, M. L., 1980, Ground- water quality in north Idaho: U.S. Geological Survey Water-Resources Investigations 80-596, 34 p.
Robertson, J. B., 1974, Digital modeling of radioactive and chemical waste transport in the Snake River Plain aquifer at the National Reactor Testing Station, Idaho: U.S. Geological Survey Open-File Report IDO-22054, 41 p.
Ross, C. P., 1963, Model composition of the Idaho batholith: U.S. Geological Survey Professional Paper 475-C, p. C86-C90.
Schneider, Robert, and Trask, N. J., 1982, U.S. Geological Sur vey research in radioactive waste disposal Fiscal year 1980: U.S. Geological Survey Open-File Report 82-509, HOp.
Seitz, H. R., La Sala, A. M., and Moreland, J. A., 1977, Ef fects of drain wells on the ground-water quality of the western Snake River Plain aquifer, Idaho: U.S. Geologi cal Survey Open-File Report 76-673, 34 p.
U.S. Environmental Protection Agency, 1977a, National interim primary drinking water regulations: Washington, U.S. Government Printing Office, 159 p.
1977b, National secondary drinking water regulations: Federal Register, v. 42, no. 62, p. 17143-17147.
U.S. Geological Survey, 1975, Hydrologic unit map 1974, State of Idaho: U.S. Geological Survey, 1 sheet.
Whitehead, R. L., and Parliman, D. J., 1979, A proposed ground-water quality monitoring network for Idaho: U.S. Geological Survey Water Resources Investigations 79- 1477, 67 p.
52
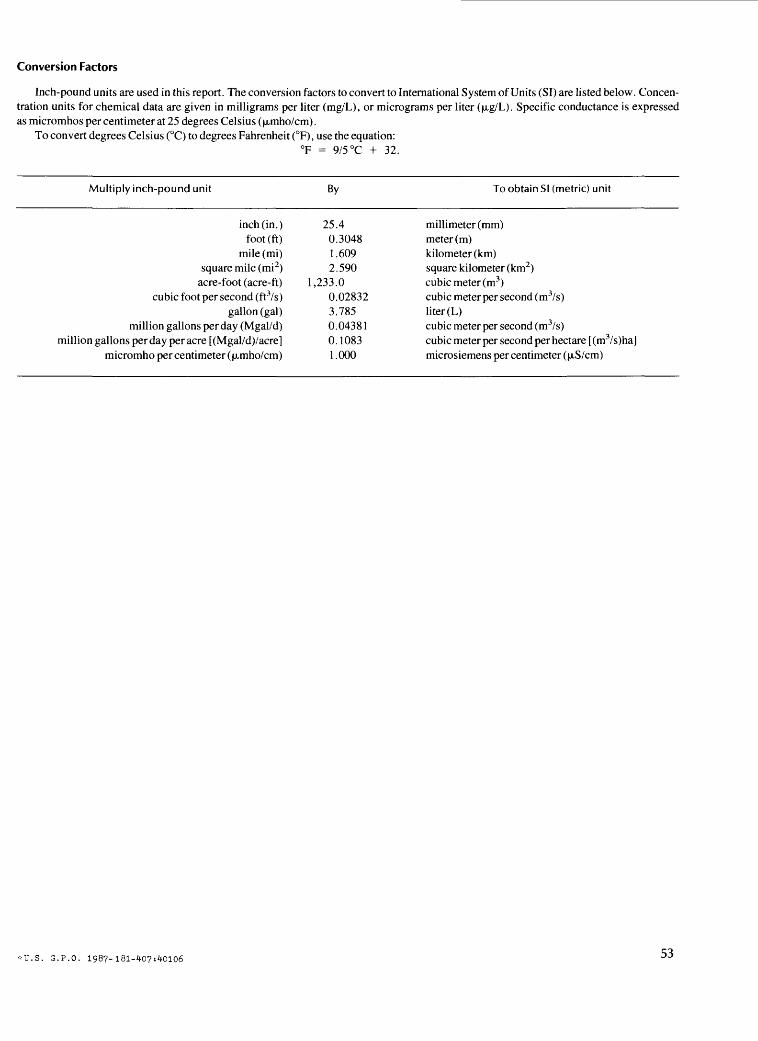
Conversion Factors
Inch-pound units are used in this report. The conversion factors to convert to International System of Units (SI) are listed below. Concen tration units for chemical data are given in milligrams per liter (mg/L), or micrograms per liter (|xg/L). Specific conductance is expressed as micromhos per centimeter at 25 degrees Celsius ((xmho/cm).
To convert degrees Celsius (°C) to degrees Fahrenheit (°F), use the equation:°F = 9/5 °C + 32.
Multiply inch-pound unit By To obtain SI (metric) unit
inch (in.) 25.4 millimeter (mm)foot (ft) 0.3048 meter (m)
mile (mi) 1.609 kilometer (km)square mile (mi 2) 2.590 square kilometer (km2)
acre-foot (acre-ft) 1,233.0 cubic meter (m3 )cubic foot per second (ft3/s) 0.02832 cubic meter per second (m3/s)
gallon (gal) 3.785 liter (L)million gallons per day (Mgal/d) 0.04381 cubic meter per second (m3/s)
million gallons per day per acre [(Mgal/d)/acre] 0.1083 cubic meter per second per hectare [(m3/s)ha]micromho per centimeter ((xmho/cm) 1.000 microsiemens per centimeter (|xS/cm)
*U.S. G.P.O. 1987-181-407:40106