Embed Size (px)
Citation preview
Chennai Plant Metrics Performance-2014
1/39
Item in Metrics Report Function Owner 2015 Goal 2014 2015 YTD Jan Feb Mar Apr May Jun Jul Aug Sep Oct Nov Dec
CAR Cost Ratio (%) Chennai Plant Chennai Plant ≤ #DIV/0! #DIV/0! #DIV/0! #DIV/0! #DIV/0! #DIV/0! #DIV/0! #DIV/0! #DIV/0! #DIV/0! #DIV/0! #DIV/0! #DIV/0!
Chennai Plant Jeeva Chennai Plant ≤ #DIV/0! #DIV/0! #DIV/0! #DIV/0! #DIV/0! #DIV/0! #DIV/0! #DIV/0! #DIV/0! 0 #DIV/0! #DIV/0! #DIV/0!
Total Chennai Plant ≤ #DIV/0! 0.00 0.00 0.00 0.00 0.00 0.00 0.00 0.00 0.00 0.00 0.00 0.00
Scrap Chennai Plant ≤ #DIV/0! 0.00 0.00 0.00 0.00 0.00 0.00 0.00 0.00 0.00 0.00 0.00 0.00
Obsolescence Chennai Plant ≤ #DIV/0! 0.00 0.00 0.00 0.00 0.00 0.00 0.00 0.00 0.00 0.00 0.00 0.00
CAR Cost Chennai Plant ≤ #DIV/0! 0.00 0.00 0.00 0.00 0.00 0.00 0.00 0.00 0.00 0.00 0.00 0.00
Product Audit (%) Razor Jeeva Chennai Plant ≥ 0.00 0.00 0.00 0.00 0.00 0.00 0.00 0.00 0.00 0.00 0.00 0.00 0.00
First Pass Yield (%) Razor Jeeva Chennai Plant ≥ #DIV/0! #DIV/0! #DIV/0! #DIV/0! #DIV/0! #DIV/0! #DIV/0! #DIV/0! #DIV/0! #DIV/0! #DIV/0! #DIV/0! #DIV/0!
Supplier DPPM Jeeva Chennai Plant ≤ #DIV/0! #DIV/0! #DIV/0! #DIV/0! #DIV/0! #DIV/0! #DIV/0! #DIV/0! #DIV/0! #DIV/0! #DIV/0! #DIV/0! #DIV/0!
Incoming Inspection Accuracy(%)Jeeva Chennai Plant
≥ #DIV/0! #DIV/0! #DIV/0! #DIV/0! #DIV/0! #DIV/0! #DIV/0! #DIV/0! #DIV/0! #DIV/0! #DIV/0! #DIV/0! #DIV/0!
On Time Incoming Insepction Rate(%) ≥ #DIV/0! #DIV/0! #DIV/0! #DIV/0! #DIV/0! #DIV/0! #DIV/0! #DIV/0! #DIV/0! #DIV/0! #DIV/0! #DIV/0! #DIV/0!
Responsible Person
V B. Venkatachalam/Jee
vaExternal Defect
PPM
Cost of Poor Quality (CoPQ) (KUSD)
V B. Venkatachalam/Jee
va
Form 6001, Rev 01/28/10, Ref. SOP 21.10 Printed on: 04/19/2023
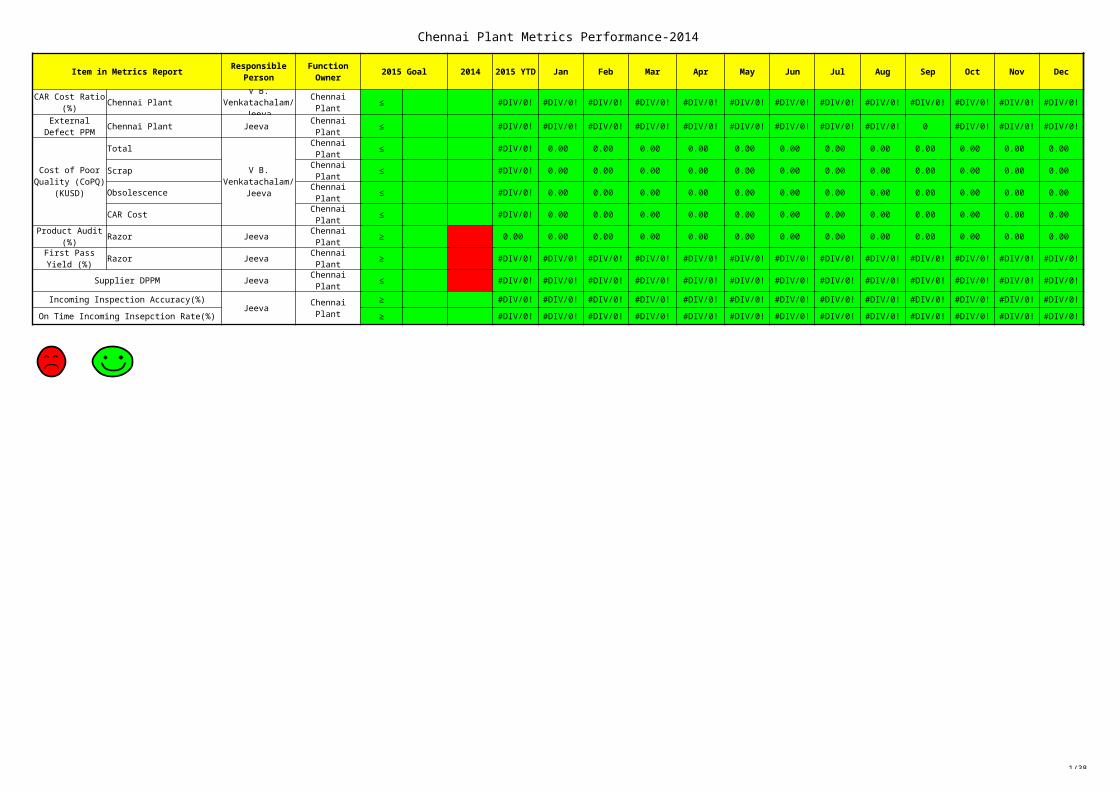
Plant or Group Name
2009 BUSINESS PLAN DEPLOYMENT CategoryGoal: Overall Status:
Schedule & Control Point
# OBJECTIVE & METHODS RESPONSIBLE TARGET Jan Feb Mar Apr May Jun Jul Aug Sep Oct Nov Dec Status
1.0 OBJECTIVE:
METHODS:
2.0 OBJECTIVE:
METHODS:
3.0 OBJECTIVE:
METHODS:
4.0 OBJECTIVE:
METHODS:
5.0 OBJECTIVE:
METHODS:
Time-Line Legend STATUS LEGENDTime line Meets or exceeds target Improvements neededControl point Fill in when performedPlanned start/end time Actual start/end time
What you are trying to achieve by a particular course of action. Objectives directly support goals and are agreed to by all levels of the organization. They are more specific than goals and they are followed up and reviewed monthly. It is best to limit the number of objectives per goal so that the team can remain focused on top priority items. All objectives require a target.
Rating system for monthly status on objectives and methods. Colors or symbols may be used independently to represent the same rating system.
Comprised of one or more activities which are planned to meet the objective. Methods should have a target to track progress and signal whether we are meeting our methods. They are the "how" of the annual plan. They should be specific, timed and scheduled, assigned to individuals responsible for carrying them out, and supported by detailed action plans.
The names of the individual(s) who are responsible for carrying out the specific methods designed to meet the objective.
The target is meant as a means by which to track progress. Targets provide us with a tool to evaluate the success of our plan. Targets must be achievable, challenging, based on reliable statistics, and tracked regularly. Targets must also be SMART (Specific, Measured, Accurate, Realistic, Timed).
Example time line
This area is used to track the monthly status of the objective and methods of the BPD. Status is shown using the rating system below.
Updated at the monthly review - determined by reviewing the entire BPD status.
Symbols to be used on the BPD timing schedule.

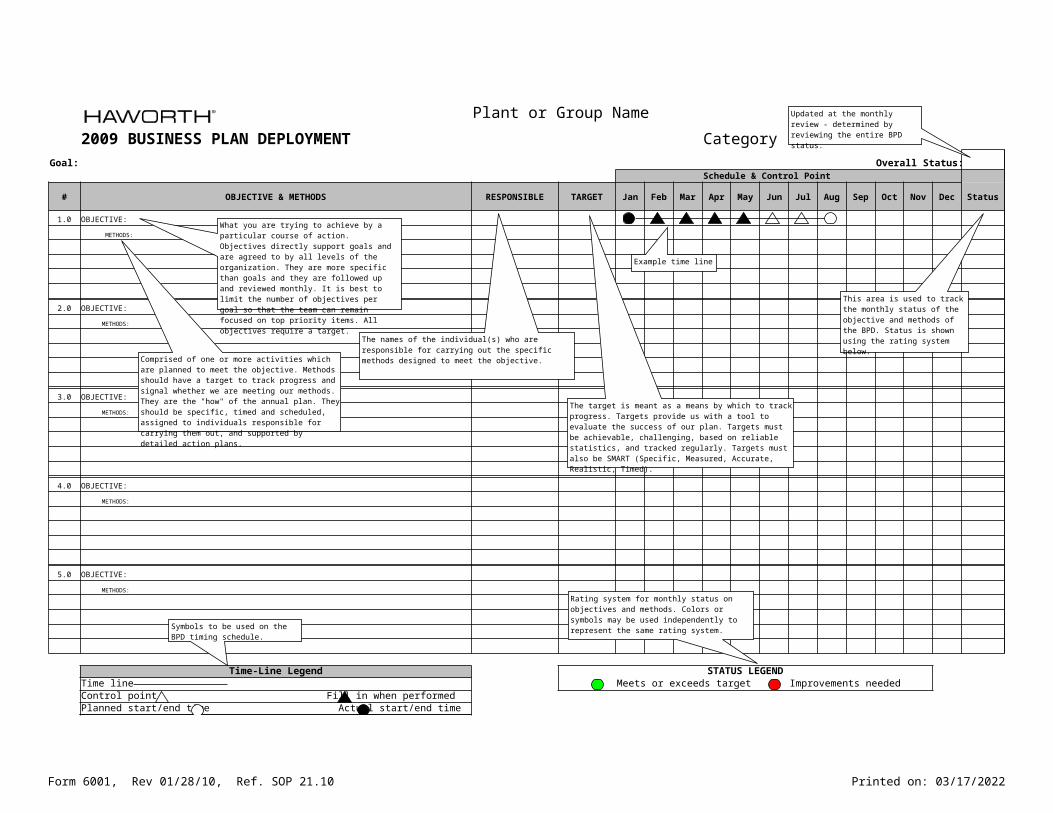
Quality
Plant or Group Name: Quality2014 BUSINESS PLAN DEPLOYMENT
Goal: Achieve Quality Measures for FPR, PPM, Scrap, First Pass Yield, Product Audits Overall Status:
Schedule & Control Point
# OBJECTIVE & METHODS RESPONSIBLE TARGET Jan Feb Mar Apr May Jun Jul Aug Sep Oct Nov Dec Status
1.0 OBJECTIVE: CAR Order Cost Ratio 100%
METHODS:
2.0 OBJECTIVE: External Defect PPM 100%
METHODS:
3.0 OBJECTIVE: Cost of Poor Quality 100%
METHODS:
4.0 OBJECTIVE: Product Audit 100%
METHODS:
5.0 OBJECTIVE: First Pass Yield 100%
METHODS:
6.0 OBJECTIVE: Supplier DPPM 100%
METHODS:
Time-Line Legend STATUS LEGENDTime line Meets or exceeds target Improvements neededControl point Fill in when performedPlanned start/end time Actual start/end time
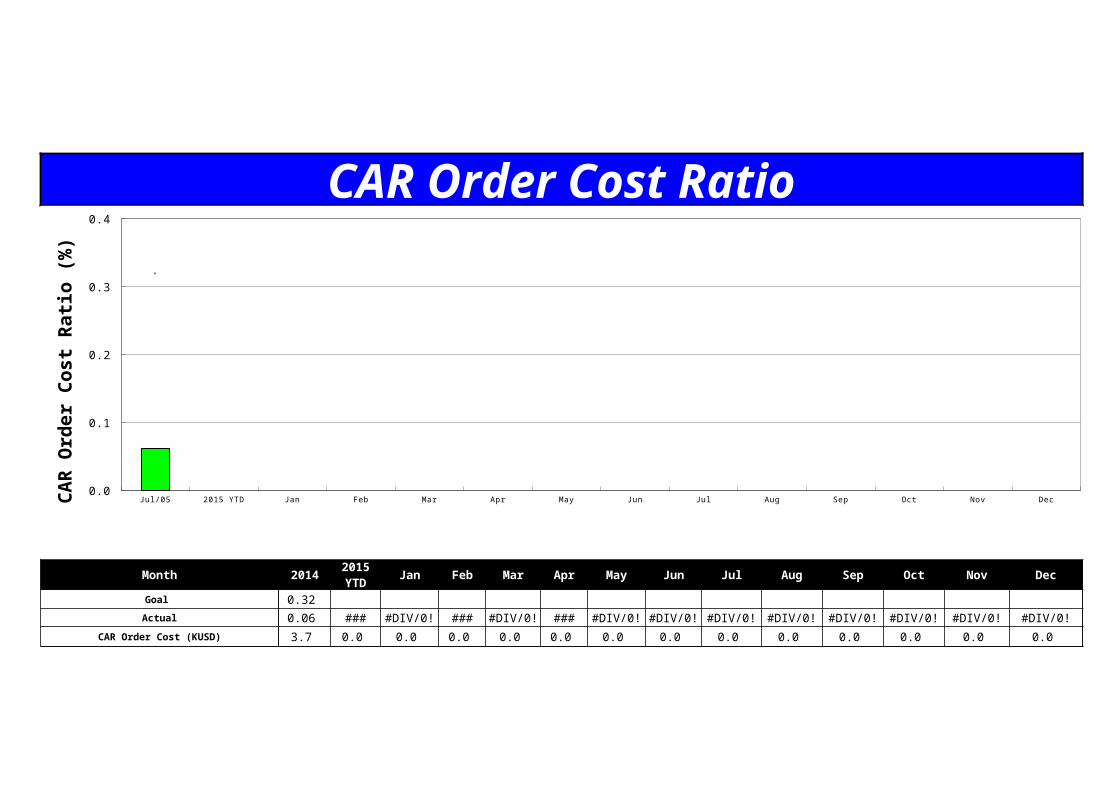
CAR Order Cost Ratio
Month 2014 Jan Feb Mar Apr May Jun Jul Aug Sep Oct Nov Dec
Goal 0.32
Actual 0.06 #DIV/0! #DIV/0! #DIV/0! #DIV/0! #DIV/0! #DIV/0! #DIV/0! #DIV/0! #DIV/0! #DIV/0! #DIV/0! #DIV/0! #DIV/0!
CAR Order Cost (KUSD) 3.7 0.0 0.0 0.0 0.0 0.0 0.0 0.0 0.0 0.0 0.0 0.0 0.0 0.0
2015 YTD
Jul/05 2015 YTD Jan Feb Mar Apr May Jun Jul Aug Sep Oct Nov Dec Jul/05 2015 YTD Jan Feb Mar Apr May Jun Jul Aug Sep Oct Nov Dec
Actual 0.06 N.aN N.aN N.aN N.aN N.aN N.aN N.aN N.aN N.aN N.aN N.aN N.aN N.aN
Goal 0.32 N.aN N.aN N.aN N.aN N.aN N.aN N.aN N.aN N.aN N.aN N.aN N.aN N.aN
0.1
0.3
CAR O
rder C
ost R
atio (
%)
CAR Order Cost ParetoSeries1
Cost
NaN
1.000
3.000
5.000
Mo
nth
ly T
op
3 C
AR
Ord
er P
aret
o
External DPPM Pareto
Defect Qty N.aN NaN NaN
0.50
1.50
2.50
3.50
4.50
Mo
nth
ly T
op
3 E
xter
nal
Def
ect
Qty
Par
eto
CoPQ Pareto
Cost N.aN N.aN Na.N
1
3
5
7
9
11
Mo
nth
ly T
op
3 C
oP
Q P
aret
o

CoPQ Pareto
Cost N.aN N.aN Na.N
1
3
5
7
9
11
Mo
nth
ly T
op
3 C
oP
Q P
aret
o
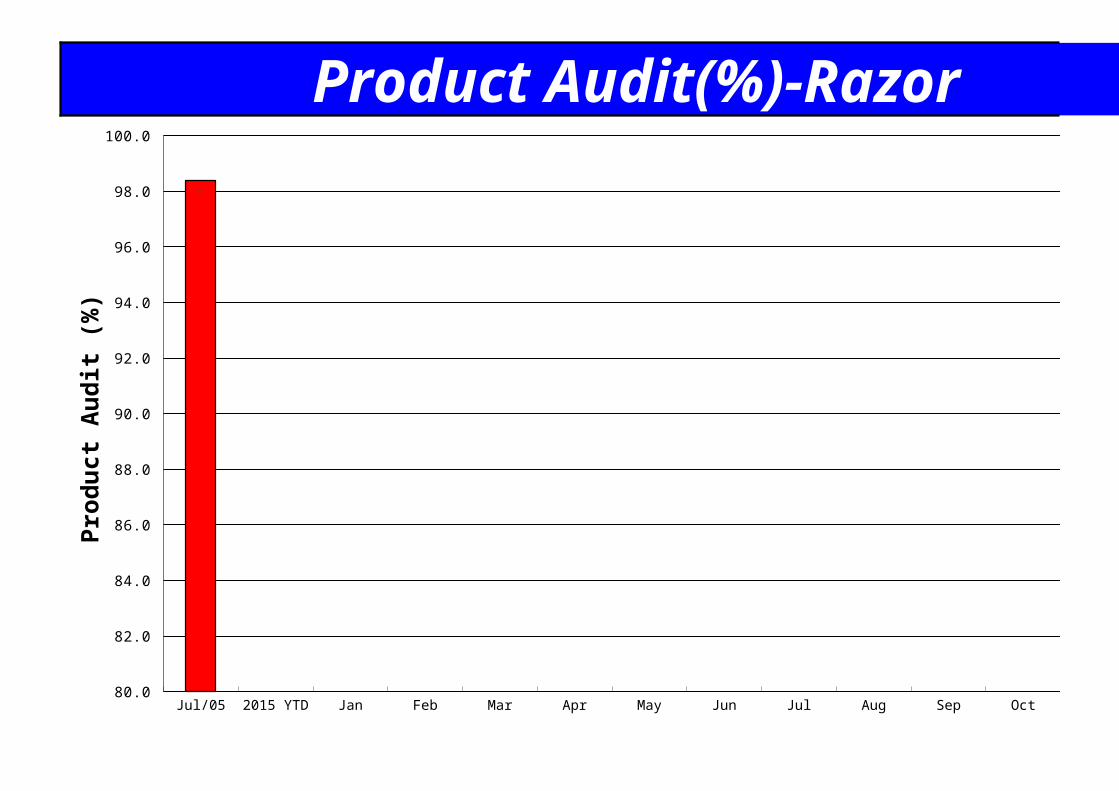
Product Audit(%)-Razor
Jul/05 2015 YTD Jan Feb Mar Apr May Jun Jul Aug Sep Oct Nov Dec Jul/05 2015 YTD Jan Feb Mar Apr May Jun Jul Aug Sep Oct Nov Dec
Actual 98.40 (N.aN) (N.aN) (N.aN) (N.aN) (N.aN) (N.aN) (N.aN) (N.aN) (N.aN) (N.aN) (N.aN) (N.aN) (N.aN)
Goal 98 NaN NaN NaN NaN NaN NaN NaN NaN NaN NaN NaN NaN NaN
81.0
83.0
85.0
87.0
89.0
91.0
93.0
95.0
97.0
99.0
Produ
ct Au
dit (%
)
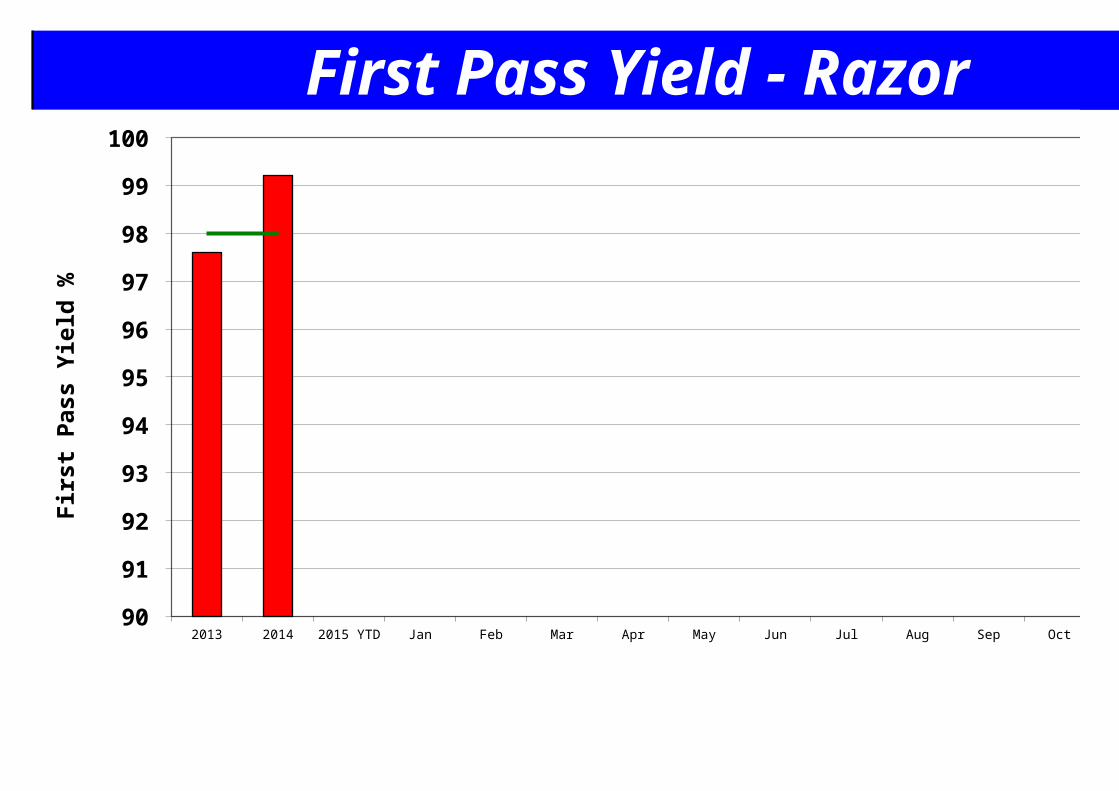
First Pass Yield - Razor
2013 2014 2015 YTD Jan Feb Mar Apr May Jun Jul Aug Sep Oct Nov Dec 2013 2014 2015 YTD Jan Feb Mar Apr May Jun Jul Aug Sep Oct Nov Dec
Actual 97.6 99.2 Na.N Na.N Na.N Na.N Na.N Na.N Na.N Na.N Na.N Na.N Na.N Na.N Na.N
Goal 98.0 98.0 (Na.N) (Na.N) (Na.N) (Na.N) (Na.N) (Na.N) (Na.N) (Na.N) (Na.N) (Na.N) (Na.N) (Na.N) (Na.N)
91
92
93
94
95
96
97
98
99
100
First
Pass
Yield
%
- #DIV/0! - #DIV/0! - #DIV/0! -
- #DIV/0! - #DIV/0! - #DIV/0! -
Corporate Supplier - #DIV/0! - #DIV/0! - #DIV/0! -
Corporate System - #DIV/0! - #DIV/0! - #DIV/0! -
Marketing Marketing - #DIV/0! - #DIV/0! - #DIV/0! -
- #DIV/0! - #DIV/0! - #DIV/0! -
Production Production Production - #DIV/0! - #DIV/0! - #DIV/0! -
Planning Planning Planning - #DIV/0! - #DIV/0! - #DIV/0! -
Distribution Distribution - #DIV/0! - #DIV/0! - #DIV/0! -
OEM Engineering - #DIV/0! - #DIV/0! - #DIV/0! -
OEM + PQE - #DIV/0! - #DIV/0! - #DIV/0! -
OEM Engineering - #DIV/0! - #DIV/0! - #DIV/0! -
OEM + PQE - #DIV/0! - #DIV/0! - #DIV/0! -
Warranty Warranty Warranty - #DIV/0! - #DIV/0! - #DIV/0! - Others Others - #DIV/0! - #DIV/0! - #DIV/0! -
Total: - #DIV/0! - #DIV/0! - #DIV/0! -
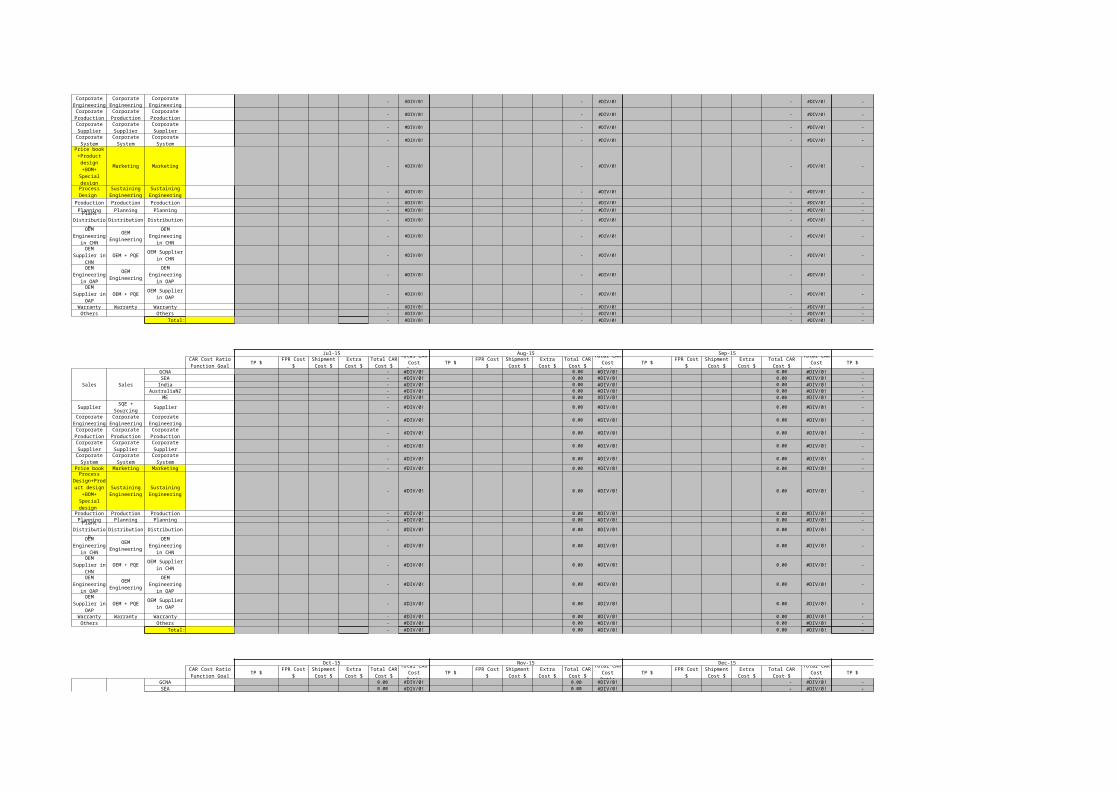
Jul-15 Aug-15 Sep-15 YTD
TP $ FPR Cost $ Extra Cost $ TP $ FPR Cost $ Extra Cost $ TP $ FPR Cost $ Extra Cost $ Total CAR Cost $ TP $
Sales Sales
GCNA - #DIV/0! 0.00 #DIV/0! 0.00 #DIV/0! - SEA - #DIV/0! 0.00 #DIV/0! 0.00 #DIV/0! - India - #DIV/0! 0.00 #DIV/0! 0.00 #DIV/0! -
AustraliaNZ - #DIV/0! 0.00 #DIV/0! 0.00 #DIV/0! - ME - #DIV/0! 0.00 #DIV/0! 0.00 #DIV/0! -
Supplier SQE + Sourcing Supplier - #DIV/0! 0.00 #DIV/0! 0.00 #DIV/0! -
- #DIV/0! 0.00 #DIV/0! 0.00 #DIV/0! -
- #DIV/0! 0.00 #DIV/0! 0.00 #DIV/0! -
Corporate Supplier - #DIV/0! 0.00 #DIV/0! 0.00 #DIV/0! -
Corporate System - #DIV/0! 0.00 #DIV/0! 0.00 #DIV/0! -
Price book Marketing Marketing - #DIV/0! 0.00 #DIV/0! 0.00 #DIV/0! -
- #DIV/0! 0.00 #DIV/0! 0.00 #DIV/0! -
Production Production Production - #DIV/0! 0.00 #DIV/0! 0.00 #DIV/0! - Planning Planning Planning - #DIV/0! 0.00 #DIV/0! 0.00 #DIV/0! -
Distribution Distribution - #DIV/0! 0.00 #DIV/0! 0.00 #DIV/0! -
OEM Engineering - #DIV/0! 0.00 #DIV/0! 0.00 #DIV/0! -
OEM + PQE - #DIV/0! 0.00 #DIV/0! 0.00 #DIV/0! -
OEM Engineering - #DIV/0! 0.00 #DIV/0! 0.00 #DIV/0! -
OEM + PQE - #DIV/0! 0.00 #DIV/0! 0.00 #DIV/0! -
Warranty Warranty Warranty - #DIV/0! 0.00 #DIV/0! 0.00 #DIV/0! - Others Others - #DIV/0! 0.00 #DIV/0! 0.00 #DIV/0! -
Total: - #DIV/0! 0.00 #DIV/0! 0.00 #DIV/0! -
Oct-15 Nov-15 Dec-15 YTD
TP $ FPR Cost $ Extra Cost $ TP $ FPR Cost $ Extra Cost $ TP $ FPR Cost $ Extra Cost $ Total CAR Cost $ TP $
Sales Sales
GCNA 0.00 #DIV/0! 0.00 #DIV/0! - #DIV/0! - SEA 0.00 #DIV/0! 0.00 #DIV/0! - #DIV/0! -
Corporate Engineering
Corporate Engineering
Corporate Engineering
Corporate Production
Corporate Production
Corporate Production
Corporate Supplier
Corporate Supplier
Corporate System
Corporate System
Price book+Product design
+BOM+Special design
Process Design Sustaining
EngineeringSustaining
Engineering
Plant Distribution
OEM Engineering in
CHN
OEM Engineering in CHN
OEM Supplier in CHN
OEM Supplier in CHN
OEM Engineering in
OAP
OEM Engineering in OAP
OEM Supplier in OAP
OEM Supplier in OAP
CAR Cost Ratio Function Goal
Shipment Cost $
Total CAR Cost $
Total CAR Cost Ratio
Shipment Cost $
Total CAR Cost $
Total CAR Cost Ratio
Shipment Cost $
Total CAR Cost Ratio
Corporate Engineering
Corporate Engineering
Corporate Engineering
Corporate Production
Corporate Production
Corporate Production
Corporate Supplier
Corporate Supplier
Corporate System
Corporate System
Process Design+Product
design+BOM+
Special design
Sustaining Engineering
Sustaining Engineering
Plant Distribution
OEM Engineering in
CHN
OEM Engineering in CHN
OEM Supplier in CHN
OEM Supplier in CHN
OEM Engineering in
OAP
OEM Engineering in OAP
OEM Supplier in OAP
OEM Supplier in OAP
CAR Cost Ratio Function Goal
Shipment Cost $
Total CAR Cost $
Total CAR Cost Ratio
Shipment Cost $
Total CAR Cost $
Total CAR Cost Ratio
Shipment Cost $
Total CAR Cost Ratio
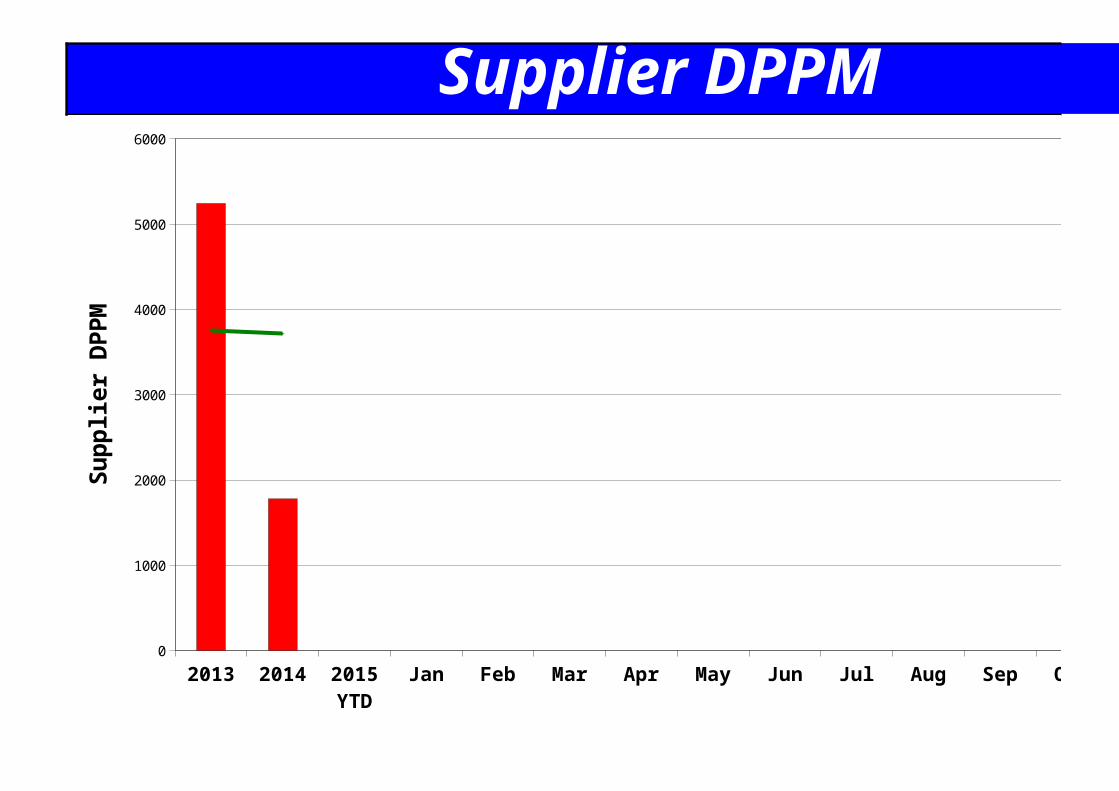
Supplier DPPM
Note: Major issue:2013 2014 2015 YTD Jan Feb Mar Apr May Jun Jul Aug Sep Oct Nov Dec 2013 2014 2015 YTD Jan Feb Mar Apr May Jun Jul Aug Sep Oct Nov Dec
Actual 5244 1780 NaN NaN NaN NaN NaN NaN NaN NaN NaN NaN NaN NaN NaN
Goal 3,758 3,716 NaN NaN NaN NaN NaN NaN NaN NaN NaN NaN NaN NaN NaN
500
1500
2500
3500
4500
5500
Supp
lier D
PPM
Supplier DPPM
2013 2014 2015 YTD Jan Feb Mar Apr May Jun Jul Aug Sep Oct Nov Dec 2013 2014 2015 YTD Jan Feb Mar Apr May Jun Jul Aug Sep Oct Nov Dec
Actual 5244 1780 NaN NaN NaN NaN NaN NaN NaN NaN NaN NaN NaN NaN NaN
Goal 3,758 3,716 NaN NaN NaN NaN NaN NaN NaN NaN NaN NaN NaN NaN NaN
500
1500
2500
3500
4500
5500
Supp
lier D
PPM
Supplier DPPM Pareto
Defect Qty NaN NaN NaN
1
3
5
7
9
11
Mo
nth
ly T
op
3 S
up
pli
er D
efec
t Q
ty P
aret
o

Supplier DPPM Pareto
Defect Qty NaN NaN NaN
1
3
5
7
9
11
Mo
nth
ly T
op
3 S
up
pli
er D
efec
t Q
ty P
aret
o
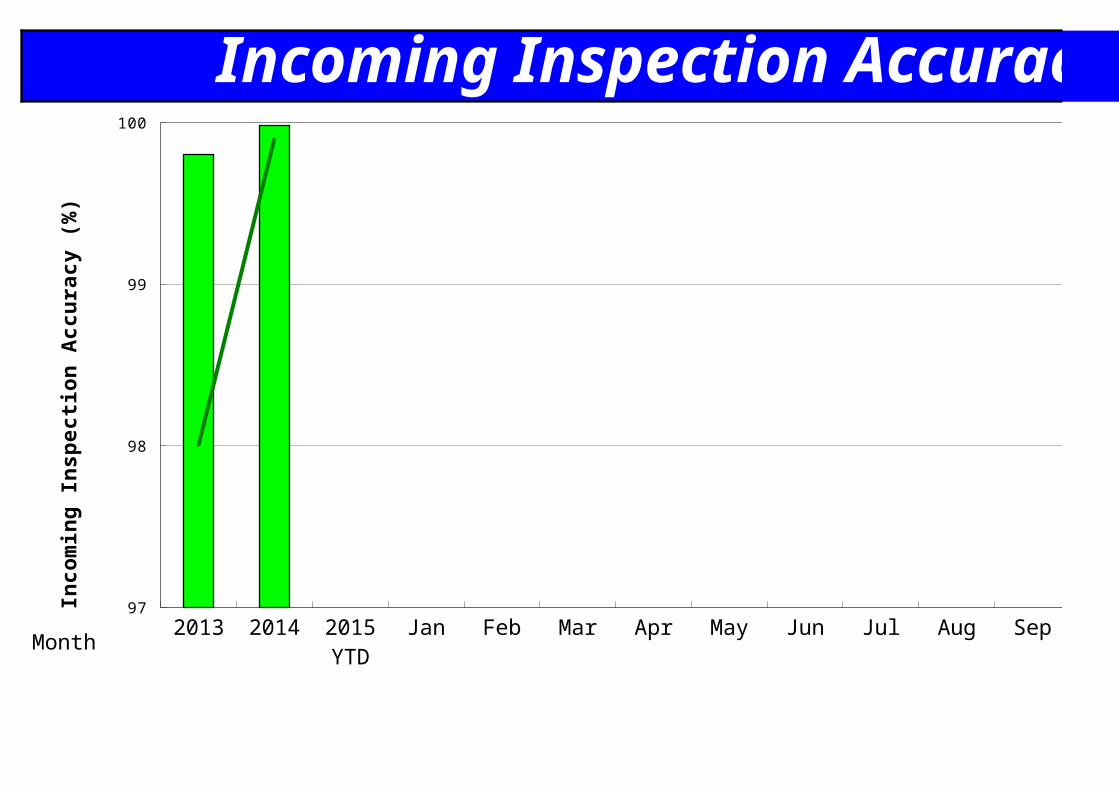
Incoming Inspection Accuracy
2013 2014 2015 YTD Jan Feb Mar Apr May Jun Jul Aug Sep Oct Nov Dec 2013 2014 2015 YTD Jan Feb Mar Apr May Jun Jul Aug Sep Oct Nov Dec
Actual 99.8 100.0 (Na.N) (Na.N) (Na.N) (Na.N) (N.aN) (N.aN) (N.aN) (N.aN) (N.aN) (N.aN) (N.aN) (N.aN) (N.aN)
Goal 98 99.9 (Na.N) (Na.N) (Na.N) (Na.N) (Na.N) (Na.N) (Na.N) (Na.N) (Na.N) (Na.N) (Na.N) (Na.N) (Na.N)
98
99
100
Month
Incom
ing In
spec
tion A
ccur
acy (
%)
Incoming Inspection Pareto
Defect Ratio #FMT #FMT #FMT
100.0%
300.0%
500.0%
700.0%
900.0%
1100.0%
Mo
nth
ly T
op
3 I
nc
om
ing
In
sp
ec
tio
n P
are
to

Incoming Inspection Pareto
Defect Ratio #FMT #FMT #FMT
100.0%
300.0%
500.0%
700.0%
900.0%
1100.0%
Mo
nth
ly T
op
3 I
nc
om
ing
In
sp
ec
tio
n P
are
to
On Time Incoming Inspection Pareto
Column M #FMT #FMT Na.N
100%
300%
500%
700%
900%
1100%
Chart Title
Mo
nth
ly T
op
3 I
nc
om
ing
In
sp
ec
tio
n P
are
to

On Time Incoming Inspection Pareto
Column M #FMT #FMT Na.N
100%
300%
500%
700%
900%
1100%
Chart Title
Mo
nth
ly T
op
3 I
nc
om
ing
In
sp
ec
tio
n P
are
to
On Time Incoming Inspection Rate
2014 2015 YTD Jan Feb Mar Apr May Jun Jul Aug Sep Oct Nov Dec 2014 2015 YTD Jan Feb Mar Apr May Jun Jul Aug Sep Oct Nov Dec
Actual (Na.N) (Na.N) (Na.N) (Na.N) (Na.N) (Na.N) (Na.N) (Na.N) (Na.N) (Na.N) (Na.N) (Na.N) (Na.N) (Na.N)
Goal NaN NaN NaN NaN NaN NaN NaN NaN NaN NaN NaN NaN NaN NaN
5
15
25
35
45
55
65
75
85
95
Month
On Ti
me In
comi
ng In
sepc
tion R
ate (%
)
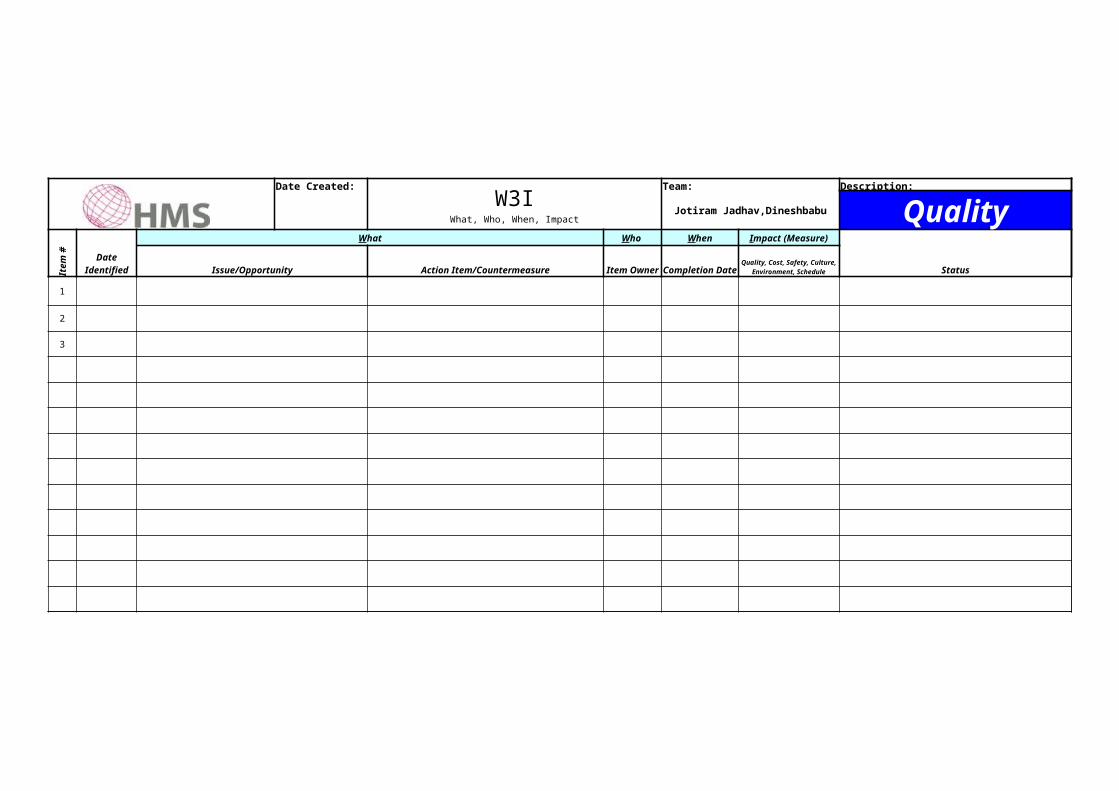
Date Created: Team: Description:
Jotiram Jadhav,Dineshbabu Quality
Ite
m #
StatusIssue/Opportunity Action Item/Countermeasure Item Owner Completion Date
1
2
3
W3IWhat, Who, When, Impact
Date Identified
What Who When Impact (Measure)
Quality, Cost, Safety, Culture, Environment, Schedule
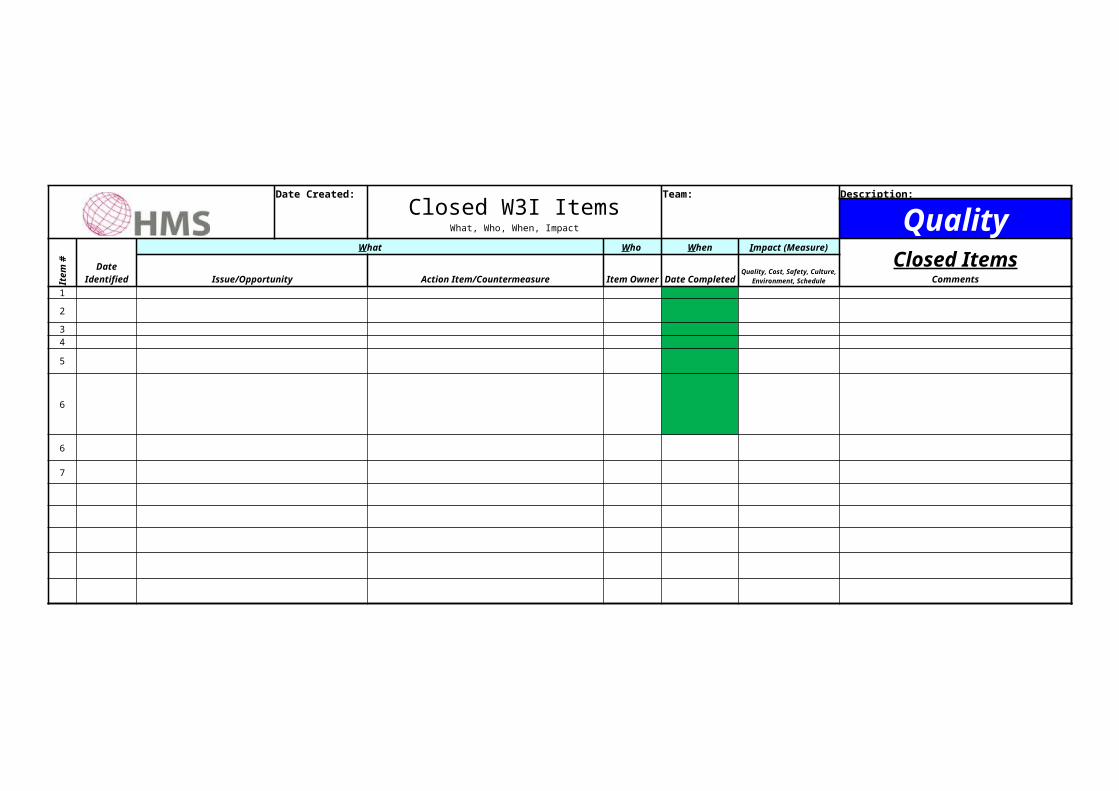
Date Created: Team:
Item
#
Issue/Opportunity Action Item/Countermeasure Item Owner Date Completed1
2
34
5
6
6
7
Closed W3I ItemsWhat, Who, When, Impact
Date Identified
What Who When Impact (Measure)
Quality, Cost, Safety, Culture, Environment, Schedule

Description:
QualityClosed Items
Comments


PlanDo
CheckAction

Plan

Plan
Do
Check
Action
Action

PlanDo
CheckAction
Plan

Plan
Do
Check
Action

Action