Embed Size (px)
Citation preview

Verah Bonareri Nyachwaya, Dr. James Ongwae Gichana
QUALITY MANAGEMENT PRACTICES
AND SUPPLY CHAIN PERFORMANCE
OF FOOD AND BEVERAGE FIRMS IN
NAIROBI CITY COUNTY IN KENYA
2021
12
Journal of Supply Chain Management
ISSN:2314-2896
Volume 2, Issue 2, pg. 12-22, 2021:https://grandmarkpublishers.com/
QUALITY MANAGEMENT PRACTICES AND SUPPLY CHAIN PERFORMANCE
OF FOOD AND BEVERAGE FIRMS IN NAIROBI CITY COUNTY IN KENYA
1Verah Bonareri Nyachwaya,
2Dr. James Ongwae Gichana
1Master Student (Procurement and Contract Management), Jomo Kenyatta University of
Agriculture and Technology 2Lecturer, Jomo Kenyatta University of Agriculture and Technology
Accepted: March 10, 2021
ABSTRACT
This study explored the relationship between quality management practices and supply chain
performance of food and beverage firms in Nairobi City County in Kenya. The study was
guided by two objectives: customer focus and supplier evaluation. The theoretical review of
the study was based on the theory of constraints and the Grey Systems theory. The study used
descriptive research design where the unit of analysis was 94 firms, from a total sample
framework of 123 through simple random sampling, which was obtained from a list of food
and beverage firms registered by KAM as of 2018. The supply chain managers of the
respective firms were the units of observation. SPSS version 21 was used to analyze
descriptive and inferential statistics. Multiple regression analysis was used to show the
relationship between dependent and independent variables whereas ANOVA tested the
significance level of the independent variables on the dependent. The regression model
results established an adjusted (R2)
of 0.674 at 95% confidence level implying that 67.4% of
changes in SCP were accounted for by the independent variables in the study. With a
correlation coefficient value of 0.875, the study established the presence of a positive and
significant relationship between quality management practices and supply chain performance
of food and beverage firms in Nairobi City County in Kenya.
Key words: customer focus, supplier evaluation, quality management, supply chain
INTRODUCTION
The 21st century has seen major shifts in supply chain practices where organizational
performance is largely dependent on the quality offering, drawing attention on the strategic
importance and criticality that SC plays, making it a strategic professional function that
progressively identifies the prominence of procurement quality controls (Munyimi, 2019).
Quality is a critical success factor because it determines customer satisfaction and offers the
ultimate source of competitive advantage. The ability to differentiate products in the market
is anchored on a business’ total offering on quality as it is able to continuously and
exceedingly satisfy, delight and retain its customers, leading to increased profitability (CIPS,
2012).
Firms are advised to keep an eye on internal efficiencies while at the same time adequately
manage their chains in a bid to improve performance and gain competitive advantage over
their opponents. Not only is quality management about finding and correcting manufacturing
defects, central to it is that quality must involve everyone in the internal and external supply
chains. Supply chain management stands to be a key driver of organizational performance
through creation of an avenue to meet customer needs and uphold the supplier-buyer
relationship (Wee, Thoo, Sulaiman & Muharam, 2016).

13
Journal of Supply Chain Management
ISSN:2314-2896
Volume 2, Issue 2, pg. 12-22, 2021:https://grandmarkpublishers.com/
Quality management refers to various online and offline processes used to ensure that the
right quality inputs and outputs are secured, products are fit for purpose and continuous
quality improvements are obtained overtime (CIPS, 2012). Traditionally, QM focused on
internal controls excluding the supply chain network thus yielding limited results that require
a shared focus (Chibba, 2017). This common focus according to Huy et al. (2016) involves
delivering the best-in-class quality products via cross-functional collaboration.
According to Hafeez (2019), SCM often exceeds its annual goals for cost saving. However,
costs increase due to reworks in production and poor-quality products delivered due to
negotiations that focus primarily on price rather than quality. As such, factors that impact on
increment of such costs should be taken into consideration. These factors include rejects that
need to be replaced, returned, scrapped or fixed; delays in re-works and replacements that
have negative impact on production schedule; product failure during testing at different levels
and; customer dissatisfaction after product is delivered and warranty costs (Hafeez, 2019)
There is limited knowledge pertaining SC quality performance (Hong, Zhang and Shi (2017).
The metrics of performance measurement for quality are not well understood. Most metrics
tend to be financial and qualitative. Some, such as order fulfilment and lead-time are
associated with logistics (Chibba, 2017). Quality management includes a quality planning
requirement along with policies, objectives and quantifiable targets and without this, the firm
may narrowly focus on costs as the main parameter for measurement.
Statement of the Problem
Thirty percent of supply chain problems are caused by the deficiencies on suppliers’ end due
to lack of supplier appraisal mechanisms that have seen a surge in poor quality deliveries,
long lead times and high product costs (Mutiso & Kiarie, 2016; Mutehia & Kihara, 2018).
Failure to conduct regular supplier audits, high rates of employee turnover and limited
finances are among the challenges hindering successful adoption of QM practices (Maundu,
2018). Despite knowledge of this, majority of suppliers are selected on the basis of lowest
price quoted while quality, time and other important aspects are regarded of little to no
importance (Hafeez, 2019). According to Mwende and Bula (2019), attempts to implement
QM strategies often fail because of lack of commitment by top management, who often times
delegate and pay lip service. Additionally, most employees in SC are not properly trained and
lack necessary skills (Aketch & Ngugi, 2013).
Hong et al. (2017) note that despite attracting considerable attentions to the concept of quality
and SCM, there is limited knowledge pertaining SCP and quality. Questions have been raised
regarding the quality aspects of SC. How the integration of customers and suppliers affect
quality and therefore influence performance results is not told. Neither are the parameters to
be used properly defined nor well understood (Chibba, 2017). Siongok and Noor (2016) also
note that existence of limited information on the role of QM practices has dented SCP. The
vastness and importance of this topic required conducting concentrated research on the
quality aspects of SC. It was against this background information that this study set forth to
unravel the relationship between QM practices and SCP while focusing on food and beverage
firms in Nairobi City County in Kenya.
Specific Objectives
i. To examine the relationship between customer focus and supply chain performance of
food and beverage firms in Nairobi City County in Kenya.

14
Journal of Supply Chain Management
ISSN:2314-2896
Volume 2, Issue 2, pg. 12-22, 2021:https://grandmarkpublishers.com/
ii. To find out the relationship between supplier evaluation and supply chain
performance of food and beverage firms in Nairobi City County in Kenya.
LITERATURE REVIEW
Theoretical Review
Theory of constraints
Developed by Dr. Eliyahu M. Goldratt, TOC is a management philosophy that seeks to
identify the most important limiting factor i.e. constraint, standing in the way of improving
performance (Lagat & Kihara, 2017). The constraint is referred to as the bottleneck. The total
throughput of the process can only be improved through the improvement of the constraint
(Puche, Costas, Pino & De la Fuente, 2016). TOC is of the precept that a chain is only as
strong as the weakest link and seeks to elevate and manage the constraint as necessary since
the constraint governs the output (Lagat & Kihara, 2017). According to Puche et al. (2016),
any improvements not directed to the bottleneck is a waste. Thus, all breakthrough
improvements must be focused on the constraint. The theory is comprised of three main
areas: logical thinking, performance measurement, and operations.
According to Landau (2018), TOC is based on three steps: identifying the system constraint;
manipulating the constraint to obtain maximum capabilities and; subjecting non-constraint
components to enable the constraint operate at maximum effectiveness. The process is
repeated over again once another constraint is identified. Should 2nd
and 3rd
steps fail, Rattner
(2006) notes that BPR is inevitable at this point. TOC can be applicable in this study where
customer focus is viewed as a constraint. Some of the bottlenecks according to Sang and
Kihara (2016) include long lead times, absence of customer engagement, wrong material
order and absence of control related to priority orders causing resource schedule conflicts
among others. Customers are the ultimate definers of value and the ultimate drivers for
delivering quality. Recognizing customers as the definers of value, discovering and satisfying
their needs underpins quality thinking (CIPS, 2012).
Conceptual Framework
Figure 1: Conceptual Framework
Customer Focus
Product specification
Feedback mechanism
Demand pull
Supplier Evaluation
Accreditation with
quality standards
Quality controls
Financial position
Supply Chain Performance
Speed
Cost
Dependability
Independent Variables Dependent Variable

15
Journal of Supply Chain Management
ISSN:2314-2896
Volume 2, Issue 2, pg. 12-22, 2021:https://grandmarkpublishers.com/
Empirical Review
Reimann, Lunemann and Chase (2008) studied the relationship between customer focus and
performance of firms in American service firms. The study used in-depth field interviews and
a large-scale, cross-industry survey. Customer focus dimensions such as communication,
customer focus technology, and interaction and customer focus orientation were embraced by
most service firms. The results revealed that customer focus did not affect firm performance
directly however; it led to improved sales growth and reduction of cost.
Coltman, Devinney and Midgley (2011) studied the link between CRM and firm performance
of services firms in Europe. The study adopted a cross-sectional survey of 100 banks.
Questionnaires were used to collect data which was and results from the findings concluded
that customer focus led to an increase in customers which resulted into increased sales and
performance. Hyung–Su (2012) studied the impact of customer focus as a strategy on
performance of service firms in Shanghai, China. The study adopted a cross-sectional
research design. Questionnaires and interviews were used to collect primary data. The results
revealed that customer focus technology and knowledge management were popular customer
focus strategies used by service firms. Further, it was revealed that customer focus as strategy
improved efficiency and reduction in marketing costs which contributed positively towards
improved organizational performance.
There is a positive association between procurement performance and supplier appraisal and
supplier performance evaluation (Oriri & Bichanga, 2015). Therefore, procuring entities
should transparently appraise prospective suppliers to enhance procurement performance and
as an assurance to get value for money. Mutiso and Kiarie (2016) agree that lack of supplier
appraisal leads to poor procurement performance, which is attributed to poor quality
products, long lead times and high cost products. In yet another study, it was found that
supplier evaluation is critical in SCP and that the process is also a strategy to evaluate and
give feedback on supplier improvement. Supplier certification, supplier quality control
capability and overall supplier performance are key areas to be evaluated (Njoroge &
Mwangangi, 2018). Philip and Kihara (2017) affirm that a supplier’s financial status and
quality of goods has significant influence on procurement performance. However, Kitheka
and Mulwa (2013) note that buyers are not keen on supplier quality management issues
particularly where it requires investing considerable resources to assist the supplier.
Another study by Maundu (2018) on supplier quality management concluded that commonly
applied SQM practices by cement manufacturing firms are performance measurement and
monitoring, competitive supplier selection, supplier development, supplier audit and supplier
integration, used to enhance quality and speed of delivery. However, it was noted that failure
to conduct regular supplier audits, high rates of employee turnover and limited finances are
among the challenges hindering successful adoption of SQM practices.
RESEARCH METHODOLOGY
This study employed descriptive research design. The target population in this study was food
and beverage firms in Nairobi City County that were registered with KAM. There were 123
food and beverage firms registered under KAM within Nairobi City County as of 2018
(KAM, 2018). The sampling frame used was drawn from a list of food and beverage firms
that are registered with KAM. As of 2018, there were 123 firms registered (KAM, 2018).
Multiple regression analysis was used to predict the correlation between QM practices and
SCP. The study used the analysis of variance (ANOVA) to test the independence of variables
16
Journal of Supply Chain Management
ISSN:2314-2896
Volume 2, Issue 2, pg. 12-22, 2021:https://grandmarkpublishers.com/
on the dependent variable at 95% confidence level and 0.05 significance level.The data was
tabulated and quantitatively analyzed into percentages, frequency tables and pie charts
accordingly. Conclusions and recommendations were drawn from qualitative data that was be
presented in narration form.
RESEARCH FINDINGS
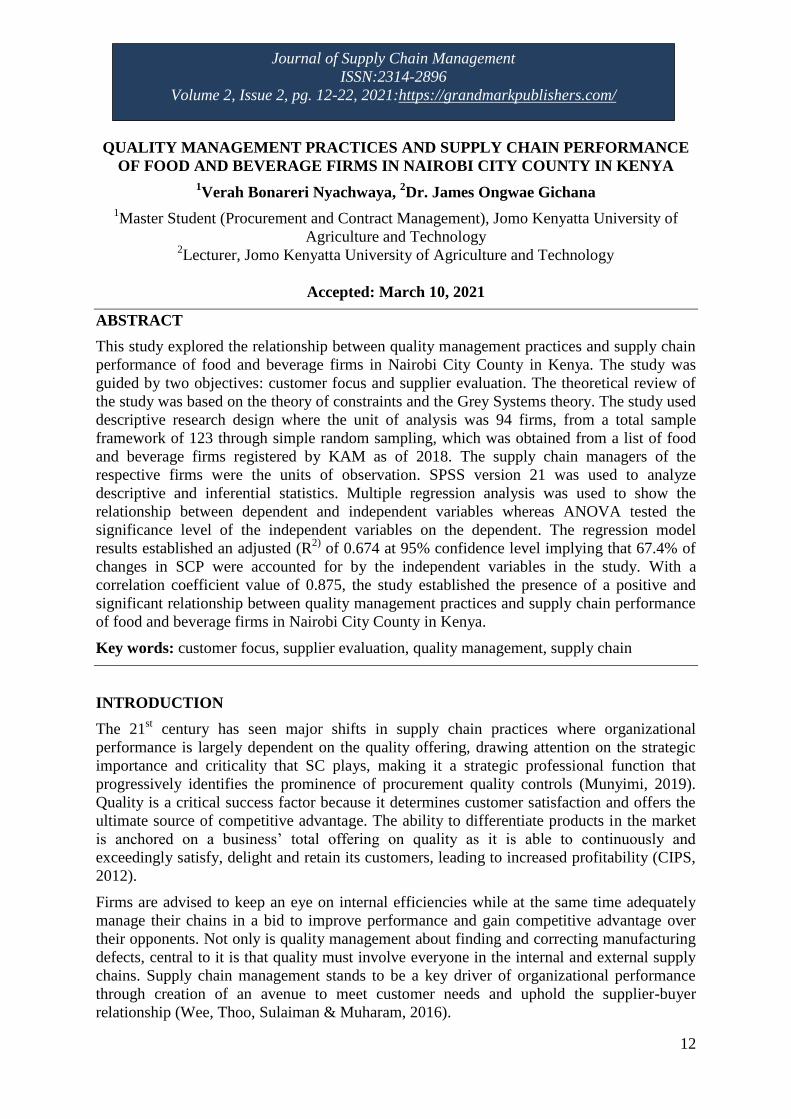
Out of the 94 questionnaires, 78 were returned representing 83% response rate. According to
Mugenda & Mugenda (2012), a response rate of 70% and above is considered acceptable for
research purposes.
Descriptive Analysis
Customer focus
The respondents were asked to indicate the extent to which surveys on customer needs,
customer involvement in specification development, feedback information on quality of
products, firm’s management action on customer complaints, customer-initiated orders before
production or processing and production based on demand forecasting were used to improve
customer focus in their organizations. The results showed a mean of 3.07 for surveys, 3.64
for specification development, and 3.77 for feedback information sharing, 3.86 for the firms’
perception of customer complaints, 3.95 for customer-initiated orders and 4.02 for production
based on demand forecasting. According to the results, the respondents agreed that their firms
focused on their customers to improve their SCP. Further, a standard deviation of 0.709,
0.945, 0.869, 0.954, 0.869, 0.896 and 0.917 showed that the respondents did not differ
significantly in their views. The findings are in tandem with Macharia and Mwangagi (2016)
who revealed that customer focus is the most overriding feature in TQM that influenced
procurement performance in terms of cost, time, dependability and flexibility. Hence, the
overarching goal of any firm should be to identify customers’ needs then plan how to meet
them.
Table 1: Mean and Standard Deviation on Customer Focus
Statement N Mean Std.
Deviation
We frequently conduct surveys on customer needs 78 3.07 .709
Customers are actively involved in product specification development. 78 3.64 .945
Feedback information regarding the quality of products e.g. defects is
shared throughout the firm.
78 3.77 .869
The firm management perceives customer complaints as opportunities
to enable the firm to improve on quality service delivery.
78
3.86 .954
Customers initiate orders before production or processing. 78 3.95 .896
Production is done based on the demand forecast. 78 4.02 .917
Supplier Evaluation
The respondents were asked to indicate the extent of supplier accreditation to quality
standards, certification of suppliers versus quality techniques needed, guidelines and
procedures to control the quality of suppliers in the firm, testing of supplies to compare with
sample and specifications given to suppliers, keenness to evaluate the financial capability of
the supplier before awarding contracts and selection of supplier with lower price over the one
with quality were used to evaluate suppliers in their organizations.

17
Journal of Supply Chain Management
ISSN:2314-2896
Volume 2, Issue 2, pg. 12-22, 2021:https://grandmarkpublishers.com/
The results show a mean of 4.37 for supplier accreditation to quality standards, 3.95 for
certification of suppliers versus quality techniques needed; 4.41 for guidelines and procedures
to control quality of suppliers in the firm; 4.34 for testing of supplies to compare with sample
and specifications given to suppliers; 3.86 for keenness to evaluate the financial capability of
the supplier before awarding contracts; and 4.30 for selection of supplier with lower price
over the one with quality. According to the results, the respondents agreed that supplier
evaluation related to their firm’s SCP. Further, a standard deviation of 0.899, 0.896, 0.798,
0.607, 0.954 and 0.755 showed that the respondents did not differ significantly in their views.
It was thus established that supplier evaluation was applied by the firms. Table 4.8 presents
the results. The findings are consistent with those of Katheo and Mwangagi (2018) who
revealed the importance of subjecting suppliers to quality management assessment in order to
curb/reduce delivery of poor-quality supplies. It was duly noted that the rate of rejects from
suppliers is a clear reflection of supplier’s QM and control systems. The findings are further
echoed by Mwikali and Kavale (2012) who found out that quality management assessment of
suppliers helps reduce procurement costs associated with non-conformance.
Table 2: Mean and Standard Deviation on Supplier Evaluation
Statement N Mean Std.
Deviation
We ensure that suppliers selected are accredited with quality standards 78 4.37 .899
We believe certification does not necessarily imply suppliers do
actually possess quality techniques needed
78 3.95 .896
There are guidelines and procedures to control the quality of the
suppliers in our firm
78 4.41 .798
There is strong emphasis on testing supplies to ensure they compare
with the sample and specifications given to the suppliers.
78 4.34 .607
The firm is keen to evaluate the financial capability of the supplier
before awarding contracts
78 3.86 .954
We select supplier with lower price suppliers over the one with quality. 78 4.30 .755
Inferential Statistics
Correlation
The study conducted correlation analysis to unravel the relationship between QM practices
and SCP. To code, enter and compute the Pearson correlation coefficient (r), the Statistical
Package for Social Scientists (SPSS) version 21 was used. The Pearson correlation
coefficient measures the strength of a linear relationship between two or more variables
whose value ranges from -1 (in the presence of a perfect negative correlation) to +1 (when
there is a perfect positive correlation). The closer the value to zero the smaller is the degree of
linear association (Boslaugh, 2012).
Results shown in Table 4.14 found a positive and significant relationship between customer
focus and SCP as indicated by a positive Pearson correlation (r=.367, P=0.002<0.05),
implying that if customer focus increases, SCP also increases. These findings are in tandem
with Macharia and Mwangagi (2016) who revealed that customer focus influenced
procurement performance in terms of cost, time and customer satisfaction.
A positive and significant relationship was also unravelled between supplier evaluation and
SCP (r=.367, P=0.005<0.05), implying that if supplier evaluation increases, SCP increases as
well. The findings concur with Mutethia and Kihara (2018) who observed that supplier
evaluation improved the productivity and hence performance.

18
Journal of Supply Chain Management
ISSN:2314-2896
Volume 2, Issue 2, pg. 12-22, 2021:https://grandmarkpublishers.com/
Table 7: Correlation
Supply Chain
Performance
Customer
Focus
Supplier
Evaluation
Supply Chain
Performance
Pearson Correlation 1
Sig. (2-tailed)
N 78
Customer
Focus
Pearson Correlation .367** 1
Sig. (2-tailed) .000
N 78 78
Supplier
Evaluation Pearson Correlation .367** .498** 1
Sig. (2-tailed) .000 .000
N 78 78 78
Regression Analysis
Multiple linear regression analysis was used to determine the relationship between
independent (customer focus, supplier evaluation) and dependent (SCP) variables. The
coefficient of determination R square (R2) was used to measure the proportion of variance in
the dependent variable (SCP) that could be explained by the four independent variables as
accounted for by the regression model and then adjusted to measure the proportion of
variation that could only be explained by those independent variables that really helped in
explaining the dependent variable. Table 4.15 shows the results.
Table 8: Regression Model Summary
Model R R2 Adjusted R
2 Std. Error of the Estimate
.825 .680 .674 .021
a. Predictors: (Constant), customer focus, supplier evaluation, IMP, QIM.
The coefficient of determination R2
was 0.680 indicating that 68% of SCP can be attributed to
customer focus, supplier evaluation, inventory management practices and quality
implementation measures. This implies that the remaining 32% of SCP is accounted for by
other factors not captured in this research.
If the independent variables of this study could have changed, the study results could have
varied by 32.6% as indicated by the adjusted R2
value of 0.674 at 95% confidence level,
implying that the results are 67.4% valid. Conversely, results of the correlation coefficient R,
showing the relationship between the study variables stood at 0.825 indicating the existence
of a strong positive relationship between QM practices and SCP.
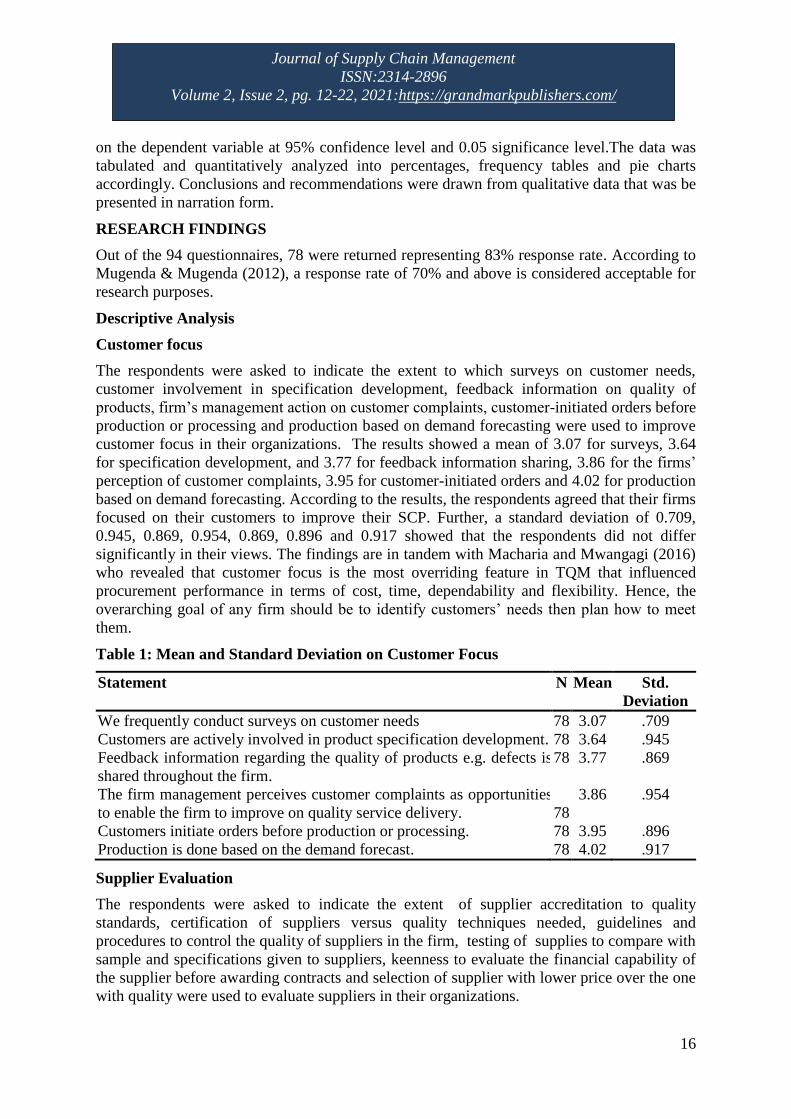
Analysis of Variance (ANOVA)
ANOVA was used to determine whether the overall multiple regression model was fit in
establishing the relationship between QM practices and SCP. The ANOVA Test or F-test
results indicated a high degree of fit as reflected by the calculated F value of 44.324 which is
greater than F Critical (4.544) at 5% significance level.
Since the significance level (0.000) is less than 0.05 (0.000< 0.05), it was concluded that the
model was statistically significant and hence fit in predicting how the four independent
variables influenced SCP (Y-dependent variable). Table 4.16 presents the ANOVA results.
19
Journal of Supply Chain Management
ISSN:2314-2896
Volume 2, Issue 2, pg. 12-22, 2021:https://grandmarkpublishers.com/
Table 9: ANOVA results
Model Sum of Squares d.f Mean Square F Sig.
Regression 39.398 4 9.850 44.324 .000
Residual 18.483 74 .250
Total 57.881 78
F-Critical Value = 4.544
Regression Model Coefficients
Table 10: Coefficient Results
Model Unstandardized
Coefficients
Standardized
Coefficients
t Sig.
Β Std. Error β
(Constant) 7.890 2.952 2.673 .000
Customer focus .876 .143 .522 6.123 .002
Supplier evaluation .832 .187 .458 4.449 .005
The coefficient results obtained on table 10, determined the regression equation to be:
Supply chain performance = 7.890 + 0.876 (customer focus) + 0.832 (supplier evaluation)
From the regression equation results, holding customer focus, supplier evaluation, inventory
management practices and quality implementation measures at a constant zero, the SCP of
the respective food and beverage firms in Nairobi City County is 7.890 units.
The study results also revealed that holding all other factors constant, a unit increase in
customer focus resulted in 0.876 (β =0.876) increase in SCP. Since the p-value 0.002<0.05,
the relationship was statistically significant. It was established that a unit increase in supplier
evaluation resulted in 0.832 (β =0.832) increase in SCP and since p-value 0.005<0.05, the
relationship was deemed statistically significant as well.
Conclusion
Customer Focus
The study revealed that defining value, and hence quality in the eye of the customer improved
SCP. Respondents affirmed that the customer focus strategies employed led to improved
product specification development since customers were the definers of value, customer
feedback provided a mechanism by which firms were able to identify loopholes in quality
service delivery and that more firms opted for demand-push as opposed to those that adopted
a demand-pull strategy. Further, regression analysis test of correlation revealed the existence
of a close association between customer focus and SCP. This implied that customer focus
plays a significant role in improving SCP and hence, the presence of a significant relationship
between customer focus and SCP.
Supplier evaluation
Supplier appraisal or evaluation was widely practiced in an effort to enhance the quality
offering of prospective suppliers and vendors. Results indicated that accreditation with
quality standards was an important criterion to appraise although it did not necessarily imply
that the supplier actually possessed the quality techniques needed hence the need for further
subjection to other assessment parameters. There was also emphasis on testing of supplies to

20
Journal of Supply Chain Management
ISSN:2314-2896
Volume 2, Issue 2, pg. 12-22, 2021:https://grandmarkpublishers.com/
ensure they conformed to specifications. Majority indicated that they would select a supplier
with lower price over quality. The firms were also keen to evaluate the financial capability of
suppliers before awarding contracts. Further, it was revealed that supplier evaluation
statistically and positively impacted SCP as evidenced by the regression analysis test and
correlation results. This implies that supplier evaluation plays a significant role towards SCP.
The study therefore affirms of the presence of a significant relationship between supplier
evaluation and SCP.
Recommendations
The study recommends that food and beverage firms should always seek to define quality
from the customer’s perspective then plan around on methods and strategies that will satisfy
or even exceed customer’s expectations. One of the most useful tools that can be used is the
QFD that uses the VoC to define value. There is also need to ensure regular surveys are done
on customer needs since tastes and preferences tend to change over time. In order to
maximize on returns, quality should be designed and built into the product right from the start
in order to escape cost of non-conformance. Strategies should be tailored around quality
needs in terms of supplier evaluation, inventory management practices and quality
implementation measures. Further, the study recommends that each firm should come up with
a clear QMS that is spearheaded by the top management to facilitate inspiration and buy-in
by employees. Regular training on quality should be done to ensure that employees upgrade
their skills and knowledge to meet the fast-changing needs of customers and best practices.
Efforts must be made to implement QM practices that are not effectively practiced in the
study are such as the JIT strategy in order to improve SCP.
REFERENCES
Aketch, J., & Ngugi, P. K. (2013). Factors influencing procurement performance in
Constituency Development Fund (CDF): A Case of CDF use in Makadara
Constituency. International Journal of Social Sciences and Entrepreneurship, 1 (2),
42-57.
Ambe, I.M. (2014). Key Indicators for Optimising SupplyChain Performance: The Case of
Light Vehicle Manufacturers in South Africa. The Journal of Applied Business
Research, 30(1), 277-289.
Chepket, W. K., & Cheluget, D. C. (2017). Effect of Total Quality Management Practices on
Organizational Performance in Tertiary Institutions, Kenya. International Journal of
Economics, Commerce and Management, United Kingdom, 5(2), 521-523.
Chibba, A. (2017). Supply Chain Quality Management- Exploring performance of
manufacturing organisations (Ph.D.). Luleå University of Technology.
Coltman, T., Devinney, T. M. & Midgley, D. F. (2011). Customer relationship management
and firm performance. Journal of Information Technology, 26 (3), 205-219.
David, B., (2005). Regression: a dimension of personality. Newyork: Free Press.
Ellen, S., (2018). Slovin’s Formula Sampling Techniques. Sciencing. Retrieved January 15,
2020, from https://sciencing.com/slovins-formula-sampling-techniques-5475547.html
Estampe, D. 2014. Supply chain performance and evaluation models. London: ISTE.
Ettlie, J. E., & Johnson, M. D. (1994). Product development benchmarking versus customer
focus in applications of quality function deployment. Marketing Letters, 5(2), 107–
116.

21
Journal of Supply Chain Management
ISSN:2314-2896
Volume 2, Issue 2, pg. 12-22, 2021:https://grandmarkpublishers.com/
Fernandes, C. A., Sampaio, P., Carvalho, M.S. (2014). Quality Management and Supply
Chain Management Integration: A Conceptual Model. In International Conference on
Industrial Engineering and Operations Management.
GOK. (2012). Vision 2030 Milestones. Nairobi: State Department for Trade.
GOK. (2018). Eye on the ‘Big Four’: Budget Watch For 2018/19 And the Medium Term.
Gurahoo, N. & Salisbury, R.H. (2018) Lean and agile in small‐ and medium‐ sized
enterprises: Complementary or incompatible? South African Journal of Business
Management., 49, a11. doi:10.4102/sajbm. v49i1.11
Hafeez, A. (2019). Role of Quality in Supply Chain Management. CIO Review. Retrieved
January 26, 2020, from https://supply-chain.cioreview.com/cxoinsight/role-of-quality-
in-supply-chain-management-nid-4519-cid-78.html
Hong, J., Zhang, Y., & Shi, M. (2017) The impact of supply chain quality management
practices and knowledge transfer on organisational performance: an empirical
investigation from China. International journal of Logistics, 21(17), 259–278.
ISO 9001 (2015). Quality Management System-Requirements. ISO International Organization
for Standardization, Geneva.
Juma, S. J. (2016). Continuous improvement practices and product quality performance at
TATA chemicals Magadi limited. 97.
Juran, J., & Defao, J. (2010). Quality Handbook: The complete Guide to Performance
Excellence. McGraw-Hill; New York.
Kaplan, R.S. and Norton, D.P. (1992), “The balanced scorecard--measures that drive
performance”, Harvard Business Review. 70(1), 71-79.
Katheo, S. & Mwangangi, P. (2018). Influence of supplier selection criteria on performance
of Public Tertiary Training Institutions in Kenya. Journal of International Business,
Innovation and Strategic Management, 1 (5),106-127.
Lagat, R., K., & Kihara, A. (2017). Influence of Inventory Management Practices on
Procurement Performance Among Manufacturing Firms in Nairobi City County,
Kenya. International Journal of Human Resources and Procurement, 6, 60 – 75.
Landau P. (2018). Theory of Constraints: A Guide for Project Managers.
Lee, M.-S., Lee, Y.-H., & Jeong, C.-S. (2003). A high-quality-supplier selection model for
supply chain management and ISO 9001 system. Production Planning & Control,
14(3), 225–232.
Leończuk, D. (2016). Categories of Supply Chain Performance Indicators: An Overview of
Approaches. 14(1), 103–115. doi:10.3846/bme.2016.317.
Maundu, J., (2018). Supplier Quality Management and Operational Performance of Cement
Manufacturing Firms in Kenya. 62.
Mishra, D., Gunasekaran, A., Papadopoulos, T., & Dubey, R. (2018). Supply chain
performance measures and metrics: A bibliometric study. Benchmarking: An
International Journal.
Mkonu, A. M., & Gichana, D. J. O. (2019). Relationship Between Inventory Management
Policies and Supply Chain Performance of Retail Supermarkets in Nairobi City
County in Kenya. International Journal of Supply Chain and Logistics, 3(2), 62-83.
Mutiso, S., & Mburu, David Kiarie. (2016). Influence of Supply Base Leveraging Practices
on Procurement Performance Among Public Institutions In Kenya: A Case Of Kenya
Forest Service. International Journal of Human Resources and Procurement, 5(10),
519-563.

22
Journal of Supply Chain Management
ISSN:2314-2896
Volume 2, Issue 2, pg. 12-22, 2021:https://grandmarkpublishers.com/
Mutua, R., M. & Mburu, D., K. (2017). Effects of Total Quality Management on Logistics
Performance in Humanitarian Organizations in Kenya: A Case of World Food
Program Kenya Chapter. International Journal of Human Resources and
Procurement. 6 (5), 49 – 83.
Narasimhan, R., Talluri, S., & Mendez, D. (2001). Supplier evaluation and rationalization via
data envelopment analysis: An empirical examination. Journal of Supply Chain
Management, 37(2), 28–37.
Njoroge, A., K. & Mwangangi, P. (2018) Influence of Supplier Development on Procurement
Performance Among Public Universities in Kenya. International Journal of Human
Resources and Procurement, 7(10), 23 –42.
Nyamwaro, L. K., & Moronge, M. (2018). Influence of Quality Management on Supply
Chain Performance of Food Manufacturing Firms in Nairobi City County, Kenya. The
Strategic Journal of Business and Change Management. 5(2), 1933-1956.
O’Byrne, R. (2016). Changing Your Perspective to Measure Supply Chain Performance.
Retrieved July 14, 2018, from https://www.logisticsbureau.com
Puche, J., Ponte, B., Costas, J., Pino, R., & De la Fuente, D. (2016). Systemic approach to
supply chain management through the viable system model and the theory of
constraints. Production Planning & Control, 27(5), 421–430.
Rattner, S. (2006). What is the Theory of Constraints, and How Does it Compare to Lean
Thinking? | Lean Enterprise Institute. Retrieved January 26, 2020, from
https://www.lean.org/common/display/?o=223
Reimann, M., Lunemann, U., & Chase, R. B. (2008). Uncertainty avoidance as a moderator
of the relationship between perceived service quality and customer satisfaction,
Journal of Service Research, 11(1), 63–73.
Rioba E. M. (2015), Manufacturing Industry and Economic Growth in Kenya: A Kaldorian
Approach for (1971-2013).
Siongok, W. C. & Noor, S. I. (2016). Role of quality control system on procurement
performance in Kenyan State Corporation: A case of Kenya National Highways
Authority. International Academic Journal of Procurement and Supply Chain
Management, 2(2), 149-178.
Srinivasan, M., Mukherjee, D., & Gaur, A. S. (2011). Buyer–supplier partnership quality and
supply chain performance: Moderating role of risks, and environmental uncertainty.
European Management Journal, 29(4), 260–271.
Sroufe, R., & Curkovic, S. (2008). An examination of ISO 9000: 2000 and supply chain
quality assurance. Journal of Operations Management, 26(4), 503–520.
Stefanovic, N. (2014). Proactive Supply Chain Performance Management with Predictive
Analytics. The Scientific World Journal, 2014, 528917.
Strahwald, J., & Sucky, E. (2018). Supply Chain Performance Measurement: A Case Study.
Talib, F., Rahman, Z., & Qureshi, M. N. (2011). A study of total quality management and
supply chain management practices. International Journal of Productivity and
Performance Management, 60(3), 268–288.
Wee, S.Y., AC Thoo, A. C., Sulaiman, Z., & Muharam, F.M. (2016). A Review of Supply
Chain Collaboration Practices for Small and Medium-sized Manufacturers 2016.
Materials Science and Engineering, 131(2016), 012008 doi:10.1088/1757-
899X/131/1/012008.
Zhang, H.; Okoroafo, S. C. 2015. Third-party logistics (3PL) and supply chain performance
in the Chinese market: a conceptual framework, Engineering Management Research.
4(1), 38–48. http://dx.doi.org/10.5539/emr.v4n1p38