Embed Size (px)
Citation preview
PRESENTED BY: MOHAMAD Y. JABER
J A B E R , M Y, G U I F F R I D A , A L
E U R O P E A N J O U R N A L O F O P E R AT I O N A L R E S E A R C H
V O L . 1 5 9 , N O . 3 , P P. 6 6 3 - 6 7 2 , 2 0 0 4 .
Learning curves for processes
generating defects requiring
reworks

Presentation Outline
Eur. J. Oper. Res., vol.159, no.3, pp. 663-672, 2004.
2
Introduction
Learning-quality relationship
Plateaunig
The mathematical model
Behavioural patterns of the model
Some numerical results
Conclusions
Future research
Introduction: Learning curve (1/2)
Eur. J. Oper. Res., vol.159, no.3, pp. 663-672, 2004.
3
Learning curves have been receiving increasing
attention by researchers and practitioners for almost
seven decades.
The earliest learning curve representation is a geometric
progression that expresses the decreasing time required
to accomplish any repetitive operation.
The theory in its most popular form states that as the
total quantity of units produced doubles, the time per
unit declines by some constant percentage.

Introduction: Learning curve (2/2)
Eur. J. Oper. Res., vol.159, no.3, pp. 663-672, 2004.
4
The form of the learning curve has been debated by
many researchers and practitioners.
Even though the Wright’s learning curve (WLC; Wright,
1936) is the most widely used and accepted, still it
could not be regarded as a universal model.
The Learning curve can describe the performance of an
individual in a group, and a group in an organization.
Technological progress is a kind of learning.

Introduction: Some limitations (1/2)
Eur. J. Oper. Res., vol.159, no.3, pp. 663-672, 2004.
5
Researchers have debated whether cumulative output
alone is an adequate measure of organizational
knowledge.
The WLC (Wright, 1936) uses cumulative output as a
proxy variable for knowledge (Argote, 1999).
Dutton & Thomas (1984) stated that predictions of
learning curve benefits using only cumulative output as
a policy variable had proven to be unreliable.
All units produced conform to quality (no defects)!

Introduction: Some limitations (2/2)
Eur. J. Oper. Res., vol.159, no.3, pp. 663-672, 2004.
6
Researches have suggested using time of good units (Fine, 1986), (Lieberman, 1987), equivalent number of units (Globerson et al., 1995), depreciation of knowledge or forgetting (1999) rather than cumulative production.
The WLC is unable to capture the plaeauing phenomenon observed in learning curve data since as cumulative approach a very large value performance approaches zero!
Introduction: Research questions
Eur. J. Oper. Res., vol.159, no.3, pp. 663-672, 2004.
7
Primary: Researchers have not yet reached a consensus on
whether cumulative output is an adequate measure of
organizational knowledge (experience).
Secondary: Nor they have reached a plausible explanation
to what causes plateauing observed in learning data.
Learning-quality relationship (1/2)
Eur. J. Oper. Res., vol.159, no.3, pp. 663-672, 2004.
8
Abernathy et al. (1981) and Fine (1986) related the question of why some organizations learn faster than their competitors to product quality.
Productivity increases follow from quality improvement efforts (Deming, 1982).
Lower quality implies higher scrap and rework, which in turn means wasted material, intensive, equipment time, and other resources (Gravin, 1988).
Learning affects worker performance, which ultimately can affect product quality (Badiru, 1995).

Learning-quality relationship (2/2)
Eur. J. Oper. Res., vol.159, no.3, pp. 663-672, 2004.
9
Learning is the bridge between quality improvement
and productivity increase (Li and Rajagopalan,1997).
Knowledge depreciation negatively impacts quality (Li
and Rajagopalan,1997).
Attempts to model the Quality Learning Curve are
found in Vits and Gelders (2002), Lapré and Van
Wassenhove (2003), Franceschini and Galetto (2003),
and Allwood and Lee (2004).
Plateauing
Eur. J. Oper. Res., vol.159, no.3, pp. 663-672, 2004.
10
Plateauing occurs when the learning process cease.
This process is observed in learning data.
Conway and Schultz (1959) experienced one product
which ceased to progress in one industry but continued to
progress when transferred to another industry.
No consensus among researchers to what
causes plateauing.
Eur. J. Oper. Res., vol.159, no.3, pp. 663-672, 2004.
11
Baloff (1966, 1970) more likely to occur in machine-intensive than in labor-intensive industries.
Corlett and Morcombe (1970) related plateauing to either to consolidate what has already been learnt before making further progress, or to forgetting.
Plateauing could be strongly associated with labor ceasing to learn, or to management’s unwillingness to invest additional capital in order to generate the technological improvements necessary for the continuation of the learning process (Yelle, 1980).
Li and Rajagopalan (1998) attributed plateauing to depreciation in knowledge.

Mathematical model-WLC
Eur. J. Oper. Res., vol.159, no.3, pp. 663-672, 2004.
12
The Wright’s learning curve (WLC; Wright, 1936) is
represented as
y(x) = y(1) x -b (1)
where y(1) is the time to produce the first unit, b is the
learning exponent (0 < b < 1), x the cumulative
production, and y(x) is the time to produce (perform)
the xth unit (repetition).
Mathematical model-Porteus model
Eur. J. Oper. Res., vol.159, no.3, pp. 663-672, 2004.
13
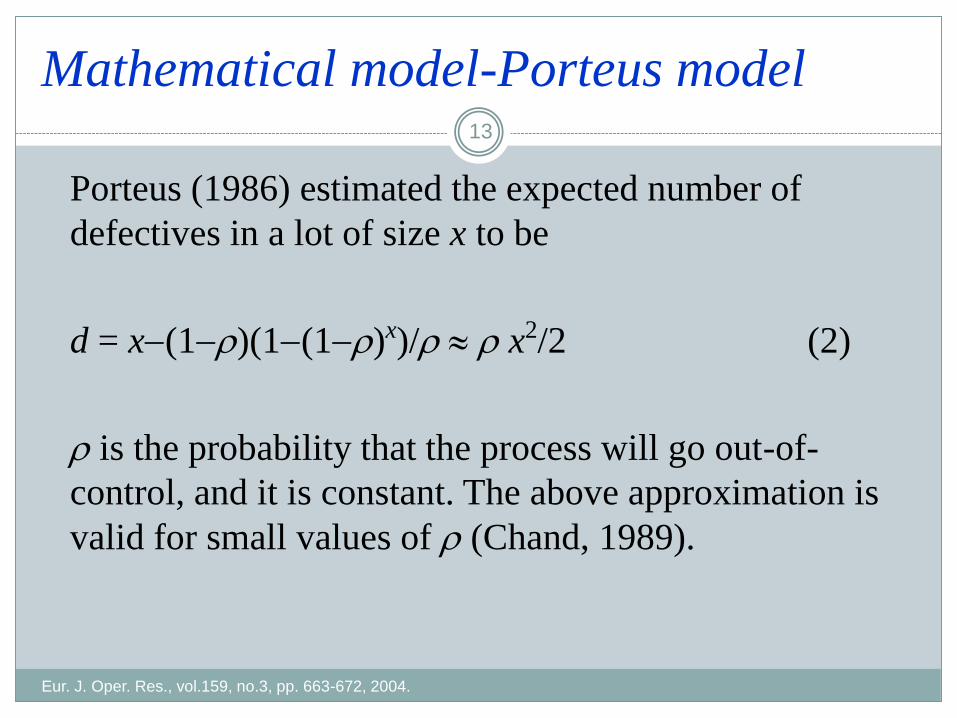
Porteus (1986) estimated the expected number of
defectives in a lot of size x to be
d = x-(1-r)(1-(1-r)x)/r r x2/2 (2)
r is the probability that the process will go out-of-
control, and it is constant. The above approximation is
valid for small values of r (Chand, 1989).

Mathematical model-The aggregate learning
curve model
Eur. J. Oper. Res., vol.159, no.3, pp. 663-672, 2004.
14
Assuming that reworking defective items follows a learning curve of the form described in (1), r(d) =r(1)d -e the aggregate learning curve is of the form
t(x)= y(x) + r(x)= y(1) x -b+r(1) (rx2/2)-e (3)
where r(x) is the time to rework the xth unit (e.g.; Jaber & Bonney, 2003), r(1) is the time to rework the first unit, and e is the learning exponent for reworks. t(x) is the marginal time to produce unit x.
Mathematical model- Lemmas
Eur. J. Oper. Res., vol.159, no.3, pp. 663-672, 2004.
15
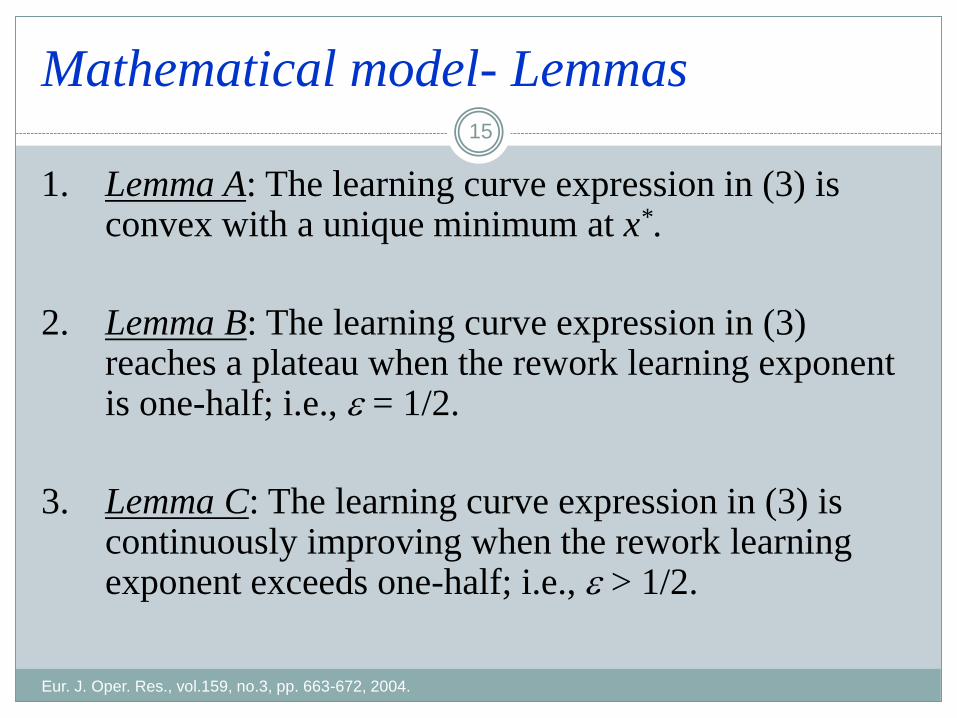
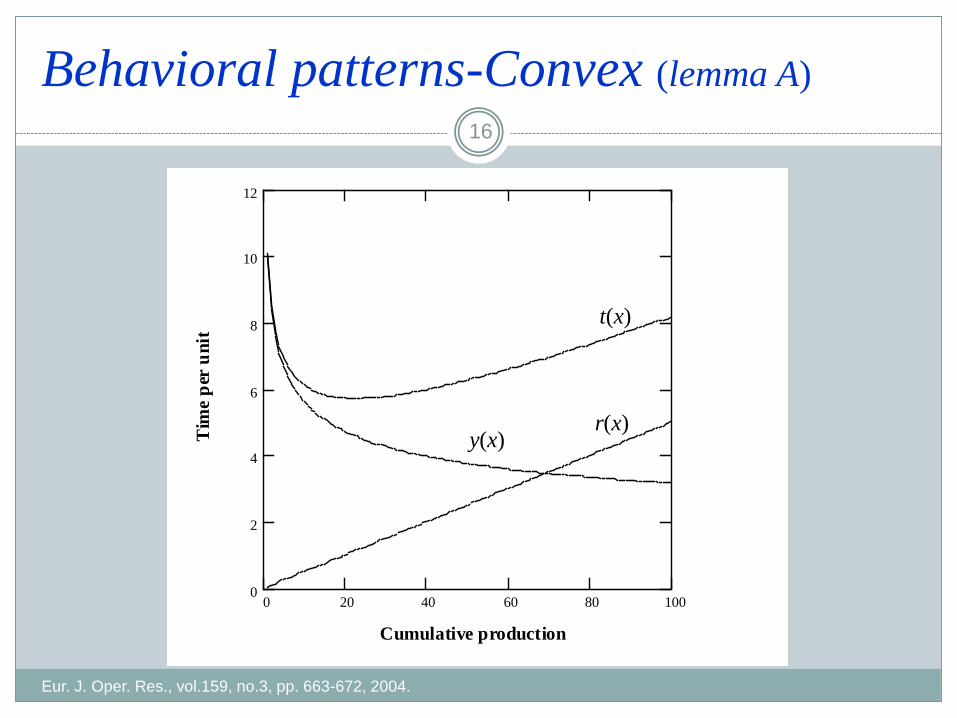
1. Lemma A: The learning curve expression in (3) is convex with a unique minimum at x*.
2. Lemma B: The learning curve expression in (3) reaches a plateau when the rework learning exponent is one-half; i.e., e = 1/2.
3. Lemma C: The learning curve expression in (3) is continuously improving when the rework learning exponent exceeds one-half; i.e., e > 1/2.
Behavioral patterns-Convex (lemma A)
Eur. J. Oper. Res., vol.159, no.3, pp. 663-672, 2004.
16
0 20 40 60 80 1000
2
4
6
8
10
12
Cumulative production
Tim
e p
er u
nit
t(x)
r(x) y(x)

Behavioral patterns-Plateau (lemma B)
Eur. J. Oper. Res., vol.159, no.3, pp. 663-672,
2004.
17
0 2000 4000 6000 8000 1 .104
0
0.5
1
1.5
2
2.5
3
3.5
Cumulative production
Tim
e p
er u
nit
y(x)
t(x)
r(x)
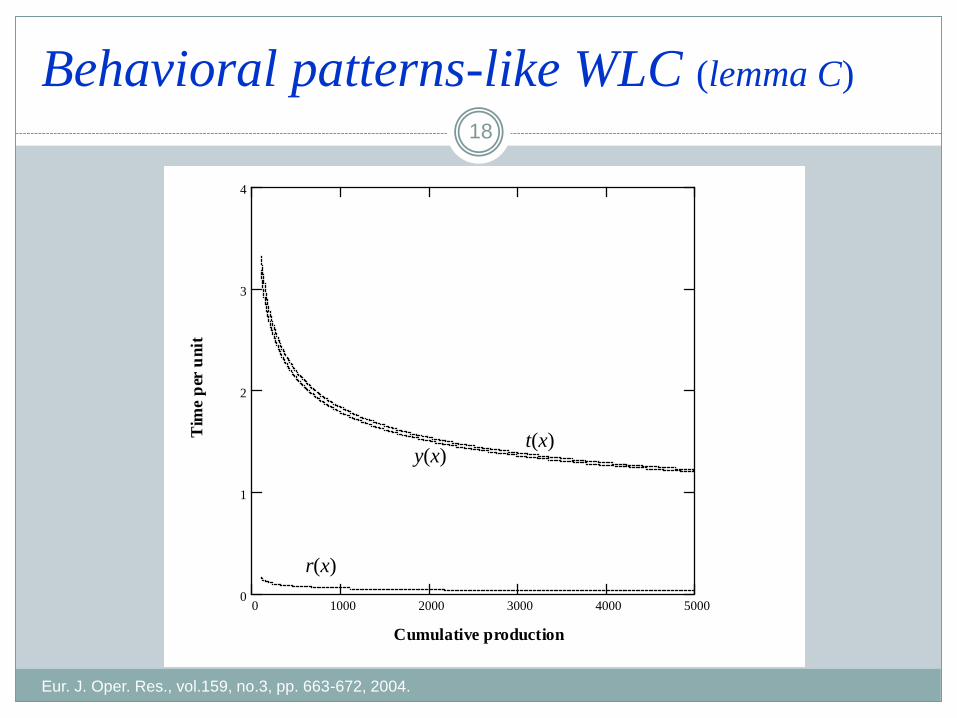
Behavioral patterns-like WLC (lemma C)
Eur. J. Oper. Res., vol.159, no.3, pp. 663-672, 2004.
18
0 1000 2000 3000 4000 50000
1
2
3
4
Cumulative production
Tim
e p
er u
nit
r(x)
y(x) t(x)
Some numerical results
Eur. J. Oper. Res., vol.159, no.3, pp. 663-672, 2004.
19
When production becomes faster, it is recommended to produce in smaller lots more frequently.
The values of x* are more sensitive to changes in ethan to changes in b.
For a given values of x and b, the value of t(x) increases as the ratio r(1)/y(1) increases.
Learning ceases sooner in a process that takes longer to rework defective than those that takes less time.
Learning process never ceases, the time to rework a defective item becomes insignificant.

Conclusions (1/2)
Eur. J. Oper. Res., vol.159, no.3, pp. 663-672, 2004.
20
Fast learners should produce in smaller lots than the slow
learners. This result might have an important implication
when shifting from larger to smaller lot sizes.
Managers should not speed up production without as well
improving the quality of the process. This corroborates the
finding of Hatch and Mowery (1998) who observed that
some new processes experience yield declines following
their introduction which may reflect the impact of rapid
expansion in production volumes before a new process is
fully stabilized or characterized.

Conclusions (2/2)
Eur. J. Oper. Res., vol.159, no.3, pp. 663-672, 2004.
21
Plateauing maybe attributed to problems in quality. This finding provide managers with indications to when an additional investment in training, or new technology, might be required to break the plateau barrier.
When the cost of producing a defective item is extremely high, then all units produced are assumed to be of a good quality. This may explain the behaviour of the WLC which was observed in the in an aircraft manufacturing facility.

Future research
Eur. J. Oper. Res., vol.159, no.3, pp. 663-672, 2004.
22
This work has two limitations: (1) it does not apply to cases when defects are discarded, and (2) the rate of generating defects is assumed to be constant-- the production process does not benefit from any changes for eliminating the defects.
This model will be investigated in a supply chain (Jaber et al., 2006), and dual resource constrained systems (Jaber et al. 2003) contexts.
This work could be used to manage yield in production systems.
An immediate extension is to investigate it for the forgetting effect (Jaber and Bonney, 1996 & 1997).

Eur. J. Oper. Res., vol.159, no.3, pp. 663-672, 2004.
23
Merci Pour Votre Attention!