Embed Size (px)
Citation preview
Funded by HRSAHIV/AIDS Bureau
Quality Institute #2, Session 3
Using Data for Quality Improvement.
I Have My Performance Data, What’s Next?
Presented by:Barbara M. Rosa, RN, MS
NQC Consultant
National Quality Center (NQC)2
Learning Objectives:• Identify data sources to be used for quality
improvement and analyze data points and data trends to identify key findings.
• Prioritize data results to implement action steps to improve HIV care and services.
• Know how to access benchmarking reports of other grantees and best practices on how to share data and findings.
National Quality Center (NQC)3
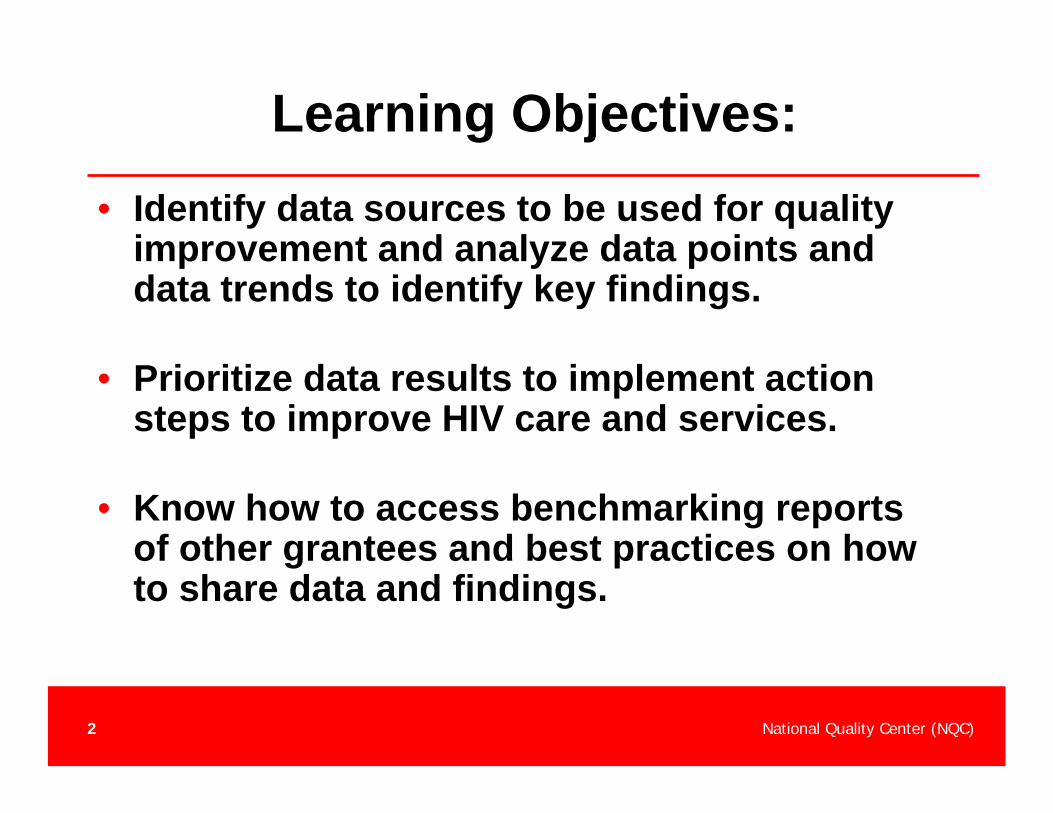
What’s wrong with this picture?
National Quality Center (NQC)4
Lessons Learned
• There is too much data…• Don’t get distracted from all the noise –
focus on the core findings• Set priorities – you can not do
everything!• Communicate clearly – tell folks what is
important!
National Quality Center (NQC)5
Why Measure?• Separates what you think is happening from what
is really happening• Establishes a baseline (‘It’s ok to start out with low
scores!’)• Ongoing / periodic monitoring identifies problems
as they emerge• Determines whether changes lead to
improvements• Avoids slippage• Allows for comparing performance across sites
National Quality Center (NQC)6
Why Measure?
And….• Linking performance Data to Quality
Improvement Activities“Performance measurement alone is not quality improvement. However, to do quality improvement, you need performance measurement!”
National Quality Center (NQC)7
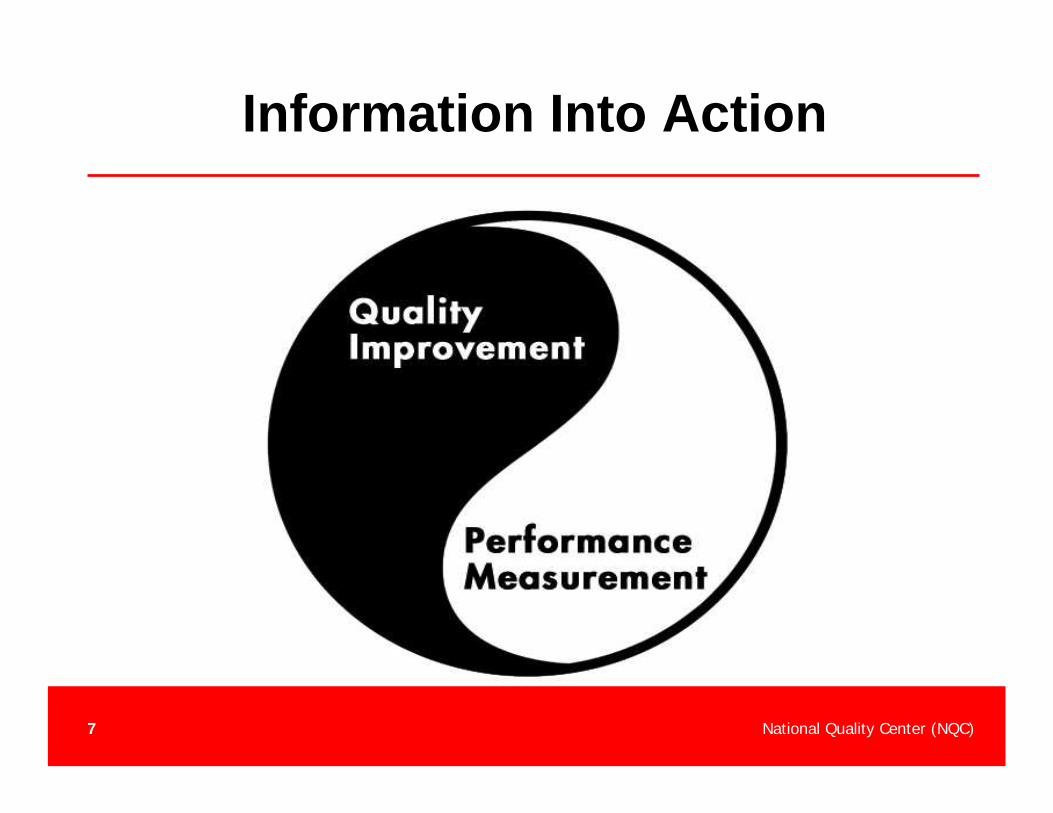
Information Into Action
National Quality Center (NQC)8
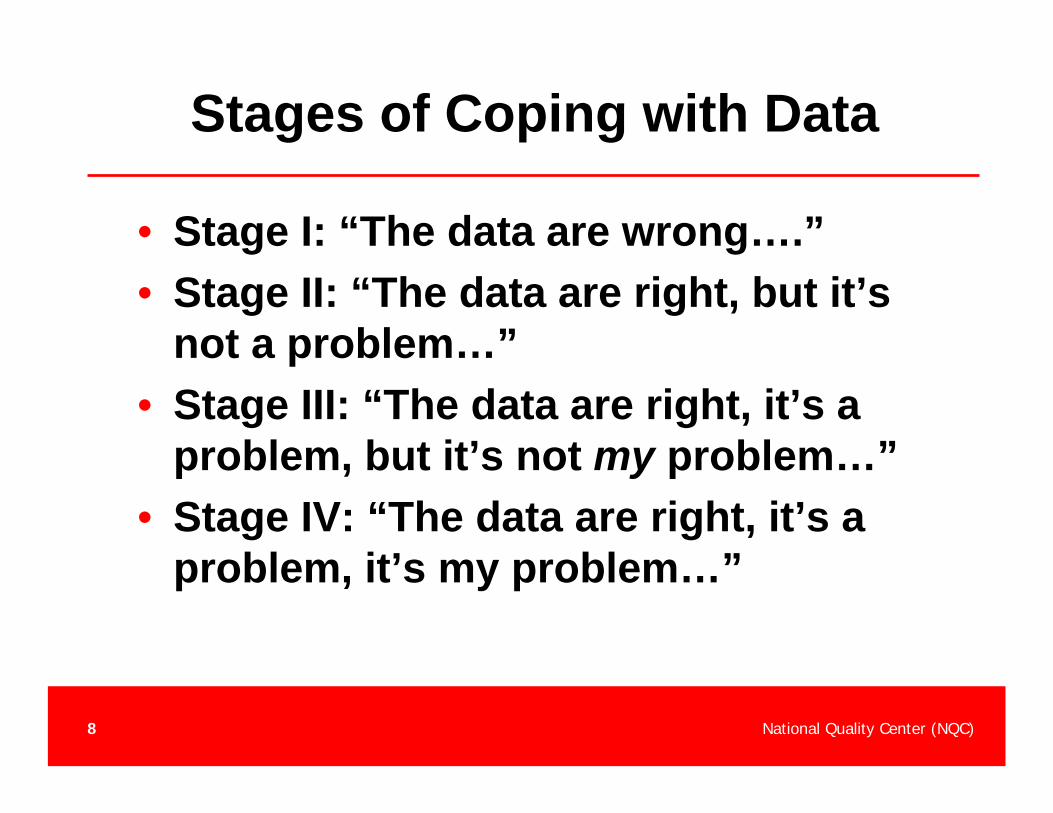
Stages of Coping with Data
• Stage I: “The data are wrong….”• Stage II: “The data are right, but it’s
not a problem…”• Stage III: “The data are right, it’s a
problem, but it’s not my problem…”• Stage IV: “The data are right, it’s a
problem, it’s my problem…”
National Quality Center (NQC)9
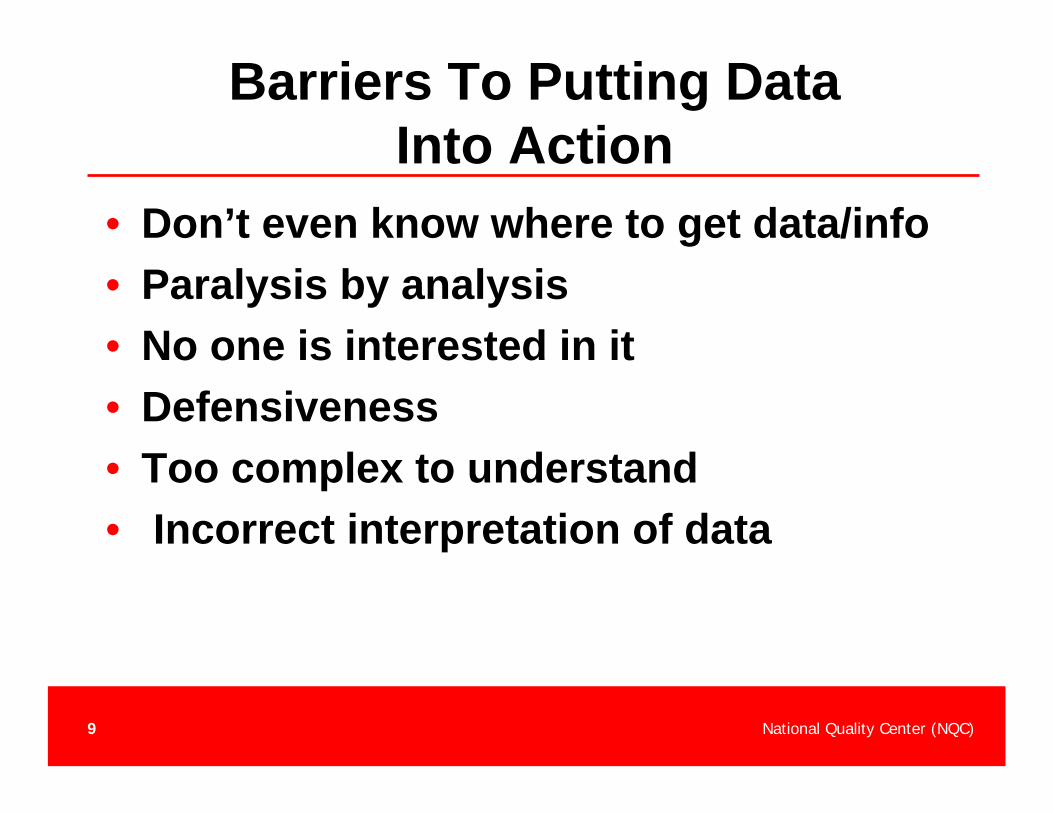
Barriers To Putting Data Into Action
• Don’t even know where to get data/info• Paralysis by analysis• No one is interested in it• Defensiveness• Too complex to understand• Incorrect interpretation of data
National Quality Center (NQC)10
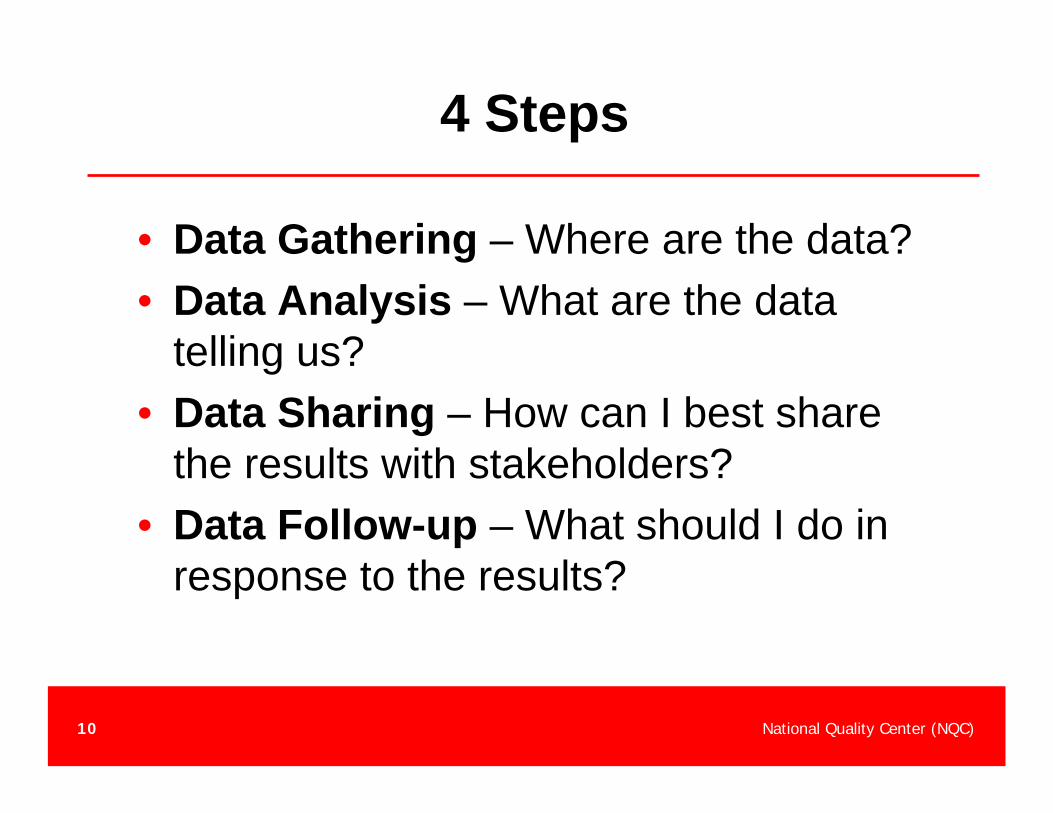
4 Steps
• Data Gathering – Where are the data?• Data Analysis – What are the data
telling us?• Data Sharing – How can I best share
the results with stakeholders?• Data Follow-up – What should I do in
response to the results?
National Quality Center (NQC)11
Data Gathering
• Where can I find the data?
National Quality Center (NQC)12
Data Sources
• Where do the data come from?
How much service or resources did we deliver? What is our baseline? Do we have historic data?
National Quality Center (NQC)13
Data Source Suggestions
• HIVQUAL data• CADR reports• CAREWare• Practice Management Systems/EMR• Facility-wide utilization data• Patient satisfaction surveys
National Quality Center (NQC)14
Data Analysis
• What are your key results?• What are your major findings based
on generated data reports and your data analyses?
National Quality Center (NQC)15
Analyze Data*
• Analyze data and review the results. • Identify areas where additional data are
required. • If historical data are available, compare for
trends. • Display and distribute data to
communicate findings and results. • Identify areas for improvement and select
a quality improvement project.*Step 4 in HAB’s Quality Management Technical Assistance Manual
National Quality Center (NQC)16
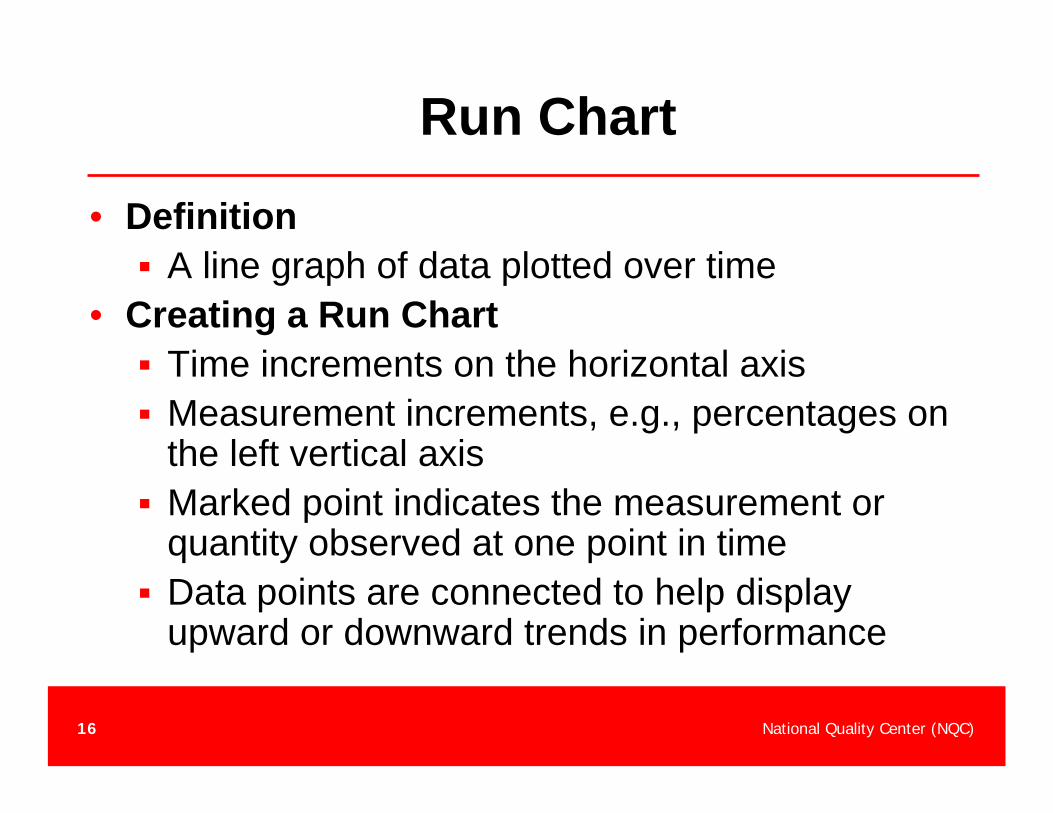
Run Chart
• DefinitionA line graph of data plotted over time
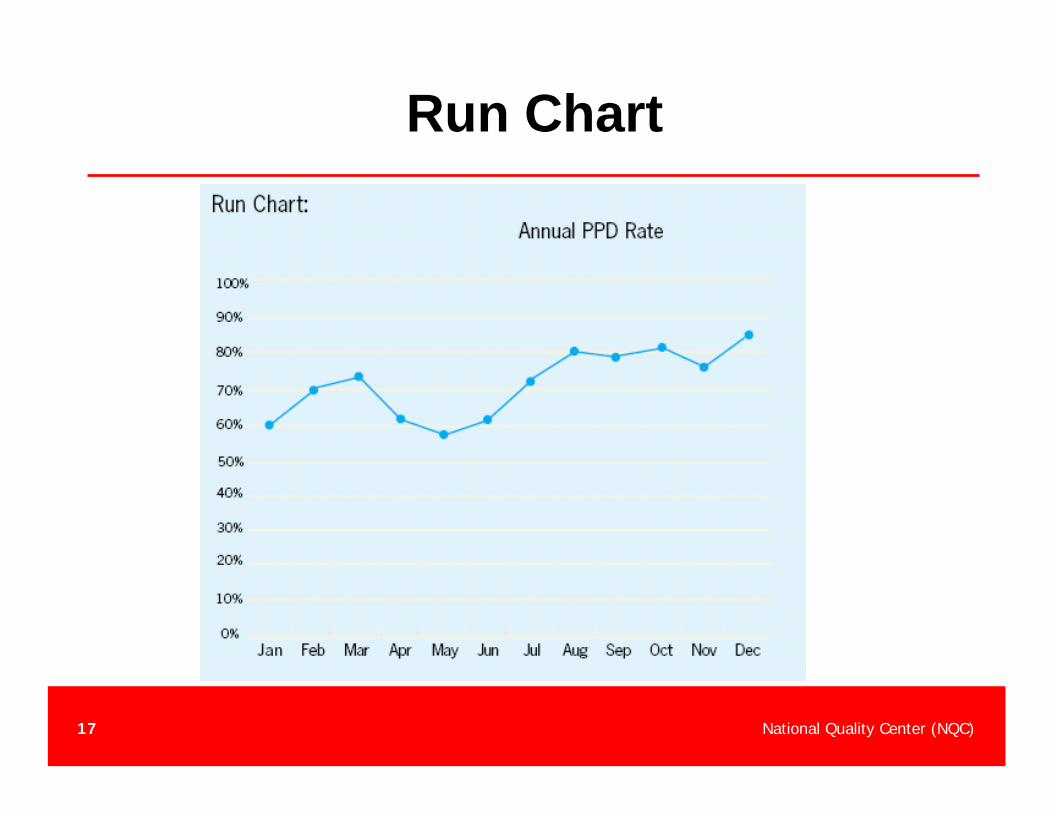
• Creating a Run ChartTime increments on the horizontal axisMeasurement increments, e.g., percentages on the left vertical axisMarked point indicates the measurement or quantity observed at one point in timeData points are connected to help display upward or downward trends in performance
National Quality Center (NQC)17
Run Chart
National Quality Center (NQC)18
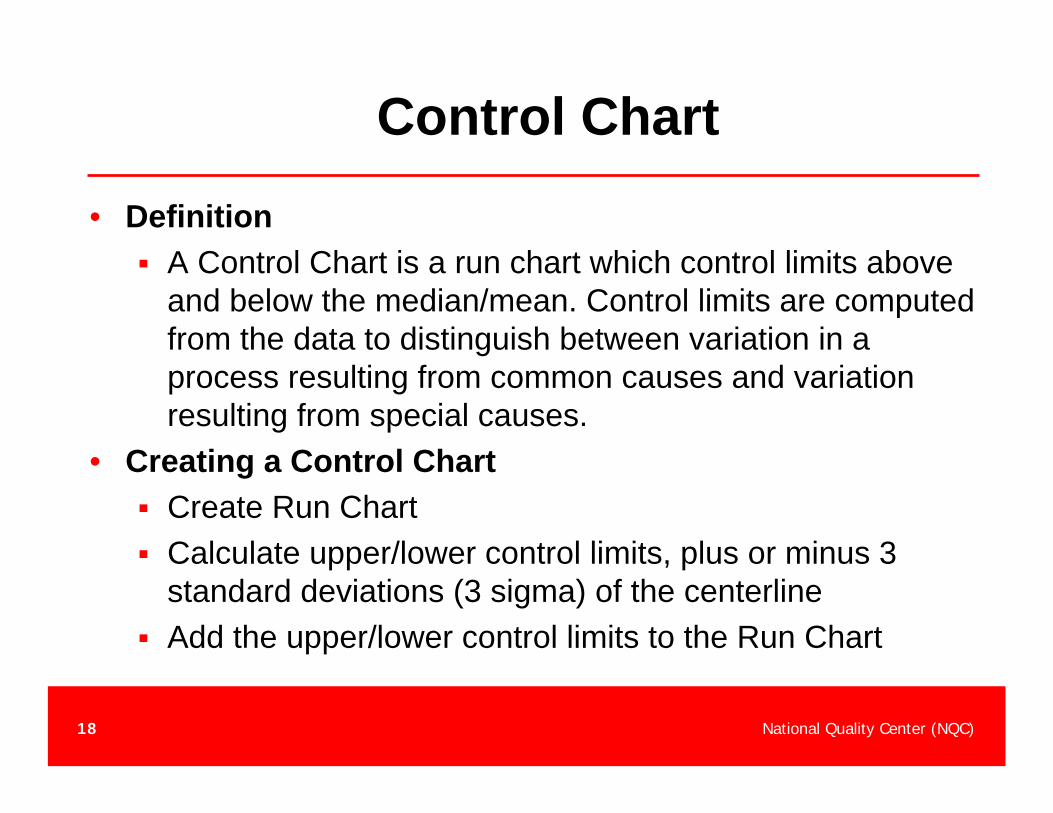
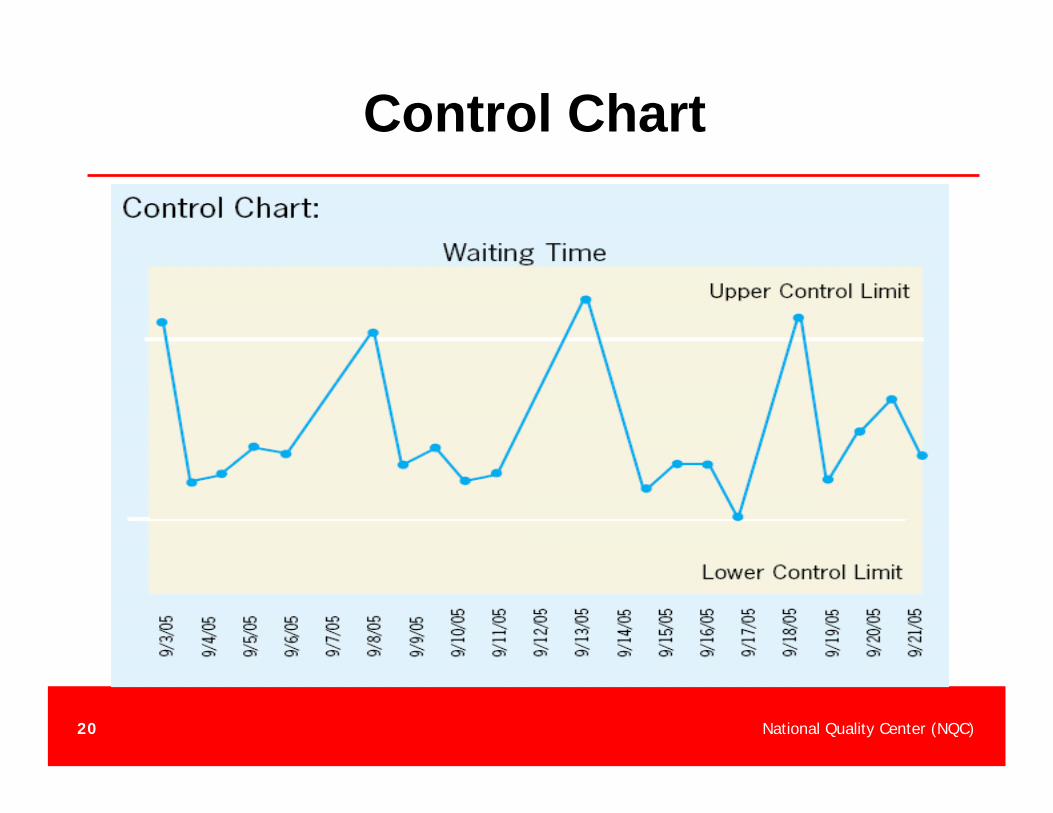
Control Chart
• DefinitionA Control Chart is a run chart which control limits above and below the median/mean. Control limits are computed from the data to distinguish between variation in a process resulting from common causes and variation resulting from special causes.
• Creating a Control ChartCreate Run ChartCalculate upper/lower control limits, plus or minus 3 standard deviations (3 sigma) of the centerlineAdd the upper/lower control limits to the Run Chart
National Quality Center (NQC)19
Common/Special Cause Variation
• Common Cause Variation:Variability caused by unknown factors that result in a steady but random distribution of output around the average of the data. Also called random variation, noise, noncontrollable variation, within-group variation, or inherent variation.
• Special Cause Variation:Variability caused by a specific factor or known factors such as environmental conditions or process input parameters that result in a non-random distribution of output. Also referred to as "exceptional" or "assignable" variation.
National Quality Center (NQC)20
Control Chart
National Quality Center (NQC)21
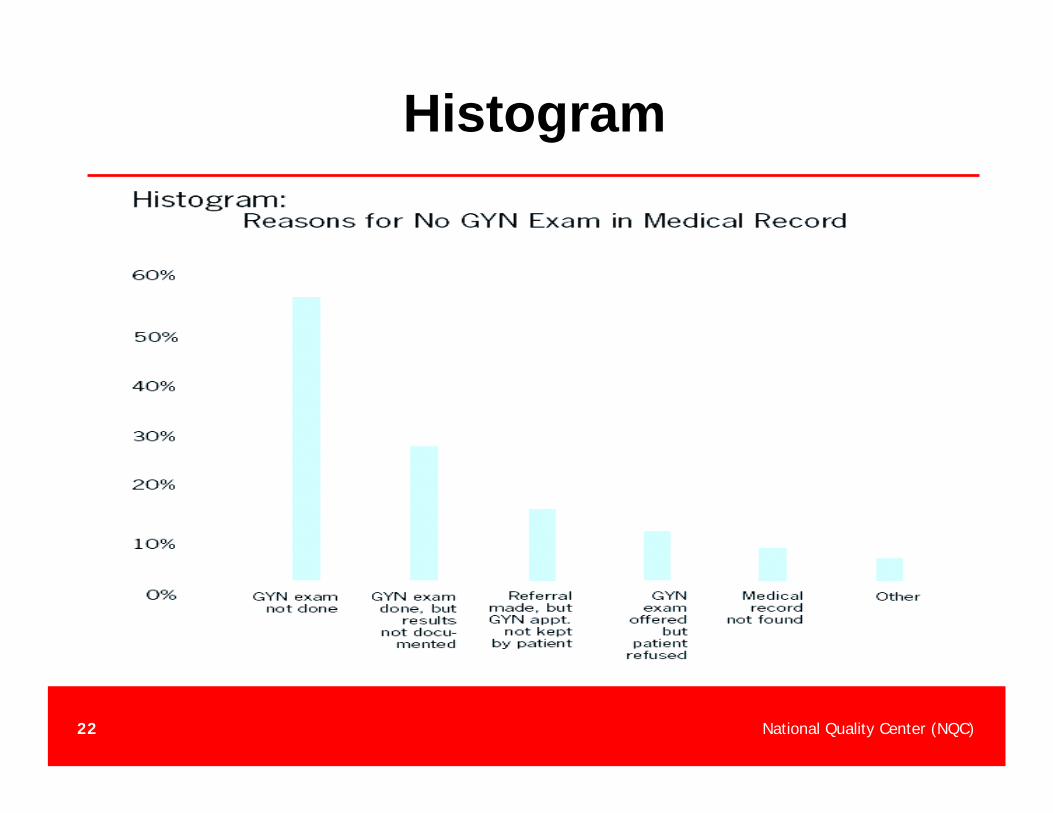
Histogram
• DefinitionA Histogram is a frequency table in a tabular form to increase knowledge about a process.
• Creating a HISTOGRAMConstruct a frequency table based on available values Sort the frequencies from highest to lowestDisplay in a tabular form
National Quality Center (NQC)22
Histogram
National Quality Center (NQC)23
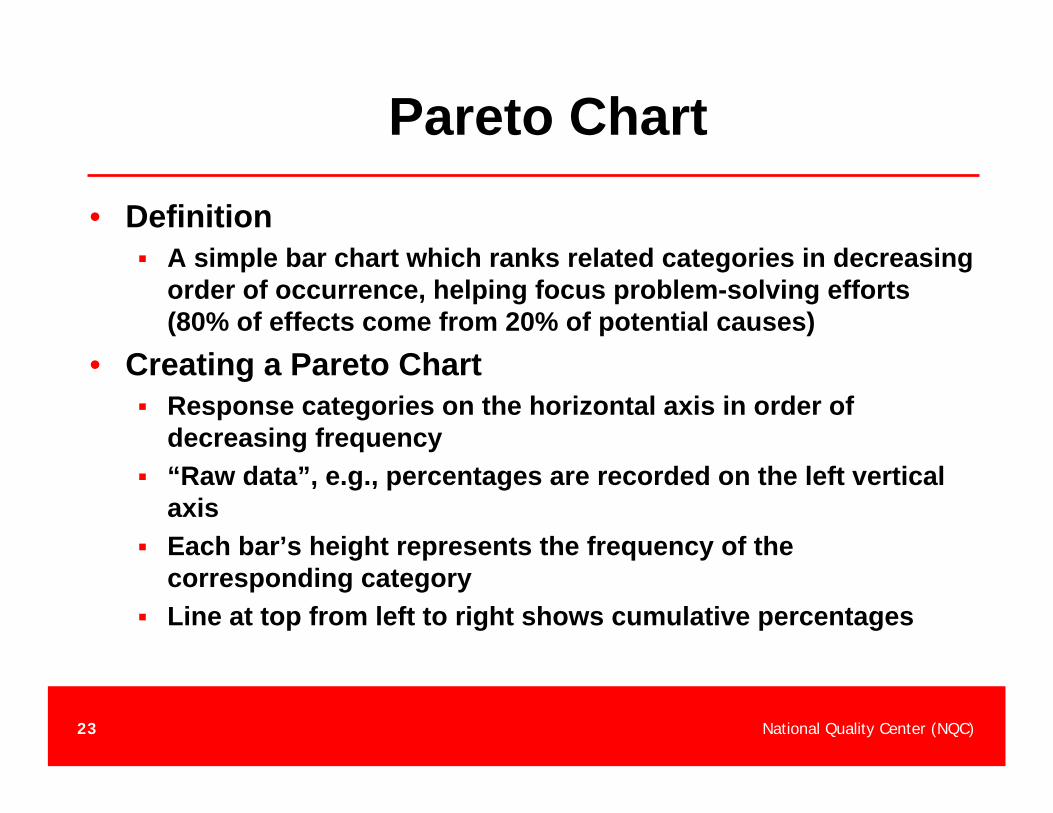
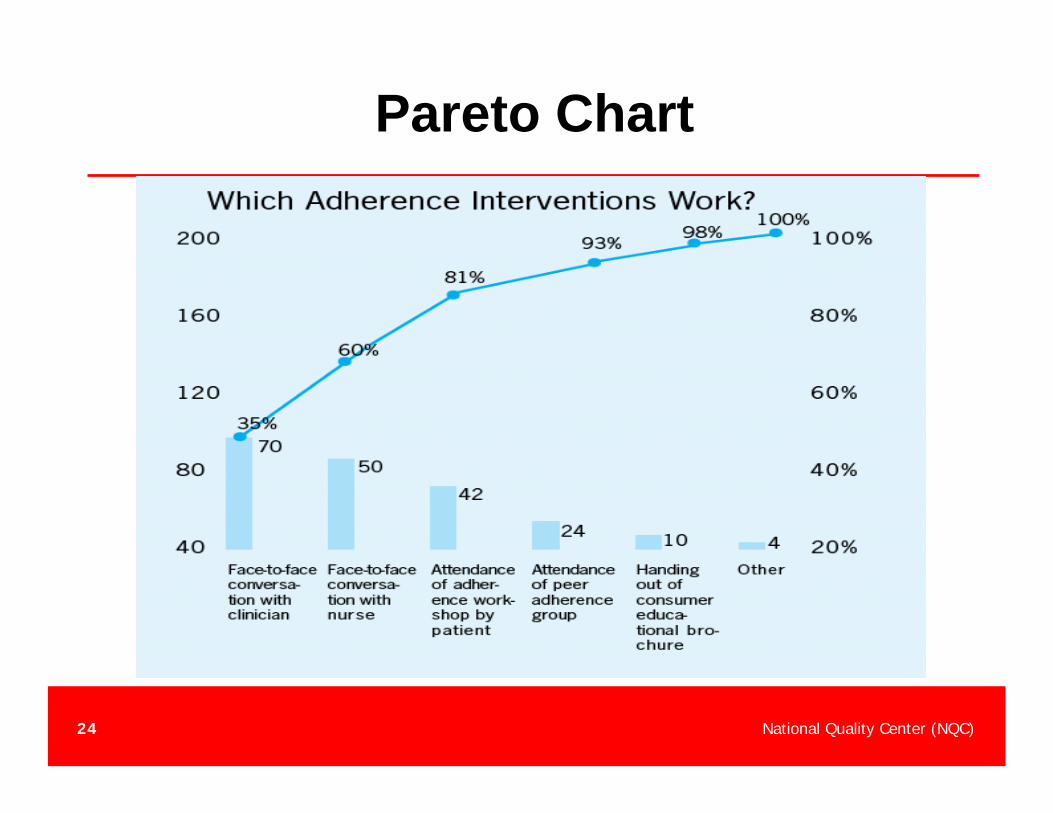
Pareto Chart
• DefinitionA simple bar chart which ranks related categories in decreasing order of occurrence, helping focus problem-solving efforts (80% of effects come from 20% of potential causes)
• Creating a Pareto ChartResponse categories on the horizontal axis in order of decreasing frequency“Raw data”, e.g., percentages are recorded on the left vertical axisEach bar’s height represents the frequency of the corresponding categoryLine at top from left to right shows cumulative percentages
National Quality Center (NQC)24
Pareto Chart
National Quality Center (NQC)25
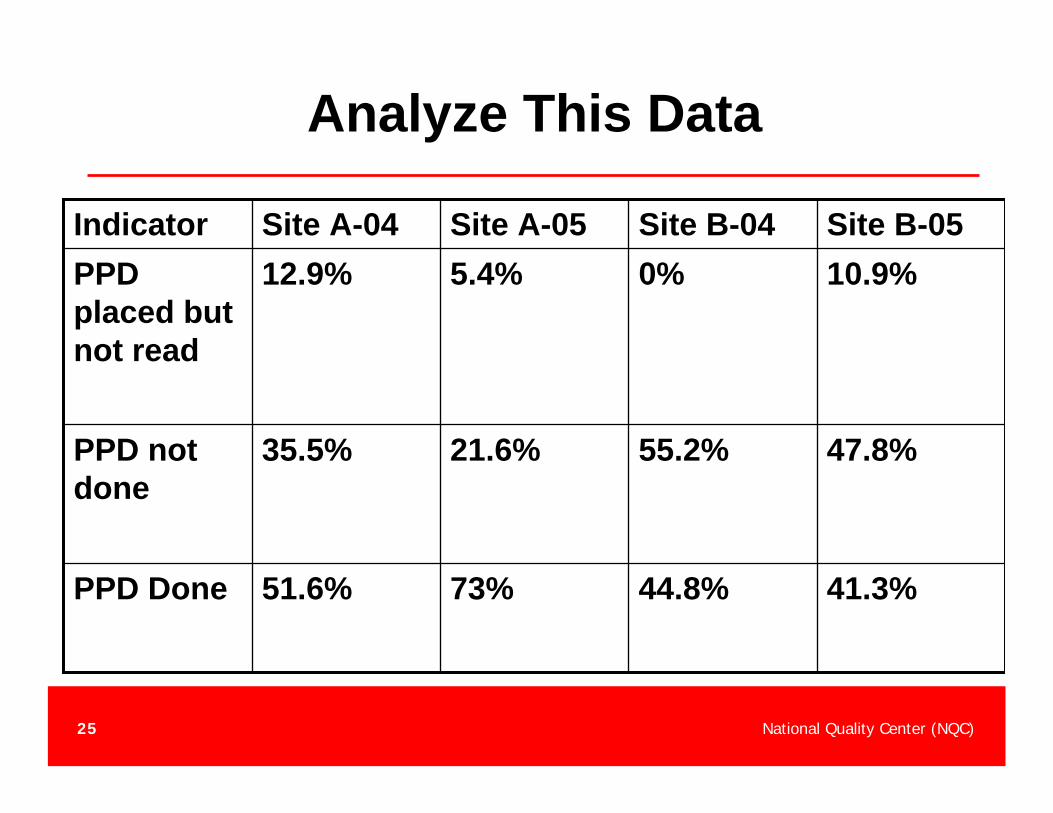
Analyze This Data
41.3%44.8%73%51.6%PPD Done
47.8%55.2%21.6%35.5%PPD not done
10.9%0%5.4%12.9%PPD placed but not read
Site B-05Site B-04Site A-05Site A-04Indicator
National Quality Center (NQC)26
Answer the questions:
• Which change from 04 to 05 is the most positive?
• Which change from 04 to 05 is the most negative?
• For which site would you make TB screening a priority for improvement?
• What other information would you like to know?
National Quality Center (NQC)27
Data Sharing
• Did you discuss the data results and analysis with your QI committee?
• How did you share the data results with your staff and consumers (CAB, etc.)?
• How do you generate ownership among staff and consumers?
National Quality Center (NQC)28
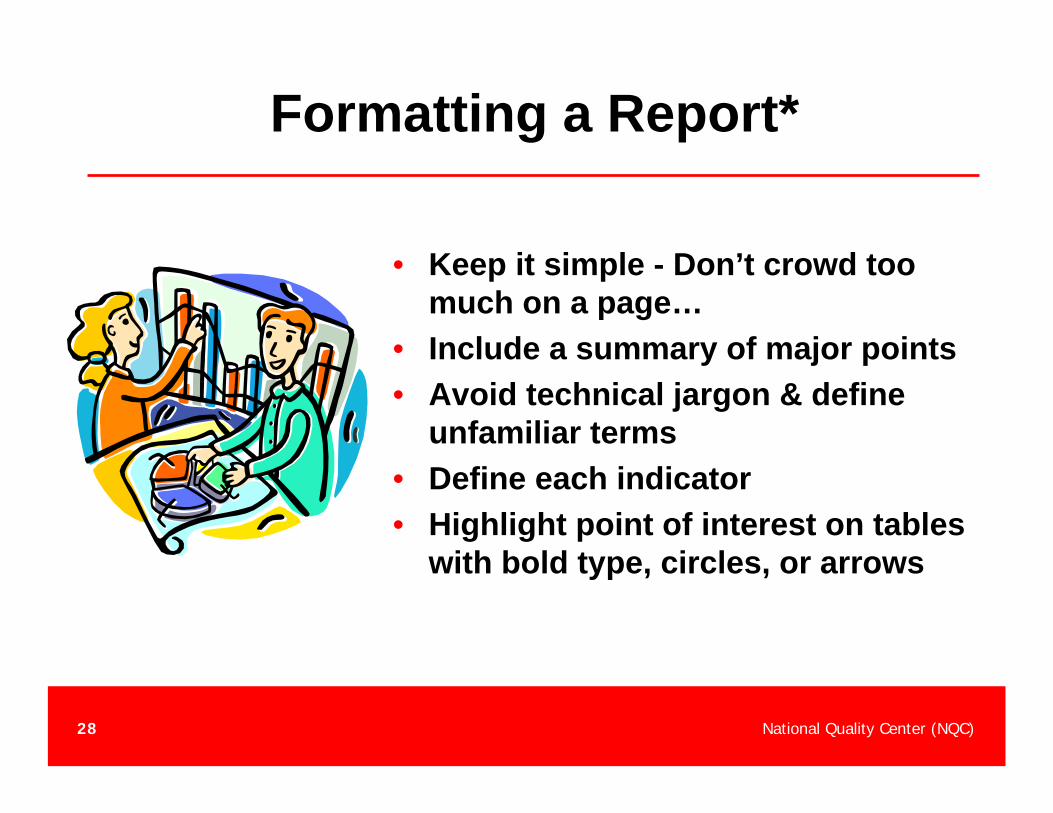
Formatting a Report*
• Keep it simple - Don’t crowd too much on a page…
• Include a summary of major points• Avoid technical jargon & define
unfamiliar terms• Define each indicator• Highlight point of interest on tables
with bold type, circles, or arrows
National Quality Center (NQC)29
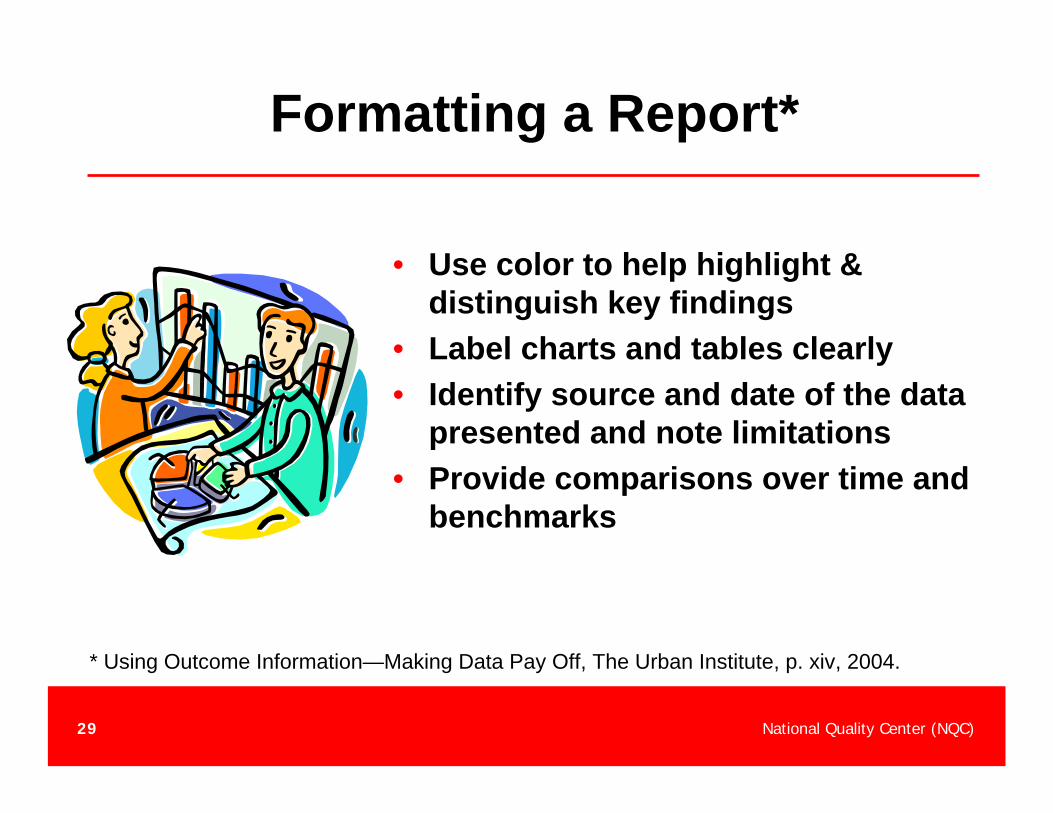
Formatting a Report*
• Use color to help highlight & distinguish key findings
• Label charts and tables clearly• Identify source and date of the data
presented and note limitations• Provide comparisons over time and
benchmarks
* Using Outcome Information—Making Data Pay Off, The Urban Institute, p. xiv, 2004.
National Quality Center (NQC)30
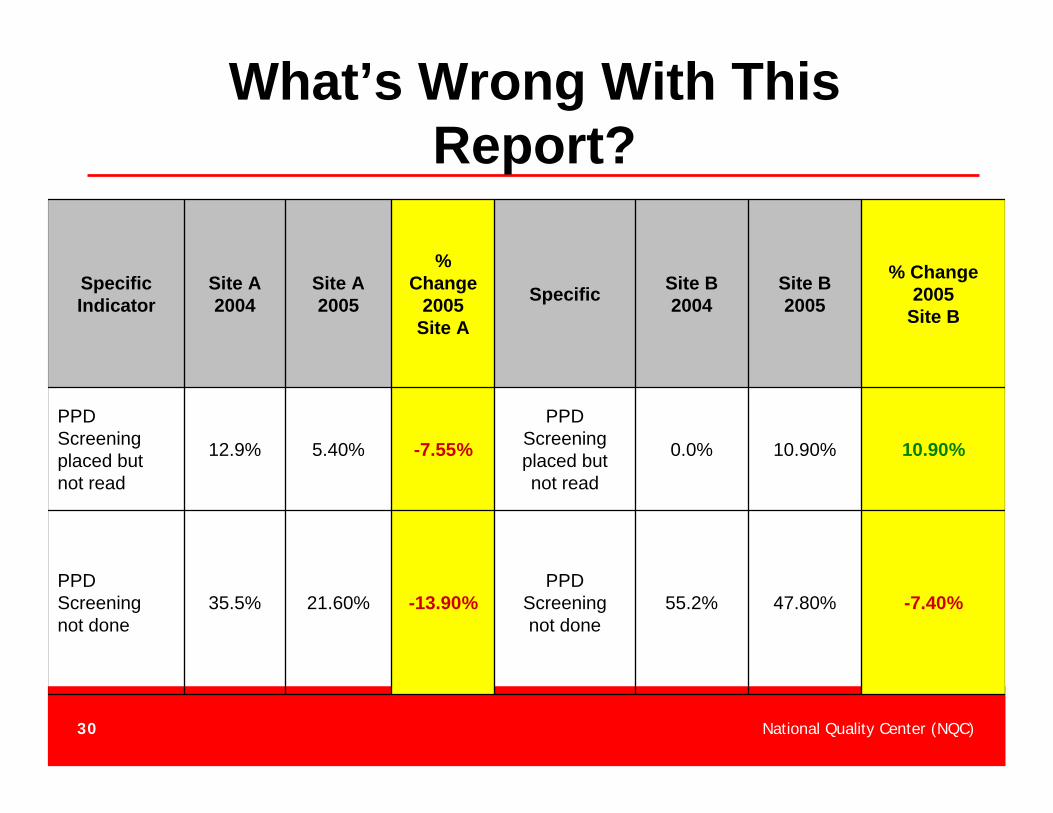
What’s Wrong With This Report?
-7.40%47.80%55.2%PPD
Screeningnot done
-13.90%21.60%35.5%PPDScreeningnot done
10.90%10.90%0.0%
PPDScreeningplaced butnot read
-7.55%5.40%12.9%
PPDScreeningplaced butnot read
% Change2005
Site B
Site B2005
Site B2004Specific
%Change
2005Site A
Site A 2005
Site A2004
SpecificIndicator
National Quality Center (NQC)31
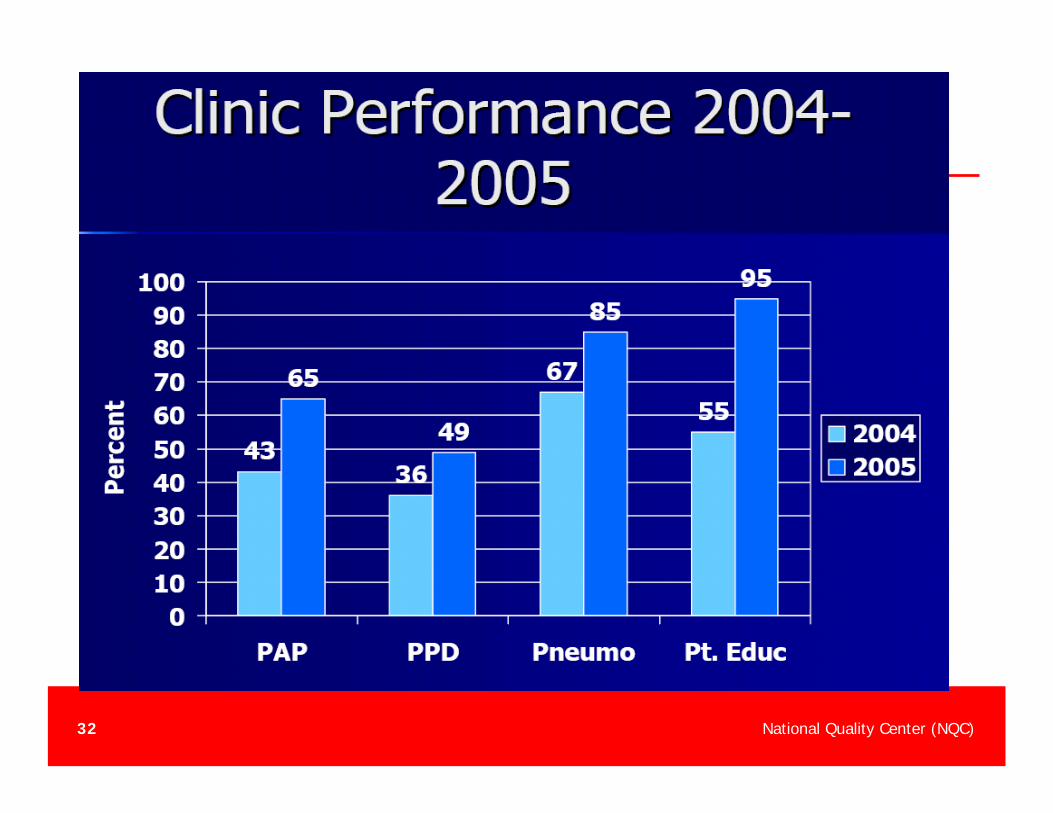
National Quality Center (NQC)32
National Quality Center (NQC)33
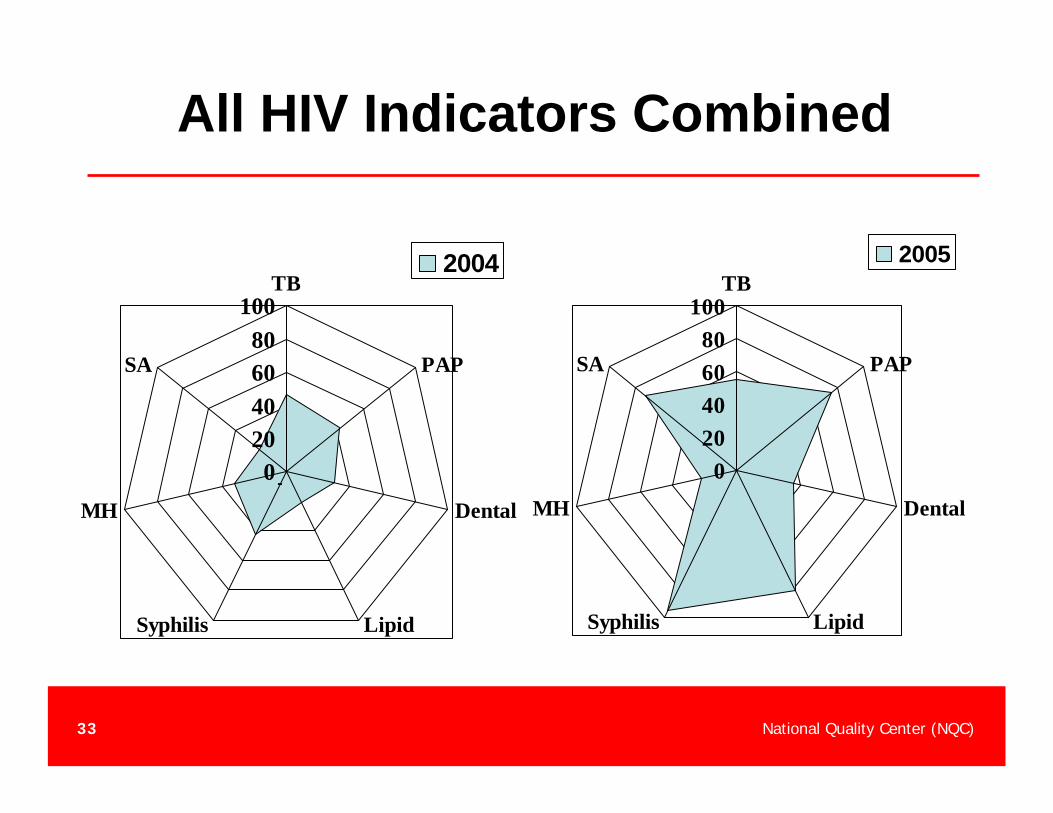
All HIV Indicators Combined
020406080
100TB
PAP
Dental
LipidSyphilis
MH
SA
2004
- 020406080
100TB
PAP
Dental
LipidSyphilis
MH
SA
2005
National Quality Center (NQC)34
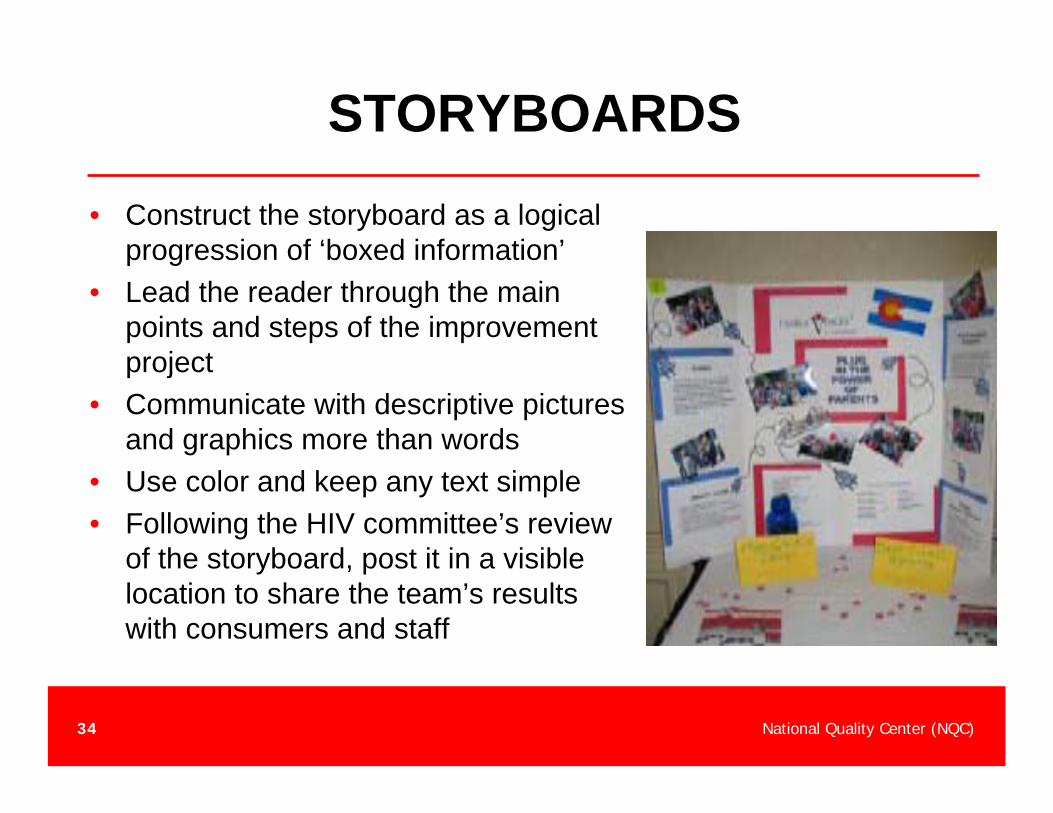
STORYBOARDS
• Construct the storyboard as a logical progression of ‘boxed information’
• Lead the reader through the main points and steps of the improvement project
• Communicate with descriptive pictures and graphics more than words
• Use color and keep any text simple• Following the HIV committee’s review
of the storyboard, post it in a visible location to share the team’s results with consumers and staff
National Quality Center (NQC)35
Data Display Tips
• Begin analyses with questions/hypotheses before ‘digging’ through data
• Plan data display with key stakeholders early in the process• Limit the display to the points you need to make • Format charts and graphs so that others can plug in data• Show 100% as the upper range to avoid misrepresenting of data• If possible, show benchmark data (internal/external)• Publicize the results; post graphic displays in hallways and waiting
rooms for staff/patients• Compare outcomes to established targets/goals• When appropriate, compare results grouped by demographics or
other characteristics
National Quality Center (NQC)36
Creating Data Ownership
• Share and discuss all data reports with QI Committee
• Share reports with staff at staff meetings or just send everyone the data reports
• Share reports with consumers (display in waiting room, discussion at Consumer Advisory Committee, etc.)
National Quality Center (NQC)37
Tips to Create Data Ownership• Involve staff in setting the goals each year• View Performance Improvement as a
management toolDo not use results for punishmentInclude outcomes achieved when evaluating staff
• Share reports with staff promptly & listen to variance explanations
• Establish roles & responsibilities for staff to participate
• Watch out for defensiveness• Watch out for paralysis by analysis
National Quality Center (NQC)38
Data Follow-up
• What immediate changes will you make based on the key findings?
• Are you considering initiating a QI project to address the data findings? Who will be responsible and what are the next steps?
National Quality Center (NQC)39
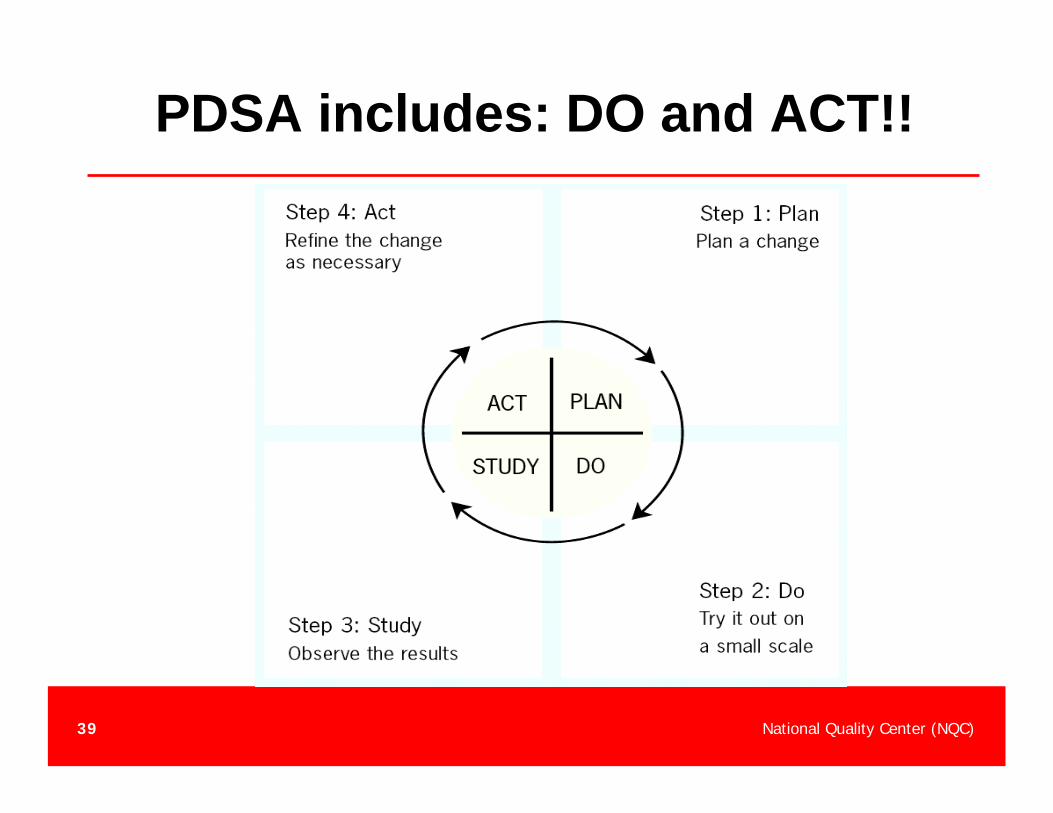
PDSA includes: DO and ACT!!
National Quality Center (NQC)40
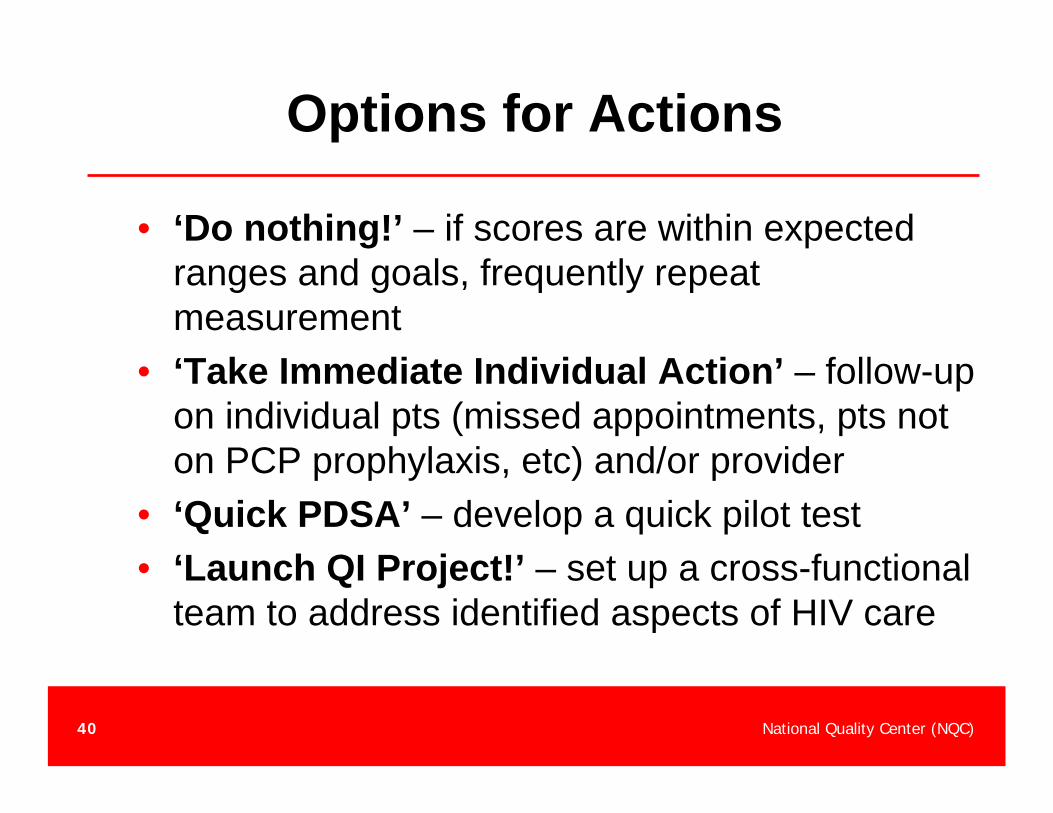
Options for Actions
• ‘Do nothing!’ – if scores are within expected ranges and goals, frequently repeat measurement
• ‘Take Immediate Individual Action’ – follow-up on individual pts (missed appointments, pts not on PCP prophylaxis, etc) and/or provider
• ‘Quick PDSA’ – develop a quick pilot test• ‘Launch QI Project!’ – set up a cross-functional
team to address identified aspects of HIV care
National Quality Center (NQC)41
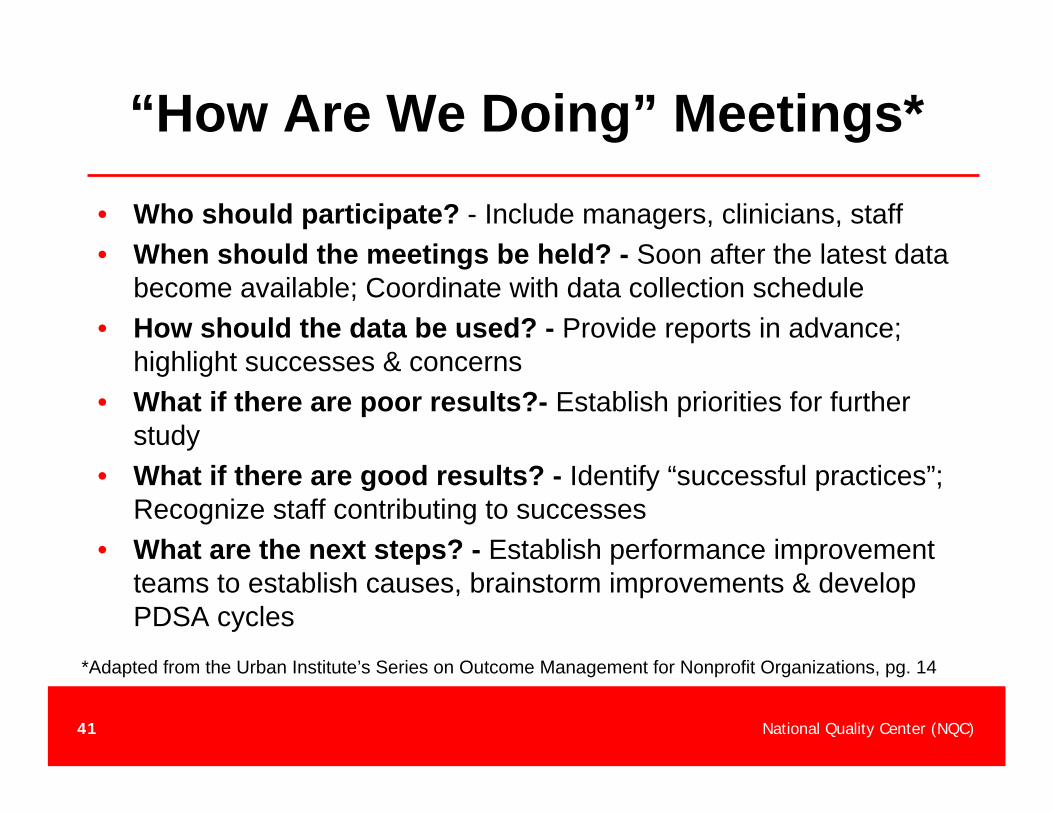
“How Are We Doing” Meetings*• Who should participate? - Include managers, clinicians, staff• When should the meetings be held? - Soon after the latest data
become available; Coordinate with data collection schedule• How should the data be used? - Provide reports in advance;
highlight successes & concerns• What if there are poor results?- Establish priorities for further
study• What if there are good results? - Identify “successful practices”;
Recognize staff contributing to successes• What are the next steps? - Establish performance improvement
teams to establish causes, brainstorm improvements & develop PDSA cycles
*Adapted from the Urban Institute’s Series on Outcome Management for Nonprofit Organizations, pg. 14
National Quality Center (NQC)42
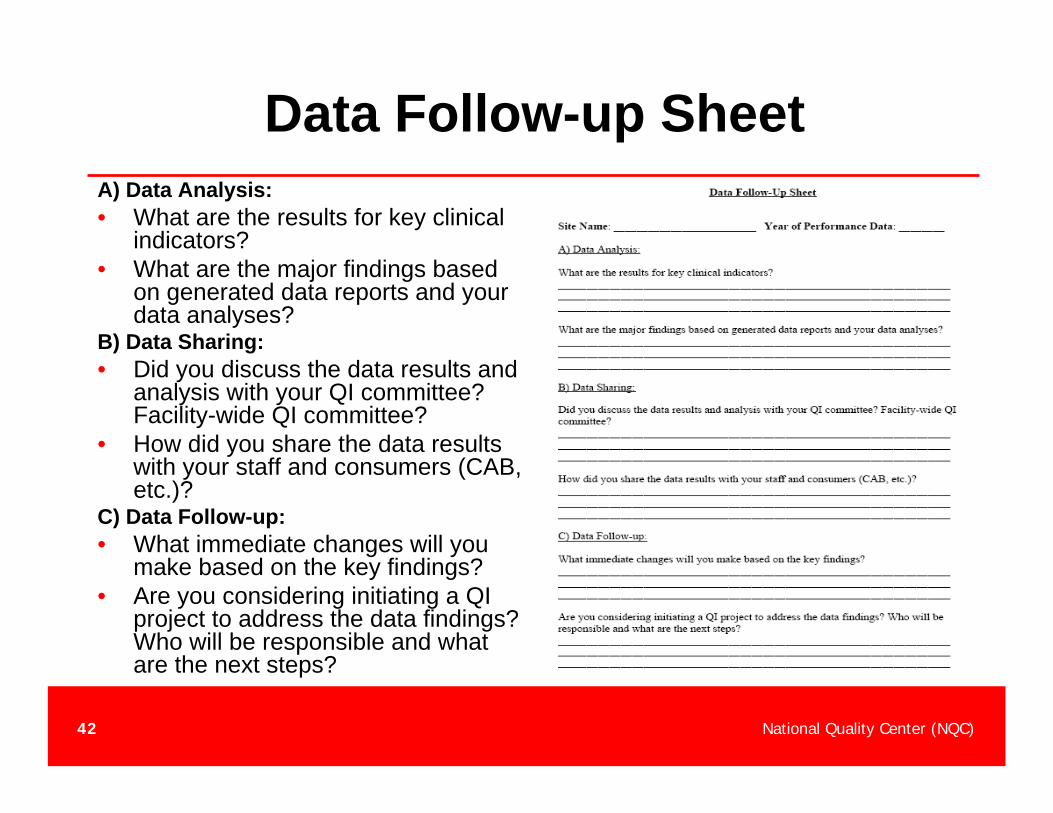
Data Follow-up SheetA) Data Analysis:• What are the results for key clinical
indicators?• What are the major findings based
on generated data reports and your data analyses?
B) Data Sharing:• Did you discuss the data results and
analysis with your QI committee? Facility-wide QI committee?
• How did you share the data results with your staff and consumers (CAB, etc.)?
C) Data Follow-up:• What immediate changes will you
make based on the key findings?• Are you considering initiating a QI
project to address the data findings? Who will be responsible and what are the next steps?
National Quality Center (NQC)43
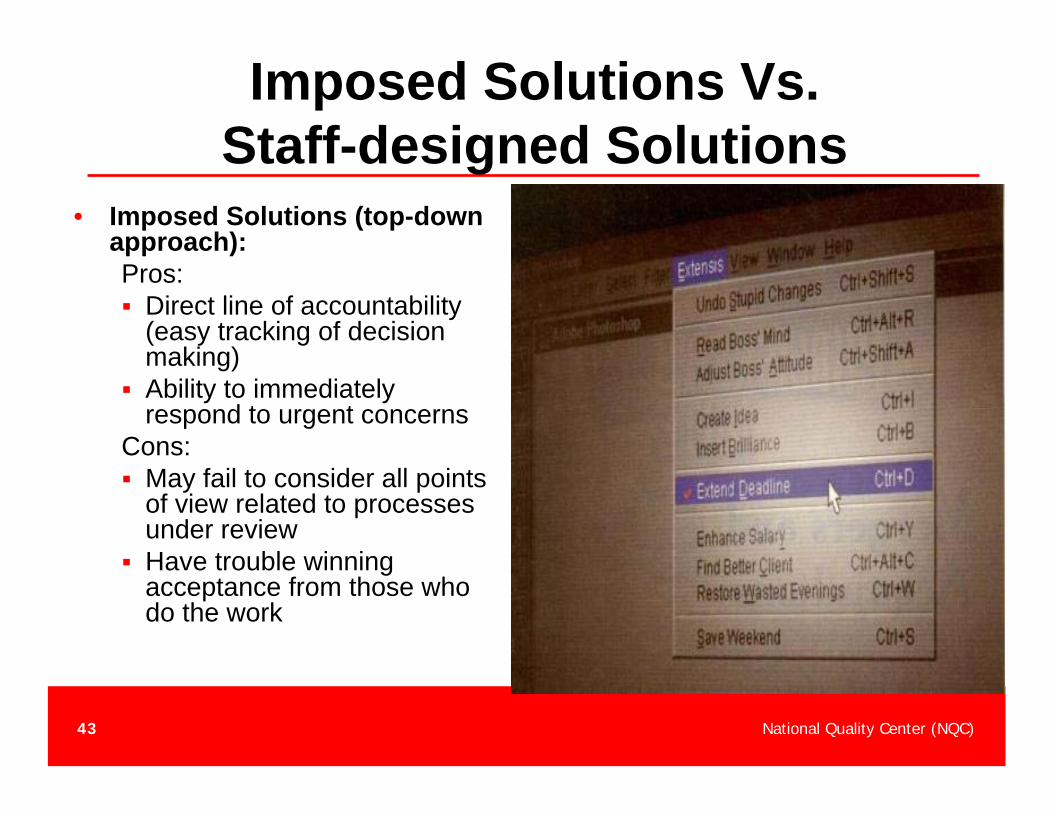
Imposed Solutions Vs.Staff-designed Solutions
• Imposed Solutions (top-down approach):Pros:
Direct line of accountability (easy tracking of decision making)Ability to immediately respond to urgent concerns
Cons:May fail to consider all points of view related to processes under reviewHave trouble winning acceptance from those who do the work
National Quality Center (NQC)44
Imposed Solutions Vs.Staff-designed Solutions
Staff-designed Solutions (bottom-up approach)Pros:
Develop staff “ownership” through involvementInstill quality focus in daily life
Cons:Participation of staff may increase timeframe to implement solutionTeam dynamics might interfere with improvement processes
National Quality Center (NQC)45
Data Follow-up with Consumers
• Ask consumers about Next StepsEngage Consumer Advisory CommitteeInvite consumer (who is informed and supported) to join QI committeeEngage consumer in a QI team activity
National Quality Center (NQC)46
Consumer on QI Committee
• Direct representation and input by consumer in the quality program
• Inform other consumers about quality activities
• Resources are needed to educate consumer about quality program and activities
• Takes time to integrate consumer in the QI Committee
Advantages Disadvantages
National Quality Center (NQC)47
Consumer on QI Team
• Direct input by consumer on specific issue
• Immediate feedback whether proposed solutions might work for consumers
• Time commitment by consumer
• Takes resources to integrate consumer in the team
Advantages Disadvantages
Funded by HRSAHIV/AIDS Bureau
National Quality Center (NQC)
888888--NQCNQC--QIQI--TATANationalQualityCenter.orgNationalQualityCenter.org
[email protected]@health.state.ny.us