Embed Size (px)
Citation preview

Quality Initiative Pilot Evaluation StudyFINAL REPORT: SEPTEMBER 2017
CULTIVATE LEARNING, UNIVERSITY OF WASHINGTON

IELO QUALITY INITIATIVE PILOT | EVALUATION STUDY
Prepared by:
Gail E. Joseph, Ph.D., Principal Investigator & Director, Cultivate Learning
Molly Branson Thayer, Ed.D., Co-Principal Investigator, & Director of School Age and Youth Quality Programs, Cultivate Learning
Bezawit Semu, M.Ed, Assessment Lead, Cultivate Learning
Nail Hassairi, Ph.D., Research Assistant, Cultivate Learning
Songtian (Tim) Zeng, Ph.D., Research Assistant, Cultivate Learning
Alice Porter, Editor, Cultivate Learning
with contributions from: Lisa Wilson, Micaela Moricet, and Thomas Conkling
This work was supported by funding from the Department of Early Learning as part of the Early Start Act of 2015 and a grant from the Raikes Foundation.
This is a publication from Cultivate Learning. Cultivate Learning is a research center in the College of Education at the University of Washington.
Suggested citation:Joseph, G. E., Branson Thayer, M., Semu, B., Hassairi, N., Zeng, S., Porter, A. (2017). Expanded Learning Opportunity Quality Initiative Pilot Evaluation Study Report. Seattle, Cultivate Learning at the University of Washington.

IIELO QUALITY INITIATIVE PILOT | EVALUATION STUDY
Table of Contents
Figures & Tables .......................................................................................................................................... IV
Acknowledgements ..................................................................................................................................... V
Executive Summary .......................................................................................................................................1
Evaluation Approach and Findings ................................................................................................................................................. 2
Summary of Recommendations from Studies 1 and 2 ............................................................................................................. 3
1. Introduction ...............................................................................................................................................4
Benefits of ELOs .................................................................................................................................................................................. 4
The Washington State ELO Pilot ...................................................................................................................................................... 4
2. Evaluation Overview ..................................................................................................................................6
Multiple Baseline Approach .............................................................................................................................................................. 6
Program Selection Criteria ................................................................................................................................................................ 7
Program Recruitment ......................................................................................................................................................................... 7
Application Process and Consent ................................................................................................................................................... 8
3. Participating Programs and Coaches .......................................................................................................8
Original Cohort Breakdown ............................................................................................................................................................... 8
Revised Cohort Breakdown ............................................................................................................................................................10
Practitioner Demographics .............................................................................................................................................................11
Coach Recruitment and Distribution ............................................................................................................................................12
Site Visits, Technology, and Equipment .......................................................................................................................................12
Evaluation Team ................................................................................................................................................................................13
4. Measures and Procedures ..................................................................................................................... 13
Program Quality Assessment .......................................................................................................................................................13
Engagement in Classrooms Data Collection (ECDC) ...............................................................................................................14
Quality Seal .........................................................................................................................................................................................14
Training and Inter-rater Reliability (IRR) .......................................................................................................................................15

IIIELO QUALITY INITIATIVE PILOT | EVALUATION STUDY
5. Purpose/Study 1: Program Quality and Practice-based Coaching ........................................................ 16
Data Collection and Procedures ....................................................................................................................................................17
Results .................................................................................................................................................................................................18
RQ 1.1 What is the baseline quality of programs included in the sample? ............................................................18
RQ 1.2 How does Practice-based Coaching work across multiple settings, and what refinements are necessary to improve the practice? ................................................................................................................20
RQ 1.3 What is the overall change in program quality before and after coaching? ..............................................27
RQ 1.4 How is the intervention effect mediated by coaching hours and fidelity? ................................................30
Summary of Findings from Purpose/Study 1 ............................................................................................................................30
6. Purpose/Study 2: Stakeholder Experiences ........................................................................................... 30
RQ 2.1 What were the experiences of site staff, leadership, and coaches who participated in the quality initiative pilot? ...................................................................................................................................30
RQ 2.2 What are the perspectives of site staff, leadership, and coaches regarding coaching, professional development, and overall improvement efforts that could contribute to a more effective intervention design? .................................................................................................................................30
Overview ..............................................................................................................................................................................................31
Program Focus Groups ...................................................................................................................................................................31
Coach Focus Groups ........................................................................................................................................................................31
Focus Group and Data Coding Process .......................................................................................................................................32
Focus Group Findings ......................................................................................................................................................................33
Summary of Findings from Purpose/Study 2 ............................................................................................................................34
7. Summary of Evaluation Limitations ....................................................................................................... 35
Evaluation Timeline ...........................................................................................................................................................................35
Introduction of New Technology ...................................................................................................................................................35
Program Capacity .............................................................................................................................................................................35
8. Summary of Recommendations from Studies 1 and 2 .......................................................................... 36
9. References .............................................................................................................................................. 37

IVELO QUALITY INITIATIVE PILOT | EVALUATION STUDY
Figures & Tables
FiguresFigure 1. Timeline of Evaluation
Figure 2. Participating Program Regions
Figure 3. Multiple Baseline Approach
Figure 4.1 Variation of Program Quality before Intervention according to Quality Seal
Figure 4.2 Variation of Program Quality before Intervention according to the PQA
Figure 5. PQA Histogram of 50 Sites in the Pre-Assessment
Figure 6.1. Weekly PQA Data Example
Figure 6.2. Weekly ECDC Data Example
Figure 7. PQA Engagement Domain Scores Across Cohorts
Figure 8. ECDC Challenging Behavior Data Across Cohorts
Figure 9. Pre- and Post-PQA Data by Domain and Overall Aggregate
TablesTable 1. Program Recruitment and Participation
Table 2. Program Type Distribution by County
Table 3. Original Cohort Distribution by County
Table 4. Original Distribution of Program Type by Cohort
Table 5. Revised Cohort Distribution by County
Table 6. Revised Distribution of Program Type by Cohort
Table 7. Practitioner Demographics in the ELO Evaluation
Table 8. Practitioner Educational Background
Table 9. Baseline Quality by Program Type
Table 10. Program Focus Group Participation
Table 11. Coaching Focus Group Participation

VELO QUALITY INITIATIVE PILOT | EVALUATION STUDY
Acknowledgements
We would like to thank the Department of Early Learning and the Raikes Foundation for sponsoring this evaluation.
We wish to acknowledge the Expanded Learning Opportunity (ELO) Evaluation Study Research Team who assisted with this study, including Lisa Wilson, Micaela Moricet, Thomas Conkling, Lauren Kornenberg, Darius Alo, Tosh Votry, Senait Gebreeyesus, and to all Cultivate Learning staff who supported the work in various capacities.
The authors would like to offer appreciation to the organizations whose members served on the Steering Committee including the Department of Early Learning, Office of Superintendent of Public Instruction, School’s Out Washington, Child Care Aware of Washington (including Child Care Resources), and the Raikes Foundation.
Additionally, we would like to thank Nicole Rose, Juliet Taylor, Valisa Smith, and Jackie Jainga Hyllseth for their ongoing support and guidance throughout the evaluation study, and Susan Sandall for her thoughtful review.
Finally, we are grateful for all of the participants- ELO program directors, providers, and staff- who allowed us to visit their sites during this important study. We are indebted to the parents and families who chose to participate, and to the children themselves.

1ELO QUALITY INITIATIVE PILOT | EVALUATION STUDY
Executive Summary
In Washington State and throughout the nation, demand for Expanding Learning Opportunity (ELO) programs is outstripping supply. These programs, which provide a wide range of enrichment opportunities to school-age children and youth (ages 5-18), operate before and after school, during summers, and on weekends in such diverse settings as parks and recreation departments, youth centers, licensed child care facilities, sports organizations, and community service programs. A growing body of research shows that participation in these programs has been linked to such academic and non-academic gains as improved school attendance, social skills, critical problem-solving, collaboration, and innovative thinking.
As interest in these programs has increased, education policy makers have turned their attention to supporting ELOs and exploring ways to measure and improve program quality. Washington lawmakers in 2015 recognized the value of high-quality enrichment programs with the Early Start Act. Among other directives, the law requires the state Department of Early Learning (DEL) and the Office of the Superintendent of Public Instruction to jointly design and implement, by July 1, 2017, a plan to incorporate providers of before and after school programs for school-age children into an “appropriate quality improvement system.” It also creates a funding pathway to evaluate program quality. In 2016, DEL launched the Expanded Learning Opportunity Quality Initiative with matching funds from the Raikes Foundation. The initiative’s ultimate goal is to build a high-quality, equitable, state-supported ELO system for Washington’s school-age children and youth.
Cultivate Learning (formerly the Childcare Quality and Early Learning Center for Research and Professional Development) at the University of Washington conducted a 34-week-long evaluation of this initiative pilot ending in August 2017. We present preliminary findings in this report.

2ELO QUALITY INITIATIVE PILOT | EVALUATION STUDY
Evaluation Approach and FindingsOur evaluation addressed two broad goals:
Purpose/Study 1: Program Quality, Practice-based Coaching. To understand quality in a sample of ELO sites and to explore a quality improvement intervention. Purpose/Study 2: Stakeholder Experiences. To understand the experience of coaches and providers in the pilot and hear their perspectives on improvement interventions (stakeholder experiences).
Study 1 included a pre-assessment, an improvement intervention (Practice-based Coaching), and a post-assessment. Our study design allowed us to apply a continuous quality improvement approach to a coaching model to collect and analyze information frequently. For this evaluation, Cultivate Learning recruited 50 programs to receive training on program quality and Practice-Based Coaching from coaches from School’s Out Washington (SOWA), an organization that supports afterschool and summer programs, and Child Care Aware of Washington. Coaching was delivered in person and online.
Evaluation sites were spread across four regions (Spokane, King, Pierce, and Walla Walla counties) and all program types (licensed family homes and childcare centers, 21st Century Community Learning Centers, and school-age and youth after school programs.) Fourteen coaches participated across the four regions. We categorized sites according to their type of offering for children and youth: academic programs (4 sites); specialized programs that teach a specific skill (9 sites); and recreational programs (37 sites). Participating programs received iPads to use in conjunction with the Coaching Companion, an online coaching tool, as well as video recorders and other equipment to collect data and send it to Cultivate Learning.
Direct observation measures used in the evaluation were: the School-Age and Youth Program Quality Assessment tools (SAPQA and YPQA), the Cultivate Learning-developed Engagement in Classrooms Data Collection (ECDC) observational tool, and Quality Seal, a new tool that Cultivate Learning developed and validated to measure ELO program quality in this evaluation. In the pre-assessment and post-assessment phase, Cultivate Learning data collectors assessed programs via live observation using the Quality Seal tool, and SOWA assessed programs with the PQA. During the Practice-based Coaching intervention, coaches worked with programs weekly to conduct in-person coaching sessions every other week and online coaching sessions—via the Coaching Companion, an online coaching tool—on alternating weeks. During the intervention period, data collectors observed programs via weekly recorded video and assessed quality using the ECDC and the modified SAPQA and YPQA tools.
Results of Study 1 showed that:
• Before intervention, program quality was variable across the 50 sites.
• Programs that were rated as lower than average before coaching improved significantly in overall quality; and in the safe environment and engagement domains of quality; and on several items of the Quality Seal after training and a short trial of Practice-based Coaching.
• Coaches implement Practice-based coaching (in person and online) best when provided with ongoing support and individualized feedback
• Coaching fidelity and hours are related to program improvement.
Study 2 consisted of Cultivate Learning-conducted focus groups and interviews to hear directly from participating coaches and program staff and leadership about the continuous quality improvement process and experiences within ELO programs. Issues addressed in the focus groups and interviews included elements of quality programming, helpfulness of coaching, use of data, value of online coaching, challenges of technology, and program capacity (staff resources and turnover). In all, 33 programs, nine coaches, and 55 program staff and leadership participated in Study 2.
Results of Study 2 showed that:
• PQA training helped program staff to define and “see” quality.
• Program staff and directors found coaching and data helpful, and they desired more frequent observations and feedback.

3ELO QUALITY INITIATIVE PILOT | EVALUATION STUDY
• When coaches were able to include program leadership, sites were able to collaborate more and resolve issues as they arose.
• Program staff and coaches regard online coaching as having potential, but more support is required for coaches and program staff to use the Coaching Companion tool.
• Programs experience several systemic barriers to improving quality including unstable staffing, limited time for training, and limited funding to support staff.
Summary of Recommendations from Studies 1 and 21. Programs that fall within the low-quality designation, based on their PQA scores, benefit most from intensive train-
ing and coaching support. This support would include a designated coach that would engage the program staff and leadership in regularly scheduled trainings and Practice-based Coaching. It would also include program as-sessment, evidenced-based goal-setting, focused observation and feedback, and trainings on research-based best practices in the ELO field.
2. Improvement-based interventions should have an adequate amount of time to ensure that trainings and coaching are ongoing and produce quality improvements. In our evaluation, programs that received more access to coaching and training improved their quality overall.
3. Systems for frequent monitoring and feedback of coaching fidelity should be put in place to increase the likelihood of coaching impact on program quality.
4. More research is necessary to determine an adequate amount of Practice-based Coaching and other re-search-based trainings that lead to program improvement.
5. Coaching and training should be offered program-wide. This approach would include coaching all of the staff within the program as well as the director. Staff, coaches, and leadership mentioned that disconnects between program staff and directors interfered with improvement efforts. Conversely, when leadership and staff collaborated in coaching sessions, program interferences in improvement efforts could be more easily resolved by the leadership. Allowing coaching to be inclusive across the program can help to align goals and mitigate programmatic interfer-ences in quality improvement.
6. ELO programs would benefit from having access to a resource library of videos, articles, and other resources that support improvement efforts. This would allow program staff to learn and develop outside of program hours, and it would allow multiple staff and leadership to access the same materials and build consensus around aspects of quality and goals for improvement.
7. Coaching Companion should be used for coaching purposes. Coaches and program staff and leadership agree that having access to video supported development and allowed for ease at difficult scheduling times. Online review of performance allowed coaches to be specific about particular moments and allowed staff to see those specifics. Additionally, coaching via Coaching Companion allowed program staff to capture and share practice for which they wanted feedback.
8. Training and support should be provided to coaches and staff who engage in the Coaching Companion. While there are costs and resources associated with training and supporting the use of this online tool, they are far outweighed by the benefits of using it. Coaching Companion consumes fewer resources than in-person coach visits, and it allows for specific program practices to be reviewed and dissected.
9. Program staff should have dedicated, paid time to engage in professional development. And training.
This report presents preliminary findings of the evaluation of the Expanded Learning Opportunity (ELO) Quality Initiative Pilot in Washington State. Cultivate Learning at the University of Washington conducted this work.

4ELO QUALITY INITIATIVE PILOT | EVALUATION STUDY
1. Introduction
Expanded Learning Opportunity programs provide a wide range of enrichment programing to school-age children (ages 5-13) and youth (ages 14-18). They operate before and after school, during summers, and on weekends. ELO programs are provided in diverse settings, such as nationally sponsored youth organizations, federally funded programs, autonomous non-profits, faith-based organizations, parks and recreation departments, youth centers, sports organizations, and community service programs (Mahoney, Reed, Eccles, & Lord, 2005).
In Washington and other states, demand for these programs greatly exceeds availability. A recent analysis (http://www.afterschoolalliance.org/aboutUs.cfm) shows that, nationwide, 10.2 million children and youth attend ELO programs, but parents of 19.4 million children and youth indicate that their children would attend a program if one were available to them. The same analysis shows that, in Washington State, 183,099 children are enrolled in ELO programs, 333,927 are waiting for an available program, and 217,293 are alone and unsupervised during after-school hours. Funding is the most significant barrier to access both nationwide and in Washington. There is currently little consistent or designated funding resource that supports ELO programs. A small share of ELOs in Washington and nationwide is supported through the only federal funding resource specifically directed to ELOs: the 21st Century Community Learning Centers Funding Opportunity (21st Century CLC). In Washington, CLC resources support only 50 programs and 18,445 participants (http://www.k12.wa.us/21stCenturyLearning/Grantees.aspx).
Benefits of ELOsEven as unmet demand for ELO programming grows, an expanding body of research shows that the programs offer opportunities to provide training in critical problem-solving, collaboration, and innovative thinking—all skills that, in the long-term, employers value. ELOs also provide the space for children and youth to build social skills in group settings, which increases self-confidence and some programs expose students to career paths—these are especially important to underserved communities (Grant, Higginbotham, Llano, & Lucheta, 2013). Studies show that attendance and participation in ELO programs have been linked to numerous academic and non-academic gains, including increased school attendance (Auger, Pierce, & Vandell, 2013; Durlak, Weissberg, Dymnicki, Taylor & Schellinger, 2011; Huang, La Torre, Harven, Huber, Jiang, Leon, & Oh, 2008), increased participation in class (Learning Point Associates, 2011), better grades and performance on tests (Durlak et al., 2011), reduced likelihood of developing problems with alcohol and drugs (Grossman & Tierney, 1998; Youniss, Yates, & Su, 1997; Youniss, Mclellan, Su, & Yates1999), reduced occurrence of depression and anxiety in adolescence (Barber, Eccles, & Stone, 2001; Brustad, Babkes, & Smith, 2001; Larson 1994; Mahoney, Schwder, & Stattin, 2002), promotion of personal and social development (Durlak et al., 2011), and even a lowered obesity prevalence (Mahoney, Lord, & Carryl, 2005). In addition, participation in ELO programming has been linked to increased critical thinking, problem solving, collaboration, and innovative thinking. ELO programs also provide invaluable, structured group settings to build these skills and increase self-confidence (http://www.expandinglearning.org/expandingminds/article/business-leaders-expanding-afterschool-and-summer-learning-opportunities-can). Although participation in ELO programs benefits all children and youth, participants from underserved youth populations experience greater benefits in social, academic, and language domains (Mahoney et al., 2005).
The Washington State ELO PilotWashington lawmakers in 2015 recognized the value of high-quality enrichment programs with the Early Start Act. Among other directives, the law mandates the implementation and study of a Quality Rating and Improvement System (QRIS) pilot for programs serving school-age children, similar to the state’s Early Achievers initiative. The legislation requires the state Department of Early Learning (DEL) and the Office of the Superintendent of Public Instruction (OSPI) to jointly design and implement, by July 1, 2017, a plan to incorporate providers of before and after school programs for school-age children into the Early Achievers program or “other appropriate quality improvement system.” It also creates a funding pathway to evaluate program quality. (See https://del.wa.gov/providers-educators/laws-rules-and-performance-standards/del-rules-under-development/early-start-act.)

5ELO QUALITY INITIATIVE PILOT | EVALUATION STUDY
With support from the Raikes Foundation, DEL in 2016 launched the Expanded Learning Opportunity Quality Initiative. The initiative’s ultimate goal is to build a high-quality, equitable, state-supported ELO system for Washington’s school-age children and youth. The department convened a Steering Committee, with representation from multiple organizations working within the ELO field, to meet monthly to discuss and align ELO quality standards, communication, and improvement efforts. (See Appendix A for a full list and description of partner organizations.) The Steering Committee leads the quality initiative and provides direction for the ELO pilot and evaluation.
For this evaluation, Cultivate Learning recruited 50 programs to receive training on program quality and Practice-based Coaching from 14 coaches from School’s Out Washington (SOWA), an organization that supports after school and summer programs. Coaching was delivered in person and online. Throughout the coaching intervention, we collected rapid cycles of data that we analyzed and shared with coaches to improve practice and to document changes in site quality.
At the request of the sponsoring agencies (DEL and Raikes Foundation), we focused the evaluation on two broad purposes or studies:
Purpose/Study 1: Program Quality and Practice-based Coaching. To describe the quality of a sample of ELO programs and to explore the use and impact of an improvement intervention (including Practice-based Coaching delivered in person and online).
Purpose/Study 2: Stakeholder Experiences. To understand the experience of coaches and providers in the pilot and hear their perspectives on improvement interventions (stakeholder experiences).
Each purpose addressed multiple research questions and required a unique study design and methodology. In the following section, we provide an overview of the evaluation including the timeline, participant selection, measures, and a description of Practice-based Coaching. This is followed by a description of the two studies.

6ELO QUALITY INITIATIVE PILOT | EVALUATION STUDY
2. Evaluation Overview
The overarching goal of the ELO Quality Initiative Pilot evaluation was to examine ELO site quality and the feasibility, perceived value, and impact of improvement efforts such as Practice-based Coaching. The evaluation was approved by the University of Washington Human Subjects Institutional Review Board in July 2016.
Our evaluation spanned 34 weeks and included a pre-assessment, an improvement intervention (Practice-based Coaching) led by coaches and trainers, and a post-assessment. We assigned sites to five cohorts and started the improvement intervention in a staggered fashion across them. We collected five weeks of baseline quality data on each site within each cohort and then conducted the intervention in the remaining weeks. Once this was underway for the first cohort, we added the next cohort, and so on. We continued this approach until all five cohorts were receiving the intervention. Finally, in May 2017, Cultivate Learning conducted a post-intervention assessment of quality. Each week all sites were required to videotape one hour of their program and submit the videos to us for coding and analysis.
Throughout the improvement intervention, coaches reported their coaching activity to Cultivate Learning weekly, and we coded weekly site video data. We shared data on site quality and coaching fidelity with SOWA coaches every two weeks, and the coaches shared the data with the sites they coached. We made modifications to the intervention as needed to improve the intervention based on the analyzed data. The evaluation team conducted focus groups with program participants and coaches to understand the perceived impact and value of the coaching intervention as well as the feasibility of online coaching. Figure 1 provides a timeline of the evaluation.
Figure 1. Timeline of Evaluation
Multiple Baseline ApproachKey purposes of the evaluation were to study the quality of ELO programming and to examine the process and impact of Practice-based Coaching, with an eye toward refinement. We determined at the outset that impact studies and more traditional evaluations did not align with the goals of this evaluation. Instead we required a study design that would apply a continuous quality improvement approach to a coaching model and provide a mechanism for SOWA to modify the support it provided to coaches. The multiple baseline approach allowed us to collect and analyze data frequently. These data then help to identify program elements that support or undermine improvement efforts, and the information allows for responsive tweaks to make the ongoing intervention increasingly effective. In other words, rapid data cycles make it possible to adjust and revise the intervention in response to what is and is not working. A multiple baseline study can also demonstrate the impact of an intervention. The design attempts to control for the effects of extraneous events by showing that specific changes are associated with the onset of the intervention. This is done by dividing the sample (study participants) into multiple groups and staggering the start of the intervention. More details about the multiple baseline design and analysis are provided in Section 5 of this report.
Mar Apr May Jun Jul Aug Sep Oct Nov Dec Jan Feb Mar Apr May Jun Jul
Coaching and Targeted PD(Nov 2016–May 2017)
Data Analysis(Nov 2016–May 2017)
Pre-Assessment of Sites(Oct 2016)
Post-Assessment of Sites(Mar 2017)
Report to DEL(Aug 2017)
Recruitment(Jun–Aug 2016)
2016 2017

7ELO QUALITY INITIATIVE PILOT | EVALUATION STUDY
Below, we describe how we selected and recruited programs and conducted initial visits.
Program Selection CriteriaThe ELO Quality Initiative Steering Committee established criteria for selecting programs to participate in the study. The state agencies specified regions of focus (Spokane, King, Pierce, and Walla Walla counties) based on historic ELO investments from the Raikes Foundation. The evaluation recruited all program types (licensed family homes and childcare centers, 21st Century Community Learning Centers, and school-age and youth after school programs) that fit the established criteria and were within the specified regions that were recruited to participate. Figure 2 shows a map of the State of Washington with the program recruitment regions highlighted.
Figure 2. Participating Program Regions
One of the goals of our study was to assess quality improvement of participating sites before and after the intervention. For this reason, sites that were actively using the Youth Program Quality Assessment (YPQA) tool with dedicated coaching were not considered for participation. Sites that had used the YPQA but were not currently using the tool were considered for participation. A subset of the steering committee (representatives from SOWA, OSPI, DEL, and Child Care Aware of Washington–CCA) worked together to identify sites that met the criteria for participation. These organizations reached out to sites to assess their interest in participating. The final selection of sites included a review by the evaluation team to ensure that the sites represented sufficient regional and programmatic diversity to support the study design. (See Appendix B for a complete list of selection criteria for participation.)
Program RecruitmentSOWA, DEL, and OSPI initiated the contact and recruitment process. We recruited programs through email, phone calls, and through coaches and trainers. Table 1 shows program recruitment efforts broken down by regions.
Table 1. Program Recruitment and Participation
Regions Number of Programs Contacted
Number of Programs Opted In
Number of Programs Opted Out
King 25 16 9
Pierce 18 13 5
Spokane 15 14 1
Walla Walla 7 7 0
KingCounty
PierceCounty
Walla WallaCounty
SpokaneCounty

8ELO QUALITY INITIATIVE PILOT | EVALUATION STUDY
Participation incentives included 20 to 30 hours of training and professional development tied to the School-Age and/or Youth Program Quality Assessment (SAPQA or YPQA), valued at $7,250, and stipends that ranged from $1,500 to $3,000 depending on the size of the program. Once applications were submitted, we awarded programs a signing bonus of $300. (See Appendix C for a complete list of recruitment incentives.)
Application Process and ConsentPrograms that volunteered to participate in the study were required to complete an application form. (See appendices D1 and D2 for the full application forms and Appendix D3 for the participation agreement checklist.)
In the summer of 2016, prior to the start of the study, we distributed electronic and hard copies of consent forms with introductory letters to all participating program staff and parents or guardians of children. These letters explained the evaluation along with the responsibilities and details for participating. Program staff, parents, and guardians signed and returned the consent forms. (See appendices E1, E2, and E3 for the full text of staff and parent consent letters.)
3. Participating Programs and Coaches
Various program types—including licensed family childcare homes and childcare centers, 21st Century CLCs, and school-age and youth after school programs—were represented within each region. Nine of the school age programs were licensed. The distribution of these program types, by county, remained constant throughout the entire study, as shown in Table 2.
Table 2. Program Type Distribution by County
King (16) Pierce (13) Walla Walla (7) Spokane (14) Total
21st Century CLCW 4 1 5 2 12
Youth Development 3 4 0 4 11
School-age 7 3 0 5 15Family Home Childcare (FCC) Early Achievers 0 5 0 0 5
0-12 Childcare Centers (CCC) Early Achievers 2 0 2 3 7
Original Cohort BreakdownWe initially divided the recruited 50 programs into four cohorts. Tables 3 and 4 show the breakdown of these original cohorts by county and by program type. We took the following factors into consideration when creating cohorts:
• Consistency in cohort size: Cohort size ranged from 11–12 programs.
• Distribution of coaches: 14 coaches participated in the pilot. Coaches were also distributed across the four regions. Coaches’ capacity and caseloads were considered in cohort grouping.
• Alternating regions: All of King and Walla Walla county sites were grouped and distributed across cohorts 1 and 3. All of Pierce and Spokane county sites were grouped and distributed across cohorts 2 and 4. This distribution helped coaches to implement the lessons learned from coaching their earlier cohorts when working with programs in later cohorts.

9ELO QUALITY INITIATIVE PILOT | EVALUATION STUDY
Table 3. Original Cohort Distribution by County
Cohorts Counties Total Cohort Video Baseline Start Date
Cohort Intervention Start Date
Cohort 1 King = 8 Walla Walla = 3 11 programs 10/16/2016 11/20/2016
Cohort 2 Pierce = 6 Spokane = 7 13 programs 11/6/2016 12/18/2016
Cohort 3 King = 8 Walla Walla = 4 12 programs 12/11/2016 1/22/2017
Cohort 4 Pierce = 7 Spokane = 7 14 programs 1/8/2017 2/19/2017
Table 4. Original Distribution of Program Type by Cohort
Cohort 1 Cohort 2 Cohort 3 Cohort 4 Total
21st Century CLC 3 2 6 1 12
Youth Development 2 3 1 5 11
School-age 3 2 5 5 15
Family Home Childcare (FCC) Early Achievers
0 4 0 1 5
0-12 Childcare Centers (CCC) Early Achievers
2 2 2 1 7

10ELO QUALITY INITIATIVE PILOT | EVALUATION STUDY
Revised Cohort BreakdownDue to unforeseen issues with a small number of sites, we altered the cohort design part way through the study. First, a few sites from earlier cohorts requested to be shifted to later cohorts. Later, in December 2016, four sites requested to be removed from the study: one in King County, and three in Spokane County. These sites were all replaced with new sites, each in their respective counties, but these new sites were not able to start participation until a much later date. To adapt, we created a new cohort, Cohort 5, which began the coaching intervention much later than the other four cohorts. Tables 5 and 6 show the breakdown of these revised cohorts by county and by program type.
Table 5. Revised Cohort Distribution by County
Cohorts Counties Total Cohort Video Baseline Start Date
Cohort Intervention Start
Date
Cohort 1 King = 7 Walla Walla = 3 10 programs 10/16/2016 11/20/2016
Cohort 2 Pierce = 5 Spokane = 7 12 programs 11/6/2016 12/18/2016
Cohort 3 King = 8 Walla Walla = 3 11 programs 12/11/2016 1/22/2017
Cohort 4 Pierce = 8 Spokane = 3 11 programs 1/8/2017 2/19/2017
Cohort 5
King = 1 Pierce = 1
Spokane = 3 Walla Walla = 1
6 programs 2/5/2017 3/5/2017
Table 6. Revised Distribution of Program Type by Cohort
Cohort 1 Cohort 2 Cohort 3 Cohort 4 Cohort 5 Total
21st Century CLC 3 2 6 1 0 12
Youth Development 2 3 1 5 0 11
School-age 3 2 4 2 4 15
Family Home Childcare Early Achievers 0 4 0 0 1 50-12 Childcare Centers (CCC) Early Achievers 2 2 1 1 1 7

11ELO QUALITY INITIATIVE PILOT | EVALUATION STUDY
To understand how sites differed in quality, we categorized them based on the kind of offering they provided to youth and children (for example academic, recreational, and specialized).
• Academic: Programs in which youth learn about academic topics and/or receive academic help
• Specialized: Programs that teach youth a specific skill (for example skateboarding)
• Recreational: Family home or center-based programs in which youth do arts and crafts, sports, etc.
The number of sites that offered these different kinds of programming were as follows:
• Academic (4)
• Specialized (9)
• Recreational (37)
Practitioner DemographicsDuring the pre-assessment phase, 45 of the 50 sites completed information regarding practitioners’ educational background and experience. Table 7 displays information about experience.
Table 7. Practitioner Demographics in the ELO Evaluation
How many years have you worked in programs like this one? How many years have you worked in this program?
Number of Years Number of Staff Number of Years Number of Staff
Up to 1 5 Up to 1 181–5 20 2–5 17
6–10 10 6–10 611–1 5 6 11–15 216–20 3 16–20 2More than 20 3 More than 20 0
Table 8 shows the breakdown by educational background among staff working in the ELO programs.
Table 8. Practitioner Educational Background
Region High School Diploma
Some College Bachelor’s
Graduate Program; No Degree Yet
Master’s Did Not Report
King 2 8 5 1 0 0Pierce 0 7 4 0 1 0Spokane 0 8 3 0 1 2Walla Walla 0 1 3 0 1 0Total 2 24 15 1 3 2
In addition, 3 out of the 47 staff are certified school teachers, and a different set of 3 out of 47 staff are certified social workers.

12ELO QUALITY INITIATIVE PILOT | EVALUATION STUDY
Coach Recruitment and DistributionSOWA and CCA are among the largest agencies that provide training and professional development to programs in Washington, and for this reason, we asked them to provide recruitment and supervision of the evaluation coaches. SOWA recruited most of the coaches from an existing pool of ELO coaches who had from 5 to 25 years of experience in coaching, education, and/or youth development. The agency also recruited new coaches with similar criteria. Five coaches worked for CCA. (See Appendix F for coach recruitment criteria.)
We recruited 14 coaches for the pilot. Coaches lived in the counties where they were assigned to coach, and as a result, were familiar with the programs in their regions. Coaches recruited through CCA were assigned to the childcare and family home centers. The 12 FCC and CCC programs that were a part of the evaluation were also simultaneously participating in Early Achievers. To keep their coaching experience consistent, we assigned all FCC and CCC sites in the evaluation to the same coach with whom they were working through Early Achievers.
Site Visits, Technology, and EquipmentEvaluation team members conducted two site visits to each participating site prior to the start of the pre-assessment. Team members included a SOWA staff member and two Cultivate Learning staff members. The purpose of the first site visit was to meet with participating site staff and explain the aim and purpose of the study, give them opportunities to ask questions, and explain in further detail one of the most important aspects of the evaluation: video filming. The purpose of the second visit was to acclimate the site to the video equipment and help staff set up for filming.
After school programs tend to offer a variety of activities, such as large group activities, small group time, and meals. The first site visit helped sites select the program offering that would be captured weekly on video, which needed to meet the following criteria:
1. The program offering had to be offered weekly, at the same time, by the same instructor.
2. The program offering had to contain interactions so that the video footage could be scored using the program quali-ty assessment (PQA) tool.
3. The program offering had to be held in a room that provided suitable lighting and audio for video recording.
4. The program offering had to be facilitated by a permanent staff member who would teach the program over the 34 weeks of the study’s duration. The staff member had to consent to being filmed and be comfortable using the cam-era and being recorded. In addition, the same staff person had to be the one participating in the intervention efforts.
At the initial visit, SOWA also distributed iPads to all programs to use in conjunction with the Coaching Companion, an online coaching tool that provides a space for private video sharing, coaching, and feedback sessions.
Each site received a Zoom Q8 Handy Video Recorder, a battery pack, charger, and one memory card for each week of the study. Sites that filmed in rooms with low acoustic quality such as gyms and cafeterias were given lavalier mics and long extendable tripods. Programs with small class sizes were given hand-free boom mics and small flexible tripods. All equipment included detailed instructions for recording. Programs used pre-paid envelopes addressed to Cultivate Learning to send in their weekly memory cards.
Each site had a second visit from the Cultivate Learning media team and SOWA team prior to the start of data collection and Practice-based Coaching. During this visit, we installed video equipment and trained the main point of contact in each program on how to use the equipment, how to submit memory cards weekly, and how to troubleshoot equipment glitches. At the start of the study each site was expected to:
• Record the one-hour, pre-determined and consistent portion of the program offering on a weekly basis.
• Mail each week’s memory card containing footage of the ELO program offering to Cultivate Learning.

13ELO QUALITY INITIATIVE PILOT | EVALUATION STUDY
Evaluation TeamThe evaluation team consisted of a principal investigator, a co-principal investigator and project director, an assessment lead, six data collectors, a curriculum specialist, and three graduate student research assistants. We recruited and hired members of the data collection team from January 2016 through October 2016. The roles and responsibilities of team members were:
• Principal investigator: responsible for the design and execution of the evaluation.
• Director and Co-Principal Investigator: responsible for overseeing the progress of the evaluation.
• Assessment lead: responsible for overseeing the data collection and creating processes for data collection includ-ing communicating with sites and coaches to support the integrity and quality of the data.
• Data collectors: reliable in the PQA, Quality Seal (see sections 4 and 7 for a description), and other assessment tools. In addition, all personnel handling data took part in an IRB Human Subjects Review training and certification process.
• Curriculum specialist: responsible for creating professional development materials for coaches and field staff.
• Graduate students: assisted with report writing, data analysis, and design of the evaluation.
4. Measures and Procedures
We used several direct observation measures in the evaluation. We describe each in the following section.
Program Quality Assessment The PQA (Smith & Hohmann, 2005) is a widely used program quality tool that assesses a program’s ability to create a safe, supportive, and productive environment for youth. It is available in two versions, the School-Age PQA and the Youth PQA. Each version of the PQA used in this study incorporates several age group-appropriate dimensions that load onto specific domains. Overall, they share 80% of their content (Smith & Hohmann, 2005). Following are the two PQA versions used in this study:
• School-age PQA. The school-age version of the PQA is appropriate for use in after school programs serving youth from grades K-4 and consists of four domains: safe environment, supportive environment, interaction, and engage-ment. Each domain includes between 4 - 6 scales, with each scale containing between 2 - 7 sub- scales, making up a total of 19 scales and 70 sub-scales. Scales in each domain describe a certain environmental feature, routine, or action. As an example, the School Age PQA interaction domain, contains 4 scales, such as: Managing Feelings (has 4 sub-scales), Belonging (has 4 sub-scales), School-Age Leadership (has 3 sub-scales) and Interaction with Adults (has 4 sub-scales). The sub-scales are averaged together to yield an average for the scale, and the scales are av-eraged together to yield a domain score between 1-5 (with 1 indicting a low quality and 5 indicating a high quality). For instance, the Safe Environment Domain has 5 scales and 20 sub-scales that make up a domain
• Youth PQA. The youth version of the PQA is appropriate for use in after school programs serving youth from grades 5 -12 and consists of the same four domains: safe environment, supportive environment, interaction, and engage-ment. Just like the SAPQA each domain includes between 2 - 6 scales, with each scale containing between 2 - 6 sub-scales, making up a total of 17 scales and 63 sub-scales. As an example, the Youth PQA interaction domain, contains 4 scales, such as: Belonging (has 4 sub-scales), Collaboration (has 3 sub-scales), Leadership (has 3 sub-scales) and Adult Partners (has 2 sub-scales). The sub-scales are averaged together to yield an average for the scale, and the scales are averaged together to yield a domain score. For instance, the Safe Environment Domain has 5 scales and 19 sub-scales that make up a domain. Additionally, each sub-scale in PQA is organized at an item level, with categories of 1, 3, and 5, with 1 indicting a low quality and 5 indicating a high quality.

14ELO QUALITY INITIATIVE PILOT | EVALUATION STUDY
Engagement in Classrooms Data Collection (ECDC)The Cultivate Learning-developed ECDC (Joseph, Taliano, & Soderberg, 2014) is a momentary time-sampling observational tool that provides an organized approach to tracking children’s engagement (or on-task) behaviors. It was designed for use as an indicator of a quality classroom environment, by looking at children’s engagement with materials, peers, and adults. Adapted from the work of Daniel and Shapiro (1996), this tool provides a systematic approach to observe and track young children’s engagement behaviors. Data collectors recorded the occurrence of one of four types of behaviors: mastery engagement (ME), functional engagement (FE), off-task (POFT), and challenging behaviors (CB). Behaviors are coded as present or not during three-second intervals. For the current study, six children were randomly selected and observed across multiple cycles lasting a total of 60 minutes. Because attendance in afterschool programs can be variable, in each observation the focal children could be different from one observation to the next. In ME, the child exhibits behaviors that demonstrate a growing mastery of the task at hand because these are consistent with the teacher-intended objective of the activity. In FE, the child exhibits behaviors that demonstrate a raw understanding of how materials are expected to be used. In these cases, adult and peer interactions may occur, but they are not avenues for developing further understanding or skill. POFT indicates non-participation in the assigned activity; the child does not use materials at all or is not attending to teachers or peers during the interval. In CB, the child demonstrates inappropriate motor or verbal behaviors that are dangerous or disruptive to peers or the flow of class. Summary scores for the ECDC will be percentages of time observed in a certain level of engagement. For example, the data might read: in observation 1 children engaged in challenging behavior 20% of the time.
Quality SealThe Quality Seal is a new tool for ELO program quality assessment, developed and validated for this evaluation by Cultivate Learning as a way to effectively and efficiently measure ELO program quality. (See Appendix G for the original and revised Quality Seal items. See Appendix H for a description of how the tool was validated.) We developed the Quality Seal to create a unified assessment tool for both school-age and youth populations that could assess ELO quality comprehensively, accurately, and concisely, emphasizing only the essential aspects of ELO program quality. We used the Quality Seal in both pre-assessment and post-assessment of ELO program quality. The Quality Seal “Big 5” Domains of program quality are: Social and Emotional Support; Relationships; Program Offering and Activities; Assessment, Planning and Organizational Structure; and Family, School and Community Connections. Each domain contains between four and nine items. Each item evaluates specific and measurable behaviors or occurrences within a program that are used to quantify a particular aspect of program quality. Each item uses either one or two out of three possible data methods: observation, interview, and document analysis. Unlike the PQA, the Quality Seal follows a continuous rating system, where each item can be scored at a 1, 2, or 3 with 1 indicating a low quality and a 3 indicating a high quality.

15ELO QUALITY INITIATIVE PILOT | EVALUATION STUDY
Training and Inter-rater Reliability (IRR)We required data collectors to achieve 80% reliability on each measure before conducting program observations. We designated the 80% level because this is the commonly-held IRR requirement for other widely used program quality assessments (i.e., ECERS-R, CLASS PreK).
SOWA provided training, certification, and reliability for the YPQA and the SAPQA. Data collectors attended multiple days of training and were expected to establish reliability of 80% to the gold standard to gain the certification. We tracked ongoing inter-rater reliability for the two PQAs on a monthly basis. Data collectors all coded the same hour-long video and then tested the 80% inter-reliability threshold. Data collectors also had the opportunity to discuss with each other differences in their ratings, allowing them to gain a greater understanding of the tool.
For the Quality Seal, the data collection team attended three days of training during which they reviewed each item in the tool, its definition, and data collection method. Assessors were assigned two or three live assessments in pairs to establish IRR during the summer of 2016. Average IRR for these assessments was 83%. Ongoing IRR evaluations for the Quality Seal occurred once a month through the coding of one hour-long program video. Assessors who did not meet the 80% IRR threshold were given additional training before collecting more data.
For engagement, Cultivate Learning trained data collectors on the use of the tool through video coding of real program sessions. In each video, a rotation of six youth served as observation targets. Data collectors were expected to establish initial reliability of 80% with the gold standard code produced by the supervisory team before doing an observation.
We also assessed ongoing IRR through the use of videos. Of the 50 programs, we randomly selected about 25% (13) programs, and of the 13 programs, we again randomly selected 25% of the videos for double coding. In total, 86 of 862 PQA videos were double-coded to establish IRR. Data analysis shows that the IRR for video coding was 0.81or 81%. (See Appendix I for weekly video coding IRR for PQA.) In common with other tools, trainings and ongoing engagement IRR evaluations were conducted on a monthly basis.
In the following sections, we present the two purpose/studies of this evaluation and associated research questions.
16ELO QUALITY INITIATIVE PILOT | EVALUATION STUDY
5. Purpose/Study 1: Program Quality and Practice-based Coaching
To describe the quality of a sample of ELO programs and to explore the use and impact of an improvement intervention (including Practice-based Coaching delivered in person and online).
• RQ 1.1 What is the baseline quality of programs included in the sample?
• RQ 1.2 How does Practice-based Coaching work across multiple settings, and what refinements are necessary to improve practice?
• RQ 1.3 How do programs change over the course of the quality initiative?
• RQ 1.4 How is the intervention effect mediated by coaching hours and fidelity?
We designed Study 1 to examine the program quality in a sample of programs and to study the implementation process and effects of a Practice-based Coaching model (offered both in person and online) on program quality. Practice-based Coaching has been used in Early Achievers since 2012. In this study, we explore how Practice-based Coaching works in ELO settings and what can be learned about implementation that will lead to refinements to the model and process.
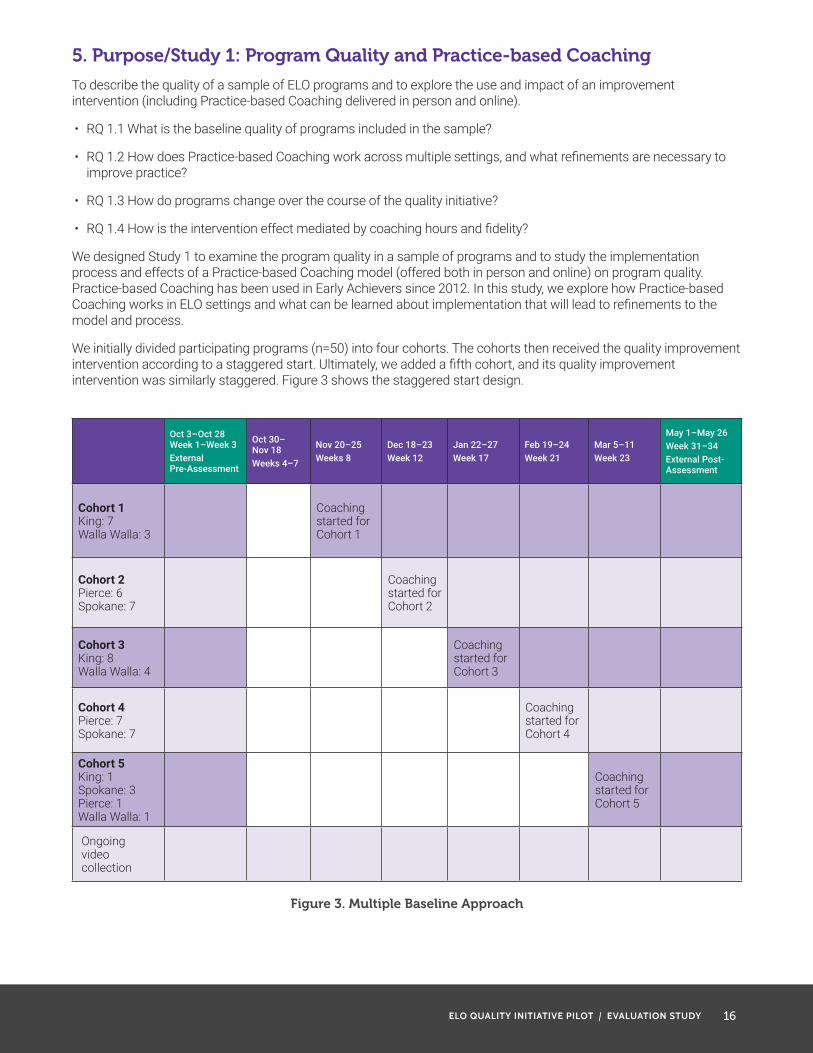
We initially divided participating programs (n=50) into four cohorts. The cohorts then received the quality improvement intervention according to a staggered start. Ultimately, we added a fifth cohort, and its quality improvement intervention was similarly staggered. Figure 3 shows the staggered start design.
Oct 3–Oct 28 Week 1–Week 3External Pre-Assessment
Oct 30– Nov 18Weeks 4–7
Nov 20–25Weeks 8
Dec 18–23Week 12
Jan 22–27Week 17
Feb 19–24Week 21
Mar 5–11Week 23
May 1–May 26Week 31–34External Post-Assessment
Cohort 1 King: 7 Walla Walla: 3
Coaching started for Cohort 1
Cohort 2 Pierce: 6 Spokane: 7
Coaching started for Cohort 2
Cohort 3 King: 8 Walla Walla: 4
Coaching started for Cohort 3
Cohort 4 Pierce: 7 Spokane: 7
Coaching started for Cohort 4
Cohort 5 King: 1 Spokane: 3 Pierce: 1 Walla Walla: 1
Coaching started for Cohort 5
Ongoing video collection
Figure 3. Multiple Baseline Approach

17ELO QUALITY INITIATIVE PILOT | EVALUATION STUDY
The multiple baseline approach allowed for rapid data collection and responsive adjustments to the intervention as the study was occurring.
Throughout the Practice-based Coaching intervention, the Cultivate Learning project team collected, coded, and analyzed weekly videos of the program. We analyzed and shared weekly data with coaches at multiple points throughout the intervention. In addition to PQA and ECDC data generated by weekly video coding, we provided coaches with anecdotal notes about specific situations that data collectors may have observed while scoring videos for programs. Coaches then shared that data with programs. We repeated this process every two weeks. Moreover, we used the multiple baseline design to analyze the intervention effect on students’ behavior change. We aggregated the students’ outcome measures (i.e., engagement, passive off-task, and challenging behavior) at the program level and compared the effect across cohorts.
Data Collection and ProceduresInitial data collection protocols were adapted from Cultivate Learning’s existing data collection procedures as implemented in Early Achievers. We trained data collectors to become reliable in the SAPQA and YPQA tools as well as the newly developed Quality Seal tool and ECDC. In the pre-assessment and post-assessment phase, Cultivate Learning data collectors assessed programs via live observation using the Quality Seal tool, and SOWA assessed programs with the PQA. During the intervention period, data collectors observed programs via weekly recorded video and assessed quality using the ECDC and the modified SAPQA and YPQA tools.
Live observations took place during the first four weeks of the study (pre-assessment) during October 2016 and four weeks of May 2017 (post-assessment).
Video observations took place in the intervening weeks between pre-assessment and post-assessment. The procedures for video observation were as follows:
• Step 1. Receiving video: Programs mailed secure digital (SD) cards to Cultivate Learning; SD cards took 1-2 weeks to arrive. The initial Cultivate Learning media coordinator checked for the quality of audio and video and saved the file in a password-protected location, under a folder designated for the site.
• Step 2. Coding and scoring video: Once we received the SD card for a specific site, we marked a master Google sheet to indicate that video for the specific site was available and that the data collector assigned to code that video could begin to observe and code. The first step in scoring was to watch the video and take notes. When scoring, data collectors used the scoring handbook to ensure high-quality and reliable scoring. Data collectors then used a specific survey link to enter their scores for the video. The online survey was designed to allow for multiple entries, and data collectors used the same link for all entries.
• Step 3. Aggregating data: The online survey tool allowed for exportation of data into Excel, and we exported and analyzed the data every two weeks. We calculated a weekly average for PQA and ECDC data for each program and shared data with the coaches, who then shared the information with their sites.

18ELO QUALITY INITIATIVE PILOT | EVALUATION STUDY
Results
RQ 1.1 What is the baseline quality of programs included in the sample?As figures 4.1 and 4.2 show, program quality was variable before intervention across the 50 sites, and the PQA seemed to have more variability than the Quality Seal.
1.60 1.80 2.00 2.20 2.40 2.60 2.80 3.00
Pre_Qseal
Pre_Qseal
Freq
uenc
y
0
2
4
6
8
10 Mean = 2.38Std. Dev. = .316N = 49
Figure 4.1 Variation of Program Quality before Intervention on Quality Seal
PrePQAfinal
PrePQAfinal
Freq
uenc
y
Mean = 3.79Std. Dev. = .418N = 49
2.50 3.00 4.00 4.50 5.003.50
0
2
4
6
8
Figure 4.2 Variation of Program Quality before Intervention on the PQA

19ELO QUALITY INITIATIVE PILOT | EVALUATION STUDY
When we divided sites into kinds of program offerings (academic, recreational, and specialized), we observed that sites rated similarly on the Quality Seal with the exception of sites in the specialized category, which measured 14% better than the others. Similar results were found using the PQA data, however, these results were not statistically significant. Table 9 shows baseline quality by program type.
Table 9. Baseline Quality by Program Type
Quality Measure Total (n=49)
Academic (n=2)
Center-based (n=15)
FCC (n=5)
Recreational (n=14)
Specialized (n=9)
PQA overall 3.8 3.9 3.7 3.7 3.8 3.9 Safe 4.6 4.7 4.6 4.7 4.6 4.6
Supportive 4.2 4.4 4.0 4.0 4.1 4.5 Interactions 3.6 3.1 3.4 3.6 3.6 3.8
Engagement 2.8 3.5 2.8 2.6 2.7 2.8Quality Seal 2.4 2.4 2.4 2.3 2.4 2.6
According to the Weikart Center, the PQA is “a standardized, observation-based measure that provides a score (1, 3, or 5) based on the degree to which a practice and/or characteristic was present for all youth in the setting. The scale used throughout is intended to capture whether none of something (1), some of something (3), or all of something (5) exists.” (Yohalem, Wilson-Ahlstrom, Fischer, & Shinn, 2009). The center does not evaluate quality based on a program’s score, as do other program assessments such as the Classroom Assessment Scoring System (CLASS) and the Early Childhood Environmental Rating Scale (ECERS). Instead, the Weikart Center promotes the PQA as a tool that helps programs determine where they are having success in meeting the needs of the children and youth they serve and where programs might focus their improvement efforts.
A recent study conducted by the American Institute for Research (AIR) described its approach to evaluating program quality based on the PQA assessment scores as follows:
“Once Youth PQA scores were obtained, steps were then taken to classify programs into higher, moderate, and lower quality groupings using hierarchical cluster analysis. Rasch-derived scores on the supportive environment, interaction, and engagement domains of the Youth PQA were included in these analyses. Scores from the safety domain were not included given little variation in these scores across programs. Additional steps were then taken to refine the programs assigned to the higher and lower quality groups in order to ensure there was a significant difference in the level of performance between the two groups, resulting in some lower performing centers being removed from the higher quality group and higher performing programs removed from the lower quality group. The goal was to maximize the contrast between higher and lower quality programs.” (Naftzger, 2014). http://www.cypq.org/sites/cypq.org/files/publications/2014-04-21%20Summary%20of%20Quality%20Studies%20FINAL.pdf
Weikart’s approach to PQA evaluation and AIR’s approach to determining quality based on the PQA show that there is no firmly established category for high-, medium-, or low-quality programs. We therefore have determined quality by taking an average of the varied performance of the programs involved in the evaluation and designating high, medium, and low quality based on a program’s relationship to the average program quality. Low is below average, and high is above average. Figure 5 shows the distribution of the participating programs across the PQA domains in the pre-assessment. This histogram of the 50 sites displays the mean level of quality for all domains of PQA as mid to high with the exception of the engagement domain, which is mid to low quality.

20ELO QUALITY INITIATIVE PILOT | EVALUATION STUDY
Figure 5. PQA Histogram of 50 Sites in the Pre-assessment
RQ 1.2 How does Practice-based Coaching work across multiple settings, and what refinements are necessary to improve the practice?
CoachingWe used the Practice-based Coaching model throughout the pilot. (See Appendix J for a description of Practice-based Coaching.) Prior to the start of coaching, programs completed four tasks.
1. A pre-assessment on both the PQA and Quality Seal tools. Assessments were conducted by external assessors from SOWA and UW respectively.
2. A PQA Basics Training where all programs from the same cohort come together, meet their coach for the first time, meet other programs in the cohort, and go over the timeline and expectations for the pilot and an in-depth training of the PQA tool.
3. A self-assessment using the PQA tool where program director assesses the program offering that will be participating in weekly training (also same program offering assessed by external assessors).
4. A planning meeting with data (PWD) meeting, where a coach sets up an individual meeting with program staff and director to look at their external and internal PQA data, assess overall program strengths and areas of growth and set three item level goals.
Coaching ProcessCoaches were expected to meet with their programs weekly for the duration of the study and to conduct in-person coaching sessions every other week and online coaching sessions—via the Coaching Companion—on alternating weeks. This rigorous coaching process was new to both coaches and participating programs, and along the way, we introduced incentives to ensure that coaches were meeting these requirements. We modeled all in-person and online coaching after the Practice-based Coaching process, in which coaches would set a goal and an action plan based on their quality assessment data from the PQA/YPQA, conduct a focused observation aligned with the goal, and provide feedback and reflection based on the observed practice. For example, based on pre-assessment data, a School Age site may decide to work on the subdomains of Skill Building, School Age Planning, and School Age Leadership. Coaches often start with building a relationship with staff and program leaders. This may take place during the PQA basics training, or Planning with Data meetings. After the goals are identified, a coach and the staff select one out of the three areas mentioned above to focus on. A coach would first conduct a visit to observe an entire program offering. At this visit, the coach may observe a number of areas where the staff is displaying strengths or areas of

21ELO QUALITY INITIATIVE PILOT | EVALUATION STUDY
growth. However, because the goal they’ve set is to specifically work on Skill-Building, i.e. how staff sets up activities and provides opportunities for children to develop and build a new skill; the coach focuses their observation on moments where the staff is providing opportunities for children to learn something new, or expand on an existing knowledge or skill. After the program offering is complete, the coach sits down with the program staff to provide feedback and reflection based on the observation. In the in-person meeting the coach may choose to film the staff and the two can sit down and watch the video to discuss what worked and what could be improved. If the coach did not film the staff at the in-person visit, the next step in the process would be for the staff to incorporate the feedback and demonstrate improvement at the next coaching session. At the end of the coaching session, a goal is set for a follow up in-person or online coaching session. The coach and staff continue to carry out this process until this area of improvement is successfully demonstrated. When the staff successfully demonstrates their ability to carry out Skill Building activities, they move on to the next identified goal. Each program experienced 20–30 hours of coaching to use between the onset of their coaching intervention until June 30, 2017. An introductory meeting occurred between program staff—either alone or with the site director—and coaches to determine how to schedule the hours.
Coach Meetings and TrainingStarting in July 2016 and through the end of the evaluation, coaches participated in a total of six meetings held in King County. At these meetings coaches received training, study updates, and coaching expectations from SOWA and Cultivate Learning. (See appendices K1–K6 for a list of documents, including memorandum of agreement, coaching checklist, coaching expectations, communication guide, and cohort timeline shared with coaches.) The evaluation was officially kicked off in July 2016. All partners, coaches, and data collectors came together to learn about the purpose of the evaluation and the work ahead. After the kickoff meeting, there were six subsequent coaching meetings with all recruited coaches as well as SOWA and Cultivate Learning staff. Coach meetings were designed to address challenges, clarify expectations, and implement the overall continuous quality improvement process. Throughout the evaluation, Cultivate Learning and SOWA would work with coaches to modify the intervention to improve impact based on the ongoing data collection and findings. Below is a description of the coach meetings.
• ELO study kickoff: Coaches were trained on cultural competency, the Practice-based Coaching model, and the Coaching Companion online tool. At this time, programs were still submitting applications, so coaches were not yet assigned to programs.
• First all-coaches meeting: During September 2016, Cultivate Learning and SOWA reconvened all coaches for a second training. During this meeting, coaches were given a refresher training on the evaluation overview and a notebook that contained cohort groups, timelines, and a coach memorandum of agreement outlining the coaching expectations during the evaluation. In addition, coaches were given accounts for Coaching Companion and addi-tional training navigating the website.
• Second all-coaches meeting: In December 2016, the study had officially started, and Cohort 1 coaches had start-ed coaching. Cohort 2 coaches had begun their preliminary meetings with their sites. Plenty of time was allotted to clarifying study goals and answering questions from the field. Coaches were required to submit weekly reports regarding their coaching process and were trained on documentation procedures.
• Coaches’ one-on-one meeting: In January 2017, SOWA and Cultivate Learning set up individual coaching meetings. The one-on-one meeting was intended to answer coaches’ individual questions, to introduce a new weekly docu-mentation process, and to give coaches their program data from the weekly PQA and ECDC video coding results. Coaches were given an opportunity to examine their site data and discuss how they might share the data back with the sites they coached.
• Third all-coaches meeting: In February 2017, SOWA held a meeting at which all coaches received folders that contained their programs’ PQA and ECDC data and indicated the number of coaching hours they had remaining with each site. Coaches watched a video of a site and had the opportunity to practice conducting a focused observation and providing feedback based on the video observation. Strategies for improving program quality were discussed, and coaches had an opportunity to plan their next few weeks with their sites
• Coach’s one-on-one meeting: In March 2017, a second individual coach meeting was scheduled with each coach, SOWA, and Cultivate Learning. Coaches received updated program data and overall evaluation findings. A coaching fidelity model was reinforced that emphasized the Practice-based Coaching model of conducting a focused obser-vation. SOWA and Cultivate Learning also discussed study wrap-up plans with each coach.

22ELO QUALITY INITIATIVE PILOT | EVALUATION STUDY
• Fourth all-coaches meeting: At the third all-coaches meeting, coaches shared the value of coming together and learning from one another. At their request, a fourth and final coaches meeting was scheduled for April 2017. At the fourth meeting, overall data findings were discussed, and coaches were given the opportunity to participate in a focus group in which they shared their experiences in the evaluation, discussed challenges, and made recommen-dations to improve the intervention.
Coaching FidelityTo measure program quality improvement from pre- to post-assessment, SOWA and Cultivate Learning drafted coaching recruitment criteria, coaching procedures and expectations, and a consistent coaching model to ensure that all coaching would be conducted with consistency and fidelity. In addition, we asked coaches to provide weekly coaching documentation that would provide real-time data on coaching fidelity.
Coaching DocumentationEach week during the evaluation, coaches submitted documentation electronically showing how each coaching session was conducted. Requested documentation included: the date of coaching, type of contact (in person or online), type of coaching session (goal-setting, relationship-building, focused observation, reflection and feedback) as well as duration, which PQA items were addressed, and with whom specifically from their program they met. We used this information in the data analysis to analyze coaching fidelity as well as to answer the questions related to the role of coaching in program quality improvement. (See Appendix L for the weekly coaching fidelity survey.)
Coaching IncentivesPreliminary data showed that coaching was not occurring with fidelity. Because of challenges with fidelity to the coaching model, we introduced in January 2017 coaching incentives to intervene and improve the coaching practice. Each time coaches fulfilled all of their coaching duties within a two-week period and noted that on their weekly documentation, their names were entered into a drawing for a $50 gift card. From January through April 2017, we gave a total of 14 $50 gift cards to coaches whose names were entered into the drawing.
Coach’s Site DataEvery two weeks, coaches received their site data from the weekly PQA and ECDC video coding. (See figures 6.1 and 6.2, below.) We provided the first program data to coaches during a one-on-one meeting set up in January. At this time coaches received their programs’ PQA and ECDC data along with additional coaching notes. During the one-on-one coach meetings coaches were given tips on how they might share the data with their programs and facilitate a data conversation to help them make data-based improvement decisions. Figure 6.1 shows an example of weekly PQA engagement data shared with coaches.

23ELO QUALITY INITIATIVE PILOT | EVALUATION STUDY
Figure 6.1 Weekly PQA Data Example

24ELO QUALITY INITIATIVE PILOT | EVALUATION STUDY
Figure 6.2. Weekly ECDC Data Example
We collected data weekly on every program in the study and analyzed visual data displays every week to discern intervention progress. When we identified trends—for example, if a program did not submit weekly data, progress was stagnant, etc.—we shared this information with SOWA along with suggested improvements to remedy the situation as quickly as possible. One important caveat to note is that ideally in a multiple baseline study, the intervention does not begin until a baseline trend has been established. That is, upon visual inspection, a trend would be evident. But due to understandable programmatic motives, the intervention start date was predetermined for each cohort to allow for sites to pre-plan and schedule. This means that only some programs’ data had a discernable baseline trend before the intervention occurred. In this report, we present the data only from these programs.
The multiple baseline approach provides insight into how programs improve, and it identifies program elements that support or undermine improvement efforts.
Figure 7 displays the aggregated data across cohorts for one domain from the PQA—engagement. We selected this domain because it was the lowest scoring domain at baseline and is the hardest to improve, according to the Weikart Center data. The figure shows the baseline as well as training and coaching phase data across cohorts. (See Appendix M for a complete list of programs with stable baseline of PQA in all four domains.)

25ELO QUALITY INITIATIVE PILOT | EVALUATION STUDY
Figure 7. PQA Engagement Domain Scores Across Cohorts
We note a very modest functional relationship established between the intervention and program quality. In general, based on visual inspection, we can see an initial uptick in engagement after training is provided. Engagement is variable during the coaching phase, but in general, it appears higher than at baseline. In viewing this preliminary data display it is important to consider two things. First, each data point is the average score across a cohort. Second, we have used a rather blunt instrument that may be masking more significant changes. Each data point represents the score on a domain which is comprised of several items that may or may not be the specific focus of improvement for the program and coach. In future analyses, we will refine our investigation to look at item level changes for specific programs to identify instances in which the coaching intervention worked well and didn’t to understand how we might refine the coaching model and program supports.

26ELO QUALITY INITIATIVE PILOT | EVALUATION STUDY
We also used multiple baseline design to analyze the intervention effect on students’ behavior change. We aggregated the students’ outcome measures (i.e., engagement, passive off-task, and challenging behavior) at the program level and compared the effect across cohorts. Because challenging behavior is a frequently requested training topic and issue for providers, we present the data on student behavior across cohorts in Figure 8.
Figure 8. ECDC Challenging Behavior Data Across Cohorts

27ELO QUALITY INITIATIVE PILOT | EVALUATION STUDY
Again, we see a very modest effect of coaching on student behavior. In cohorts 1 and 2, our analysis reveals an ascending baseline of challenging behavior that declines with coaching intervention. The effect is less convincing in cohorts 3-5, but since challenging behavior is not occurring at a high percentage of time, it is not reasonable to expect a large effect. (See Appendix K for individual program data representing a stable baseline for single case design.)
The benefit of the multiple baseline is that we are able to see every participating program’s data, and this was used by coaches to reflect on their own coaching behavior as well as to share with individual programs for their own continuous quality improvement. By aggregating across cohorts, we were also able to see a visible change in data trends after training and coaching.
To summarize, coaches needed support to implement the Practice-based Coaching model with fidelity, especially via online. Incentives helped to increase fidelity to the coaching model, but so did data-based, timely feedback.
RQ 1.3 What is the overall change in program quality before and after coaching? Cultivate Learning collected direct, in-person program assessment data in the fall of 2016 and again in the spring of 2017 to determine program quality improvement over time. Program quality measures for the pre- and post-assessment consisted of the YPQA, the SAPQA, and the Quality Seal. As seen above, during the period between the pre- and post-assessments, we assessed hour-long videos using a modified PQA tool and the ECDC.
EngagementGiven the diverse array of datasets and questions to be answered, we adopted several approaches to the analysis. When it comes to ECDC data, we were in the possession of a dataset that had a great number of observations (80,000), however, these observations were not independent of each other as would be the case in the most simple linear model (Ordinary Least Squares—OLS). This situation is not uncommon in education research. Education data often consist of children within the same class within the same school. In this context, one can reasonably assume that child outcomes would be correlated for children in the same classroom. Given this common property of education datasets, a solution has been standardized to analyze such data—the Hierarchical Linear Model (HLM). We have employed this model to analyze ECDC data. In modeling the ECDC data using the HLM model we have recognized that observations from the same site/week/activity/child may not be independent. This recognition has allowed us to derive correct standard error for statistical inference, resulting in a conservative approach to the derivation of conclusions from the data (Raudenbush & Bryk, 2002).
OLS for pre-post comparison of treatment effect on PQA/Quality SealFor the PQA/QS data we have used a simple OLS model as there was a single observation per site, and we have assumed that observations on different sites are independent of each other.
Using changes rather than absolute values as outcome in PQA/Quality Seal treatment effectTo analyze treatment effect on PQA/QS we used change in PQA/QS as a dependent variable rather than the post-experimental value of PQA/QS. With this approach, we wanted to control for the initial state of quality (to allow for the possibility that sites that start at different quality would be affected differently) and to avoid what in the statistical literature is called lagged-dependent-variable bias (Arellano & Bond, 1991). In multiple graphs, Figure 9 depicts the change in pre- to post-PQA data, both aggregated by domain average and overall PQA.

28ELO QUALITY INITIATIVE PILOT | EVALUATION STUDY

29ELO QUALITY INITIATIVE PILOT | EVALUATION STUDY
Figure 9. Pre- and Post-PQA Data by Domain and Overall Aggregate

30ELO QUALITY INITIATIVE PILOT | EVALUATION STUDY
Pre-to-post comparison: When we compared the pre- and post-assessment data (n=44), we observed significant changes for the overall PQA and for two subscales—safe environment and engagement. There were significant changes for PQA overall score (t=2.38; df=33; p=.023) and in two domains: safe environment (t=3.46; df=33; p=.002), and engagement (t=2.33, df=33, p=.026). Lower quality programs made the most significant changes, and average and high quality programs did not.
No significant results were observed for Quality Seal at the overall or domain/construct level. At the item level, the following aspects were significantly improved: lack of bias (t=0.51, df=48, p=.004), adult child interaction (t=0.62, df=48, p=.014), acknowledgement (t=0.54, df=48, p=.029), choice (t=0.55, df=48, p=.006), and feedback (t=0.88, df=48, p=.027). (See Appendix N for Quality Seal and PQA pre-to-post comparison.)
RQ 1.4 How is the intervention effect mediated by coaching hours and fidelity? In this section, we show how we performed a Hierarchical Linear model analysis on the ECDC data to find whether there is a statistical effect of the treatment on student engagement.
• Coaching fidelity (weekly logs and surveys): When the coaches followed the components of the Practice-based Coaching model, student engagement increased. Specifically, the coaching practices of relationship-building and focused observation increase student engagement.1
• Mediating effect of coaching fidelity: The number of coaching hours a site received predicted its interaction outcome but no other constructs or PQA mean score. Most sites submitted videos and engaged in the coaching intervention regularly, but a small number of sites from each cohort, and most sites in Cohort 5, did not consistently submit video and did not engage in frequent and regular coaching visits. We examined all participating sites to un-derstand if the number of coaching hours predicted PQA outcomes. We then re-ran this analysis but excluded sites that did not consistently submit video and did not engage in frequent and regular coaching visits. When we exclud-ed sites with irregular video submissions and coaching hours, coaching hours were related but did not significantly predict any PQA outcomes.
Summary of Findings from Purpose/Study 11. Programs that were rated as lower than average before coaching improved significantly in overall quality; and in the
safe environment and engagement domains of quality; and on several items of the Quality Seal after training and a short trial of Practice-based Coaching.
2. Coaches implement Practice-based coaching (in person and online) best when provided with ongoing support and individualized feedback.
3. Coaching fidelity and hours are related to program improvement.
6. Purpose/Study 2: Stakeholder Experiences
To understand the experience of coaches and providers in the pilot and hear their perspectives on improvement interventions.
RQ 2.1 What were the experiences of site staff, leadership, and coaches who participated in the quality initiative pilot?
RQ 2.2 What are the perspectives of site staff, leadership, and coaches regarding coaching, professional development, and overall improvement efforts that could contribute to a more effective intervention design?
1 Focused observation decreases passive behavior by 2.3 percentage points channeling it into FunctionalPlus behavior. Relationship-building increases FunctionalPlus behavior by 3 percentage points (taking away from both passive and challenging behaviors).

31ELO QUALITY INITIATIVE PILOT | EVALUATION STUDY
OverviewCultivate Learning conducted focus groups to hear directly from participating coaches, program staff and leadership about the continuous quality improvement process and experiences within ELO programs.
Designing an intervention based on research and past systems-building approaches was useful to ensure that we were implementing and studying a sound improvement effort. But to build an improvement intervention specific to the ELO field, it was crucial to collect input directly from those doing the work on the ground—that is, the coaches, program staff, and program leadership. In this section, we discuss how we conducted these focus group meetings and what we learned from the data collected. (See appendices O and P for focus group questions.)
Program Focus GroupsIn the early spring, six months into the evaluation, Cultivate Learning scheduled focus group meetings with all of the participating programs. We conducted the focus groups to learn from program staff and leadership about their experiences in the evaluation. To convene the evaluation programs, without adding a burden of an extra meeting, we joined one of SOWA’s previously scheduled learning community meetings (LCM). Participating programs were required to attend the LCMs, which were scheduled prior to the start of the evaluation. During these LCMs participating sites came together for program quality training and to receive evaluation updates. They were scheduled in the regions of the participating sites—King, Pierce, Spokane, and Walla Walla counties—and therefore provided an opportunity to schedule focus groups without adding extra meetings.
Participation varied across the cohorts. Table 10 shows the time, location, and breakdown of participation.
Table 10. Program Focus Group Participation
Date* Location Cohort Participating Programs
3/7/2017 King Cohort 1 All 7 programs
3/8/2017 King Cohort 3 4 out of 8 programs
3/7/2017 Walla WallaCohorts 1 and 3 (These cohorts have a total of 7 programs so they were combined.)
6 out of 7 programs
3/23/2017 Piece Cohort 2 3 out of 5 programs
3/23/2017 Spokane Cohort 2 7 out of 7 programs
4/27/2017 Pierce Cohort 4 6 out of 8 programs
*Spokane Cohort 4 and some Cohort 5 sites held a focus group via Skype on April 27, 2017. Notes were taken, but due to technical difficulty the focus group was not recorded.
Coach Focus GroupsAt the end of the study, Cultivate Learning scheduled focus group meetings with all of the participating coaches. Cultivate Learning and SOWA had already implemented regular meetings throughout the evaluation to check in with coaches, provide training, and monitor coach participation. For the final meeting, the team dedicated an hour to conducting the focus group.
On April 21, 2017, 9 of the 14 coaches participated in a focus group. Coaches in attendance worked with programs across all five cohorts. Table 11 summarizes participation.

32ELO QUALITY INITIATIVE PILOT | EVALUATION STUDY
Table 11. Coaching Focus Group Participation
Number of Coaches* Program Type Region Cohort
2 School-age Spokane 2 and 41 Early Achievers Spokane and Walla Walla 1,2,4, and 51 Youth Walla Walla 1 and 32 School-age and youth King 1,3, and 52 Early Achievers Pierce 2 and 41 School-age and youth Pierce 2 and 4
*Of the five coaches who did not participate, one coach dropped out of the evaluation earlier, and four had scheduling conflicts. One coach represented in the table participated in writing, and this coach’s responses were included in the transcript coding.
Focus Group and Data Coding ProcessThe evaluation team recorded, transcribed, and coded all focus group meetings. Qualitative data from the focus groups were analyzed together using a grounded theory approach (Corbin & Strauss, 2008; Lincoln & Guba, 1985). We selected two coders from the evaluation team to analyze the data to increase objectivity and support independent repetition during the closed coding process. Both received training in grounded theory and open coding.
The process was standardized and both coders received hard copies of the same focus group transcript. First, coders read the transcript in its entirety. Next, they cut the transcript based on the different ideas programs had and assigned codes to each section, either by sentence or paragraph. Throughout the process, coders wrote memos for the data analyst to review and as a resource during the consensus meeting. After coders were identified, they reviewed and merged their codes when necessary.
During consensus meetings, coders discussed their findings, merged similar codes, provided definitions, clarified meaning, attached samples from the transcripts, and documented their processes through memos. From the consensus meeting, coders identified a short list of six codes. The data analyst reviewed these codes and checked back with the coders for consensus.
The data analyst facilitated a second training to clarify questions and ensure coder consensus. Coders independently applied the short list of codes to a second transcript. The goal was to see if other categories would emerge—if so, coders would modify the categories, and if not, they would continue to code other transcripts. Another goal was to ensure consistency among the coders. The coding meetings and trainings helped to establish consistency and reliability among the two coders.
The remaining transcripts of both program and coach focus group meetings were coded with the short list of codes. Coders slightly adjusted and refined the code when necessary. After coding all the transcripts, coders reviewed their memos and saw how often similar ideas occurred.

33ELO QUALITY INITIATIVE PILOT | EVALUATION STUDY
Focus Group FindingsOverall conversations and findings were consistent across programs and among coaches.
Below are the consensus categories from the focus groups: the emerging categories of topics that the two coders agreed upon.
1. Defining qualityProgram staff and directors talked about how helpful it was to learn about quality programming during the PQA training and to share a common “quality” vocabulary. Staff commented on how they were beginning to see all aspects of programming aligned with the quality standards of the PQA. For example, one staff member stated, “I feel that the progress that [we] made over the course of the year has been great and we constantly have conversations about how YPQA is taking over my brain and everything I do.”
Common definitions and language around quality helped directors and supervisors provide feedback to staff, even when a coach wasn’t present. One provider said, “Even when our coach isn’t there I can continue to help and support the staff who is being coached through this process.” One coach remarked, “When we meet so often to coach, the directors have gotten involved in the coaching sessions. They are building a relationship with staff. When the direct staff is frustrated with things and saying I can’t reach my goal because of this and that, the director says, well I can fix that. I can make that change for you.”
2. Helpfulness of coachingProgram staff and directors agreed in every focus group that the coaching received during the pilot was helpful, especially in translating “quality practice” to everyday practice. One participant described the coaching as, “YPQA for adults.” One provider described their coach as a mentor and said, “I think another resource that has been really helpful…is having [a] person come in and observe and have a dialogue of what is happening in the classroom. Because sometimes, the…abstract things we are learning don’t always get translated or connected in the classroom.” Coaches appreciated the Practice-based Coaching model and saw it as an opportunity for providers to choose what they wanted to improve in their practice. In a majority of focus groups, participants expressed the desire for more “one to one” coaching time.
3. Mobilizing dataCoaches and program staff described the program data from the multiple baseline analysis as very useful. “I really like the data. It gives me an idea on the kind of coaching I have to do.” Staff requested that they receive the data more often. Coaches appreciated the opportunity to receive data about their own coaching practice. One coach said, “I really like the structure that was imposed on the organization and the coach on a weekly basis and being accountable for what that was. I think it helped all parties be more accountable. I really like the Survey Monkey piece where we were really needed to do a short report on what was accomplished.”
4. Value of online coachingBoth program staff and coaches agreed that the online Coaching Companion tool has great potential for providing frequent, accessible professional development. One staff member remarked, “I really do like the idea of [coaches] having the video….What the Coaching Companion does is let us mark on the video” for activity that deserves special attention. Similarly, one coach noted, “I really like the use of technology,” particularly during school breaks and other times that face-to-face meetings are impossible, but “it’s kind of cumbersome sometimes.” A few staff noted that having a video library of quality program exemplars would be very helpful to show staff what high-quality interactions look like in other programs. Several coaches and staff remarked on how well they liked the iPad. One coach said, “iPad. Love the iPad. I just know how valuable it’s been to be filmed….For us to look at [ourselves] was really awesome. Very powerful. I loved it.”
But providers and coaches also noted that time and expertise can be barriers to using the Coaching Companion. As one coach said, “For my providers, which are family care providers, the barrier with technology is the time. They had the ability and the intention to upload videos but they never got to it because often 12 hours a day in [their homes] with children, they get to the weekend and they never want to think about it.” Coaches mentioned that training coaches to a level of competence and confidence could be key to increasing the value of virtual coaching. One coach mentioned, “It should start with coaches, training us well on iPad…so we will be able to know how to problem-solve and educate.”

34ELO QUALITY INITIATIVE PILOT | EVALUATION STUDY
The focus groups identified areas that need improvement, as summarized below.
1. Provide accessible, short training resources to program teamsProviders in five of six focus groups expressed the desire for resources to finance ongoing, brief training sessions, based on quality program practice, which they felt would be more effective than one-day professional development programs. For example, one provider said that 8-hour trainings “drain” participants, who “lose interest.” Shorter training sessions of 1-2 hours, on the other hand, are enough to provide “some planning, strategy” and activities that show, “This is how I can do it.” Providers also discussed the value of online training materials that allow staff to “see” program practice through video exemplars. As one provider noted, staff are routinely “coming and going,” and they would benefit from a video lesson they could watch whenever they had the time.
2. Include directors and all staff in trainingProviders and coaches said that it would be helpful if administrators and all staff receive the same information in training and coaching sessions. One provider recommended that program directors join in staff trainings: “The reality of the nature of what all of us do is that there’s going to be turnover, so [it is important to make sure] that we all understand the program quality tool.” Similarly, a coach reported, “The most challenging site that I have is the site where all the direct service providers say that coaches are the only ones who will care for them. Because no one from management would care about us. There is a disconnect….Whereas the ones that are progressing…are the ones where the directors and the management work together with this project.”
3. Recognize that coaches also need training and supportCoaches were vocal about a desire for increased training on the PQA and program quality in general. Specifically, they expressed the desire for training on various program types, as well as more training on the Coaching Companion. Additionally, coaches desired ongoing support through communities of reflection and practice. “Most helpful in the pilot,” one coach noted, “was meeting coaches and having conversations about coaching [with] the people, everyone involved in the process. Just to make us think about it very frequently.”
3. Mobilize networks and cohorts for learningBoth coaches and staff remarked several times on the potential of learning in networks or cohorts. Program staff wanted the opportunity to learn from other programs near and far. Coaches likewise noted the potential of having groups of programs get together to share how they are each addressing quality improvement efforts, using resources, and building agendas around their needs.
4. Address barriers to quality improvementStaff discussed the continued barriers to improving quality in their programs—namely, high rates of staff turnover, swing shifts (morning and after school), and staffing with volunteers. Each of these circumstances was perceived by staff to contribute to a “lack of buy-in” for ongoing professional development. Additionally, several staff members noted that program staff should be paid to attend professional development opportunities.
Summary of Findings from Purpose/Study 21. PQA training helped program staff to define and “see” quality, and to identify areas for needed improvement.
2. Program staff and directors found coaching and data helpful, and they desired more frequent observations and feedback.
3. When coaches were able to include program leadership, sites were able to collaborate more and resolve issues as they arose.
4. Program staff and coaches regard online coaching as having potential, but more support is required for coaches and program staff to use the Coaching Companion tool.
5. Programs experience several systemic barriers to improving quality including unstable staffing, limited time for training, and limited funding to support staff.

35ELO QUALITY INITIATIVE PILOT | EVALUATION STUDY
7. Summary of Evaluation Limitatzons
The ELO Quality Initiative Pilot evaluation had several limitations. We describe each of these below:
Sample Size • As is often the case in education research, sample size for Study 1 was an issue. The sample of sites enrolled in
the experiment was 50 and decreased via attrition to 39 for some analyses. Most of Cohort 5 dropped out. Cohort 5 programs were recruited in December, and started their pre-assessment in late February and Early March. This gave programs a very small window to complete the requirements of the study, including: introducing video mid-year, receiving consent forms from parents in order to film, and a shorter timeline than usual to complete a pre-as-sessment, a basics training, and planning with data sessions. These challenges were discussed during Cohort 5 programs’ Focus Group. While most understood the value of having weekly coaching, the challenge of time con-straint did not allow them to fully grasp the requirements and expectations, and to fully participate in the study. Con-sequently, the statistical analyses (as opposed to some graphical analyses that we have also performed) were seriously underpowered to reject the null hypothesis of no effect.
Evaluation Timeline• Traditionally, in a multiple baseline study design the intervention does not begin until the baseline has been estab-
lished. But because there was an initial training at the onset of the intervention, and all of the cohort sites needed to attend the training together, the intervention had a specified start date regardless of whether site-level baselines were established.
• We grouped the sites into cohorts for the intervention, which was delivered according to a staggered start. This meant that some cohorts received the improvement intervention for many more weeks than other sites. The total evaluation was to last only 34 weeks, which resulted in cohorts that may not have had enough of the intervention to realize program improvements.
Introduction of New Technology• We captured much of the quality assessment data using a stable camera on a tripod with a boom microphone. This
provided a view into the site activity. There were limitations on what the camera and mic could capture, however. We worked to mitigate these challenges by ensuring we chose an hour of programming that took place in the best possible space for filming, and that we collected the same hour of programming every week.
• Operating the camera equipment presented a challenge for some of the program staff. We worked to mitigate this by closely monitoring the video in the first three weeks of taping and then providing extra support and training as necessary to sites that continued to have difficulty. Over the course of data collection, there were times when program staff forgot to turn on a mic or did not realize the camera was out of batteries. Almost all programs had instances of video data that were not useable.
• We introduced the Coaching Companion and provided programs iPads to video programming and share with coaches. This online approach to coaching presented a challenge to both coaches and program staff, who were all new to online coaching. This became a persistent problem throughout the evaluation and we can now recommend ways to move the process along faster.
Program Capacity• Many programs were affected by staff turnover, or did not have enough staff to allow for coaching and training
opportunities. Often there was no one to cover for a staff member who might try to engage in a debrief conversation with a coach. The use of online coaching mitigates this issue because the coaching conversations do not need to happen in real time while children and youth are attending the program.
• The intervention focused on the staff member who was directly responsible for the children and youth in the pro-gram. The staff being coached, along with the program leadership, believed that the intervention would be more effective if the coach were able to include other staff and the director in the trainings and coaching.
36ELO QUALITY INITIATIVE PILOT | EVALUATION STUDY
8. Summary of Recommendations from Studies 1 and 2
1. Programs that fall within the low-quality designation, based on their PQA scores, benefit most from intensive train-ing and coaching support. This support would include a designated coach that would engage the program staff and leadership in regularly scheduled trainings and Practice-based Coaching. It would also include program as-sessment, evidenced-based goal-setting, focused observation and feedback, and trainings on research-based best practices in the ELO field.
2. Improvement-based interventions should have an adequate amount of time to ensure that trainings and coaching are ongoing and produce quality improvements. In our evaluation, programs that received more access to coaching and training improved their quality overall.
3. Systems for frequent monitoring and feedback of coaching fidelity should be put in place to increase the likelihood of coaching impact on program quality.
4. More research is necessary to determine an adequate amount of Practice-based Coaching and other re-search-based trainings that lead to program improvement.
5. Coaching and training should be offered program-wide. This approach would include coaching all of the staff within the program as well as the director. Staff, coaches, and leadership mentioned that disconnects between program staff and directors interfered with improvement efforts. Conversely, when leadership and staff collaborated in coaching sessions, program interferences in improvement efforts could be more easily resolved by the leadership. Allowing coaching to be inclusive across the program can help to align goals and mitigate programmatic interfer-ences in quality improvement.
6. ELO programs would benefit from having access to a resource library of videos, articles, and other digital profes-sional learning resources that support improvement efforts. This would allow program staff to learn and develop outside of program hours, and it would allow multiple staff and leadership to access the same materials and build consensus around aspects of quality and goals for improvement.
7. Coaching Companion should be used for coaching purposes. Coaches and program staff and leadership agree that having access to video supported development and allowed for ease at difficult scheduling times. Online review of performance allowed coaches to be specific about particular moments and allowed staff to see those specifics. Additionally, coaching via Coaching Companion allowed program staff to capture and share practice for which they wanted feedback.
8. Training and support should be provided to coaches and staff who engage in the Coaching Companion. While there are costs and resources associated with training and supporting the use of this online tool, they are far outweighed by the benefits of using it. Coaching Companion consumes fewer resources than in-person coach visits, and it allows for specific program practices to be reviewed and dissected.
9. Program staff should have dedicated, paid time to engage in professional development and training.

37ELO QUALITY INITIATIVE PILOT | EVALUATION STUDY
9. References
Afterschool Alliance (n.d.). What is the Afterschool Alliance? The nation’s leading voice for afterschool programs. Retrieved from http://www.afterschoolalliance.org/aboutUs.cfm
Arellano, M., & Bond, S. (1991). Some tests of specification for panel data: Monte Carlo evidence and an application to employment equations. The review of economic studies, 58(2), 277-297.
Auger, A., Pierce, K. M., & Vandell, D. L. (2013). Participation in out-of-school settings and student academic and behavioral outcomes. Manuscript in preparation.
Barber, B. L., Eccles, J. S., & Stone, M. R. (2001). Whatever happened to the jock, the brain, and the princess? Young adult pathways linked to adolescent activity involvement and social identity. Journal of adolescent research, 16(5), 429-455.
Brustad, R. J., Babkes, M., & Smith, A. (2001). Youth in sport: Psychological considerations. In R. N. Singer, H. A. Hausenblas, & C. M. Janelle (Eds.), Handbook of sport psychology (2nd ed., pp. 604-635). New York: Wiley.
Corbin J., Strauss A. (2008). Basics of qualitative research: Techniques and procedures for developing grounded theory. Los Angeles, CA: Sage.
Daniel, J., & Shapiro, J. (1996). Infant transitions: Home to center-based child care. In Child and Youth Care Forum (Vol. 25, No. 2, pp. 111-123). Springer Netherlands.
Durlak, J., Weissberg, R., Dymnicki, A., Taylor, R., & Schellinger, K. (2011). The impact of enhancing students’ social and emotional learning: a meta-analysis of school-based universal interventions. Child Development 82(1), 405-32.
Grant, J., Higginbotham, J., Llano, R., & Lucheta, L. (2013). Expanding Minds and Opportunities: Leveraging the Power of Afterschool and Summer Learning for Student Success. Collaborative Communications Groups.
Grossman, J. B., & Tierney, J. P. (1998). Does mentoring work? An impact study of the Big Brothers Big Sisters program. Evaluation review, 22(3), 403-426.
Huang, D., La Torre, D., Harven, A., Huber, L. P., Jiang, L., Leon, S., & Oh, C. (2008). Identification of Key Indicators of Quality in Afterschool Programs. CRESST Report 748. National Center for Research on Evaluation, Standards, and Student Testing (CRESST).
Joseph, G., Taliano, J., & Soderberg, J. (2014). Engagement in Classrooms Data Collection (ECDC) [Assessment Instrument]. Seattle, WA: Childcare Quality and Early Learning Center for Research and Professional Development (Cultivate Learning), University of Washington.
Larson, R. (1994). Youth organizations, hobbies, and sports as developmental contexts. Adolescence in context: The interplay of family, school, peers, and work in adjustment, 46-65.
Learning Point Associates. (2011). 21st Century Community Learning Centers (21st CCLC) Analytic Support for Evaluation and Program Monitoring: An Overview of the 21st CCLC Performance Data: 2009-10. U.S. Department of Education.
Lincoln, Y. S., & Guba, E. G. (1985). Naturalistic inquiry. Beverly Hills, CA: Sage.
Mahoney, J. L., Lord, H., & Carryl, E. (2005). Afterschool program participation and the development of child obesity and peer acceptance. Applied Developmental Science, 9(4), 202-215.
Mahoney, J. L., Larson, R. W., Eccles, J. S., & Lord, H. (2005). Organized activities as developmental contexts for children and adolescents. Organized activities as contexts of development: Extracurricular activities, after-school and community programs, 3-22.
Mahoney, J. L., Schweder, A. E., & Stattin, H. (2002). Structured after‐school activities as a moderator of depressed

38ELO QUALITY INITIATIVE PILOT | EVALUATION STUDY
mood for adolescents with detached relations to their parents. Journal of Community Psychology, 30(1), 69-86.
Naftzger, N. (2014). A summary of three studies exploring the relationship between afterschool program quality and youth outcomes. In Ready by 21 National Meeting, Covington, KY (pp. 208-218).
Raudenbush, S. W., & Bryk, A. S. (2002). Hierarchical linear models: Applications and data analysis methods (Vol. 1). Sage.
Smith, C., & Hohmann, C. (2005). Full findings from the Youth PQA validation study. Ypsilanti, MI: High/Scope Educational Research Foundation.
State of Washington Office of Superintendent of Public Instruction. (2017). Washington 21st Century Learning Centers. Retrieved from http://www.k12.wa.us/21stCenturyLearning/Grantees.aspx
The Expanded Learning & Afterschool Project. (n.d.). Business Leaders: Expanding Afterschool and Summer Learning Opportunities Can Make a Bottom Line Difference. Retrieved from http://www.expandinglearning.org/expandingminds/article/business-leaders-expanding-afterschool-and-summer-learning-opportunities-can
Yohalem, N., Wilson-Ahlstrom, A., Fischer, S., & Shinn, M. (2009). Measuring Youth Program Quality: A Guide to Assessment Tools, Second Edition. Washington, D.C.: The Forum for Youth Investment.
Youniss, J., Mclellan, J. A., Su, Y., & Yates, M. (1999). The role of community service in identity development: Normative, unconventional, and deviant orientations. Journal of Adolescent Research, 14(2), 248-261.
Youniss, J., Yates, M., & Su, Y. (1997). Social integration: Community service and marijuana use in high school seniors. Journal of adolescent research, 12(2), 245-262.
Washington State Department of Early Learning. (n.d.). Early Start Act rules implementation. Retrieved from https://del.wa.gov/providers-educators/laws-rules-and-performance-standards/del-rules-under-development/early-start-act

APPENDIX A:
Full List and Descriptions of Partner Organizations

2APPENDIX
ELO Study partners: crucial to the success of the ELO pilot study work has been the partnerships of multiple organizations working within the ELO field. This includes the University of Washington Child Care Quality & Early Learning Center for Research and Professional Development (CQEL), Department of Early Learning (DEL), the Office of the Superintendent of Public Instruction (OSPI), School’s Out Washington (SOWA), the David P. Weikart Center (Weikart Center), Child Care Aware (CCA) and the Raikes Foundation. Representatives from each of these organizations come together on a monthly basis to align around quality standards, communication, and improvement efforts. While these monthly meetings ensure regularly scheduled face-to-face time, often it is the work done by subsets of this larger collective where the largest gains are made. In small collaborative partnerships, we have been able to complete a study design, develop a program quality assessment tool (the Quality Seal), built a data registry for ELO, and created a long-term plan for program quality improvement that will benefit the largest populations of children and youth in need of these services in the state of Washington.
• Department of Early Learning (DEL): is responsible for offering programs and services that support healthy child development and school readiness for the approximately 90,000 children born in Washington each year. DEL, plays a major role in Washington States, QRIS system for early learning, oversees the funding and deliverables of Early Achievers project and in the ELO quality initiative study, DEL served in the steering committee, and worked with School’s Out Washington to recruit qualified ELO programs to volunteer for the ELO quality initiative study.
• Office of Superintendent of Public Instruction (OSPI): is the primary agency charged with overseeing K-12 pub-lic education in Washington state. OSPI works with the state’s 295 school districts to administer basic education programs and implement education reform on behalf of more than one million public school students. In the ELO quality initiative study, OSPI served in the steering committee, and worked with School’s Out Washington to recruit qualified ELO programs, particularly 21st century – CLC sites to volunteer for the ELO quality initiative study.
• School’s Out Washington (SOWA): has nearly three decades of active leadership in providing a rich foundation of quality standards, professional development, advocacy and support to bring empowering learning opportunities within reach of every young person. SOWA also works with large agencies, such as YMCA’s, Boys and Girls Clubs, school districts, and government agencies, as well as small local afterschool and summer programs across Wash-ington state through assessments, staff training, and partnerships to improve the quality of programs for all youth. As a partner in the ELO quality initiative study, SOWA was the point of contact between study partners, programs, and trainers. SOWA was tasked with recruiting programs, recruiting coaches, facilitating all communication related to the study and all trainings related to the study.
• Raikes Foundation: has invested in strengthening the quality of ELO programs in Washington since 2009. Currently, the foundation is working with program staff, policymakers, funders and parents to elevate the conversation about high-quality youth programs, and are partnering to ensure organizations get the knowledge, tools and support they need to develop and maintain high-quality programs. Raikes Foundation is one of the major funders for the ELO quality initiative study. The foundation had set the parameters and regions for conducting the study and have creat-ed the criteria for program participation.
• David P. Weikert’s Center for Youth Program Quality: is one of the leading centers in ELO program quality develop-ment work. The center has developed the widely used, Program Quality Assessment (PQA) tool for both programs serving K–12 children. The School-Age and Youth PQA evaluate the quality of children and youth experiences as they attend workshops and classes, complete group projects and participate in meetings and regular program ac-tivities. For staff, the SAPQA and YPQA self-assessment process helps them know what is happening their program and how they can build their professional development competencies. The Weikert’s center’s PQA tools were used in the ELO quality initiative study to support program recruitment, program evaluation, and program improvement efforts. The PQA was also used as the basis for the Quality Seal tool (created by University of Washington).
• Child Care Aware (CCA) and Child Care Resources (CCR): these two agencies serve as a hub of childcare informa-tion for parents and childcare providers. The agencies provide resources for child care programs and help families learn more about the elements of quality child care and how to locate programs in their communities. CCA also offers professional development for coaches and trainers and is one of the largest coach contractors for programs participating in Early Achievers. CCA and CCR have been a part of the development of Early Achievers, and in ad-dition to providing support with recurring coaches, they also serve on the steering committee to help bring to light lessons learned from the implementation of QRIS in early child care.

3APPENDIX
• University of Washington Child Care Quality & Early Learning Center for Research and Professional Development (CQEL): works to improve the quality of early care and education in Washington State and beyond by providing professional development, support, and research on numerous research-based early childhood assessments and quality standards. CQEL is the major player in Washington State’s QRIS system, a big portion of its work revolving around Early Achievers evaluation and professional development training. As the research partner, CQEL developed a quality measurement tool (the Quality Seal) and designed a ELO quality imitative study, which examined the state of current quality in ELO programs in Washington and the improvement efforts.
Criteria for Participation in Out-of-School Time (OST) Pilot:

APPENDIX B:
Full List of Selection Criteria for Participation

5APPENDIX
Licensed Family Homes participating in Early Achievers:
• Business operating for at least 3 years
• Located in a pilot county
• Completed Early Achievers rating process and rated at least a 3
• Care for at least 4 school-age children (children cannot be related to provider)
• Good standing with licensing
• Accept school-age subsidies
• Explicit commitment from family home owner and/or provider
• Professional development time set aside to fully participate and commitment to participate in training and coaching as identified below:
– Introductory Meeting (2 hrs)
– Basics Training (8 hrs)
– Consensus Meeting (3 hrs)
– Planning with Data (4 hrs)
– Improvement Planning (2 hrs)
– Trainings linked to improvement plan (4 hrs)
– Coaching (30 hrs for program lead during 1st year of intervention)
• Enrichment activities/expanded learning in addition to any 1:1 homework help
• Must consent to participate in evaluation including youth outcomes study
• Must consent to collect required data elements
• Must attend Learning Community Meetings once per quarter
Licensed Child Care Centers participating in Early Achievers:
• Business operating for at least 3 years
• Limited staff turnover (not more than 25% of front-line staff turnover in past year)
• Located in a pilot county
• Completed Early Achievers rating process and rated at least a 3
• Care for at least 15 school-age children
• Have dedicated classroom space for school-age programming
• Good standing with licensing
• Accept school-age subsidies
• Explicit commitment from Director and ensure that there is a point person for participation
• Professional development time set aside to fully participate and commitment to participate in training and coaching as identified below:
– Introductory Meeting (2 hrs for Director/Program Supervisor and 1 lead teacher)
– Basics Training (8 hrs for Director/Program Supervisor and 1 lead teacher)

6APPENDIX
– Consensus Meeting (3 hrs for Director/Program Supervisor and 1 lead teacher)
– Planning with Data (4 hrs for Director/Program Supervisor and 1 lead teacher)
– Improvement Planning (2 hrs for Director/Program Supervisor and 1 lead teacher)
– Trainings linked to improvement plan (4 hrs for Director/Program Supervisor and 1 lead teacher)
– Coaching (30 hrs for site during 1st year of intervention)
• Enrichment activities/expanded learning in addition to any 1:1 homework help
• Must consent to participate in evaluation including youth outcomes study
• Must consent to collect required data elements
• Must attend learning community meetings once per quarter
Non-Licensed OST Programs:
• Organization operating for at least 3 years prior to application
• Organizational leadership (executive director) and program lead (program director or site director) in place for at least 2 years prior to application
• Limited staff turnover (not more than 25% of front-line staff turnover in past year)
• Explicit commitment from executive director and ensure that there is a point person to manage pilot
• Professional development time set aside for managers and frontline staff to fully participate and commitment to participate in training and coaching as identified below:
– Introductory Meeting (2 hrs for executive director plus 2 hrs for program lead)
– Basics Training (8 hrs for program lead plus 8 hrs for 1–2 frontline staff)
– Consensus Meeting (3 hrs for program lead plus 3 hrs for all frontline staff)
– Planning with Data (4 hrs for program lead plus 4 hrs for 1–2 frontline staff)
– Improvement Planning (2 hrs for program lead plus 2 hrs all frontline staff)
– Trainings linked to improvement plan (4 hrs for program lead plus 4 hrs for frontline staff)
– Coaching (30 hrs for program lead during 1st year of intervention)
• Regular staff meetings that include program team (at least monthly)
• Can be current YPQI Participant or new participant
• Strong group enrichment activities/expanded learning in addition to any 1:1 homework help
• Consistent participation of at least 15 youth
• Must consent to participate in evaluation including youth outcomes study
• Must consent to collect required data elements
• Must attend Learning Community Meetings once per quarter

7APPENDIX
Considerations:
Note that this doesn’t include criteria for 21st Century CLC’s but imagine that will be similar to the youth dev programs. The idea is that this list has some room for negotiation for partners to weigh in on (rated 3 in EA, number of years in business, etc.).
For thinking about recruitment numbers in each of the 4 groups (licensed family homes in EA, licensed child care centers in EA, non-licensed afterschool programs that serve older age youth and 21st Century Community Learning Centers), there are some important considerations:
1. We need programs that serve both early learning ages and school-age to review the alignment and ensure that it is not difficult for a program to do both.
2. It would be helpful to have programs participate that represent the full spectrum between K and grade 12. Is this possible from an evaluation standpoint? In other words, in one community we may have 21st century programs that focus on elementary age and youth development organizations that focus on middle and high school participate.
3. We want the pilot to be successful of course, but it may be helpful to have some programs participate that are already familiar and using the YPQI and those that are brand new to the tool.
4. Ideally, it would be great to have 12 of each type of program represented which would equate to ~3–4 of each type in each community. However, it may be difficult to recruit certain types of programs in certain communities. We defi-nitely want to make sure that each type is represented at a minimum on both the east and west side of the state.

APPENDIX C:
Program Recruitment Incentives

9APPENDIX
In addition, by signing this participation agreement, ____________________________________________________ understands the following: (Primary Contact)
• Participation in the OST Quality Initiative is completely voluntary and participants may withdraw at any time.
• OST Quality Initiative associated staff, including assessors and coaches are mandated reporters of child abuse and neglect according to Washington State Law, and therefore are required to report any suspected abuse and neglect directly to Child Protective Services.
• School’s Out Washington reserves the right, upon providing 15 days written notice, to terminate the program’s par-ticipation in the OST Quality Initiative, in the event School’s Out Washington determines that the program is failing to make a good faith effort to meet the above listed requirements.
By signing below I agree to participate in the OST Quality Initiative in accordance with the above requirements.
Primary Contact Date
School’s Out Washington Contact Date

APPENDIX D1:
Application Form 1

11APPENDIX
Application for Out-of-School-Time (OST) Quality Initiative – Early Achievers SitesPlease use this application to complete the OST Quality Initiative Registration. If you need additional space, you may attach a sheet containing the information to this application. All fields are required, unless otherwise indicated.
DEFINITIONS:
• A Program is an organization that offers services to children and young people. Programs may have multiple sites under the organization umbrella. For example, the Boys and Girls Clubs of King County.
• A Site is a single building where services take place. A site may have several types of program offerings happening within the building.
• A Program Offering is a specific OST group that is offered at a site. For example, ECEAP classrooms and school-age child care.
For the OST Quality Initiative, you must designate a specific site and program offering to participate.
STEP 1 A: Site Information
Site name Phone City
Site address
Zip County
How many youth are served at the Site (list under capacity and enrollment columns)?
Capacity (# youth able to serve)
Enrolled (# youth actively participating)
Daily Average
Weekly Average
OST Program Offering (Either Family Child Care name or Center classroom name)
How many youth are served at Program Offering (list under capacity and enrollment columns)?
Capacity (# youth able to serve)
Enrolled (# youth actively participating)
Daily Average
Weekly Average
Is the Site affiliated with a larger Program? If so, please list the Program name.
Program phone Total program sites
If applicable, total number of children and youth served in the Program (list under capacity and enrollment columns)?
Capacity (# able to serve)
Enrolled (# actively participating)
Weekly Average

12APPENDIX
STEP 1 B: Site Type
Select the type of Site:
r Licensed Family Child Care r Licensed Child Care Center
Provider license number
STEP 1 C: Contact Information
The Primary OST Quality Initiative Contact must be the designated administrator based on Site type. For licensed family child care, this is the primary provider. For licensed child care centers, this is the center director. The Primary OST contact will lead the quality improvement process and is responsible for attending the trainings, overseeing self-assessments, developing a quality improvement plan and coordinating with the evaluation team. You may list a Secondary OST Quality Initiative Contact who can also represent your program during the quality improvement process. You can designate the Secondary OST Quality Initiative Contact as the person who will attend the trainings, but keep in mind that the same person must attend all trainings in order for the requirement to be met.
Name of primary OST contact Email
Role within the site Phone
Name of secondary OST contact (Optional) Email (Optional)
Role within the site (Optional) Phone (Optional)
STEP 2 A: Program Offering Schedule
Please list the specific days and times the Program Offering meets from September 2016–June 2017:
STEP 2 B: Youth Served
For the purposes of OST Quality Initiative, “staff” refers to lead staff and assistant staff who are assigned to one group of youth for the majority of the program offering. A Program Offering is defined as one group of youth under the supervision of an assigned lead staff.
Ages served. Please check all that apply:
r School-age (5–11 years) r Youth (12–18 years)
Total number of children ages 5–11 years currently enrolled: _________
Total number of youth ages 12–18 years currently enrolled: __________
List the number of Program Offering staff who will participate in the OST Quality Initiative. Please include both paid and volunteer staff. # Staff: __________
r Paid staff: _________
r Americorps staff: _________
r Vista staff: _________
r College interns: _________
r Parent volunteers: _________
r Other (Please describe):

13APPENDIX
STEP 2 C: Program Offering Content
Please describe the Program Offering identified for the OST Quality Initiative in detail. Include information on your Program Offering goals and activities. Questions to address include: What is a typical day like for a youth? Do youth work in a group setting or independently? Is a specific curriculum used? If you need additional space, you may attach a sheet containing the information to this application.
STEP 3: Site Demographics
Please indicate which of the following characteristics for each category best describe your site.
Corporate Structure:
r Nonprofit r Private Business (for profit) r Public Agency-College/University
r Public Agency-Other r Public Agency-School District
What best describes your Site location?
r Suburban r Rural r Urban
How many youth currently qualify for free and reduced lunch in your program offering? ____________
Do any currently enrolled youth have an IEP for diagnosed special needs? r Yes r No
If yes, how many? Please count each child only once, listing them under their primary diagnosis:
Special need and number of youth:
r ADHD/ADD _______ r Autism, Spectrum Disorders _______
r Behavioral _______ r Down Syndrome _______
r Hearing Impairment _______ rLearning Disabilities _______
r Maintenance Care Diseases (Diabetes, HIV) _______
r Mentally Disabled/Developmentally Delayed _______
r Neurological Disorders _______ r Orthopedic Handicaps _______
r Speech and Language Disorders _______ rVisual Impairment _______
r Other ______________________________________________
Primary language spoken in your Program Offering (between staff and youth)?

14APPENDIX
Secondary language spoken in your Program Offering between staff and youth? (Optional)
Do you serve special populations? (Optional)
r Foster Children r Homeless Youth r Youth in Treatment Programs
r Youth in Military Families r Teen Parents r Dual Language Learners
r Other:
How are young people find out about your Program Offering (Check all that apply):
r School Referral r Peer Recruitment r Family Inquiry
r Word of Mouth r Child Care Aware Inquiry
r Other: (Please list)
Check and estimate the number of youth currently served in your program offering who identify as any of the following race/ethnicity categories (check all that apply):
r Black/African Descent r South Asian (e.g., Indian, Pakistani, Bangladeschi)
r Middle Eastern r Latina/Latino/Hispanic/Latin American Descent
r East Asian (e.g. Chinese, Japanese, Korean) r Pacific Islander
r Southeast Asian (e.g., Vietnamese, Thai) r Native/Indigenous (please specify): _________________
r White/European Descent r Other
STEP 4: Applicant Assurances
The information I provided is true and accurate. I authorize the Department of Early Learning (DEL) to store and use this information for evaluative purposes. All collected information will be kept confidential and stored in a secure space. I agree to and understand that:
r I understand that my participation in OST Quality Initiative is voluntary.
r I have read, fully understand, and will abide by the OST Quality Initiative Guidelines.
Signature: I, ____________________________________ , affirm that the information on this application and the supplemental documentation provided are true and correct to the best of my knowledge.
Date:

APPENDIX D2:
Application Form 2

16APPENDIX
Application for Out-of-School-Time (OST) Quality Initiative – Youth Development SitesPlease use this application to complete the OST Quality Initiative Registration. If you need additional space, you may attach a sheet containing the information to this application. All fields are required, unless otherwise indicated.
DEFINITIONS:
• A Program is an organization that offers services to young people. Programs may have multiple sites under the organization umbrella. For example the Boys and Girls Clubs of King County
• A Site is a single building where services take place. A site may have several types of program offerings happening within the building. For example, a branch of the Boys and Girls Clubs such as the Wallingford site.
• A Program Offering is a specific OST group that is offered at a site. An example would be the youth program offer-ing, Art Lab at the Seattle Art Museum.
For the OST Quality Initiative, you must designate a specific site and program offering to participate. The site must offer continuous services to youth during the time period of the pilot although specific content may change.
STEP 1 A: Site Information
Site name Phone City
Site address
Zip County
How many youth are served at the Site (list under capacity and enrollment columns)?
Capacity (# youth able to serve)
Enrolled (# youth actively participating)
Daily Average
Weekly Average
OST Program Offering title
How many youth are served at Program Offering (list under capacity and enrollment columns)?
Capacity (# youth able to serve)
Enrolled (# youth actively participating)
Daily Average
Weekly Average
Is the Site affiliated with a larger Program? If so, please list the Program name.
Program phone Total program sites
If applicable, total number of children and youth served in the Program (list under capacity and enrollment columns)?
Capacity (# able to serve)
Enrolled (# actively participating)
Weekly Average

17APPENDIX
STEP 1 B: Site Type
Select the type of Site:r Licensed r Not licensed
Provider license number (if applicable)
r Youth Development Program r Licensed School-Age Program
r 21st Century Community Learning Center
STEP 1 C: Contact Information
The Primary OST Quality Initiative Contact must be the Program Manager (Name of the person who has supervisory and budgetary oversight for the day-to-day operations of the program). The identified OST Staff Lead at your Site (someone in a supervisory position) will lead the quality improvement process and is responsible for attending the trainings, overseeing self-assessments, developing a quality improvement plan and coordinating with the evaluation team. You may list a Secondary OST Quality Initiative Contact who can also represent your program during the quality improvement process. You can designate the Secondary OST Quality Initiative Contact as the person who will attend the trainings, but keep in mind that the same person must attend all trainings in order for the requirement to be met.
Name of primary OST contact Email
Role within the site Phone
Name of secondary OST contact (Optional) Email (Optional)
Role within the site (Optional) Phone (Optional)
STEP 2 A: Program Offering Schedule
Please list the specific days and times the Program Offering meets from September 2016–June 2017:
STEP 2 B: Youth Served
For the purposes of OST Quality Initiative, “staff” refers to lead staff and assistant staff who are assigned to one group of youth for the majority of the program offering. A Program Offering is defined as one group of youth under the supervision of an assigned lead staff.
Ages served. Please check all that apply:
r School-age (5–11 years) r Youth (12–18 years) r Young adults (19–24 years)
Total number of children ages 5–11 years currently enrolled: _________Total number of youth ages 12–18 years currently enrolled: __________Total number of young adults ages 19–24 years currently enrolled: __________
List the number of Program Offering staff who will participate in the OST Quality Initiative. Include both paid and volunteer staff. # Staff: __________
r Paid staff: _________ r Americorps staff: _________
r Vista staff: _________ r College interns: _________
r Parent volunteers: _________ r Other (Please describe):

18APPENDIX
STEP 2 C: Program Offering Content
Please describe the Program Offering identified for the OST Quality Initiative in detail. Include information on your Program Offering goals and activities. Questions to address include: What is a typical day like for a youth? Do youth work in a group setting or independently? Is a specific curriculum used? If you need additional space, you may attach a sheet containing the information to this application.
STEP 3: Site Demographics
Please indicate which of the following characteristics for each category best describe your site.
Corporate Structure:
r Nonprofit r Private Business (for profit) r Public Agency-College/University
r Public Agency–Other r Public Agency-School District
What best describes your Site location?
r Suburban r Rural r Urban
How many youth currently qualify for free and reduced lunch in your program offering? ____________
Do any currently enrolled youth have an IEP for diagnosed special needs? r Yes r No
If yes, how many? Please count each child only once, listing them under their primary diagnosis:
Special need and number of youth:
r ADHD/ADD _______ r Autism, Spectrum Disorders _______
r Behavioral _______ r Down Syndrome _______
r Hearing Impairment _______ r Learning Disabilities _______
r Maintenance Care Diseases (Diabetes, HIV) _______
r Mentally Disabled/Developmentally Delayed _______
r Neurological Disorders _______ r Orthopedic Handicaps _______
r Speech and Language Disorders _______ r Visual Impairment _______
r Other ______________________________________________

19APPENDIX
Primary language spoken in your Program Offering (between staff and youth)?
Secondary language spoken in your Program Offering between staff and youth? (Optional)
Do you serve special populations? (Optional)
r Foster Children r Homeless Youth r Youth in Treatment Programs
r Youth in Military Families r Teen Parents r Dual Language Learners
r Other:
How are young people find out about your Program Offering (Check all that apply):
r School Referral r Peer Recruitment r Family Inquiry
r Word of Mouth r Child Care Aware Inquiry
r Other: (Please list)
Check and estimate the number of youth currently served in your program offering who identify as any of the following race/ethnicity categories (check all that apply):
r Black/African Descent r South Asian (e.g., Indian, Pakistani, Bangladeschi)
r Middle Eastern r Latina/Latino/Hispanic/Latin American Descent
r East Asian (e.g. Chinese, Japanese, Korean) r Pacific Islander
r Southeast Asian (e.g., Vietnamese, Thai) r Native/Indigenous (please specify): _________________
r White/European Descent r Other
STEP 4: Applicant Assurances
The information I provided is true and accurate. I authorize the Department of Early Learning (DEL) to store and use this information for evaluative purposes. All collected information will be kept confidential and stored in a secure space. I agree to and understand that:
r I understand that my participation in OST Quality Initiative is voluntary.
r I have read, fully understand, and will abide by the OST Quality Initiative Guidelines.
Signature: I, ____________________________________ , affirm that the information on this application and the supplemental documentation provided are true and correct to the best of my knowledge.
Date:

APPENDIX D3:
Participation Agreement

21APPENDIX
ELO Program Participation Agreement Schedule Breakdown
Program Responsibility Participation Agreement for Sites: Sites Expectation
Coaching To participate fully in 30 hrs of coaching. This includes:
• Bi –monthly participation for in-person coaching.
• Bi-monthly Coaching Companion participation by uploading 2 practice videos for your coach.
• Weekly completion of coaching survey following an in-person or online coaching session.
• Complete a self-assessment and develop a Quality Improvement Plan in consultation with my coach.
Video Taping • Follow through with commitments including video-taping sessions.
• Film 1 hour of program offering per week for 28 weeks, and ensure memory card is delivered to UW.
• Camera is stored in a safe place.
• Batteries are charged and ready to be used for next session.
• Notify SOWA if filming will be missed for any given week.
Training • Provide time and space for staff to participate in coaching.
• Attend trainings such as: Orientation, YPQI Basics, Planning with Data, Methods Workshops and Peer Learning Community Meetings (~ 20 – 30 hrs).
• Participate in Quality initiative evaluation.
Administrative • Collect and return parental, youth and staff consent forms for onsite videotaping.
• Submit all forms, reports, transcripts, receipts and other information to SOWA.
• Keep appointments, return phone calls, follow through with commitments.
• Upload required data into Scores Reporter data system.
• Notify SOWA of any changes that may affect site participation and/or eligibility, including changes in staffing, capacity, enrollment, licensing status, address, and site closure.

APPENDIX E1:
Parent Consent Form (English)

23APPENDIX
Dear Parent(s) or Guardian, Date: __________
The Out of School Time (OST) Quality initiative is a year-long study that supports staff as they make a positive and lasting impact on the development of youth. As part of the OST Quality Initiative, staff are asked to set program improvement goals as a means of improving their practice and offering. In order for coaches and
colleagues to provide program staff feedback about their practice and their offering, sessions are often videotaped. This reflection and feedback process encourages excellence in programing. The program staff are the main focus of the videotape, but it is likely that your child/youth will be on camera as well.
We are writing to ask for your consent to have your child/youth videotaped, as part of the group and/or session for which they are attending. These taped sessions will be used in program improvement and professional development for school age and youth program staff.
Assurance of information security and appropriate use
All videos collected for this OST Quality Initiative will be uploaded into a web-based, privacy-protected space as approved and monitored by the University of Washington. This site is called the Coaching Companion (www.cqelcoach.org). Your child will never be identified by last name in the video. The video cannot be downloaded or shared outside of the Coaching Companion.
We hope to have your permission.
If you agree to have your child or youth videotaped, please complete the permission slip at the bottom of this page. If you have any questions or concerns, please do not hesitate to contact School’s Out Washington at [email protected] (email) or at (206) 336-6909.
Sincerely,

24APPENDIX
Consent Form
I, _______________________________________________________ (print parent name) give my permission for my child
________________________________________________ (print child name) to participate in instructional sessions with
_____________________________________________________ (print program staff name), and for this interaction to be
videotaped as part of coaching and professional development for the OST Quality Initiative, and to be used solely for educational and professional purposes related to the program.
Parent signature Date
Participant Information
Full legal name Date of birth
Name of school (2016)
Grade (2016)

APPENDIX E2:
Parent Consent Form (Spanish)

26APPENDIX
Estimado Padre(s) o Guardián(es), Fecha: __________
La iniciativa Out of School Time (OST) Quality o Tiempo Fuera de la Escuela es un estudio de un año que apoya al personal mientras hace un impacto positivo y perdurable en el desarrollo de los niños y jovenes. Como parte de la Iniciativa de Calidad (OST), pedimos que el personal establezca objetivos de mejoramiento de programa como un medio para mejorar su práctica y oferta. Para que los entrenadores y colegas puedan proporcionar consejos al personal del programa sobre su práctica y oferta, las sesiones son grabadas en vídeo a menudo. Este proceso de reflexión y seguimiento fomenta la excelencia en la programación. El foco principal de los vídeos es el personal del programa, pero es probable que su hijo/a aparezca también.
Nos dirigimos a usted para pedir su consentimiento para que su niño / joven sea grabado en video como parte del grupo y/o de la sesión del programa. Estas sesiones grabadas serán utilizadas en el programa de mejoramiento y desarrollo profesional del personal que trabaja con los niños y jovenes.
Garantía de la seguridad de información y el uso apropiado
Todos los vídeos recogidos para esta Iniciativa de Calidad (OST) se cargarán en un espacio basado en la web con privacidad protegida, aprobado y controlado por la Universidad de Washington. Este espacio o sitio se llama el Coaching Companion o el Compañero de Entrenamiento (www.cqelcoach.org). Su hijo/a nunca será identificado por su apellido en el vídeo. El vídeo no puede ser descargado o compartido fuera del Compañero de Entrenamiento.
Esperamos tener su permiso.
Si usted acepta que su niño o joven sea grabado en vídeo, por favor complete el formulario de permiso en la parte inferior de esta página. Si usted tiene alguna pregunta o inquietud, por favor no dude en ponerse en contacto con School’s Out Washington (La Escuela Fuera de Washington) en [email protected] (correo electrónico) o al (206) 336-6909.
Sinceramente,

27APPENDIX
Formulario de Permiso
Yo, _____________________________________________________ (nombre del padre/guardian) doy permis o que mi hijo/a
______________________________________________________ (nombre del niño/a) partici pe en sesiones instructivas con
________________________________________________ (nombre del empl ea do del progra ma), y que esta interacción sea
grabada como parte del entrenamiento y desarrollo profesional para la Iniciativa de Calidad (OST), y que sea utilizada solamente con fines educativos y profesionales relacionados con el programa.
Firma del padre Fech
Información del Participante
Nombre Legal Completo Fecha de Nacimiento
Nombre de la Escuela (2016)
Grado (2016)
APPENDIX E3:
Staff Consent Form

29APPENDIX
Dear Program Staff, Date: __________
The Out of School Time (OST) Quality initiative is a year-long study that supports OST program staff as they make a positive and lasting impact on the development of youth. As part of the OST Quality Initiative, staff are asked to set program improvement goals as a means of improving their practice and offering. In order for coaches and colleagues to provide program staff feedback about their practice and their offering, sessions are often videotaped. This reflection and feedback process encourages excellence in programing. The program staff are the main focus of this videotape, to capture best practices, and quality programming.
We are writing to ask for your consent to be videotaped, as part of the group and/or session for which you are participating/leading. These taped sessions will be used in program improvement and professional development for school age and youth program staff, but most importantly these videos will be a contribution to the Out of School Time field. Only videos that are approved by programs will be used for future professional development and parent consent will be required before any filming occurs on-site.
Assurance of information security and appropriate use
All videos collected for this OST Quality Initiative will be uploaded into a web-based, privacy-protected space as approved and monitored by the University of Washington. This site is called the Coaching Companion (www.cqelcoach.org). The video cannot be downloaded or shared outside of the Coaching Companion.
We hope to have your permission.
If you agree to be videotaped, please complete the permission slip at the bottom of this page. If you have any questions or concerns, please do not hesitate to contact School’s Out Washington at [email protected] (email) or at (206) 336-6909.
Sincerely,
The CQEL Team at The University of Washington

30APPENDIX
Consent formI, _____________________________________________________ (print name) give my permission to be videotaped as
part of coaching and professional development for the OST Quality Initiative, and to be used solely for educational and professional purposes related to the program development.
Signature Date

APPENDIX F:
Coach Recruitment Criteria

32APPENDIX
REQUEST FOR QUALIFICATIONS YOUTH DEVELOPMENT PROGRAM QUALITY COACHThe mission of School’s Out Washington (SOWA) is to provide services and guidance for organizations to ensure all young people have safe places to learn and grow when not in school. School’s Out is dedicated to building community systems to support quality afterschool and youth development programs for Washington’s 5–18 year olds through training, advocacy and leadership.
School’s Out Washington is currently seeking professionals to serve as part-time youth development program quality coaches. Coaches will be on-call part-time employees of SOWA.
Coaches will provide on-site coaching and technical assistance to assigned youth development and afterschool programs in one of three geographic regions: King County, Pierce County, or eastern Washington (including Spokane and Walla Walla) for the purpose of enhancing the quality of services to youth. Coaches will deliver focused on-site coaching and technical assistance for programs on how to complete an assessment process using the Youth Program Quality Assessment (YPQA) tool, how to use the results to develop an action plan for quality improvement, how to carry out the plan, and how to measure success. Coaches will support the designated agency lead in managing the year-long assessment and intervention cycle, maintaining the focus on strengthening staff performances with youth at the point of service and supporting strategies that promote sustainable change in youth worker performance. School’s Out seeks to match coaches to sites based on location and in response to the specific needs and characteristics of each program.
On-call coaching rate is $33.22 per hour. Coaching hours may vary based on the details of different initiatives throughout each region. Initial coaching assignments may be implemented between April 2016 and August 2016, with the majority of assignments taking place during the 2016–2017 academic calendar year (September 2016 through June 2017).
On-Call Employee Responsibilities:
1. Attend quarterly YPQA project Learning Community meetings;
2. Attend coaching meetings with SOWA staff and/or Hub Leads to report on progress;
3. Maintain timely records of coaching activities with each site, and complete evaluation and required project paperwork;
4. Support the designated site lead in navigating/leading the YPQA self-assessment process at their sites;
5. Provide suggestions/feedback to sites in using the assessment results to identify program improvement and professional development priorities;
6. Support development of a specific, measurable, attainable, realistic and timely (SMART) action plan for quality improvement aligned with improvement goals;
7. Deliver and/or coordinate training and technical assistance services to support implementation of the quality action plan;
8. Schedule and travel to on-site appointments with the site leads to review training plans and accomplishments;
9. Model interactions with youth that are culturally relevant and cognitively, linguistically, socially and emotionally appropriate; and group management techniques for meeting the diverse needs of youth;
10. Conduct YPQA Methods workshops for youth development staff to support their identified goals;
11. Make referrals to community resources as needed.

33APPENDIX
MINIMUM QUALIFICATIONS
• Bachelor’s Degree in education, human development, social work, counseling, recreation or other related course work required;
• At least three years of experience with middle/high school youth as a director of a youth development program, classroom teacher or other youth work experience;
• Experience delivering coaching or technical assistance to youth-serving agencies;
• Demonstrated understanding of or familiarity with program quality and assessment tools;
• Successful completion of YPQA Basics full-day training within past three years;
• Successful completion and endorsement as a reliable Youth or School-Age PQA External Assessor within the past 12 months (or be available to attend a 2-day training in King County to achieve reliability—April 28–29, 8:30am–5pm);
• Successful completion of Youth Work Methods Training of Trainers course within the past three years (or be avail-able to attend 4-week online course and 3-day live training May 11-13 in Seattle);
• Ability to attend additional live trainings during the summer of 2016 as needed (Tentatively July 2016)
• Familiar with and comfortable using online cloud services, including Google Apps;
• Ability to travel to program sites throughout one of the three geographic regions (King County, Pierce County, or eastern Washington);
• Familiar with Outlook, Excel, Word and PowerPoint;
• Demonstrated experience and ability to work with diverse populations;
• Possess working knowledge of child, adolescent and adult learning theory and experience programming for diverse populations and learning styles;
• Commitment to working toward racial equity through undoing institutional and structural racism.
• Competencies: Adaptability, open communication, collaboration/partnership, achieving measurable results, racial equity and social justice advocacy.
SUBMISSION PROCEDUREInterested persons should submit a letter of intent, including preferred geographic region to Sheely Mauck, School’s Out Washington, 801 23rd Ave. S., Suite A, Seattle, WA 98144. Further information may be obtained by calling Sheely at (206) 336-6909. You may email your letter to: [email protected]
Closing Date: Submissions will be accepted until 4pm on April 4, 2016.
School’s Out Washington is an Equal Opportunity Employer.

APPENDIX G:
Quality Seal Original and Revised Items

35APPENDIX
Quality Seal Original
Domain I: Social and Emotional SupportA. Self-Regulation/Managing EmotionsB. Empathy & CompassionC. Lack of BiasD. RedirectionE. EngagementF. PersistenceG. Skill-BuildingH. ReflectionI. Youth Leadership
Domain II: RelationshipsA. Emotional ClimateB. Open-Ended QuestionsC. Sense of BelongingD. CollaborationE. AcknowledgmentF. Conflict Resolution
Domain III: Program Offering and ActivitiesA. Learning ObjectivesB. Lesson PlansC. Communication of ObjectivesD. Teaching StrategiesE. Connection to Prior KnowledgeF. Choice and PlanningG. Tangible OutcomesH. Feedback to Staff
Domain IV: Assessment, Planning, and Organizational StructureA. Common VisionB. Continuous ImprovementC. Cultural Competency TrainingD. Professional DevelopmentE. Data Management
Domain V: Family, School, and Community ConnectionsA. Youth and Family InputB. Communication with FamiliesC. Communication with SchoolsD. Community Partnership
Quality Seal Revised
Domain I: Social and Emotional SupportA. Self-Regulation/Managing EmotionsB. Empathy & CompassionC. Lack of BiasD. RedirectionE. EngagementF. PersistenceG. Skill-BuildingH. ReflectionI. Youth Leadership
Domain II: RelationshipsA. Emotional ClimateB. Open-Ended QuestionsC. Sense of BelongingD. CollaborationE. AcknowledgmentF. Conflict ResolutionG. Behavioral ExpectationsH. Understanding YouthI. Metacognition
Domain III: Program Offering and ActivitiesA. Learning ObjectivesB. Lesson PlansC. Communication of ObjectivesD. Teaching StrategiesE. Connection to Prior KnowledgeF. Choice and Decision-MakingG. PlanningH. Tangible OutcomesI. Feedback to StaffJ. ModelingK. Feedback to Youth
Domain IV: Assessment, Planning, and Organizational StructureA. Common VisionB. Continuous ImprovementC. Cultural Competency TrainingD. Professional DevelopmentE. Data ManagementF. Long-Term Outcomes
Domain V: Family, School, a nd Community ConnectionsA. Youth and Family InputB. Communication with FamiliesC. Communication with SchoolsD. Community Partnership

APPENDIX H:
Quality Seal Development and Validation

37APPENDIX
The Quality Seal is an observation-based tool designed to assess the quality of programs that serve children and youth in before- and after-school programs and in the summer. It was created to serve as the quality assessment tool and protocol for a state accountability mechanism, thus contributing to ELO system-building and the state-supported birth-to-18 quality continuum. By attaining certain thresholds of performance, as assessed by the tool, programs could be publicly recognized with a Seal of Quality for ELO practice. The achievement of this Quality Seal could affect eligibility for funding, and the process could hold programs accountable by providing incentives for the development or maintenance of high-quality ELO practices.
Given the high-stakes purpose, it is critical that the Quality Seal tool possess optimal psychometric properties. This validation occurred during the evaluation, as we rigorously assessed the instrument’s reliability, validity, and usefulness. This is a critical first step in gathering initial psychometric property data and supports continuous tool improvement.
We sought to develop and validate a program quality assessment instrument for use in ELO settings. Measurement validation is a continuous process. Kane’s (2006) validity argument framework (see Figure 1) specifies four inferences in understanding validity: scoring, generalization, extrapolation, and implications.
Figure 1. Kane’s Validity Argument Framework
Hypothesized Empirical Relationships
Target Domain (TD)
Interpretive Argument
Trait Trait Interpretation
Target ScoreExpected Value over TD
Sample (S) of Observations
Scoring
Gen
eral
izat
ion
Extr
apol
atio
nIm
plic
atio
nUniverse of
Generalization(UG)
Observed Score (Xp)
Universal ScoreExpected Value over UG
OtherTraits
Context
ObservationMethods
The scoring inference connects the observed interactions with the scores given to those interactions. Generalization inference refers to the extent that the dimensions of program quality in the measure are representative of the universal score of the trait. The extrapolation inference makes claims about the degree to which scores from the observation protocol are related to the trait. The implication involves extensions of the interpretation to include any claims or suggestions associated with the trait. While individual studies in a validity argument may focus on content analyses, statistical analyses, or relationships to criteria, the validity argument as a whole requires the integration of different kinds of evidence from different sources.
The main advantage of Kane’s (2006) argument-based approach to validation is the guidance it provides in allocating research effect to the appropriate validation argument. A validation argument refers to the purpose for which the assessment tool will be used. For example, if an assessment tool is going to be used to screen children who are at risk for a developmental disability, then it would be most important to validate how well the tool accurately distinguishes a child with a potential developmental delay from one who does not have a delay. In the case of the Quality Seal, the purpose of the tool is to measure program quality. Kane’s framework guided the Quality Seal tool development and led us to pursue answers to the following questions:

38APPENDIX
Scoring: • What is the inter-rater reliability of the Quality Seal?
Generalization: • What is the internal consistency of the Quality Seal?
Extrapolation: • What is the face validity of the Quality Seal?
• What is the factor structure of the Quality Seal?
• What is the convergent validity between the Quality Seal and the Youth Quality Assessment?
Implication: • How sensitive is the Quality Seal in detecting program quality change?
Answers to these six questions provide important information about the psychometric properties of the Quality Seal, and ultimately, its validity as a measure of ELO program quality. Specifically:
a) At the scoring inference level, we evaluated the inter-rater reliability of the scoring protocol. Inter-rater reliability, or inter-rater agreement, is the degree of agreement among raters. It gives a score of how much homogeneity or consensus there is in the rating. It is useful in refining the tools given to human judges, for example, by determining if a particular scale is appropriate for measuring a particular variable. If various raters do not agree, either the scale is defective or the raters need to be re-trained. This information is critical to further improve the Quality Seal items and scoring procedures. It also helps to evaluate the extent to which the observation data are reliable and accurate.
b) At the item generalization level, internal consistency provides information about whether several items that propose to measure the same general construct produce similar scores. It provides initial information about whether items fit well together as a scale, or whether a subset of items may well represent or generalize to the larger pool of items.
c) Regarding the extrapolation, we gathered initial face validly evidence and then conducted factor analysis to understand how the constructs are best measured by the items. Face validity looks at the degree to which a procedure, especially a psychological test or assessment, appears effective in terms of its stated aims. This helps to determine whether the Quality Seal appears to measure what it is supposed to measure. The key concept of factor analysis is that multiple observed variables have similar patterns of responses because they are all associated with a latent (i.e., not directly measured) variable (i.e., program quality in this case). Factor analysis is a useful tool to investigate variable relationships for complex concepts such as socioeconomic status, dietary patterns, or psychological scales. It allows researchers to investigate concepts that are not easily measured directly by collapsing a large number of variables into a few interpretable underlying factors. Understanding the factor structure of quality seal will help us better measure the construct or aspect of program quality and thus provide better estimate of the domain score. Moreover, convergent validity analysis provides evidence about the degree of alignment with the criteria or gold standard measure (i.e., Youth Quality Assessment).
d) At the score interpretation level, our goal was to understand how sensitive the Quality Seal is in detecting program quality change. This provides critical information for future cut score development, or in other words, Quality Seal attainment.

39APPENDIX
We gathered multiple data sources to evaluate the evidence regarding the Quality Seal psychometric properties. For ease of comprehension, we describe this method in chronological order.
• First, we gathered face validity information through expert review. We based development of the Quality Seal on the long-standing work already in the field of ELO program quality and program quality assessment, which included as-sessment tools, frameworks of child and youth development, and new and compelling research around social and emotional learning. The Quality Seal was developed as a simple and succinct instrument that combined and aligned the standards and research from these sources. Among these important tools and reports instrumental to the Qual-ity Seal’s development are the University of Chicago Consortium on School Research’s Wallace Report, a develop-mental framework for youth development, and the Weikart Center’s School-Age and Youth Program Quality Assess-ment tools. Because of their expertise in areas relevant to the Quality Seal’s development, the Equity in Education Coalition and the Consortium on Chicago School Research (CCSR) vetted the Quality Seal in the later stages of its development. To ensure that the Quality Seal tool supports all youth in Washington State communities equitably, the Equity in Education Coalition reviewed and provided feedback on the Quality Seal tool through a racial equity lens. To improve the tool’s ability to accurately assess ELO quality, the CCSR provided important feedback on the structure of the tool. We integrated feedback from these organizations into the Quality Seal before the tool’s implementation.
• Second, we developed an assessment protocol with training materials on the face validity result. We recruited six data collectors to assist with the data collection process. The data collectors were paired to double-assess 25% of the programs, and they calculated the absolute inter-rater agreement. Data collectors that did not meet the 80% agreement criteria were asked to reassess. We provided further training and the protocol was improved and refined as needed to minimize ambiguity.
• We used the initial Quality Seal tool to measure the program quality of 50 after school programs across Washington State. The Cronbach alpha statistics were calculated to measure the degree of internal consistency using the base-line assessment data. The process was replicated for the post assessment data because new items were added to the Quality Seal. Cronbach’s Alpha ranges from 0 to 1, with higher values indicating greater internal consistency (and ultimately reliability). Common guidelines for evaluating Cronbach’s Alpha are: .00 to .69 = poor; .70 to .79 = fair; 80 to .89 = good; 90 to .99 = excellent/strong.
• We conducted an exploratory factor analysis (EFA) with the pre- and post-assessment data to understand the po-tential factor structure and reduce items that did not seem to load on any of the factors. EFA is a statistical method used to uncover the underlying structure of a relatively large set of variables. We used Eigenvalue-greater-than-one (Kaiser, 1960) to determine the factor loading and oblique rotations as they permit correlations among factors, though the factors thus identified may not correlate. (See Appendix R for factor analysis data.)
• We calculated the convergent validity of the Quality Seal and PQA with the pre- and post- assessment data. Con-vergent validity refers to the degree to which two measures of constructs that theoretically should be related are in fact related. Campbell and Fiske (1959) developed the Multitrait-Multimethod Matrix to assess the construct validity of a set of measures in a study. The approach stresses the importance of using both discriminant and convergent validation techniques when assessing new tests. In other words, to establish construct validity, both convergence and discrimination were demonstrated through a correlation matrix.
• Finally, to compare the sensitivity of both measures, we conducted a series of pair sample t-tests with both the pre- and post-Quality Seal and PQA scores.
The results of our investigation are below, along with recommendations for continued research and development regarding the Quality Seal.
• Scoring inference. Inter-rater reliability (IRR): The inter-rater reliability for the Quality Seal was tested using pre- and post-assessment data. The mean pre-assessment IRR was .88 (ranged from .76 to .99), while the mean post-as-sessment IRR was .81 (ranged from .50 to .99). For assessors that fell below the .80 standard, we provided further training. Tables 1 and 2 show Quality Seal pre-and post-assessment IRR data.

40APPENDIX
Table 1. Inter-rater Reliability for Pre Quality Seal (Mean=0.88)
ICC Lower Upper Value df1 df2 Sig
7W_BCA 0.99 0.98 1 99.58 31 31 <.001
10P_CCB 0.97 0.93 0.98 28.61 31 31 <.001
14K_ADB 0.96 0.92 0.98 25.93 31 31 <.001
5K_ABA 0.96 0.91 0.98 25.28 31 31 <.001
10K_ACB 0.93 0.85 0.96 13.58 29 29 <.001
9K_ACA 0.91 0.81 0.96 12.49 31 31 <.001
1P_CAA 0.88 0.74 0.94 8.54 31 31 <.001
8P_CBD 0.86 0.7 0.93 7.61 31 31 <.001
13P_CDA 0.83 0.65 0.92 6.39 31 31 <.001
5P_CBA 0.82 0.64 0.91 5.62 31 31 <.001
7P_CBC 0.76 0.5 0.88 4.05 31 31 <.001
16K_ADD 0.69 0.37 0.85 3.29 31 31 0.001
Table 2. Inter-rater Reliability for Post-Quality Seal (Mean=0.81)
IRR Lower Upper Value df1 df2 p
1P_CAA 0.959 0.978 1 23.995 39 39 <.001
11K_ACC 0.502 0.059 0.737 2.008 39 39 0.016
3K_AAC 0.752 0.509 0.872 4.538 39 39 <.001
13K_ADA 0.967 0.937 0.982 29.504 39 39 <.001
4K_AAD 0.568 0.176 0.773 2.284 39 39 0.006
14K_ADB 0.793 0.608 0.89 4.824 39 39 <.001
2W_BAB 0.992 0.984 0.996 118.744 39 39 <.001
6P_CBB 0.884 0.78 0.938 8.417 39 39 <.001
15K_ADC 0.866 0.746 0.929 7.331 39 39 <.001
7K_ABC 0.774 0.549 0.884 5 39 39 <.001

41APPENDIX
Generalization inference. Internal consistency: We tested the internal consistency of the Quality Seal using pre- and post-assessment data. The Quality Seal showed excellent internal consistency using the pre-assessment data (Cronbach’s Alpha = .86) and acceptable internal consistency using the post-assessment data (Cronbach’s Alpha = .68). Including the added items to the post-assessment data improved overall internal consistency (Cronbach’s Alpha = .73). Based on the interpretation guideline, the internal consistency of the Quality Seal is fair to good. Tables 3–5 present internal consistency data.
Table 3. Pre Qseal Internal Consistency
Scale Mean if Item Deleted
Scale Variance if Item Deleted
Corrected Item–Total Correlation
Cronbach’s Alpha if Item Deleted
aSelfRegulationManagingEmotions_pre 72.90 108.69 0.24 0.86
bEmpathyandCompassion_pre 73.29 104.68 0.44 0.856
cLackofBias_pre 73.10 109.50 0.12 0.864
dRedirection_pre 73.25 104.06 0.38 0.857
eEngagementAct_pre 72.98 105.55 0.48 0.856
fPersistence_pre 73.15 104.77 0.45 0.856
gSkillBuilding_pre 73.19 99.69 0.72 0.848
hReflection_pre 73.90 100.31 0.54 0.852
iYouthLeadership_pre 74.10 104.48 0.40 0.857
aEmotionalClimate_pre 72.96 109.19 0.24 0.86
bAdultChildInteractions_pre 73.23 103.07 0.49 0.854
cSenseofBelonging_pre 72.92 107.23 0.36 0.858
dCollaboration_pre 73.44 104.68 0.42 0.856
eAcknowledgment_pre 73.15 109.28 0.14 0.863
fConflictResolution_pre 72.90 109.29 0.19 0.861
aLearningObjectives_pre 73.52 99.83 0.61 0.85
bLessonPlans_pre 73.06 104.83 0.48 0.855
cCommunicationofObjectives_pre 74.06 103.51 0.42 0.856
dTeachingStrategies_pre 73.21 105.06 0.48 0.855
eConnectiontoPriorKnowledge_pre 73.73 103.31 0.46 0.855
fChoiceltstronggtoriginalltstronggt_pre 73.33 107.46 0.35 0.858
gTangibleOutcomes_pre 73.21 103.11 0.47 0.855
hFeedback_pre 74.04 102.34 0.46 0.855
aCommonVision_pre 73.17 104.48 0.41 0.856
bContinuousImprovement_pre 73.73 104.54 0.44 0.856
cCulturalCompetencyTraining_pre 73.83 105.50 0.31 0.86
dProfessionalDevelopment_pre 73.15 110.17 0.09 0.864
eDataManagement_pre 73.38 104.24 0.37 0.858
aYouthandFamilyInput_pre 73.17 106.01 0.38 0.857
bCommunicationwithFamilies_pre 73.60 110.63 0.05 0.865
cCommunicationwithSchools_pre 73.10 109.24 0.16 0.862
dCommunityPartnership_pre 73.23 105.93 0.31 0.859

42APPENDIX
Table 4. Post Qseal Internal Consistency
Scale Mean if Item Deleted
Scale Variance if Item Deleted
Corrected Item–Total Correlation
Cronbach’s Alpha if Item Deleted
aSelfRegulationManagingEmotions 74.46 39.04 0.13 0.632
bEmpathyandCompassion 75.32 37.48 0.24 0.623
cLackofBias 74.48 39.14 0.07 0.635
dRedirection 75.48 39.37 -0.05 0.658
eEngagement 74.52 37.79 0.42 0.619
fPersistence 74.80 35.93 0.39 0.608
gSkillBuilding 75.11 39.13 -0.02 0.651
hReflection 75.27 36.11 0.22 0.624
iYouthLeadership 75.89 39.68 -0.05 0.647
aEmotionalClimate 74.66 38.37 0.20 0.627
bOpenEndedQuestions 74.52 38.40 0.19 0.628
cSenseofBelonging 74.98 37.09 0.21 0.625
dCollaboration 74.98 39.28 -0.02 0.647
eAcknowledgment 74.52 37.93 0.32 0.622
fConflictResolution 74.50 38.12 0.25 0.624
aLearningObjectives 74.86 35.00 0.37 0.614
bLessonPlans 74.68 36.92 0.48 0.855
cCommunicationofObjectives 75.89 37.68 0.42 0.632
dTeachingStrategies 74.93 38.21 0.20 0.627
eConnectiontoPriorKnowledge 75.48 36.16 0.25 0.62
fChoiceltstronggtoriginalltstronggt 74.71 40.45 -0.15 0.651
gTangibleOutcomes 74.61 38.01 0.20 0.625
hFeedbacktostaff 75.18 33.46 0.47 0.591
aCommonVision 74.71 37.56 0.20 0.856
bContinuousImprovement 75.25 38.10 0.11 0.635
cCulturalCompetencyTraining 75.36 37.12 0.18 0.628
dProfessionalDevelopment 75.07 36.95 0.26 0.62
eDataManagement 75.11 36.20 0.26 0.619
aYouthandFamilyInput 74.66 36.56 0.54 0.607
bCommunicationwithFamilies 75.25 39.68 -0.05 0.645
cCommunicationwithSchools 75.02 37.23 0.21 0.625
dCommunityPartnership 74.84 37.67 0.14 0.631

43APPENDIX
Table 17. Post Qseal Revised Internal Consistency
Scale Mean if Item Deleted
Scale Variance if Item Deleted
Corrected Item–Total Correlation
Cronbach’s Alpha if Item Deleted
aSelfRegulationManagingEmotions 91.11 69.96 0.17 0.729
bEmpathyandCompassion 91.98 67.79 0.28 0.723
cLackofBias 91.14 69.80 0.15 0.729
dRedirection 92.14 70.03 0.00 0.742
eEngagement 91.18 68.52 0.41 0.723
fPersistence 91.46 66.30 0.38 0.718
gSkillBuilding 91.77 67.14 0.02 0.739
hReflection 91.93 36.11 0.18 0.73
iYouthLeadership 92.55 70.35 0.02 0.735
aEmotionalClimate 91.32 68.55 0.30 0.724
bOpenEndedQuestions 91.18 69.18 0.21 0.727
cSenseofBelonging 91.64 67.63 0.21 0.726
dCollaboration 91.52 70.16 0.02 0.736
eAcknowledgment 91.18 68.62 0.33 0.724
fConflictResolution 91.16 68.84 0.27 0.725
aLearningObjectives 91.52 65.19 0.50 0.712
bLessonPlans 91.34 66.88 0.42 0.718
cCommunicationofObjectives 92.55 68.53 0.14 0.73
dTeachingStrategies 91.59 66.12 0.15 0.729
eConnectiontoPriorKnowledge 92.14 36.16 0.28 0.723
fChoiceltstronggtoriginalltstronggt 91.36 71.49 --0.08 0.738
gTangibleOutcomes 91.27 69.18 0.16 0.728
hFeedbacktostaff 91.84 62.70 0.48 0.708
aCommonVision 91.36 68.56 0.18 0.728
bContinuousImprovement 91.91 68.60 0.15 0.73
cCulturalCompetencyTraining 92.02 67.88 0.17 0.729
dProfessionalDevelopment 91.73 66.85 0.32 0.721
eDataManagement 91.77 66.37 0.27 0.723
aYouthandFamilyInput 91.32 66.92 0.53 0.717
bCommunicationwithFamilies 75.25 71.57 -0.09 0.739
cCommunicationwithSchools 91.68 67.71 0.22 0.726
dCommunityPartnership 91.50 69.00 0.11 0.732
addgBehavioralEpectations 91.93 65.69 0.33 0.719
addhUnderstandingYouth 92.09 69.43 0.09 0.732
addMetacognition 92.41 64.34 0.41 0.714
addfChoiceampDecisionMaking 91.50 71.23 -0.06 0.737
addfPlanning 92.25 64.42 0.38 0.715
addhModeling 91.96 63.53 0.46 0.71
addhFeedbacktoYouth 92.02 67.88 0.27 0.724
addfLongTermOutcomes 91.55 66.77 0.28 0.722

44APPENDIX
Extrapolation inference. Face validity: Based on the conceptual model and expert feedback, we proposed an initial protocol for the Quality Seal. It gets at the heart of high-quality programs and assumes many other challenges have been addressed when a program is able to meet the standards of the tool. The Quality Seal emphasizes only five essential pillars of high-quality ELO programs:
1. Social and emotional support
2. Relationships
3. Program offerings and activities
4. Assessment, planning, and organizational structure
5. Family, school, and community connections
Each of these essential pillars serves as a domain of ELO program quality, and each contains from four to nine items. Each item evaluates specific and measurable occurrences or situations within a program that are used to quantify a particular aspect of ELO program quality. The items within the first three domains are primarily evaluated through an observation of an ELO program, while the items from the last two domains are assessed through the information gained from standardized interview questions with ELO staff and by reviewing certain documents from the ELO program.
Each item in the Quality Seal, corresponding to a particular aspect of ELO program quality, is scored on a 3-point interval scale (1, 2, or 3), and each point is assigned specific criteria for scoring. An interval scale system was used because it allows for more advanced statistical analysis, such as correlation and regression (Brennan, 2006). Additionally, whereas an ordinal scale describes one category only as greater than, less than, or equal to another, with an interval scale, the difference between categories is quantified in scale points that have consistent meaning in the scale (Lee, W. C., Brennan, R. L., & Kolen, M. J. (2006))
Factor structure: Based on the EFA result, a four-factor structure seemed to be more appropriate compared to the original five-factor solution. Table 6 shows how the items were loaded for each factor. It may be necessary to reorganize the items and re-label the constructs based on the theories and results.

45APPENDIX
Table 6. Quality Seal Factor Analysis
Component
1 2 3 4
aLearningObjectives 0.727
cCommunicationofObjectives 0.64
dTeachingStrategies 0.624
gSkillBuilding 0.563
hReflection 0.559
dCollaboration 0.556
eEngagement 0.54
bAdultChildInteractions 0.498
bLessonPlans 0.489
hFeedback 0.469
gTangibleOutcomes 0.436
dCommunityPartnership 0.397
aCommonVision 0.377
fPersistence 0.372
aSelfRegulationManagingEmotions 0.795
aEmotionalClimate 0.75
fConflictResolution 0.739
dRedirection 0.31
cCulturalCompetencyTraining 0.714
dProfessionalDevelopment 0.703
cSenseofBelonging 0.556
bContinuousImprovement 0.518
bEmpathyandCompassion 0.446
eDataManagement 0.415
aYouthandFamilyInput 0.376
cCommunicationwithSchools 0.362
bCommunicationwithFamilies 0.659
fChoiceltstronggtoriginalltstronggt 0.529
cLackofBias 0.46
iYouthLeadership
eAcknowledgment
Convergent validity Q. Seal and PQA: The convergent validity between the Quality Seal and PQA for the pre-assessment data was acceptable (r = .54), and it is improved (r = .63) based on factor analysis results. For the post-assessment data, the convergent validity between the Quality Seal and the PQA was weak (r =.01), and it is improved (r = .24) based on factor analysis results. Correlation at the .50-.60 level is considered good—meaning that the Quality Seal

46APPENDIX
and PQA have good convergent validity. The mean score of a construct tends to measure the construct better based on information from the factor analysis, and thus improves the overall convergent validity between two instruments. Meanwhile the correlation matrix of both pre- and post-assessment indicated that constructs are discriminate with one another as well as across the instrument (see tables 7, 8, and 9 for correlations between Quality Seal and PQA). Originally we attempted to further evaluate the convergent validity between the Early Achievers Quality Rating and Improvement System (QRIS) and the Quality Seal. But the convergent validity between the Quality Seal and the Early Achiever’s QRIS was inconclusive due to a sample size of only 10 sites. (See Appendix S for convergent validity data.)
Table 7. Spearman’s rho Correlations between Quality Seal and Youth Program Quality Measure
1 2 3 4 5 6 7 8 9 10 11
Pre_socialemotionQ 1
Pre_relationship .621** 1
Pre_programofferingQ .718** .423** 1
Pre_assessmentQ .316* 0.279 0.281 1
Pre_familyQ 0.262 0.196 0.138 0.081 1
PreSafe Environment 0.292 0.158 0.224 -0.116 0.041 1
PreSupport Environment .617** .543** .621** 0.285 0.025 0.117 1
PreInteraction .297* 0.282 0.212 0.171 0.119 .300* .419** 1
PreEngagement .304* 0.158 0.18 0.02 0.17 .485** .353* .422** 1
Pre_Qseal .854** .715** .779** .593** .428** 0.172 .643** .356* 0.217 1
PrePQAfinal .574** .445** .490** 0.184 0.106 .577** .641** .760** .793** .539** 1
** Correlation is significant at the 0.01 level (2-tailed).* Correlation is significant at the 0.05 level (2-tailed).

47APPENDIX
Table 8. Spearman’s rho Correlations between Post Quality Seal and Youth Program Quality Measure
1 2 3 4 5 6 7 8 9 10 11
Post_socialemotionQ 1
Post_relationshipQ .422** 1
Post_programofferingQ .521** .471** 1
Post_assessmentQ 0.067 -0.093 0.073 1
Post_familyQ 0.12 0.253 0.154 .339* 1
PostSafe Environment 0.002 0.159 -0.163 -.320* -0.243 1
PostSupport Environment 0.155 0.22 0.079 -0.127 0.183 0.099 1
PostInteraction -0.023 .305* 0.138 -0.175 0.174 0.262 .614** 1
PostEngagement -0.068 0.181 0.145 -0.12 0.053 0.204 .462** .710** 1
Post_Qseal .567** .551** .622** .595** .646** -0.26 0.091 0.078 0.02 1
PostPQAfinal -0.009 0.229 0.086 -0.178 0.05 .328* .698** .884** .906** -0.011 1
** Correlation is significant at the 0.01 level (2-tailed). * Correlation is significant at the 0.05 level (2-tailed).
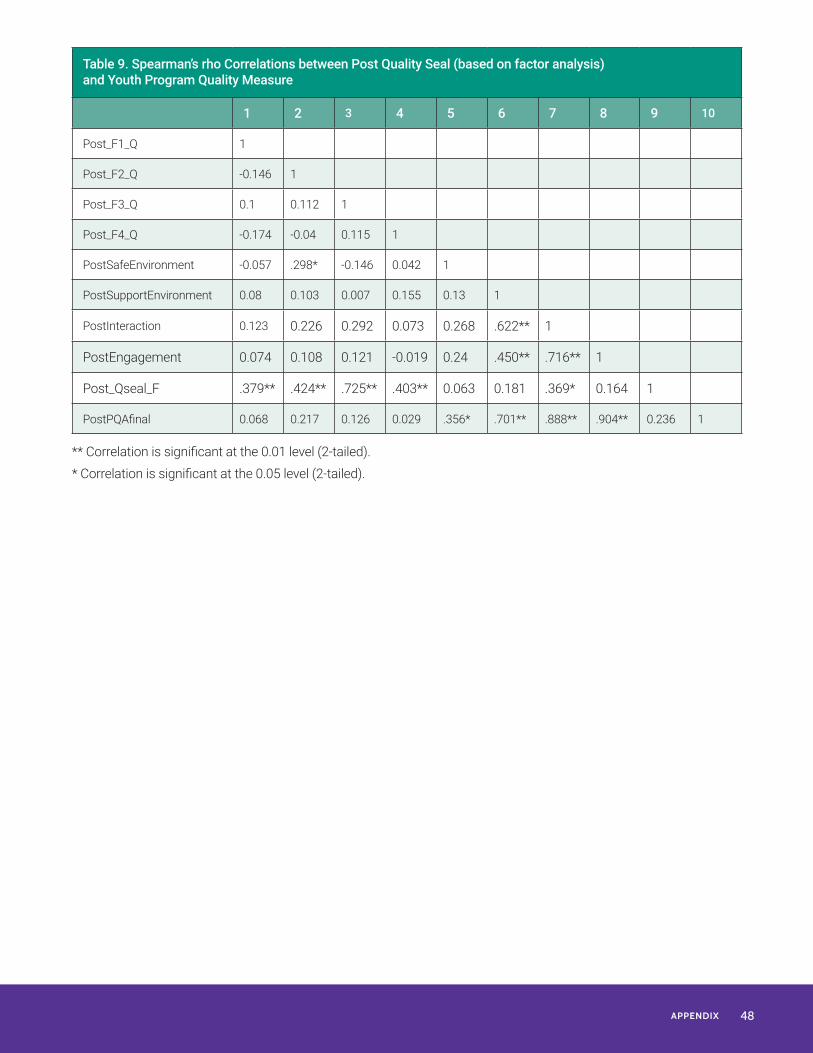
48APPENDIX
Table 9. Spearman’s rho Correlations between Post Quality Seal (based on factor analysis) and Youth Program Quality Measure
1 2 3 4 5 6 7 8 9 10
Post_F1_Q 1
Post_F2_Q -0.146 1
Post_F3_Q 0.1 0.112 1
Post_F4_Q -0.174 -0.04 0.115 1
PostSafeEnvironment -0.057 .298* -0.146 0.042 1
PostSupportEnvironment 0.08 0.103 0.007 0.155 0.13 1
PostInteraction 0.123 0.226 0.292 0.073 0.268 .622** 1
PostEngagement 0.074 0.108 0.121 -0.019 0.24 .450** .716** 1
Post_Qseal_F .379** .424** .725** .403** 0.063 0.181 .369* 0.164 1
PostPQAfinal 0.068 0.217 0.126 0.029 .356* .701** .888** .904** 0.236 1
** Correlation is significant at the 0.01 level (2-tailed).* Correlation is significant at the 0.05 level (2-tailed).

49APPENDIX
Implication inference. Program quality change sensitivity: Descriptive data suggest program quality varies before intervention (M=2.41, SD=0.28, ranging from 1.77 to 2.86). Table 10 presents the descriptive information at the construct level.
Table 10. Descriptive Statistics of the Pre and Post Quality Seal and PQA Scores
Pre Post
Min Max M SD Min Max M SD
Social Emotion 1.44 3 2.41 0.43 1.75 2.67 2.33 0.25
Relationship 1.83 3 2.64 0.32 2 3 2.70 0.27
Program Offering 1.25 3 2.23 0.50 1.38 3 2.30 0.39
Assessment 1 3 2.27 0.52 1.4 3 2.27 0.51
Family 1.5 3 2.45 0.38 1.5 3 2.41 0.39
Quality Seal 1.77 2.86 2.41 0.28 1.92 2.82 2.40 0.22
Safe Environment 3.56 5 4.57 0.34 4 5 4.71 0.26
Support Environment 2.37 5 4.16 0.59 3 5 4.19 0.61
Interaction 2.08 5 3.49 0.71 2 5 3.74 0.71
Engagement 1.25 4.67 2.96 0.71 1 5 3.34 1.07
PQA 2.78 4.76 3.79 0.44 3 5 4.00 0.53
There were significant changes (see Table 11) for the PQA overall score (t=2.38, df=33, p=.023) and its two subscales: safe environment (t=3.46, df=33, p=.002), and engagement (t=2.33, df=33, p=.026). But no significant results were observed for the Quality Seal at the construct level. At the item level, the following aspects were significantly improved: lack of bias (t=0.51, df=48, p=.004), adult child interaction (t=0.62, df=48, p=.014), acknowledgment (t=0.54, df=48, p=.029), choice (t=0.55, df=48, p=.006), and feedback (t=0.88, df=48, p=.027). The evidence suggests that the Quality Seal might be sensitive to detecting certain aspects of the program quality, but the PQA seems to be more responsive in detecting changes. One reason for the overall non-significant results may have to do with the ceiling effect. As the descriptive data of Quality Seal indicated, programs tend to score high on both the pre- and post-assessment, while the PQA had more variability between the pre- and post-assessment.

50APPENDIX
Table 11. Paired T-test of the pre and post Qseal and PQA Scores
M SD SE Lower Upper t df p
Post_socialemotionQ– Pre_socialemotionQ -0.08 0.48 0.07 -0.21 0.06 -1.10 48 .28
Post_relationshipQ– Pre_relationship 0.06 0.42 0.06 -0.05 0.18 1.09 48 .28
Post_programofferingQ– Pre_programofferingQ 0.10 0.57 0.08 -0.07 0.26 1.17 48 .25
Post_assessmentQ– Pre_assessmentQ 0.00 0.68 0.10 -0.19 0.20 0.04 48 .97
Post_familyQ–Pre_familyQ -0.02 0.55 0.08 -0.17 0.14 -0.20 48 .85
Post_Qseal– Pre_Qseal 0.01 0.35 0.05 -0.09 0.11 0.30 48 .77
PostSafeEnvironment–PreSafeEnvironment 0.19 0.33 0.06 0.08 0.31 3.46 33 .002
PostSupportEnvironment–PreSupportEnvironment
0.06 0.65 0.11 -0.16 0.29 0.57 33 .571
PostInteraction– PreInteraction 0.24 1.00 0.17 -0.11 0.59 1.41 33 .167
PostEngagement–PreEngagement 0.43 1.09 0.19 0.05 0.81 2.33 33 .026
PostPQAfinal–PrePQAfinal 0.23 0.57 0.10 0.03 0.43 2.38 33 .023
As with the overall evaluation, the sample size was an issue. The sample of sites enrolled in the experiment was 50 and decreased via attrition to 39 for some analyses. Most of Cohort 5 dropped out. Consequently, the statistical analyses (as opposed to some graphical analyses that we have also performed) were seriously underpowered to reject the null hypothesis of no effect.
Based on our finding, we believe it is necessary to collect more data on the updated Quality Seal to determine cut scores and to provide a high-quality attainment goal for ELO programs engaged in quality improvement. Among the PQA, the Quality Seal, and the updated Quality Seal with additional items, the updated Quality Seal is the most rigorous of the three program quality evaluations.
References
Campbell, D. T., & Fiske, D. W. (1959). Convergent and discriminant validation by the multitrait-multimethod matrix. Psychological bulletin, 56(2), 81.
Kane, M. T. (2006). Validation. In R. L. Brennan (Ed.), Educational measurement (4thed., pp. 17–64). Washington, DC: The National Council on Measurement in Education & the American Council on Education.
Kaiser, H.F. (1960). The application of electronic computers to factor analysis. Educational and Psychological Measurement, 20, 141-151.
Lee, W. C., Brennan, R. L., & Kolen, M. J. (2006). Interval estimation for true raw and scale scores under the binomial error model. Journal of Educational and Behavioral Statistics, 31(3), 261–281.

APPENDIX I:
Weekly Video Coding Inter-rater Reliability for PQA

52APPENDIX
Table 2. Inter-rater Reliability for Post-Quality Seal (Mean=0.81)
IRR Lower Upper Value df1 df2 p
1P_CAA 0.79 0.61 0.89 4.83 40 39 0
2S_DAB 0.94 0.88 0.96 15.11 44 44 0
5K_ABA 0.92 0.84 0.96 11.96 39 39 0
4P_CAD 0.68 0.41 0.83 3.11 41 41 0
15K_ADC 0.81 0.64 0.89 5.52 44 44 0
5W_BBB 0.69 0.43 0.84 3.32 40 40 0
9P_CAA 0.90 0.80 0.94 10.33 43 43 0
6W_BBC 0.83 0.67 0.91 6.38 41 41 0
12P_CCD 0.80 0.64 0.89 4.89 48 48 0
3K_AAC 0.83 0.69 0.91 5 5.83 43 43 0
7K_ABC 0.77 0.58 0.87 4.58 44 44 0
2P_CAB 0.95 0.90 0.97 18.72 40 40 0
14K_ADB 0.70 0.43 0.84 3.59 42 42 0

APPENDIX J:
Description of Practice-Based Coaching Model

54APPENDIX
Practice Based Coaching and Coaching Companion
a. Coaching as a Professional Development StrategyCoaching is a form of professional development that supports professionals, ensures intervention fidelity, increases program quality, and produces positive outcomes for children. 101 studies, published between 1995 and January 2011, were reviewed that all included some form of coaching to practitioners working with children ages three through five. Coaching was the primary form of professional development in 24% of studies. Of those using coaching, only 23% followed a manual or script and 27% used specific materials or resources. Seventy-four percent delivered coaching face-to- face and 12% used a web-based format. 22% stated coaching typically lasts for one year. Thirty-nine percent met weekly and 26% met monthly. The specific length of sessions was not reported in 48% of the studies, but 37% stated sessions lasted more than 30 minutes. (NCQTL, Practice-Based Coaching, 2014)
Coaching not only positively impacts programs and practices, but studies that used components of Practice-based coaching were associated with positive child outcomes. Outcomes included increased participation and engagement, increased social skills and fewer challenging behaviors, increased literacy and language; and increased skills associated with the Head Start Outcomes Framework for logic and reasoning and approaches to learning. (NCQTL,What Do We Already Know About Coaching?, 2014)
b. Practice Based Coaching in ELOPBC supports the implementation of evidence based practices that are attached to an assessment tool. The PBC framework is new to the ELO field, but CQEL has a long history and proven-track record of providing and supporting PBC in the Early Childhood field. PBC has shown to support professionals use of effective evidence based practices has led to positive outcomes for children. The ELO pilot, created an opportunity to apply the PBC framework to the ELO field.
i. Collaborative PartnershipParticipants in the PBC process are referred to as partners. Partners can be the coach, individual, and possibly peers. PBC can happen either in-person or through distance learning and individually or in a group. In PBC, an expert is defined as someone who has knowledge and experience in the strategies coached. The coach is seen as the expert, but a peer or the professional can also step into the role of the expert. (NCQTL, Practice-Based Coaching, 2014)
PBC occurs within a collaborative partnership which is a working interaction between a coach and professional, group facilitator and professionals, or between peers. It provides a safe space for providers to ask questions, discuss problems, get support, gather feedback, reflect on practice, and try new ideas.
PBC is not evaluative or judgmental, but supportive with the goal of helping adults grow professionally. Coaches establishes reciprocal relationships through building rapport and creating a shared understanding. Each relationship is unique to the individuals and centered around strengths, needs, shared understanding, and desired outcomes. Developing collaborative partnerships is on-going throughout the PBC framework. (NCQTL, Practice-Based Coaching, 2014)
ii. Guiding PrinciplesThe three guiding principles of PBC is culturally responsive coaching, parallel process, and resilience. Culturally responsive coaching promotes inclusiveness, mutual respect, and community. It emphasizes am awareness of how culture influence how providers think about and practice high quality strategies. Parallel Process highlights that the coach and coachee relationship is a coaching strategy that impacts interactions between the coachee and program participants. Resiliency highlights that asking providers to make changes can be taxing and at times overwhelming. PBC values acknowledging and supporting the coachee’s well-being. (NCQTL, Practice-Based Coaching, 2014)
EffectiveTeachingPractices
Focused
ObservationShar
ed
Goals
and
Actio
n
Plan
ning
Reflection
and
Feedback
Col la
bora t ive
Coaching
Partnerships

55APPENDIX
iii. PBC ElementsPBC has three elements; shared goals and SMART action planning, focused observation, and reflection and feedback. Each component is designed to inform the actions taken by the coach and coachee during the next step, and throughout the coaching process. The cyclical nature supports coaching as a continuous cycle of review and updating. (NCQTL, Practice-Based Coaching, 2014)
1. Shared Goals and SMART Action PlansIn this stage, the coach and coachee assess needs, set goals, create an action plan, review, and update goals and action plans throughout the coaching partnership. It includes both initial and on-going goal setting and action planning. During initial goal setting and action planning, a needs or program assessment is conducted. The coach will gather data about current teaching practices and work collaboratively with the coachee to determine priorities. Based on the data, a goal is developed that guides the creation of a SMART action plan. A SMART action plan is specific, measurable, achievable and within a timeframe. Goals and action plans provide a road map for improvement, accountability, and the opportunity to monitor progress. When creating a SMART action plan, the coach and coachee would identify specific; planning, steps, resources, and supports needed to reach the goal. Twenty-three percent of coaching studies explicitly identified goal setting and action planning as a component of coaching. (NCQTL, Practice-Based Coaching, 2014)
2. Focused ObservationIn this stage, the coach gathers information thorough observation. Observation is defined as the process of gathering and recording information and implementing a desired practice. It is guided by the goal and action plan. The coach observes the coachee’s practice, records information about the observation, and uses supportive strategies to learn more, improve, or refine the practice. Observations are considered focused because the coach is gathering specific information on the shared goal and action plan rather than a general observation. Focused observations can include live observations, reviewing video tape, reviewing program materials, and/or self-monitoring. Sixty-five percent of all coaching studies used observation in coaching. (NCQTL, Practice-Based Coaching, 2014)
3. Reflecting on and Sharing Feedback about PracticeIn this stage, the coach and coachee discuss and reflect on the observation and progress. The coach shares and considers feedback and provides support strategies to learn more about the provider to improve or refine their practices. This stage focuses on providing support strategies and data to identify
successes, challenges, and additional areas of improvement or refinement. The coachee takes time to think about effectiveness, barriers, and considers feedback and support given by the coach. The feedback could be both supportive and/or corrective, but is given with the intention of helping the coachee reach their goal. Reflection can occur through journaling while watching a video, conversation, written notes, graphs on progress, or discussion. Twenty two percent of coaching studies identified reflective conversation in their coaching process and 72% provided performance feedback on practices. (NCQTL, Practice-Based Coaching, 2014)
4. Continuous CycleAfter the reflection and feedback stage the goal and action plan is revisited, reviewed, and updated. The coach and coachee might continue with the same goal, revise it, or identify a new goal or action plan. (NCQTL, Practice-Based Coaching, 2014)

56APPENDIX
c. Coaching CompanionCoaching Companion is a video sharing and coaching feedback app created by CQEL. Providers can record their practice and share videos with their administrators, coaches, trainers, and faculty, as appropriate. They can ask questions, exchange feedback, and develop individualized coaching plans that support quality teaching and positive outcomes for children and youth. It helps coaches and providers or peer-coaching teams work together, even between coach visits or at a distance. The observation tool may be used as part of training, coursework, communities of practice, or one-on-one reflective supervision. (https://eclkc.ohs.acf.hhs.gov/professional-development/article/practice-based-coaching- pbc)
Providers and coaches can use the Coaching Companion to view the video library with examples of teaching practices. They can also share their own classroom video and track progress through the three major components of PBC: Shared Goals and Action Planning, Focused Observation, and Reflection and Feedback. (https://eclkc.ohs.acf.hhs.gov/professional-development/article/practice-based-coaching- pbc)

APPENDIX K1:
Coaching Memorandum of Understanding

58APPENDIX
2016–2017 OST QUALITY INITIATIVE COACHING MEMORANDUM OF UNDERSTANDING
This is a Memorandum of Understanding between School’s Out Washington, hereinafter referred to as “SOWA” and
(Coach).
During the Out-of-School-Time (OST) Quality Initiative, coaches will be individually assigned to sites to support them through the Youth Program Quality Intervention (YPQI). Sites will be placed into one of four cohorts, each with its own timeline of training. In general, OST trainings and coaching will take place between October 2016 and June 2017. Please Refer to the Cohort Timelines to determine exact coaching time frames for each cohort.
COACH RESPONSIBILITIES:1. Complete all required training and attend all required meetings:
a. Attend one Early Achievers Institute (or equivalent orientation) involving an introduction to the OST Initiative. Mileage will be reimbursed. Travel/Lodging will be provided as needed.
b. Attend 1–2 Basics Trainings. These trainings are full-day (approx. 9am-5pm) sessions between November 2016 and February 2017. Mileage will be reimbursed.
c. Attend 1–2 Planning with Data (PWD) trainings. These trainings are four hours per session between November 2016 and February 2017. Mileage will be reimbursed.
d. Attend three All Coaches’ Meetings (or equivalent meeting) throughout the initiative. These meetings will last four hours each and will be held tentatively in September 2016, December 2016, and February 2017. Mileage will be reimbursed. Travel/Lodging will be provided as needed.
e. Attend 2–3 Learning Community Meetings. These meetings will be three hours each and will be scheduled between December 2016 and May 2017. Mileage will be reimbursed.
2. Travel to youth program locations. Mileage will be reimbursed.
3. Meet regularly with assigned sites:a. Site coaching will take place from October 2016 to June 2017 (Note the actual start dates will vary for
each cohort). Each site will receive/require 30 hours of coaching.b. Involve both the site director and program lead teacher in all coaching activities.c. Conduct a coaching session weekly with each assigned site.d. Observe programs and provide feedback as needed both in-person and through Coaching Companion weekly.
4. Document all OST Coaching activitiesa. Documentation time will be required from all coaches. Up to 24 billable hours total for all data entry will be
allowed between October 2016 and June 2017.b. Utilize UW-SOWA provided tracking documents for reporting coaching activities.
5. Maintain regular communication with SOWA and the Regional Coordinators throughout the pilot program.a. Respond to emails or phone calls within 48 hours.b. Utilize out-of-office or automatic replies when not available for an extended period of time and/or notify
SOWA of extended absences.
The undersigned have read the above statements, understand them, and agree to abide by their terms.
Signature Date
Print name

APPENDIX K2:
Coaching Checklist

60APPENDIX
2016–2017 OST QUALITY INITIATIVE COACHING CHECKLIST
Thank you for serving as a coach for the OST Quality Initiative. Below is a checklist of activities or tasks that will need to be completed once your assigned sites officially start the PQA intervention. Some items will need to be completed weekly, whereas others may only need to be completed monthly or on an as- needed basis.
Weekly: q Coaching visit with each site. This can be done in person, through Coaching Companion, or by phone/email
q Track/document any staff changes, programming changes, or other issues your sites may be experiencing
q Update coaching records including timesheets, mileage forms, and UW-SOWA provided coaching documentation
q Confirm that your sites are recording their program offering each week and mailing video cards to UW (Note: Regional Coordinators will also be supporting this task)
Monthly: q Confirm attendance totals for each program offering and/or take note of any significant changes in attendance
q Hold a minimum of two in-person coaching sessions (Sessions can inclusde observation, providing feedback, reflecting on strategies staff have practiced, etc.)
q Hold a minimum of two online coaching sessions using Coaching Companion to send/receive videos and provide feedback to sites
Varying Times/As needed: q Support sites in preparing for and completing self-assessment observations
q Support sites in facilitating a consensus scoring meeting for self-assessment and ensure sites submit scores into the online Scores Reporter
q Support sites in developing an Improvement/Action Plan that includes three PQA-item-specific goals
q Facilitate Methods Workshops for site(s) or modified workshops to train staff on strategies related to PQA goals
q SOWA Coaches: Submit timesheets every two weeks along with mileage reimbursement forms

APPENDIX K3:
Coaching Expectations

62APPENDIX
ELO Coaching Participation Agreement Schedule Breakdown
Coach Responsibility Participation Agreement for Coaches: Coaching Expectation
Coaching To offer 30 hrs of coaching for Each site. This includes:
q Weekly check-in with each assigned site.
q Bi- monthly, in person coaching visits with observation of practice and feedback.
q Bi-monthly online coaching companion observation and feedback.
q Weekly update of coaching documentation survey monkey, follow-ing an in person coaching or onsite session for all assigned site that are actively being coached.
q Involve both the site director and program lead teacher in all coach-ing activities.
Video Taping q Ensure weekly video filming is occurring at the site.
q Notify SOWA if sites will miss filming for a given week
q Notify SOWA of any challenges sites may have regarding their weekly filming
Training q Attend one Early Achievers Institute (or equivalent orientation) involving an introduction to the ELO Initiative.
q Attend 1-2 Basics Trainings
q Attend 1-2 Planning with Data (PWD) trainings.
q Attend three All Coaches’ Meetings
q Attend 2-3 Learning Community Meetings.
Administrative q Respond to emails or phone calls within 48 hours.
q Utilize out-of-office or automatic replies when not available for an extended period of time and/or notify SOWA of extended absences.
q Up to 24 billable hours of documentation time.
q Utilize UW-SOWA provided tracking documents for reporting coach-ing activities.

APPENDIX K4:
Coaches Communication Guide

64APPENDIX
OST QUALITY INITIATIVE – COMMUNICATION GUIDEThank you for supporting the OST Quality Initiative. As we fully embark in the pilot, there will likely be many questions that arise. To help identify the best contact person to address these questions, we have included the list of key contacts and their roles in the OST Quality Initiative.
1. Regional Coordinators: Regional Coordinators provide support to both sites and to coaches. Coordinators schedule initial site visits to prepare media and filming of the program, provide information to sites regarding their timelines and schedules, prepare coaching assignments, support coaches throughout the year, and ensure that sites complete all forms and paperwork associated with participation in the OST Initiative. Regional Coordinators also serve as the direct liaison between University of Washington’s Data Collection Team and program sites. Contact your Regional Coordinator for questions about your individual sites such as your primary contact, program times and start dates, and other information specific to your assigned sites and programs. You can also contact your Regional Coordinator for any questions about the PQA process.
The Regional Coordinators are: 1) Karen Summers in King County at [email protected] 2) Clifford Armstrong III in Pierce at [email protected] 3) Angelique Rusk in Spokane and Walla Walla at [email protected]
• Coaches should not communicate with sites until official cohort start dates. Due to experimental protocols, coaches cannot discuss the PQA with sites until the site has officially started the PQA process (in this case – by attending the Basics training). The dates of these trainings will be dependent on which cohort the site is in. Until a site completes the Basics training, sites should only have contact with their Regional Coordinator. If your sites contact you with questions regarding the PQA process before they have completed their scheduled Basics training, please redirect them to the appropriate Regional Coordinator.
2. Data & Administrative Coordinator – Jarrod Hamerly: The Data & Administrative Coordinator’s role is to provide administrative support to the Regional Coordinators, coaches, and sites, in addition to supporting all reporting needs. Please contact Jarrod at [email protected] for questions regarding cohort timelines, dates and times of trainings, travel arrangements and reimbursements, site stipends, Coaching Companion, or general questions regarding the pilot program. Jarrod will also be available to answer any questions if your Regional Coordinator is not available.
3. Statewide Out-of-School-Time Quality Manager – Sheely Mauck: The Statewide OST Quality Manager directs and supports the overall OST Quality Initiative. Contact Sheely if you have questions about specific trainings or contract concerns, the evaluation process, general coaching questions or concerns, and any other questions about the OST Quality Initiative at [email protected]
4. Data Collectors - School’s Out Washington and University of Washington are working together to coordinate data collection in support of the overall evaluation of the OST Quality Initiative and the development of a Quality Seal. Sites will be visited by both SOWA assessors and UW data collectors simultaneously during the pre-assessment season and post-assessment season.
UW data collectors may need to meet with sites, parents, and/or youth at other times throughout the initiative as well. All communication and coordination of data collection will be led by the Regional Coordinators and the Data & Administrative Coordinator.

APPENDIX K5:
Cohort 1–4 Timelines

66APPENDIX
OST QUALITY INITIATIVE – COHORT SCHEDULE
Cohort 1: King & Walla Walla Oct. 3rd–Oct. 21st > External Assessment Period
Nov. 1st, 9am–5pm > PQA Basics Training
Nov. 2nd, Nov. 15th > Program Self-Assessment
Nov 15th, by 6pm > Self-Assessment Scores Due in Scores Reporter
Nov. 17th, 10am–2:30pm > Planning with Data
Nov. 2nd, April 3rd > Required Weekly Coaching
Dec. 6th, 10:00am–1:00pm > 1st Learning Community Meeting
Jan. 18th, 10:00am–1:00pm > 2nd Learning Community Meeting
Mar. 7th, 10:00am–1:00pm > 3rd Learning Community Meeting
April 3rd–April 21st > Post-External Assessment Period
Cohort 2: Pierce & Spokane Oct. 3rd, Oct. 21st > External Assessment Period
Nov. 30th, 9am–5pm > PQA Basics Training
Dec. 1st, Dec. 13th > Program Self-Assessment
Dec. 13th, by 6pm > Self-Assessment Scores Due in Scores Reporter
Dec. 15th, 10am–2:30pm > Planning with Data
Dec. 1st, April 21st > Required Weekly Coaching
Jan. 26th, 10:00am–1:00pm > 1st Learning Community Meeting
Feb. 23rd, 10:00am–1:00pm > 2nd Learning Community Meeting
Mar. 23rd, 10:00am–1:00pm > 3rd Learning Community Meeting
April 3rd–April 21st > Post-External Assessment Period
Cohort 3: King & Walla Walla Oct. 3rd, Oct. 21st > External Assessment Period
Jan. 4th, 9am–5pm > PQA Basics Training
Jan. 5th, Jan. 17th > Program Self-Assessment
Jan. 17th, by 6pm > Self-Assessment Scores Due in Scores Reporter
Jan. 19th, 10am–2:30pm > Planning with Data
Jan. 5th, April 21st > Required Weekly Coaching
Feb 9th, 10:00am–1:00pm > 1st Learning Community Meeting
Mar. 8th, 10:00am–1:00pm > 2nd Learning Community Meeting
April 25th, 10:00am–1:00pm > 3rd Learning Community Meeting
April 3rd–April 21st > Post-External Assessment Period
Cohort 4: Pierce & Spokane Oct. 3rd, Oct. 21st > External Assessment Period
Jan. 31st, 9am–5pm > PQA Basics Training
Feb. 1st, Feb. 14th > Program Self-Assessment
Feb. 14th, by 6pm > Self-Assessment Scores Due in Scores Reporter
Feb. 16th, 10am–2:30pm > Planning with Data
Feb. 1st, April 21st > Required Weekly Coaching
Mar. 16th, 10:00am–1:00pm > 1st Learning Community Meeting
April 27th, 10:00am–1:00pm > 2nd Learning Community Meeting
May 25th, 10:00am–1:00pm > 3rd Learning Community Meeting
April 3rd–April 21st > Post-External Assessment Period

APPENDIX K6:
Cohort 5 Timeline

68APPENDIX
Cohort 5: King Jan 23rd–Feb 8th > External Assessment Period
Feb. 16th, Time TBD (3 hours) > PQA Basics Training
Feb 17th–Mar. 2nd > Program Self-Assessment
Mar. 2nd, by 6pm > Self-Assessment Scores Due in Scores Reporter
March 3rd, Time TBD (3 hours) > Planning with Data (Goals due March 10th)
Feb 17th–April 21st > Required Weekly Coaching
Mar. 8th, 10:00am – 1:00pm > 1st Learning Community Meeting
April 25th, 10:00am – 1:00pm > 2nd Learning Community Meeting
April 3rd–April 21st > Post-External Assessment Period
Cohort 5: Walla Walla Jan 23rd–Feb 8th > External Assessment Period
Feb. 16th, Time TBD (3 hours) > PQA Basics Training
Feb 17th–Mar. 2nd > Program Self-Assessment
Mar. 2nd, by 6pm > Self-Assessment Scores Due in Scores Reporter
March 3rd, Time TBD (3 hours) > Planning with Data
Feb 17th–April 21st > Required Weekly Coaching
Mar. 7th, 10:00am–1:00pm > 1st Learning Community Meeting
April 25th, 10:00am–1:00pm > 2nd Learning Community Meeting
April 3rd–April 21st > Post-External Assessment Period
Cohort 3: Spokane Jan 23rd–Feb 8th > External Assessment Period
Feb. 16th, Time TBD (3 hours) > PQA Basics Training
Feb 17th–Mar. 2nd > Program Self-Assessment
Mar. 2nd, by 6pm > Self-Assessment Scores Due in Scores Reporter
March 3rd, Time TBD (3 hours) > Planning with Data
Feb 17th–April 21st > Required Weekly Coaching
Mar. 16th, 10:00am–1:00pm > 1st Learning Community Meeting
April 27th, 10:00am–1:00pm > 2nd Learning Community Meeting
May 25th, 10:00am–1:00pm > 3rd Learning Community Meeting
April 3rd–April 21st > Post-External Assessment Period
OST QUALITY INITIATIVE – COHORT 5 SCHEDULE

APPENDIX L:
Weekly Coaching Fidelity Survey

70APPENDIX
ELO–Weekly Coaching Documentation
Please submit at least one coaching log per week per program you are coaching.
1. Name of Coach:
2. Date of the coaching or training session that you are filling survey for. Date: Month ______ Day ______ Year ______
3. Are you completing this survey for a coaching or training session for a specific site?
Yes
No - Meeting with Multiple Sites (e.g. attended Basics Training, Planning with Data, or a Learning Community Meeting with multiple sites)
4. Name of Program you’re completing this survey for? (Note: Select only one program per survey)
5. Type of contact (how was coaching session or training provided on the date indicated above)?
In-person Coaching or Training + Email/Phone On-line (Coaching Companion) + Email/Phone Email Only
Phone (Call or Text) only Other please specify
6. Length of coaching or training session (please enter in minutes and use numbers only).
7. Number of staff that attended the coaching or training session (enter numbers only).
8. Name of individual(s) that attend the coaching or training session).
9. Which PQA tool are you using to create item level goals for this site?
SAPQA YPQA
10. Select one SAPQA item that you and your site focused on during this coaching or training session?
If you worked on more than one SAPQA item please specify:
11. What are the specific coaching strategies you used during this coaching session?
Relationship Building Goal Setting Focused Observation
Reflection and Feedback Other (please specify)

71APPENDIX
12. How do you rate your progress with your site?
Making Progress Goal Achieved
If no progress include specific comments
13. What are specific next steps you and your coach identified?
14. Are there any changes to the program (e.g. significant change in number of students, change in staff, change in program offering)?
No
Yes (please specify)
15. Please use this field to enter any additional notes or comments about this site.
16. Select one YPQA item you and your site focused on during this coaching or training session?
If you worked on more than one yPQA item please specify
17. What are the specific coaching strategies you used during this coaching session?
Relationship Building Goal Setting Focused Observation
Reflection and Feedback Other (please specify)
18. How do you rate your progress with your site?
Making Progress Goal Achieved
If no progress include specific comments
19. What are specific next steps you and your coach identified?
20. Are there any changes to the program (e.g. significant change in number of students, change in staff, change in program offering)?
No
Yes (please specify)
21. Please use this field to enter any additional notes or comments about this site

APPENDIX M:
Sites with Stable Baseline in PQA Domains
(Single Case Design)

73APPENDIX
Figure M.1. PQA: Safe Environment Data for 3 sites from cohorts 1–3

74APPENDIX
Figure M.2. PQA: Supportive Environment Data for 4 sites from cohorts 1–4

75APPENDIX
Figure M.3: PQA: Average Interaction Data for Cohorts 1–4

76APPENDIX
Figure M.4. PQA: Interaction Data for 3 sites from Cohort 1

77APPENDIX
Figure M.5. PQA: Interaction Data for 4 sites from Cohort 2

78APPENDIX
Figure M.6. PQA: Interaction Data for 3 sites from Cohort 3

79APPENDIX

80APPENDIX
Figure M.7. PQA: Interaction Data for 4 sites from Cohort 4

81APPENDIX

82APPENDIX
Figure M.8: PQA: Average Engagement Data for Cohorts 1–4

83APPENDIX
Figure M.9. PQA: Engagement Data for 6 sites from Cohort 1

84APPENDIX

85APPENDIX
Figure M.10. PQA: Engagement Data for 3 sites from Cohort 2

86APPENDIX
Figure M.11. PQA: Engagement Data for 2 sites from Cohort 3

87APPENDIX
Figure M.12. PQA: Engagement Data for 3 sites from Cohort 4

88APPENDIX
Figure M.13. ECDC: Passive Off-Task Data for 5 sites from cohorts 1–5
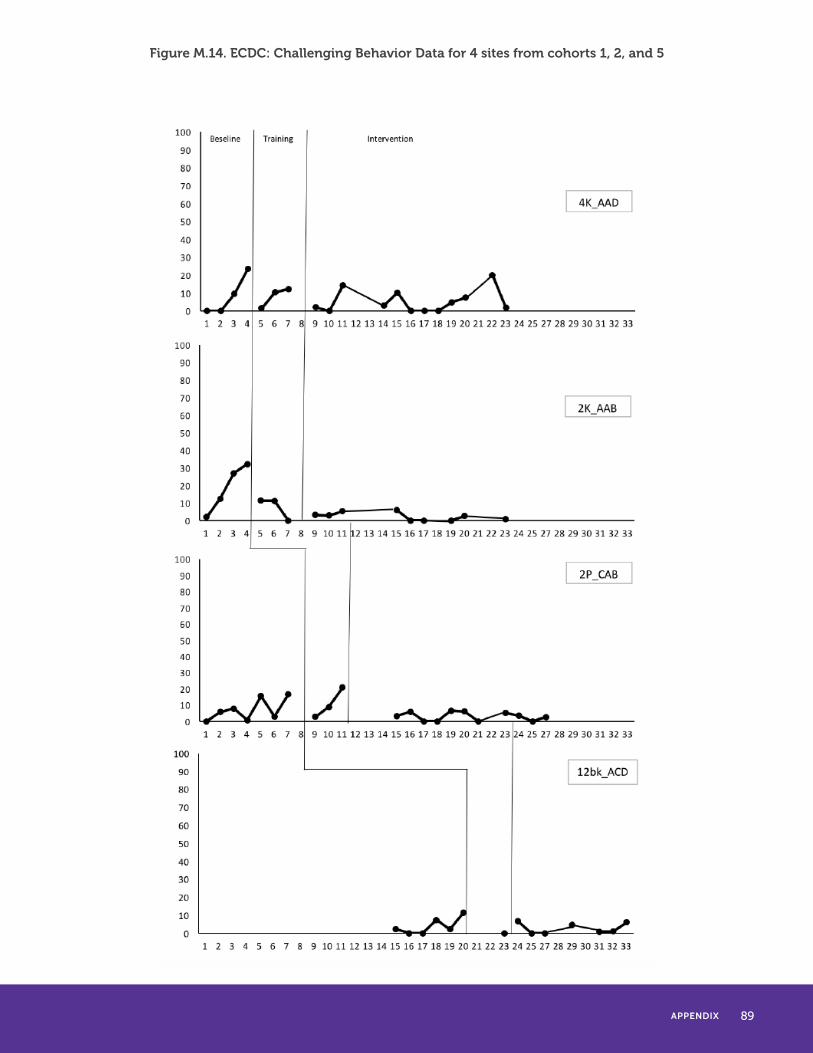
89APPENDIX
Figure M.14. ECDC: Challenging Behavior Data for 4 sites from cohorts 1, 2, and 5

APPENDIX N:
Quality Seal and PQA Pre-to-Post Comparison

91APPENDIX
Table N.1 Item Level Quality Seal Pre and Post Comparison
Table N.1 Item Level Quality Seal Pre and Post Comparison
M SD SE Lower Upper t df p Pair 1 aSelfRegulationManagingEmotions - aSelfRegulationManagingEmotions_pre 0.122 0.67 0.1 -0.07 0.3136 1.3 48 0.204 Pair 2 bEmpathyandCompassion - bEmpathyandCompassion_pre -0.35 0.9 0.13 -0.61 -0.0877 -3 48 0.01 Pair 3 cLackofBias - cLackofBias_pre 0.306 0.71 0.1 0.101 0.5109 3 48 0.004 Pair 4 dRedirection - dRedirection_pre -0.59 1.29 0.19 -0.97 -0.2032 -3 45 0.004 Pair 5 eEngagementAct - EngagementAct_pre 0.02 0.59 0.09 -0.15 0.1912 0.2 48 0.811 Pair 6 fPersistence - fPersistence_pre -0.06 0.85 0.12 -0.31 0.1834 -1 48 0.617 Pair 7 gSkillBuilding - gSkillBuilding_pre -0.31 1.26 0.18 -0.67 0.0563 -2 48 0.096 Pair 8 hReflection - hReflection_pre 0.204 1.53 0.22 -0.23 0.6428 0.9 48 0.354 Pair 9 iYouthLeadership - iYouthLeadership_pre -0.08 1.1 0.16 -0.4 0.2332 -1 48 0.605 Pair 10 aEmotionalClimate - aEmotionalClimate_pre -0.04 0.61 0.09 -0.22 0.1347 -0 48 0.642 Pair 11 bAdultChildInteractions - bAdultChildInteractions_pre 0.347 0.95 0.14 0.075 0.6191 2.6 48 0.014 Pair 12 cSenseofBelonging - cSenseofBelonging_pre -0.45 0.94 0.13 -0.72 -0.1799 -3 48 0.002 Pair 13 dCollaboration - dCollaboration_pre 0.184 1.15 0.16 -0.15 0.5136 1.1 48 0.269 Pair 14 eAcknowledgment - eAcknowledgment_pre 0.286 0.89 0.13 0.03 0.5413 2.2 48 0.029 Pair 15 fConflictResolution - fConflictResolution_pre 0.042 0.68 0.1 -0.16 0.24 0.4 47 0.674 Pair 16 aLearningObjectives - aLearningObjectives_pre 0.204 1.19 0.17 -0.14 0.5459 1.2 48 0.236 Pair 17 bLessonPlans - bLessonPlans_pre 0 0.87 0.12 -0.25 0.2488 0 48 1 Pair 18 cCommunicationofObjectives - cCommunicationofObjectives_pre -0.19 0.98 0.14 -0.47 0.0976 -1 47 0.192 Pair 19 dTeachingStrategies - dTeachingStrategies_pre -0.08 0.68 0.1 -0.28 0.1138 -1 47 0.399 Pair 20 eConnectiontoPriorKnowledge - eConnectiontoPriorKnowledge_pre -0.16 1.25 0.18 -0.52 0.195 -1 48 0.364 Pair 21 fChoiceltstronggtoriginalltstronggt - fChoiceltstronggtoriginalltstronggt_pre 0.327 0.8 0.11 0.097 0.5565 2.9 48 0.006 Pair 22 gTangibleOutcomes - gTangibleOutcomes_pre 0.245 1.05 0.15 -0.06 0.5469 1.6 48 0.11 Pair 23 hFeedback - hFeedback_pre 0.469 1.44 0.21 0.054 0.8844 2.3 48 0.027 Pair 24 aCommonVision - aCommonVision_pre 0.122 1.01 0.14 -0.17 0.4134 0.8 48 0.402 Pair 25 bContinuousImprovement - bContinuousImprovement_pre 0.122 1.07 0.15 -0.19 0.4307 0.8 48 0.428 Pair 26 cCulturalCompetencyTraining - cCulturalCompetencyTraining_pre 0.102 1.1 0.16 -0.22 0.4191 0.6 48 0.521 Pair 27 dProfessionalDevelopment - dProfessionalDevelopment_pre -0.2 0.87 0.12 -0.45 0.0445 -2 48 0.105 Pair 28 eDataManagement - eDataManagement_pre -0.12 1.35 0.19 -0.51 0.2648 -1 48 0.528 Pair 29 aYouthandFamilyInput - aYouthandFamilyInput_pre 0.163 0.85 0.12 -0.08 0.4075 1.3 48 0.185 Pair 30 bCommunicationwithFamilies - bCommunicationwithFamilies_pre -0.02 0.9 0.13 -0.28 0.2384 -0 48 0.875 Pair 31 cCommunicationwithSchools - cCommunicationwithSchools_pre -0.29 0.79 0.11 -0.51 -0.0586 -3 48 0.015 Pair 32 dCommunityPartnership - dCommunityPartnership_pre 0.082 1.1 0.16 -0.23 0.3965 0.5 48 0.605

92APPENDIX
Table N.2: Domain Level Quality Seal and PQA Pre and Post Comparison
Table N.3: Domain Level Quality Seal and PQA Pre and Post Comparison (High Quality Videos Only)
Table N.2: Domain Level Quality Seal and PQA Pre and Post Comparison
M SD SE Lower Upper t df p Pair 1 Post_socialemotionQ - Pre_socialemotionQ -0.08 0.48 0.07 -0.21 0.06 ### 48 0.28 Pair 2 Post_relationshipQ - Pre_relationship 0.06 0.42 0.06 -0.05 0.18 1.09 48 0.28 Pair 3 Post_programofferingQ - Pre_programofferingQ 0.10 0.57 0.08 -0.07 0.26 1.17 48 0.25 Pair 4 Post_assessmentQ - Pre_assessmentQ 0.00 0.68 0.10 -0.19 0.20 0.04 48 0.97 Pair 5 Post_familyQ - Pre_familyQ -0.02 0.55 0.08 -0.17 0.14 ### 48 0.85 Pair 6 Post_Qseal - Pre_Qseal 0.01 0.35 0.05 -0.09 0.11 0.30 48 0.77 Pair 7 PostSafeEnvironment - PreSafeEnvironment 0.19 0.33 0.06 0.08 0.31 3.46 33 0.002 Pair 8 PostSupportEnvironment - PreSupportEnvironment 0.06 0.65 0.11 -0.16 0.29 0.57 33 0.571 Pair 9 PostInteraction - PreInteraction 0.24 1.00 0.17 -0.11 0.59 1.41 33 0.167 Pair 10 PostEngagement - PreEngagement 0.43 1.09 0.19 0.05 0.81 2.33 33 0.026 Pair 11 PostPQAfinal - PrePQAfinal 0.23 0.57 0.10 0.03 0.43 2.38 33 0.023 Pair 12 Post_F1_Q - Pre_F1_Q 0.09 0.50 0.07 -0.06 0.23 1.20 48 0.235 Pair 13 Post_F2_Q - Pre_F2_Q -0.08 0.62 0.09 -0.26 0.10 ### 48 0.369 Pair 14 Post_F3_Q - Pre_F3_Q -0.13 0.51 0.07 -0.27 0.02 ### 48 0.085 Pair 15 Post_F4_Q - Pre_F4_Q 0.10 0.44 0.06 -0.02 0.23 1.62 48 0.113 Pair 16 Post_Q_F - Pre_Q_F 0.00 0.30 0.04 -0.09 0.08 ### 48 0.913
Table N.3: Domain Level Quality Seal and PQA Pre and Post Comparison (High Quality Videos Only)
M SD SE Lower Upper t df p
Pair 1 Post_socialemotionQ - Pre_socialemotionQ -0.11 0.49 0.08 -0.28 0.06 -1.32 33 0.197 Pair 2 Post_relationshipQ - Pre_relationship 0.08 0.38 0.06 -0.05 0.21 1.24 33 0.224 Pair 3 Post_programofferingQ - Pre_programofferingQ 0.05 0.71 0.12 -0.19 0.30 0.44 33 0.662 Pair 4 Post_assessmentQ - Pre_assessmentQ -0.01 0.61 0.11 -0.22 0.21 -0.06 33 0.956 Pair 5 Post_familyQ - Pre_familyQ -0.02 0.49 0.08 -0.19 0.15 -0.26 33 0.795 Pair 6 Post_Qseal - Pre_Qseal 0.00 0.35 0.06 -0.12 0.12 -0.02 33 0.986

93APPENDIX
Table N.4: Change in State of Quality (QS)Table N.4: Change in State of Quality (QS)
Dependent variable:
QS change
(1) (2) (3) (4)
QS centered −0.361∗∗∗ −0.342∗∗∗ −0.336∗∗∗ −0.367∗∗∗
Goal Setting (0.045) (0.047) (0.054) (0.051) −0.006 (0.006)
Relationship Building 0.005 (0.006)
Providing Feedback −0.011∗∗
(0.005)
Focused Observation 0.014∗∗
(0.006) coaching sessions 0.001
(0.004) unused coaching 0.0001
(0.004) weeks treated 0.002
(0.004) video not submitted or poor quality 0.005
(0.004) Academic 0.030
(0.051) Recreational 0.024
(0.039)
Center.Based 0.060∗
(0.033) Specialized 0.008
(0.039) InPerson
−0.003 (0.004)
EmailPhone Only 0.002 (0.005)
Online Coaching Companion 0.011 (0.010)
Other 0.020 (0.053)
Constant 0.013 −0.083 −0.034 0.007
(0.031) (0.132) (0.031) (0.035)
Observations 39 39 39 39 R2 0.669 0.633 0.649 0.624
Note: ∗p<0.1; ∗∗p<0.05; ∗∗∗p<0.01
Adjusted R2 0.577 0.596 0.567 Residual Std. Error (df = 33) 0.095 0.093 0.096 F Statistic (df = 5; 33)

94APPENDIX
Table N.5: Change in State of Quality (PQA)
Table N.5: Change in State of Quality (PQA) Dependent variable:
PQA change
(1) (2) (3) (4)
PQA centered −0.186∗∗∗ −0.196∗∗∗ −0.166∗∗∗ −0.171∗∗∗
Goal Setting (0.053) (0.055) (0.058) (0.058) −0.014 (0.008)
Relationship Building 0.0002 (0.009)
Providing Feedback −0.010 (0.008)
Focused Observation 0.027∗∗∗
(0.009) coaching sessions
unused coaching
−0.002 (0.006) −0.006 (0.006)
weeks treated 0.010 (0.007)
video not submitted or poor quality 0.005 (0.006)
Academic 0.056 (0.081)
Recreational 0.009 (0.059)
Center.Based 0.090∗
(0.051) Specialized −0.025
(0.055)
InPerson 0.00003 (0.006)
EmailPhone Only 0.009 (0.008)
Online Coaching Companion 0.011 (0.015)
Other 0.092 (0.084)
Constant 0.064 −0.044 0.020 0.019 (0.048) (0.199) (0.048) (0.054)
Observations 39 39 39 39 R2 0.393 0.337 0.319 0.284
Note: ∗p<0.1; ∗∗p<0.05; ∗∗∗p<
Adjusted R2 0.216 0.175 Residual Std. Error (df = 33) 0.136 0.145 0.148 F Statistic (df = 5; 33)

APPENDIX O:
Program Focus Group Questions

96APPENDIX
Expanded Learning Opportunity (ELO) Quality Initiative Focus Groups with ELO Providers
Goal of Focus GroupThe University of Washington (UW) and School’s Out Washington (SOWA) would like to offer the optimal opportunity for a successful continuous quality improvement process. While we engage in our study, we want to connect with you to learn about the way you think programs can best be supported and how we might amend the continuous quality improvement process underway. We have a series of questions we would like to ask you and we are going to film this focus group so we can capture your thoughts and ideas. If you have other information to provide outside the questions we want to hear that as well.
Icebreaker/Conversation starter question• If you were in charge of a professional development session and there were no restrictions (e.g. financial), what
would be your ideal approach, what would it look like?
• What would be your ideal continuous quality improvement approach?
General questions about your work in your ELO programs• In terms of program staff would you rate yourself as a novice, beginner, intermediate or advanced. How did you
come up with that rating?
• What are the biggest challenges you face to providing high quality programming?
• What would you like to get better at? And what does your ideal support look like to help you get better?
• What have been the most helpful in providing high quality programming?
Specific questions within the ELO quality improvement study• Describe a typical coaching session?
• How do you feel when the coach leaves?
• What is going well with the intervention and what’s missing, or needed.
• What do you find most challenging about the intervention, and how would you change it if you could?
• What outcomes or changes are you seeing in your practices and the practices of your staff?
• What outcomes or changes are you seeing in the children/youth that are participating in your program?
Additional program level insight• Since Participating Have you made any structural or programmatic level changes that has allowed you to achieve
your goal? If so what were those changes?
• Are there any structural or program level changes that you wish you could make but are not able to? Why or why not?
APPENDIX P:
Coach Focus Group Questions

98APPENDIX
Expanded Learning Opportunity (ELO) Quality Initiative Focus Groups with ELO Coaches
Goal of Focus GroupThe University of Washington (UW) and School’s Out Washington (SOWA) would like to offer the optimal opportunity for a successful continuous quality improvement process. While we engage in our study, we want to learn from you about ways you think programs can best be supported and how we might amend the continuous quality improvement process underway. We have a series of questions we would like to ask you and we are going to film this focus group so we can capture your thoughts and ideas. If you have other information to provide outside the questions we want to hear that as well.
General questions about your coaching• How would you rate yourself as a coach: novice, beginner, intermediate or advanced? How did you come up with
that rating?
• What has been the most helpful in helping you provide high quality coaching intervention?
• What has been a challenge for you in providing high quality coaching intervention?
• What would you like to get better at? And what does your ideal support look like to help you get better?
Coaching Practice• Has your coaching practice changed during this pilot? If so, how?
• How has your participation in the pilot impacted your coaching? Specifically, what aspects of the pilot had contribut-ed to that impact (e.g. coaching companion, frequent contact with program, all coaches meeting, receiving data on a regular basis…)
Insight about programs• If you’re coaching more than one site, what are some similarities or differences you see between the
• various sites you’re coaching?
• From the sites that you’re coaching where things are going smoothly and you see programs improving,
• What would you say are the key elements that contributed to the programs growth and improvement?
• For the sites that you’re coaching where there are challenges and the program is not improving, what
• Would you say are the key elements that are contributing to the challenge?
Specific questions within the ELO quality improvement study• Describe a typical coaching session?
• How do you feel at the end of a coaching session?
• What is going well with your programs and what’s missing, or needed?
• What do you find most challenging about the intervention, and how would you change it if you could?
• What outcomes or changes are you seeing in your programs and the practices of staff?
• What outcomes or changes are you seeing in the children/youth that are participating in the program?
Recommendation for Professional Development• What would you recommend as a next step for the sites in the pilot?
• What would be your ideal continuous quality improvement approach?

99APPENDIX
Table Q.4: Post-Assessment Spearman’s rho Correlations between Quality Seal (based on factor analysis) and the PQA
Table Q.3 Post-Assessment Spearman’s rho Correlations between Quality Seal and PQA
Table Q.5: Correlations between Post-Assessment Quality Seal and PQA
Table Q.3 Post-Assessment Spearman’s rho Correlations between Quality Seal and PQA
1 2 3 4 5 6 7 8 9 10 11 Post_socialemotionQ 1 Post_relationshipQ .422** 1 Post_programoffering .521** .471** 1 Post_assessmentQ 0.067 -0.093 0.073 1 Post_familyQ 0.12 0.253 0.154 .339* 1 PostSafeEnvironment 0.002 0.159 -0.163 -.320* -0.243 1 PostSupportEnvironme 0.155 0.22 0.079 -0.127 0.183 0.099 1 PostInteraction -0.023 .305* 0.138 -0.175 0.174 0.262 .614** 1 PostEngagement -0.068 0.181 0.145 -0.12 0.053 0.204 .462** .710** 1 Post_Qseal .567** .551** .622** .595** .646** -0.26 0.091 0.078 0.02 1 PostPQAfinal -0.009 0.229 0.086 -0.178 0.05 .328* .698** .884** .906** -0.011 1 ** Correlation is significant at the 0.01 level (2-tailed). * Correlation is significant at the 0.05 level (2-tailed).
Table Q.4: Post-Assessment Spearman’s rho Correlations between Quality Seal (based on factor analysis) and the PQA
1 2 3 4 5 6 7 8 9 10 Post_F1_Q 1 Post_F2_Q -0.146 1 Post_F3_Q 0.1 0.112 1 Post_F4_Q -0.174 -0.04 0.115 1 PostSafeEnvironment -0.057 .298* -0.146 0.042 1 PostSupportEnvironme 0.08 0.103 0.007 0.155 0.13 1 PostInteraction 0.123 0.226 0.292 0.073 0.268 .622** 1 PostEngagement 0.074 0.108 0.121 -0.019 0.24 .450** .716** 1 Post_Qseal_F .379** .424** .725** .403** 0.063 0.181 .369* 0.164 1 PostPQAfinal 0.068 0.217 0.126 0.029 .356* .701** .888** .904** 0.236 1 ** Correlation is significant at the 0.01 level (2-tailed). * Correlation is significant at the 0.05 level (2-tailed).
Table Q.5: Correlations between Post-Assessment Quality Seal and PQA
Correlations
1 2 3 RevisedQSeal Post_Qseal 1
.921**
1
PostPQAfinal 0.111 0.026 1 ** Correlation is significant at the 0.01 level (2-tailed).

APPENDIX Q:
Convergent Validity Between PQA and Quality Seal
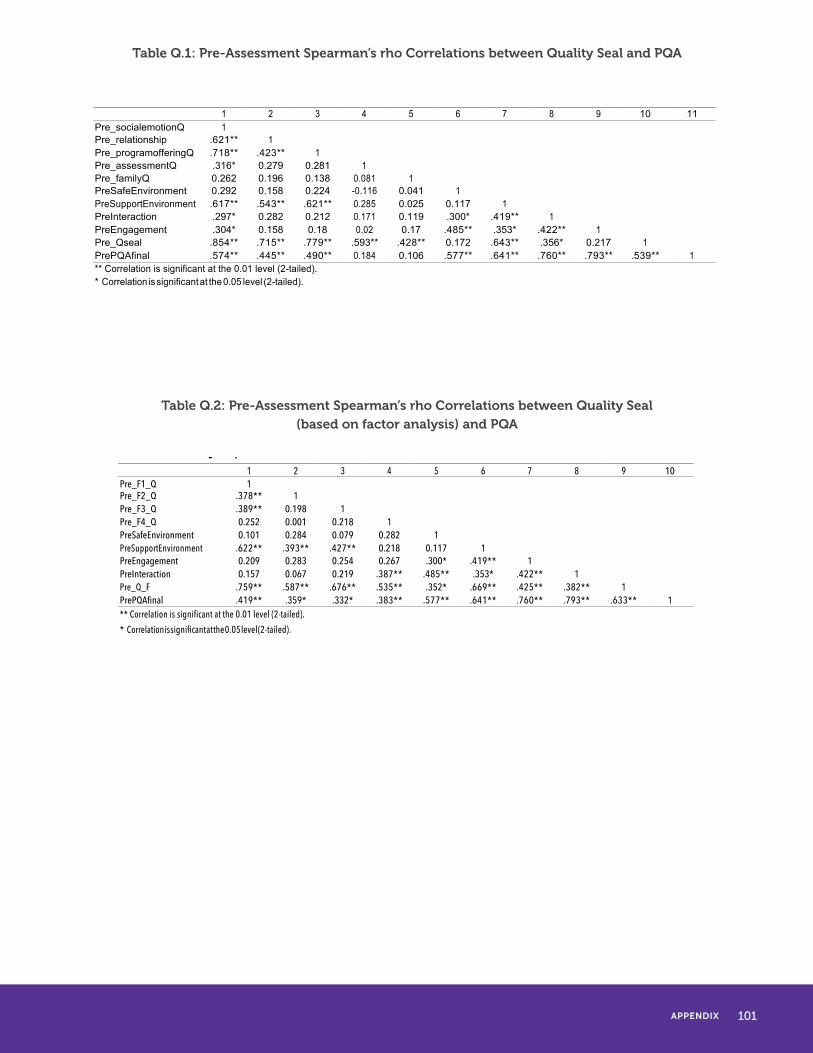
101APPENDIX
Table Q.1: Pre-Assessment Spearman’s rho Correlations between Quality Seal and PQA
Table Q.2: Pre-Assessment Spearman’s rho Correlations between Quality Seal (based on factor analysis) and PQA
Table Q.1: Pre-Assessment Spearman’s rho Correlations between Quality Seal and PQA
1 2 3 4 5 6 7 8 9 10 11 Pre_socialemotionQ 1 Pre_relationship .621** 1 Pre_programofferingQ .718** .423** 1 Pre_assessmentQ .316* 0.279 0.281 1 Pre_familyQ 0.262 0.196 0.138 0.081 1 PreSafeEnvironment 0.292 0.158 0.224 -0.116 0.041 1 PreSupportEnvironment .617** .543** .621** 0.285 0.025 0.117 1 PreInteraction .297* 0.282 0.212 0.171 0.119 .300* .419** 1 PreEngagement .304* 0.158 0.18 0.02 0.17 .485** .353* .422** 1 Pre_Qseal .854** .715** .779** .593** .428** 0.172 .643** .356* 0.217 1 PrePQAfinal .574** .445** .490** 0.184 0.106 .577** .641** .760** .793** .539** 1 ** Correlation is significant at the 0.01 level (2-tailed). * Correlation is significant at the 0.05 level (2-tailed).
Table Q.2: Pre-Assessment Spearman’s rho Correlations between Quality Seal (based on factor analysis) and PQA 1 2 3 4 5 6 7 8 9 10 Pre_F1_Q 1 Pre_F2_Q .378** 1 Pre_F3_Q .389** 0.198 1 Pre_F4_Q 0.252 0.001 0.218 1 PreSafeEnvironment 0.101 0.284 0.079 0.282 1 PreSupportEnvironment .622** .393** .427** 0.218 0.117 1 PreEngagement 0.209 0.283 0.254 0.267 .300* .419** 1 PreInteraction 0.157 0.067 0.219 .387** .485** .353* .422** 1 Pre_Q_F .759** .587** .676** .535** .352* .669** .425** .382** 1 PrePQAfinal .419** .359* .332* .383** .577** .641** .760** .793** .633** 1 ** Correlation is significant at the 0.01 level (2-tailed).
* Correlation is significant at the 0.05 level (2-tailed).