Embed Size (px)
Citation preview
Quality improvement
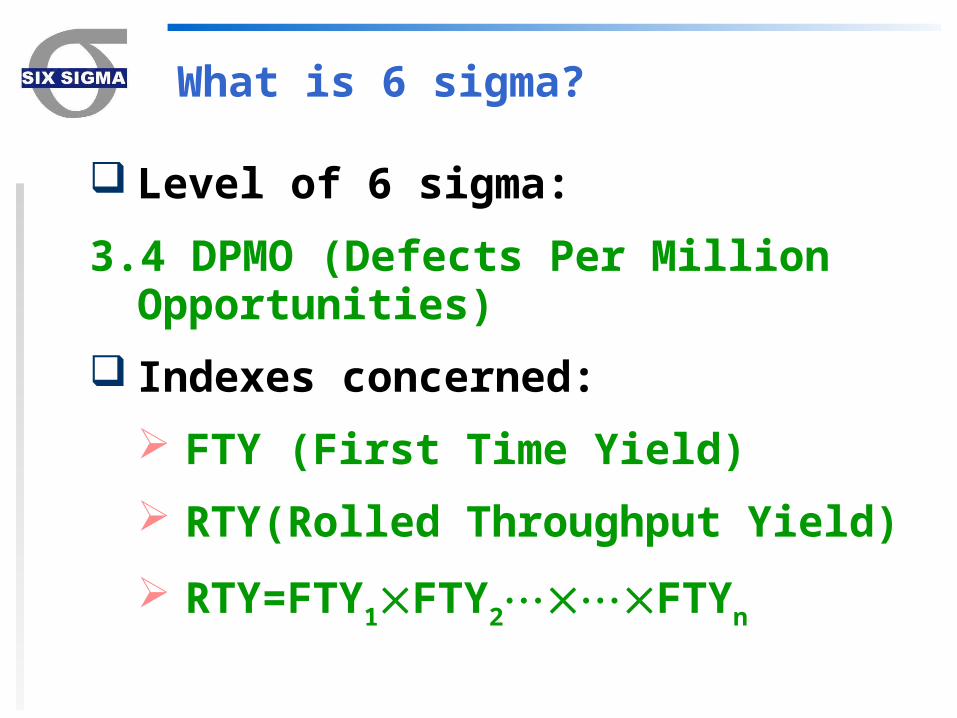
What is 6 sigma?
Level of 6 sigma:
3.4 DPMO (Defects Per Million Opportunities)
Indexes concerned:
FTY (First Time Yield)
RTY(Rolled Throughput Yield)
RTY=FTY1FTY2FTYn
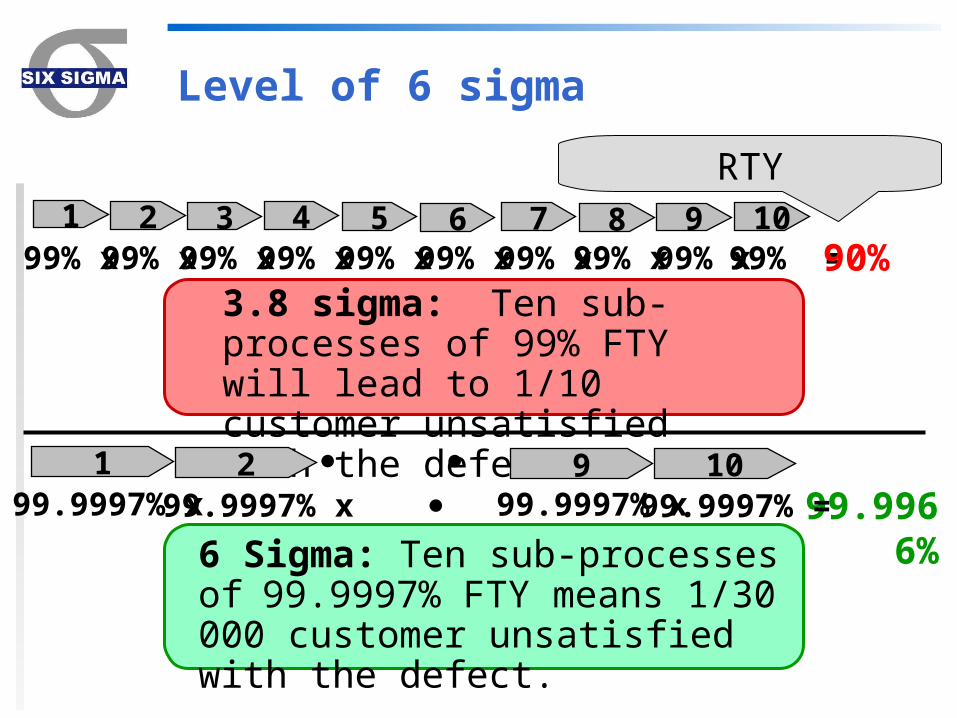
Level of 6 sigma
3.8 sigma: Ten sub-processes of 99% FTY will lead to 1/10 customer unsatisfied with the defect.
1 32 4 65 7 8 9 1099% x 99% x99% x 99% x 99% x99% x 99% x99% x 99% x 99% =90%
6 Sigma: Ten sub-processes of 99.9997% FTY means 1/30000 customer unsatisfied with the defect.
1 299.9997% x 99.9997% x 99.9966%
9 1099.9997% x99.9997% =
RTY
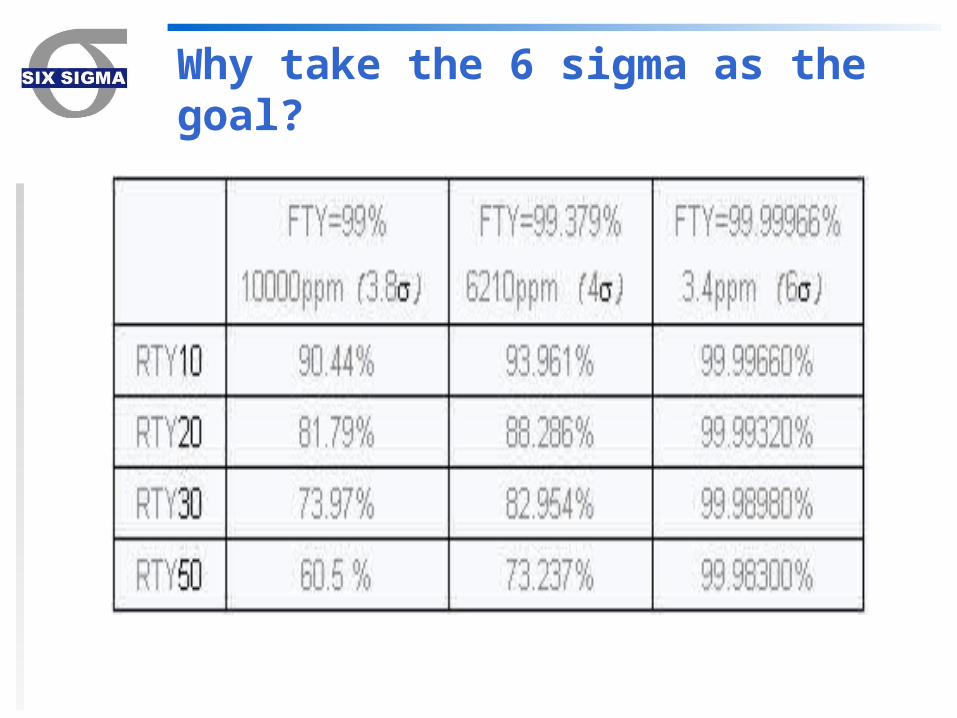
Why take the 6 sigma as the goal?
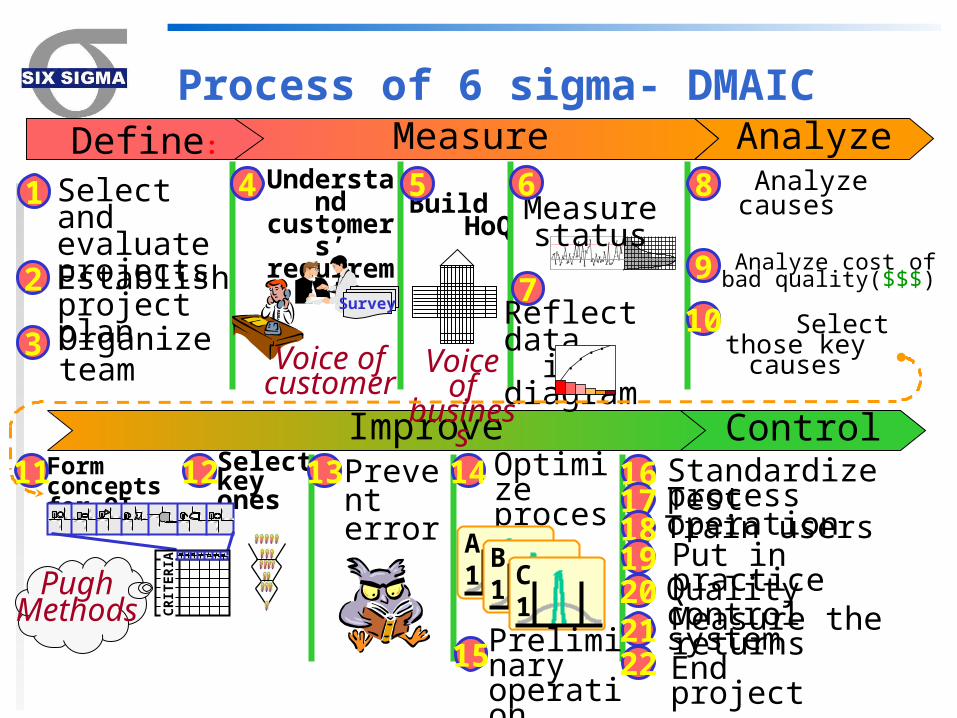
Process of 6 sigma- DMAIC
End project
Improve Control
Build HoQ
Voice of business
Prevent error
Form concepts for QI
Select key ones
CR
ITER
IA
PughMethods
Optimize process
A1B1C1
AnalyzeMeasureDefine:
Reflect data in diagram
. . . .
Standardize process
1 Select and evaluate projectsEstablish project planOrganize team
2
Analyze causes
Voice of customer
Understand customers’
requirements
Test operationTrain usersPut in practiceQuality control systemMeasure the returns
3
4
Survey
Measurestatus
6
7
5
Analyze cost of bad quality($$$)
Select those key causes
8
9
10
11 12 13 14
15
16171819202122
Preliminary operation
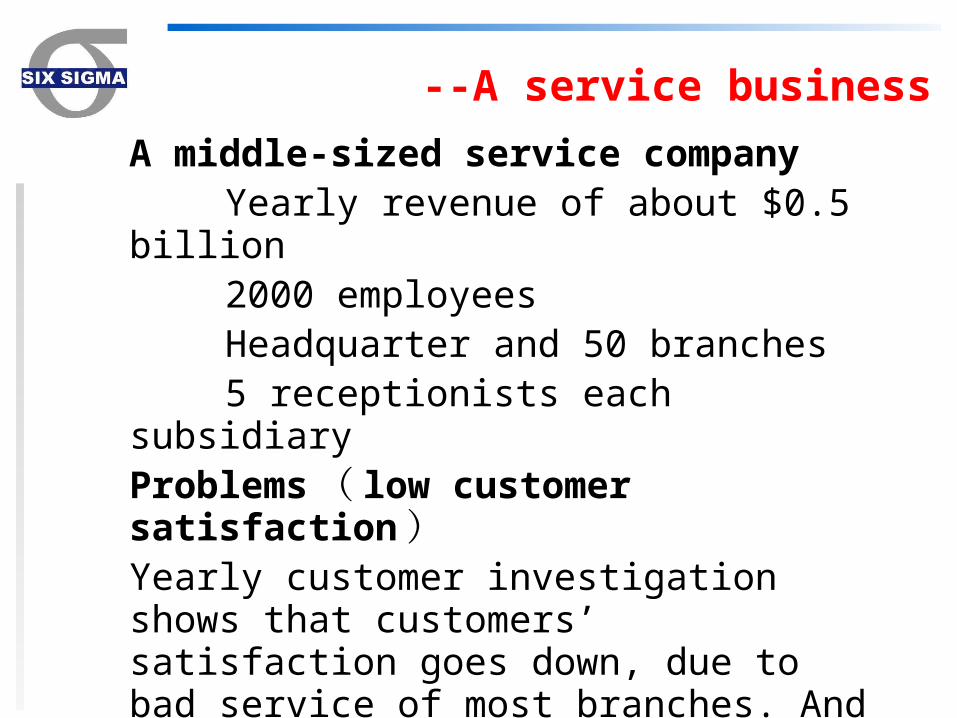
--A service business
A middle-sized service companyYearly revenue of about $0.5 billion2000 employeesHeadquarter and 50 branches5 receptionists each subsidiary
Problems ( low customer satisfaction )Yearly customer investigation shows that customers’ satisfaction goes down, due to bad service of most branches. And complaints are focused on long waiting time.
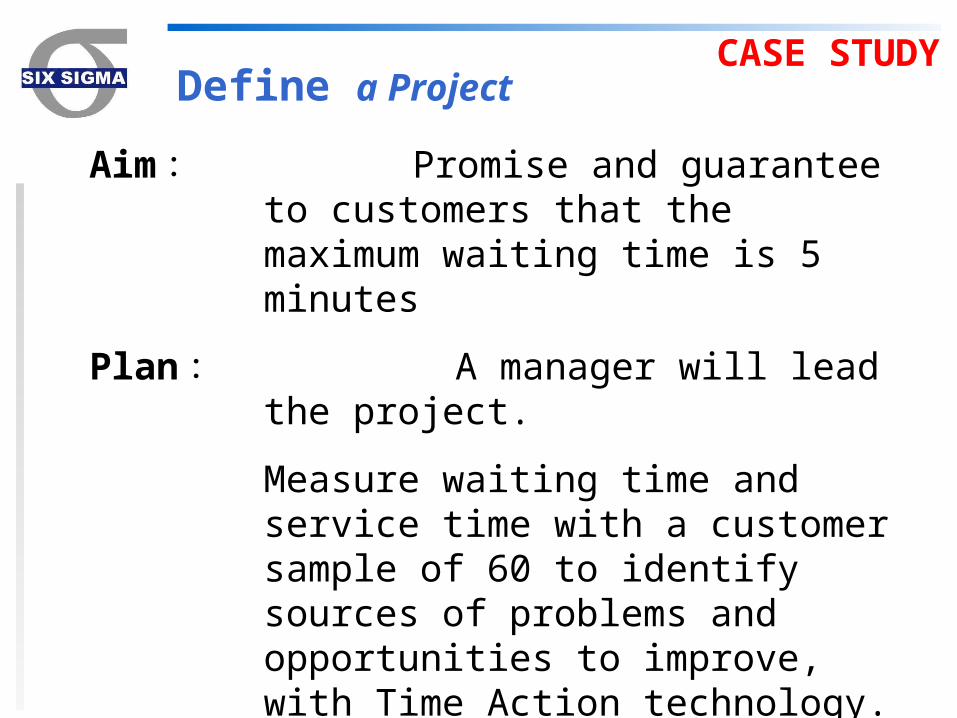
Define a Project
Aim : Promise and guarantee to customers that the maximum waiting time is 5 minutes
Plan : A manager will lead the project.
Measure waiting time and service time with a customer sample of 60 to identify sources of problems and opportunities to improve, with Time Action technology.
Team : The manager (Green Belt) and four recorders
CASE STUDY
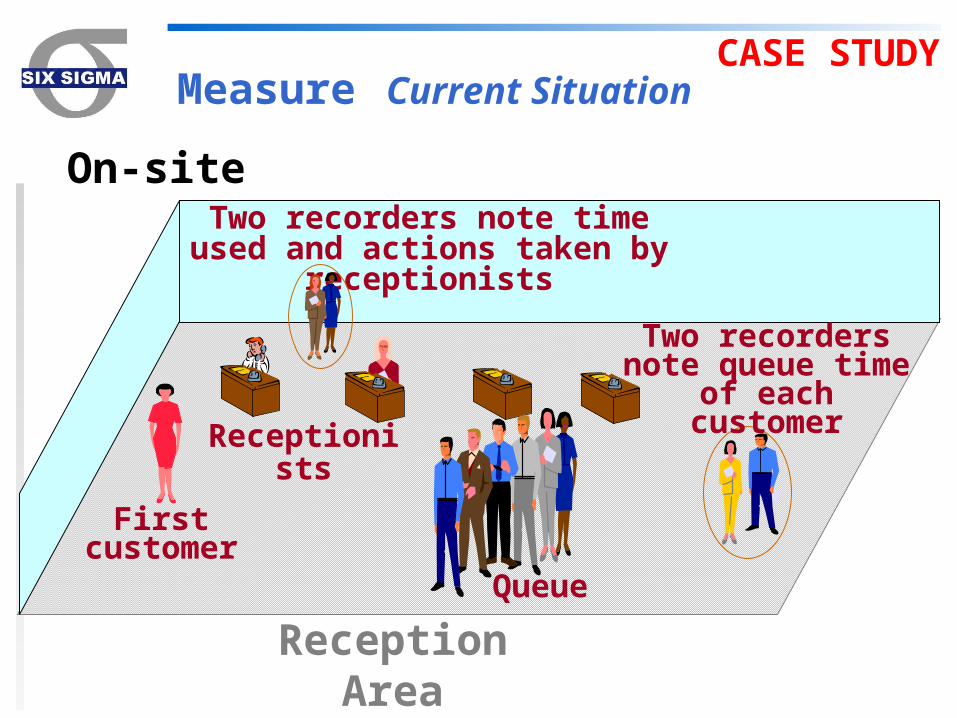
Measure Current Situation
Reception Area
First customer
Two recorders note time used and actions taken by receptionists
Two recorders note queue time of each
customerReceptionists
Queue
On-site
CASE STUDY
Measure Current Situation
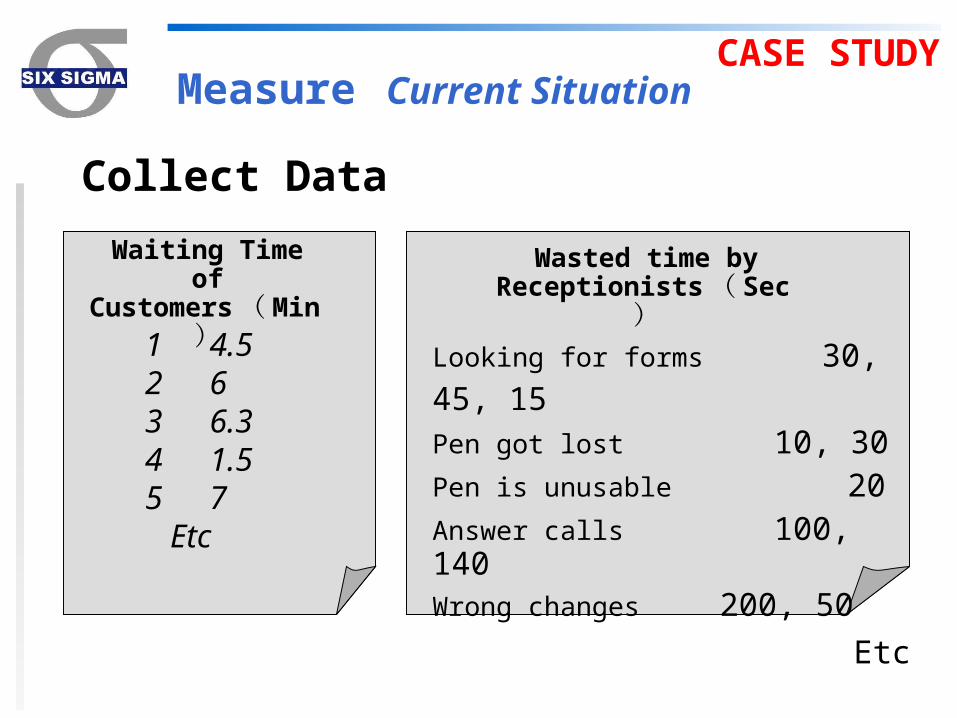
Collect Data
Waiting Time of Customers ( Min )
1 4.52 63 6.34 1.55 7 Etc
Wasted time by Receptionists( Sec )
Looking for forms 30, 45, 15Pen got lost 10, 30Pen is unusable 20Answer calls 100, 140Wrong changes 200, 50
Etc
CASE STUDY
Measure Current SituationCASE
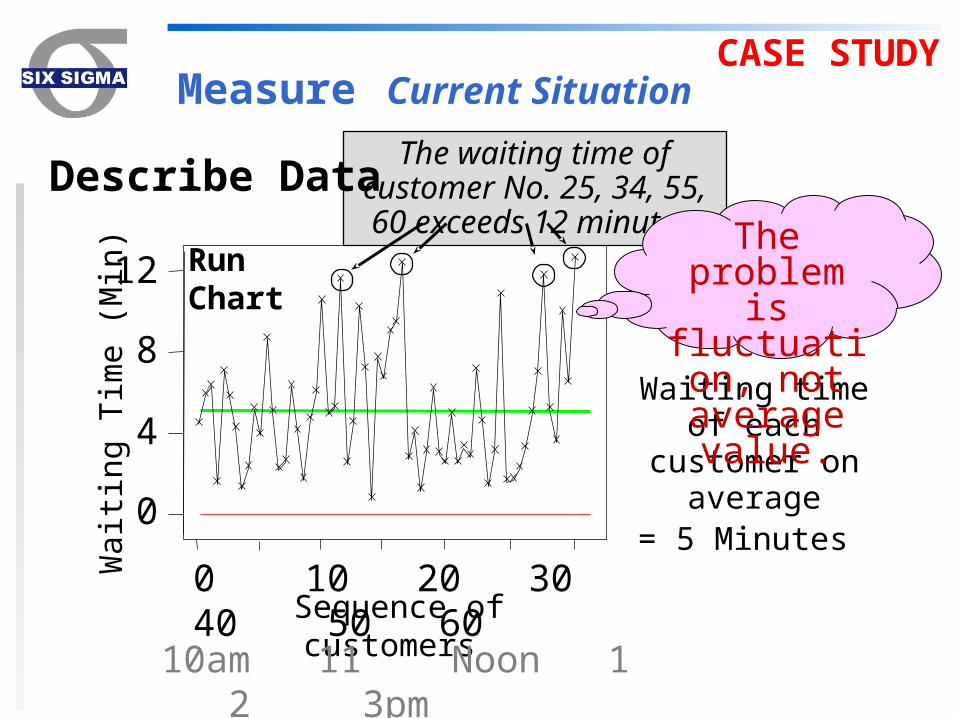
STUDYThe waiting time of customer
No. 25, 34, 55, 60 exceeds 12 minutes.
Sequence of customers
0
4
8
12
Wai
ting
Tim
e (M
in)
Waiting time of each customer on average
= 5 Minutes
Describe Data
10am 11 Noon 1 2 3pm
0 10 20 30 40 50 60
Run ChartThe problem is fluctuation, not average value.
Analyze Current Process
• Usually, process measurement can provide large amount of analysis proofs.
• Run Chart shows that the main problem is the large fluctuation with the average service time of 5 minutes.
• Time and Action Measurement identifies the specific sources of fluctuation.
CASE STUDY
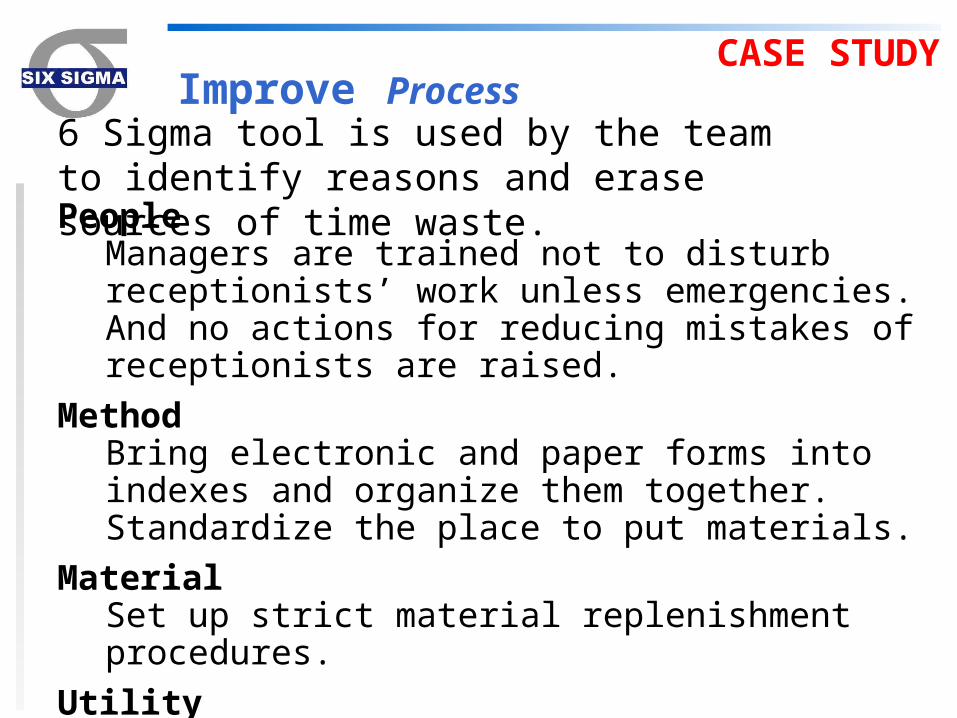
Improve Process6 Sigma tool is used by the team to identify reasons and erase sources of time waste.People
Managers are trained not to disturb receptionists’ work unless emergencies. And no actions for reducing mistakes of receptionists are raised.
MethodBring electronic and paper forms into indexes and organize them together. Standardize the place to put materials.
MaterialSet up strict material replenishment procedures.
UtilityEstablish daily maintenance plan.
CASE STUDY
Improve Process
• Conduct test run of the improved process with same measurement method
• Record data of 60 customers in 3 hours, not in 5 hours.
• Record results
CASE STUDY
Improve ProcessW
aitin
g Ti
me
(Min
)
0 10 20 30 40 50 60Sequence of customers
0
4
8
12
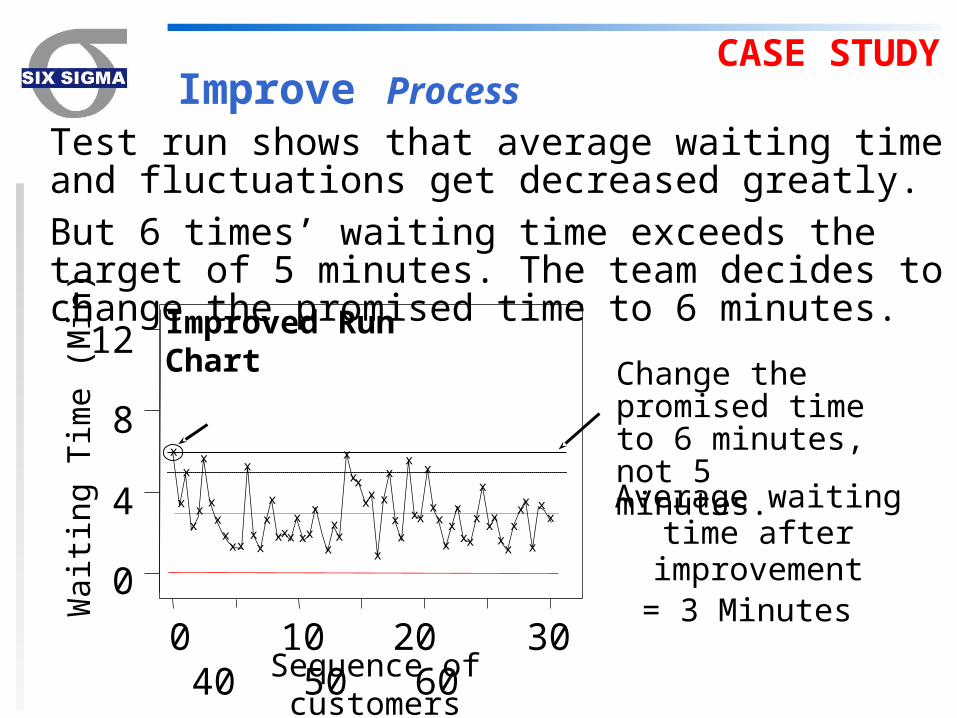
Average waiting time after improvement= 3 Minutes
Change the promised time to 6 minutes, not 5 minutes.
Improved Run Chart
x
xx x x x
x
x
x
x
x
xx
xx
x
x
xx
xx
x
x
x
x x
x
x
x
x
x
x
x
x
xx
x
x
x
xx
x
xx
x
xx
xx
x
x
xx
xxxx x
x
Test run shows that average waiting time and fluctuations get decreased greatly.But 6 times’ waiting time exceeds the target of 5 minutes. The team decides to change the promised time to 6 minutes.
CASE STUDY
Improve Process
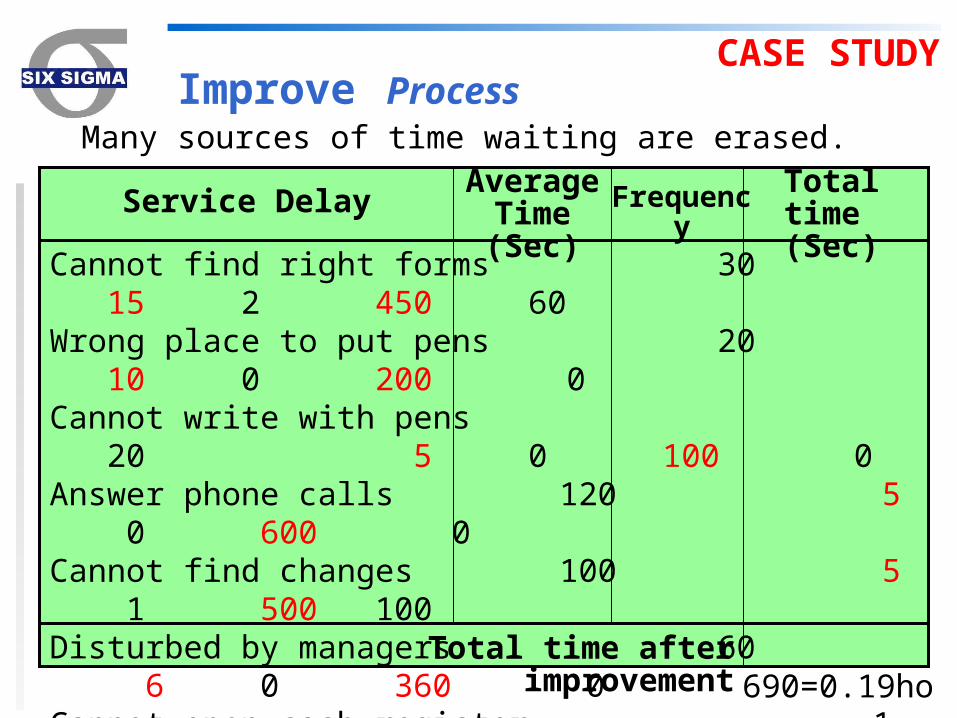
Cannot find right forms 30 15 2 450 60Wrong place to put pens 20 10 0 200 0Cannot write with pens 20 5 0 100 0Answer phone calls 120 5 0 600 0Cannot find changes 100 5 1 500 100Disturbed by managers 60 6 0 360 0Cannot open cash register 180 2 0 360 0Mistake the amount of money 50 7 7 350 350Paper out in printer 300 2 0 600 0Input error 15 12 12 180 180
Service DelayAverage
Time (Sec)Total time
(Sec)Frequency
Total time after improvement 690=0.19hour
Many sources of time waiting are erased.
CASE STUDY
Improve Process
The promotion of customer satisfaction helps the
rise of business. In the following years, real
revenue is 5 million USD higher than expected.
CASE STUDY
Control Process
Keep the gains! Get more economic income!• Periodically sample and record waiting time• If waiting time rises, repeat time and action
observations to identify potential sources of problems
Try to solve problems once they appear
CASE STUDY
DU Xue-mei: [email protected]


![Six Sigma (6 Sigma)[1]](https://img.pdfslide.us/doc/110x75/577d35cc1a28ab3a6b91711a/six-sigma-6-sigma1.jpg)