Embed Size (px)
Citation preview
Quality Improvement Plan (QIP) Narrative for Health Care Organizations in Ontario
3/28/2014 This document is intended to provide health care organizations in Ontario with guidance as to how they can develop a quality improvement plan. While much effort and care has gone into preparing this document, this document should not be relied on as legal advice and organizations should consult with their legal, governance and other relevant advisors as appropriate in preparing their quality improvement plans. Furthermore, organizations are free to design their own public quality improvement plans using alternative formats and contents, provided that they submit a version of their quality improvement plan to HQO (if required) in the format described herein.
1
Overview
Groves Memorial Community Hospital (GMCH) is a dynamic organization committed to the delivery of high quality health care to the community through collaboration with our rural health care partners. Our just culture focused on continuous quality improvement strives to improve the patient experience through responsive, accountable, transparent, integrated rural health care with the local Family Health Teams, WWCCAC, WWD CMHA, North Wellington Health Care, Community Services, Homewood Health Center and the WWLHIN.
GMCH over the past year completed a strategic planning process with North Wellington Health Care to establish the new strategic directions for 2013-2016. The joint mission for the two corporations is: Caring together for healthier Rural Wellington residents and the joint vision is Quality Care, Close to Home. The four strategic pillars are Advancing Best Patient Care, Realizing the Best System, Optimizing the Best Organization and Ensuring the Best Financial Position. The new strategic plan aligns with the transformation agenda of the Ministry of Health & Long Term Care and the Waterloo Wellington Local Health Integration Network Integrated Health Services Plan. Participation in the WWLHIN Integrated Programs Councils, Rural Wellington Health Links and Health System Funding Reform via quality based procedures and a commitment to quality care close to home are key commitments of GMCH.
The annual Quality Improvement Plan (QIP) is developed by the Safety, Quality Performance Improvement Committee (SQPI) of the Board and utilizes the strategic and corporate scorecards and the SQPI Quality Framework to identify key performance indicators for the organization. The QIP meets the requirements of the Excellent Care for All Act and demonstrates to the community and our partners, GMCH's strong commitment to continuous quality improvement and improving the patient experience.
Integration & Continuity of Care
In 2013, GMCH and eight other provider organizations developed a Rural Wellington Integration Memorandum of Understanding to promote integration and collaborative care for patients across the patient care continuum. This has resulted in an approved Health Link for the area as well as a number of other ongoing projects that span these organizations. In addition, the WWLHIN Hospitals and CCAC developed a Clinical Program Integrated Accountability Framework and the identification of Clinical Councils to promote integrated care. Staff and Physicians are participating in Clinical Councils to support the implementation of best practice and integrated care. Councils and Committees include: Rehabilitation, Stroke, Frail Elderly, Musculoskeletal, Community Integration Teams, Centralized Intake, Emergency, Cardiac, Critical Care, Complex Continuing Care, Pharmacy, Surgical, Oncology, Diabetes, Mental Health & Addictions, Wound Care, Orthopedic Capacity Planning, Integrated Discharge Committee, LHIN 3/4 Maternal Child Network and Specialized Geriatric Network.
2
Challenges, Risks & Mitigation Strategies
GMCH is focused on continuous quality improvement and improving the patient experience. Mandated requirements, WWLHIN wide Committee commitments and the number of new initiatives challenge small organizations. The organization has leveraged late career nurses, Small Rural and Northern Funding and initiated LEAN education and training to help drive efficiency and free up time to manage the multiple projects.
GMCH priorities are evaluated by the Senior Management Team and decisions are made to mitigate those issues presenting high volume, high risk and problem prone areas.
The availability of resources will always be a challenge in small hospitals but partnering with other health care providers opportunities, additional efficiencies and shared resources can assist in mitigating risk. The building of collaborative relationships with other partners assists in improving the patient experience as they journey through the continuum of care.
Information Management Systems
GMCH is currently undertaking an extensive review of the Information Management Plan for the next three years. The organization has leveraged Clinical Connect through support of the WWLHIN to integrate hospital information with other health care providers. A pilot project was undertaken with the Upper Grand Family Health Team to integrate all diabetes care provided in the Hospital Diabetes Education Centre with local family physicians.
Data and information is reviewed bimonthly at the Health Records and Utilization Committee. Dashboards are prepared to communicate information such as infection control metrics, patient satisfaction surveys and patient compliments/complaints. The corporate scorecard is populated quarterly and reported to the Safety Quality & Performance Improvement Committee of the Board. Serious, sentinel and near miss reports are provided quarterly to the Board and a new trending reporting will be introduced in March 2014.
Information and data was utilized in the development of the new strategic plan for 2013-16 and a revised strategic scorecard will be launched in April 2014. The new scorecard will inform our patients, communities, staff, physicians, partners and Board of our progress towards our strategic directions.
Engagement of Clinical Staff & Broader Leadership
The organization is committed to advancing continuous quality improvement and improving the patient experience through the engagement of staff and leadership throughout our organization. The Safety, Quality & Performance Improvement framework provides the guidelines for the annual reporting from all clinical and support departments on their initiatives, metrics and challenges. The annual Quality Report provides a detailed update of departmental activities and is used to communicate to staff, physicians, the Quality Committee and the Board. The CEO also conducts CEO forums to update and engage staff in our quality improvement efforts. The Medical Advisory Committee receives minutes from all clinical department committees.
3
In 2013, the organization initiated LEAN education and training for all staff. LEAN with it's focus on continuous quality improvement has engaged staff and has resulted in successful LEAN initiatives being completed by staff and leaders.
Communication to engage staff across the organization occurs via multiple forums--email updates, intranet links, tips of the week, CEO forums, staff meetings, lunch and learns, videos and celebration events.
Accountability Management
The Board of Directors approves the annual Quality Improvement Plan (QIP) and assigns the responsibility for monitoring indicators jointly to the Board's Safety Quality & Performance Improvement Committee (SQPI) and Resources Committee. SQPI monitors the indicators and targets. The Resources Committee assigns the scoring of the metrics and the compensatory requirements for the Senior Management Team. A percentage of the SMT salary is assigned to the QIP targets.
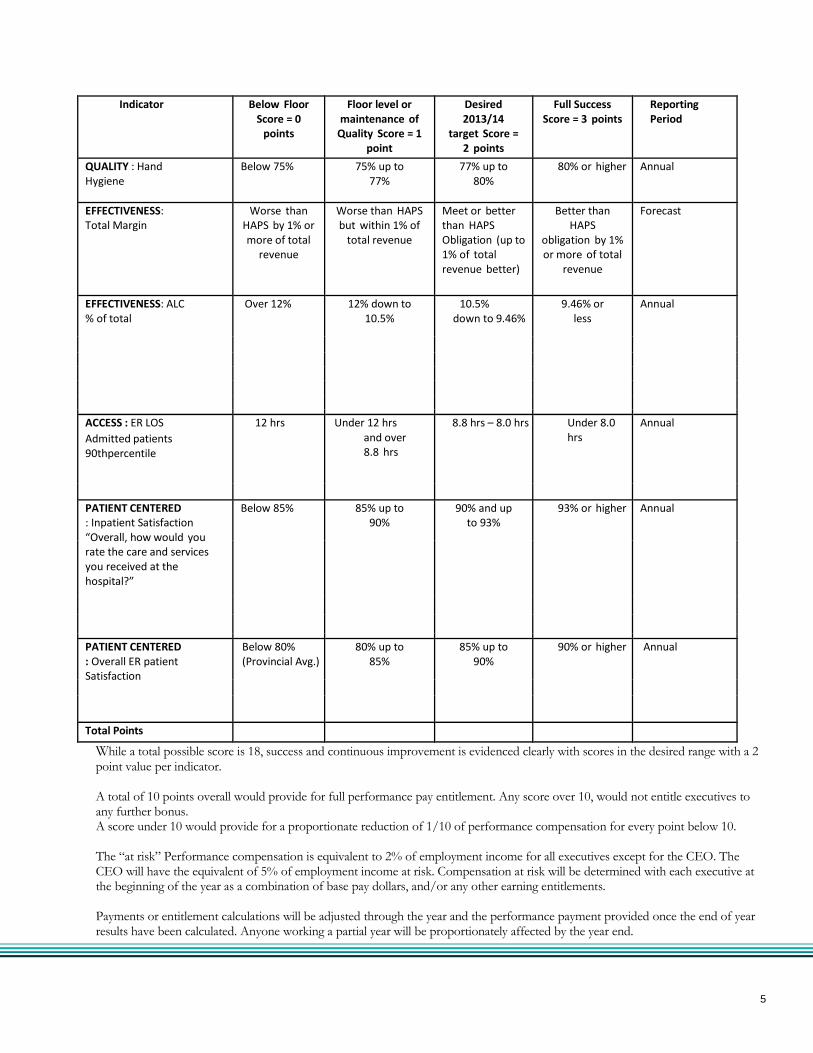
Link to Performance Based Compensation: Our executives' compensation is linked to performance in the following way: The Executives of the hospital, which include the CEO, two Vice Presidents, the Chief Human Resources Officer, Chief Financial Officer and Chief of Staff will have performance based compensation based on the Quality Improvement indicators as shown below:
4
Indicator Below Floor Score = 0
points
Floor level or maintenance of
Quality Score = 1 point
Desired 2013/14
target Score = 2 points
Full Success Score = 3 points
Reporting Period
QUALITY : Hand Hygiene
Below 75% 75% up to 77%
77% up to 80%
80% or higher Annual
EFFECTIVENESS: Total Margin
Worse than HAPS by 1% or more of total
revenue
Worse than HAPS but within 1% of
total revenue
Meet or better than HAPS Obligation (up to 1% of total revenue better)
Better than HAPS
obligation by 1% or more of total
revenue
Forecast
EFFECTIVENESS: ALC % of total
Over 12% 12% down to 10.5%
10.5% down to 9.46%
9.46% or less
Annual
ACCESS : ER LOS
Admitted patients 90thpercentile
12 hrs Under 12 hrs and over 8.8 hrs
8.8 hrs – 8.0 hrs Under 8.0 hrs
Annual
PATIENT CENTERED : Inpatient Satisfaction “Overall, how would you rate the care and services you received at the hospital?”
Below 85% 85% up to 90%
90% and up to 93%
93% or higher Annual
PATIENT CENTERED
: Overall ER patient Satisfaction
Below 80% (Provincial Avg.)
80% up to 85%
85% up to 90%
90% or higher Annual
Total Points While a total possible score is 18, success and continuous improvement is evidenced clearly with scores in the desired range with a 2 point value per indicator. A total of 10 points overall would provide for full performance pay entitlement. Any score over 10, would not entitle executives to any further bonus. A score under 10 would provide for a proportionate reduction of 1/10 of performance compensation for every point below 10. The “at risk” Performance compensation is equivalent to 2% of employment income for all executives except for the CEO. The CEO will have the equivalent of 5% of employment income at risk. Compensation at risk will be determined with each executive at the beginning of the year as a combination of base pay dollars, and/or any other earning entitlements. Payments or entitlement calculations will be adjusted through the year and the performance payment provided once the end of year results have been calculated. Anyone working a partial year will be proportionately affected by the year end.
5
Health System Funding Reform
Education has been conducted for Board members and Leaders on health system funding reform. The Senior Management Team has attended formal sessions provided by the Ministry of Health and Long Term Care. Planning for quality based procedures was initiated in 2013 and will continue in 2014-15. The Clinical Managers and Leaders have reviewed the quality based procedure handbooks for endoscopy, chemotherapy, congestive heart failure, chronic obstructive pulmonary disease and stroke. A checklist was developed based on the handbook information and current patient care order sets and care pathways. Patient care order sets and pathways are being updated to ensure compliance to quality based procedure evidence-best practices and will be reviewed at Clinical Departmental meetings and the Medical Advisory Committee. All pharmaceutical interventions will be reviewed at the Pharmacy and Therapeutics Committee as per normal procedures. Integration initiatives in collaboration with the WWLHIN through the regionalization of Stroke and Rehabilitation have set the foundation for future changes that will impact funding reform for the organization.
6
1 of 4
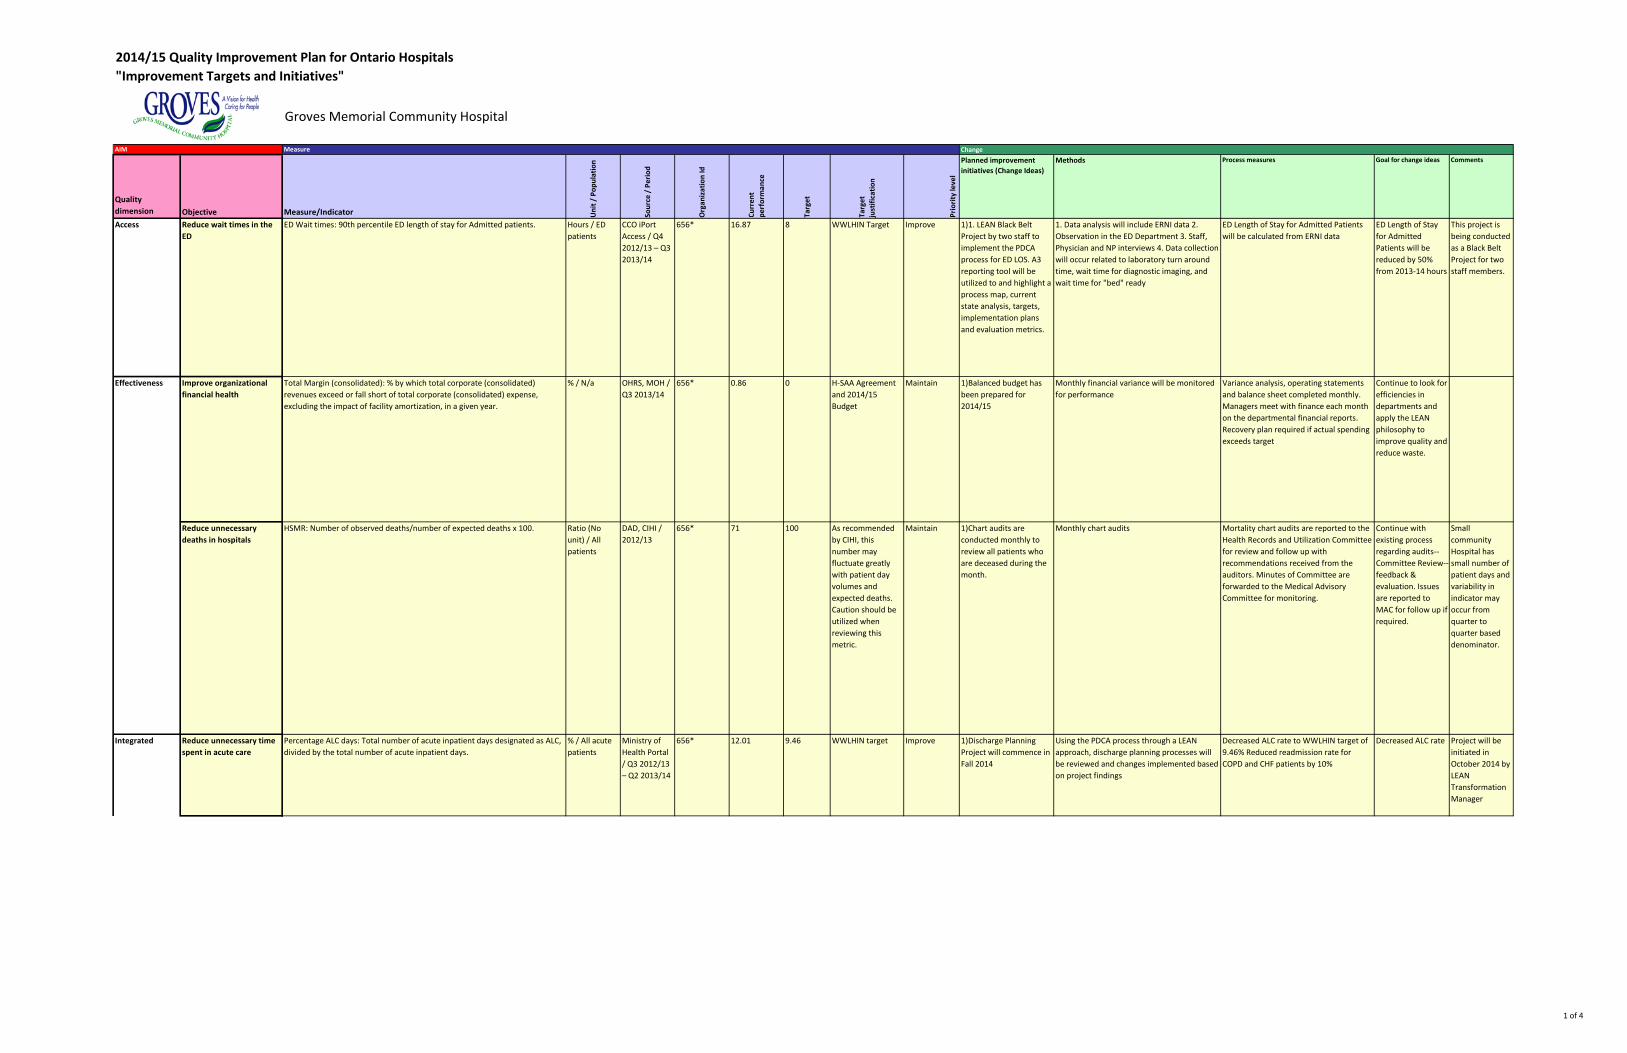
2014/15 Quality Improvement Plan for Ontario Hospitals"Improvement Targets and Initiatives"
Groves Memorial Community Hospital
AIM Measure Change
Quality dimension Objective Measure/Indicator U
nit /
Pop
ulat
ion
Sour
ce /
Per
iod
Org
aniz
atio
n Id
Curr
ent
perf
orm
ance
Targ
et
Targ
et
just
ifica
tion
Prio
rity
leve
l
Planned improvement initiatives (Change Ideas)
Methods Process measures Goal for change ideas Comments
Access Reduce wait times in the ED
ED Wait times: 90th percentile ED length of stay for Admitted patients. Hours / ED patients
CCO iPort Access / Q4 2012/13 – Q3 2013/14
656* 16.87 8 WWLHIN Target Improve 1)1. LEAN Black Belt Project by two staff to implement the PDCA process for ED LOS. A3 reporting tool will be utilized to and highlight a process map, current state analysis, targets, implementation plans and evaluation metrics.
1. Data analysis will include ERNI data 2. Observation in the ED Department 3. Staff, Physician and NP interviews 4. Data collection will occur related to laboratory turn around time, wait time for diagnostic imaging, and wait time for "bed" ready
ED Length of Stay for Admitted Patients will be calculated from ERNI data
ED Length of Stay for Admitted Patients will be reduced by 50% from 2013-14 hours
This project is being conducted as a Black Belt Project for two staff members.
Improve organizational financial health
Total Margin (consolidated): % by which total corporate (consolidated) revenues exceed or fall short of total corporate (consolidated) expense, excluding the impact of facility amortization, in a given year.
% / N/a OHRS, MOH / Q3 2013/14
656* 0.86 0 H-SAA Agreement and 2014/15 Budget
Maintain 1)Balanced budget has been prepared for 2014/15
Monthly financial variance will be monitored for performance
Variance analysis, operating statements and balance sheet completed monthly. Managers meet with finance each month on the departmental financial reports. Recovery plan required if actual spending exceeds target
Continue to look for efficiencies in departments and apply the LEAN philosophy to improve quality and reduce waste.
Reduce unnecessary deaths in hospitals
HSMR: Number of observed deaths/number of expected deaths x 100. Ratio (No unit) / All patients
DAD, CIHI / 2012/13
656* 71 100 As recommended by CIHI, this number may fluctuate greatly with patient day volumes and expected deaths. Caution should be utilized when reviewing this metric.
Maintain 1)Chart audits are conducted monthly to review all patients who are deceased during the month.
Monthly chart audits Mortality chart audits are reported to the Health Records and Utilization Committee for review and follow up with recommendations received from the auditors. Minutes of Committee are forwarded to the Medical Advisory Committee for monitoring.
Continue with existing process regarding audits--Committee Review--feedback & evaluation. Issues are reported to MAC for follow up if required.
Small community Hospital has small number of patient days and variability in indicator may occur from quarter to quarter based denominator.
Reduce unnecessary time spent in acute care
Percentage ALC days: Total number of acute inpatient days designated as ALC, divided by the total number of acute inpatient days.
% / All acute patients
Ministry of Health Portal / Q3 2012/13 – Q2 2013/14
656* 12.01 9.46 WWLHIN target Improve 1)Discharge Planning Project will commence in Fall 2014
Using the PDCA process through a LEAN approach, discharge planning processes will be reviewed and changes implemented based on project findings
Decreased ALC rate to WWLHIN target of 9.46% Reduced readmission rate for COPD and CHF patients by 10%
Decreased ALC rate Project will be initiated in October 2014 by LEAN Transformation Manager
Effectiveness
Integrated
2 of 4
AIM Measure Change
Quality dimension Objective Measure/Indicator U
nit /
Pop
ulat
ion
Sour
ce /
Per
iod
Org
aniz
atio
n Id
Curr
ent
perf
orm
ance
Targ
et
Targ
et
just
ifica
tion
Prio
rity
leve
l
Planned improvement initiatives (Change Ideas)
Methods Process measures Goal for change ideas Comments
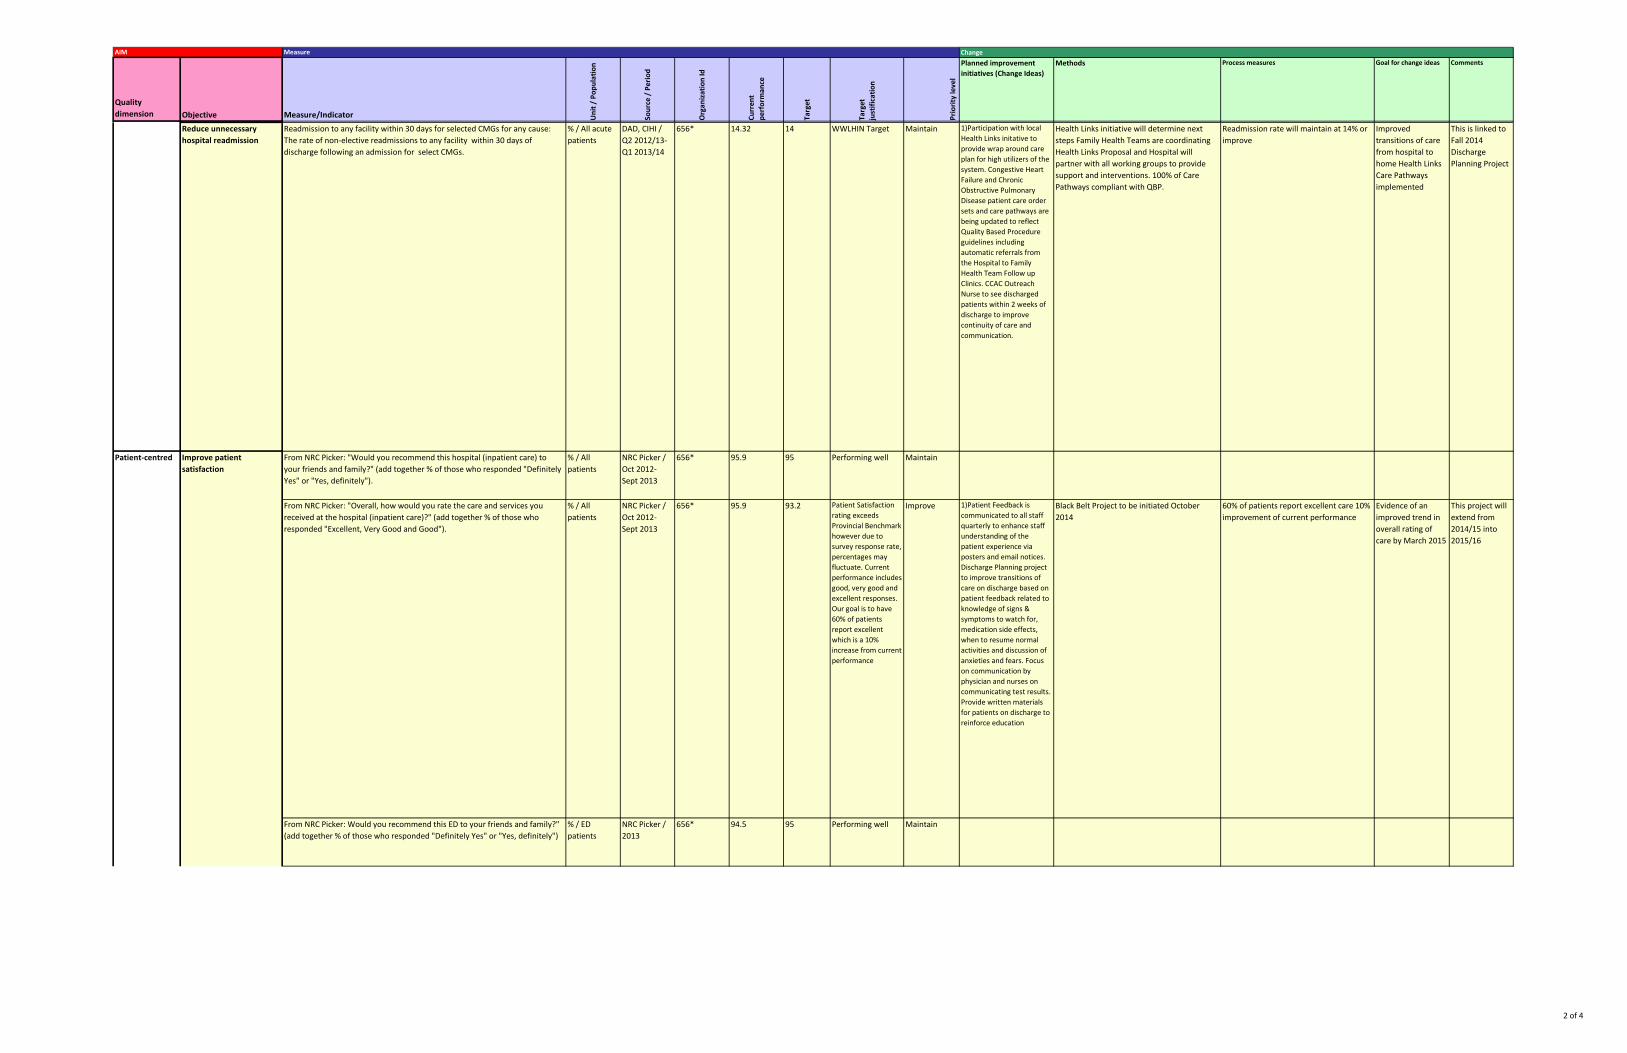
Reduce unnecessary hospital readmission
Readmission to any facility within 30 days for selected CMGs for any cause: The rate of non-elective readmissions to any facility within 30 days of discharge following an admission for select CMGs.
% / All acute patients
DAD, CIHI / Q2 2012/13-Q1 2013/14
656* 14.32 14 WWLHIN Target Maintain 1)Participation with local Health Links initative to provide wrap around care plan for high utilizers of the system. Congestive Heart Failure and Chronic Obstructive Pulmonary Disease patient care order sets and care pathways are being updated to reflect Quality Based Procedure guidelines including automatic referrals from the Hospital to Family Health Team Follow up Clinics. CCAC Outreach Nurse to see discharged patients within 2 weeks of discharge to improve continuity of care and communication.
Health Links initiative will determine next steps Family Health Teams are coordinating Health Links Proposal and Hospital will partner with all working groups to provide support and interventions. 100% of Care Pathways compliant with QBP.
Readmission rate will maintain at 14% or improve
Improved transitions of care from hospital to home Health Links Care Pathways implemented
This is linked to Fall 2014 Discharge Planning Project
From NRC Picker: "Overall, how would you rate the care and services you received at the hospital (inpatient care)?" (add together % of those who responded "Excellent, Very Good and Good").
% / All patients
NRC Picker / Oct 2012- Sept 2013
656* 95.9 93.2 Patient Satisfaction rating exceeds Provincial Benchmark however due to survey response rate, percentages may fluctuate. Current performance includes good, very good and excellent responses. Our goal is to have 60% of patients report excellent which is a 10% increase from current performance
Improve 1)Patient Feedback is communicated to all staff quarterly to enhance staff understanding of the patient experience via posters and email notices. Discharge Planning project to improve transitions of care on discharge based on patient feedback related to knowledge of signs & symptoms to watch for, medication side effects, when to resume normal activities and discussion of anxieties and fears. Focus on communication by physician and nurses on communicating test results. Provide written materials for patients on discharge to reinforce education
Black Belt Project to be initiated October 2014
60% of patients report excellent care 10% improvement of current performance
Evidence of an improved trend in overall rating of care by March 2015
This project will extend from 2014/15 into 2015/16
95 Performing well MaintainFrom NRC Picker: Would you recommend this ED to your friends and family?" (add together % of those who responded "Definitely Yes" or "Yes, definitely")
94.5
95 Performing well MaintainFrom NRC Picker: "Would you recommend this hospital (inpatient care) to your friends and family?" (add together % of those who responded "Definitely Yes" or "Yes, definitely").
% / All patients
NRC Picker / Oct 2012- Sept 2013
656* 95.9
% / ED patients
NRC Picker / 2013
656*
Improve patient satisfaction
Patient-centred
3 of 4
AIM Measure Change
Quality dimension Objective Measure/Indicator U
nit /
Pop
ulat
ion
Sour
ce /
Per
iod
Org
aniz
atio
n Id
Curr
ent
perf
orm
ance
Targ
et
Targ
et
just
ifica
tion
Prio
rity
leve
l
Planned improvement initiatives (Change Ideas)
Methods Process measures Goal for change ideas Comments
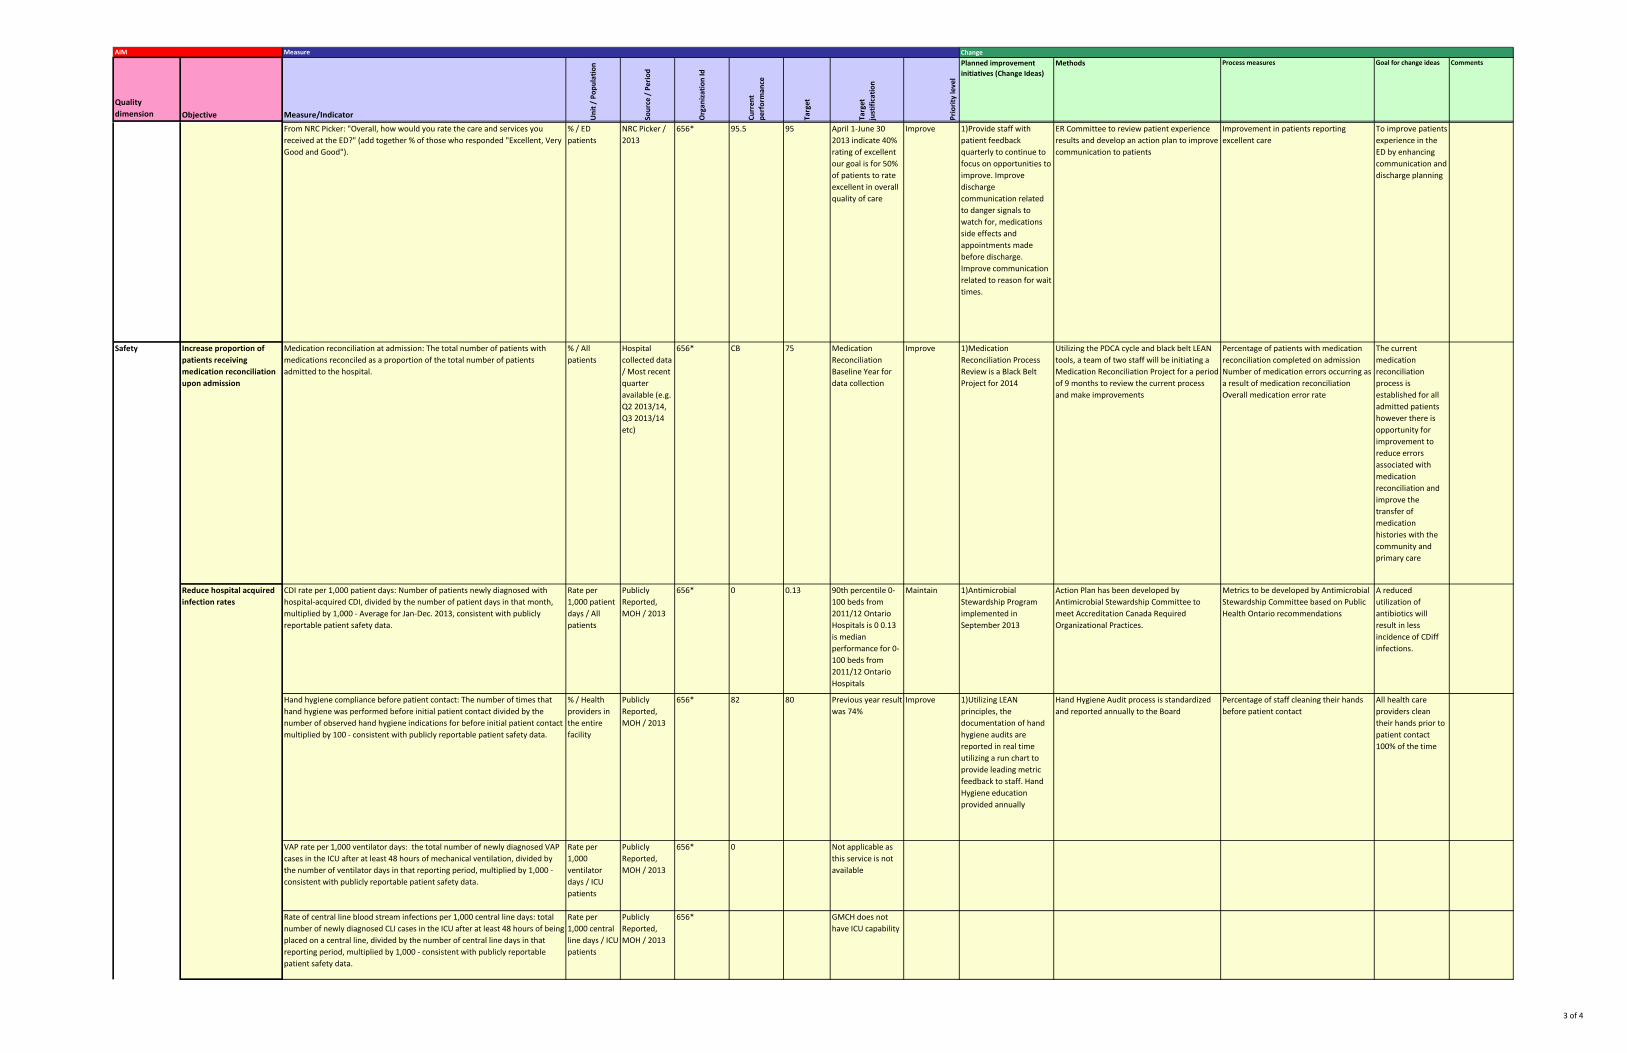
From NRC Picker: "Overall, how would you rate the care and services you received at the ED?" (add together % of those who responded "Excellent, Very Good and Good").
% / ED patients
NRC Picker / 2013
656* 95.5 95 April 1-June 30 2013 indicate 40% rating of excellent our goal is for 50% of patients to rate excellent in overall quality of care
Improve 1)Provide staff with patient feedback quarterly to continue to focus on opportunities to improve. Improve discharge communication related to danger signals to watch for, medications side effects and appointments made before discharge. Improve communication related to reason for wait times.
ER Committee to review patient experience results and develop an action plan to improve communication to patients
Improvement in patients reporting excellent care
To improve patients experience in the ED by enhancing communication and discharge planning
Increase proportion of patients receiving medication reconciliation upon admission
Medication reconciliation at admission: The total number of patients with medications reconciled as a proportion of the total number of patients admitted to the hospital.
% / All patients
Hospital collected data / Most recent quarter available (e.g. Q2 2013/14, Q3 2013/14 etc)
656* CB 75 Medication Reconciliation Baseline Year for data collection
Improve 1)Medication Reconciliation Process Review is a Black Belt Project for 2014
Utilizing the PDCA cycle and black belt LEAN tools, a team of two staff will be initiating a Medication Reconciliation Project for a period of 9 months to review the current process and make improvements
Percentage of patients with medication reconciliation completed on admission Number of medication errors occurring as a result of medication reconciliation Overall medication error rate
The current medication reconciliation process is established for all admitted patients however there is opportunity for improvement to reduce errors associated with medication reconciliation and improve the transfer of medication histories with the community and primary care
CDI rate per 1,000 patient days: Number of patients newly diagnosed with hospital-acquired CDI, divided by the number of patient days in that month, multiplied by 1,000 - Average for Jan-Dec. 2013, consistent with publicly reportable patient safety data.
Rate per 1,000 patient days / All patients
Publicly Reported, MOH / 2013
656* 0 0.13 90th percentile 0-100 beds from 2011/12 Ontario Hospitals is 0 0.13 is median performance for 0-100 beds from 2011/12 Ontario Hospitals
Maintain 1)Antimicrobial Stewardship Program implemented in September 2013
Action Plan has been developed by Antimicrobial Stewardship Committee to meet Accreditation Canada Required Organizational Practices.
Metrics to be developed by Antimicrobial Stewardship Committee based on Public Health Ontario recommendations
A reduced utilization of antibiotics will result in less incidence of CDiff infections.
Hand hygiene compliance before patient contact: The number of times that hand hygiene was performed before initial patient contact divided by the number of observed hand hygiene indications for before initial patient contact multiplied by 100 - consistent with publicly reportable patient safety data.
% / Health providers in the entire facility
Publicly Reported, MOH / 2013
656* 82 80 Previous year result was 74%
Improve 1)Utilizing LEAN principles, the documentation of hand hygiene audits are reported in real time utilizing a run chart to provide leading metric feedback to staff. Hand Hygiene education provided annually
Hand Hygiene Audit process is standardized and reported annually to the Board
Percentage of staff cleaning their hands before patient contact
All health care providers clean their hands prior to patient contact 100% of the time
VAP rate per 1,000 ventilator days: the total number of newly diagnosed VAP cases in the ICU after at least 48 hours of mechanical ventilation, divided by the number of ventilator days in that reporting period, multiplied by 1,000 - consistent with publicly reportable patient safety data.
Rate per 1,000 ventilator days / ICU patients
Publicly Reported, MOH / 2013
656* 0 Not applicable as this service is not available
Safety
Reduce hospital acquired infection rates
Rate of central line blood stream infections per 1,000 central line days: total number of newly diagnosed CLI cases in the ICU after at least 48 hours of being placed on a central line, divided by the number of central line days in that reporting period, multiplied by 1,000 - consistent with publicly reportable patient safety data.
Rate per 1,000 central line days / ICU patients
Publicly Reported, MOH / 2013
656* GMCH does not have ICU capability
4 of 4
AIM Measure Change
Quality dimension Objective Measure/Indicator U
nit /
Pop
ulat
ion
Sour
ce /
Per
iod
Org
aniz
atio
n Id
Curr
ent
perf
orm
ance
Targ
et
Targ
et
just
ifica
tion
Prio
rity
leve
l
Planned improvement initiatives (Change Ideas)
Methods Process measures Goal for change ideas Comments
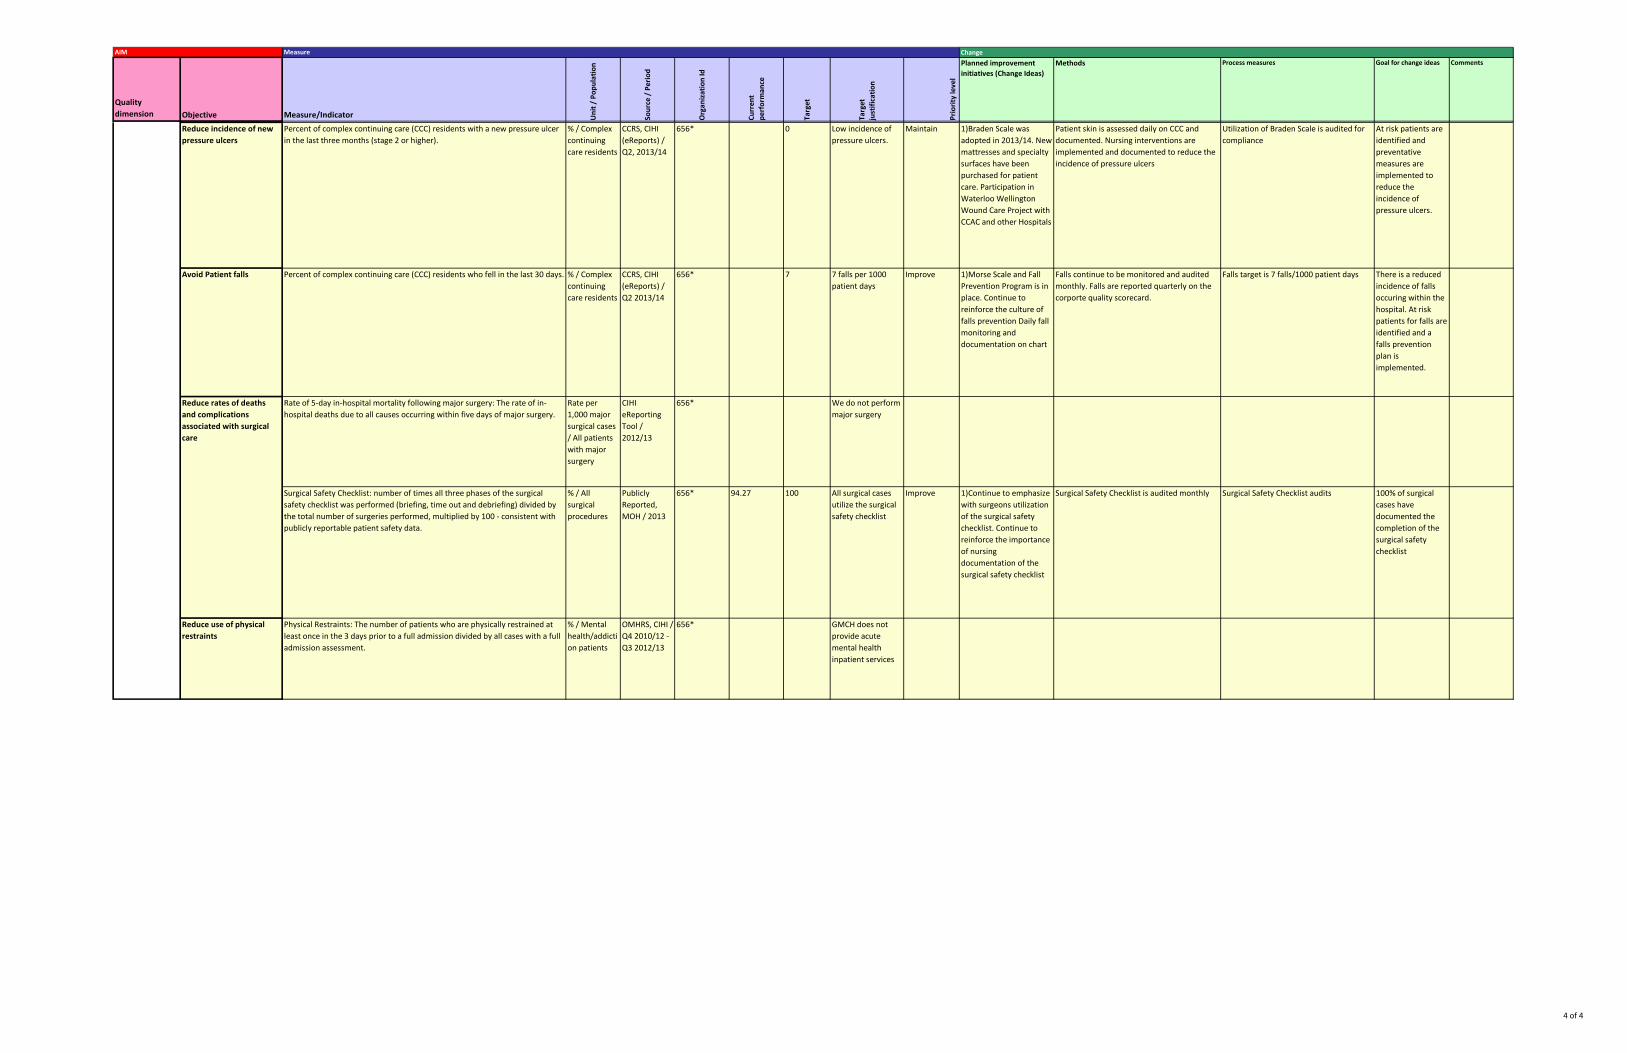
Reduce incidence of new pressure ulcers
Percent of complex continuing care (CCC) residents with a new pressure ulcer in the last three months (stage 2 or higher).
% / Complex continuing care residents
CCRS, CIHI (eReports) / Q2, 2013/14
656* 0 Low incidence of pressure ulcers.
Maintain 1)Braden Scale was adopted in 2013/14. New mattresses and specialty surfaces have been purchased for patient care. Participation in Waterloo Wellington Wound Care Project with CCAC and other Hospitals
Patient skin is assessed daily on CCC and documented. Nursing interventions are implemented and documented to reduce the incidence of pressure ulcers
Utilization of Braden Scale is audited for compliance
At risk patients are identified and preventative measures are implemented to reduce the incidence of pressure ulcers.
Avoid Patient falls Percent of complex continuing care (CCC) residents who fell in the last 30 days. % / Complex continuing care residents
CCRS, CIHI (eReports) / Q2 2013/14
656* 7 7 falls per 1000 patient days
Improve 1)Morse Scale and Fall Prevention Program is in place. Continue to reinforce the culture of falls prevention Daily fall monitoring and documentation on chart
Falls continue to be monitored and audited monthly. Falls are reported quarterly on the corporte quality scorecard.
Falls target is 7 falls/1000 patient days There is a reduced incidence of falls occuring within the hospital. At risk patients for falls are identified and a falls prevention plan is implemented.
Surgical Safety Checklist: number of times all three phases of the surgical safety checklist was performed (briefing, time out and debriefing) divided by the total number of surgeries performed, multiplied by 100 - consistent with publicly reportable patient safety data.
% / All surgical procedures
Publicly Reported, MOH / 2013
656* 94.27 100 All surgical cases utilize the surgical safety checklist
Improve 1)Continue to emphasize with surgeons utilization of the surgical safety checklist. Continue to reinforce the importance of nursing documentation of the surgical safety checklist
Surgical Safety Checklist is audited monthly Surgical Safety Checklist audits 100% of surgical cases have documented the completion of the surgical safety checklist
Reduce rates of deaths and complications associated with surgical care
Physical Restraints: The number of patients who are physically restrained at least once in the 3 days prior to a full admission divided by all cases with a full admission assessment.
% / Mental health/addiction patients
OMHRS, CIHI / Q4 2010/12 - Q3 2012/13
656* GMCH does not provide acute mental health inpatient services
Reduce use of physical restraints
CIHI eReporting Tool / 2012/13
656* We do not perform major surgery
Rate of 5-day in-hospital mortality following major surgery: The rate of in-hospital deaths due to all causes occurring within five days of major surgery.
Rate per 1,000 major surgical cases / All patients with major surgery