Embed Size (px)
Citation preview
© All Rights Reserved
*Corresponding author. Email: [email protected]: +98 1812352091; Fax: +98 1812352089
International Food Research Journal 21(1): 283-290 (2014)Journal homepage: http://www.ifrj.upm.edu.my
Shaviklo, A. R. and Fahim, A.
Iranian Fisheries Research Organization, National Fish Processing Research Center, Anzali, Guilan, Iran
Quality improvement of silver carp fingers by optimizing the level of major elements influencing texture
Abstract
A three-component Mixture Design was used to investigate the effect of different components of breadcrumbs, textured soy protein (TSP) and low-methoxyl pectin and their interactions on textural properties of an existing fish finger. The result indicated that the pectin had a more notable influence than TSP and breadcrumbs on all textural parameters as pectin proportion increased. At a higher proportion (0.9 - 1.2%), pectin improved essentially hardness, cohesiveness, springiness, gumminess, and chewiness of fish fingers measured by instrumental texture analysis. But sensory properties of formulated prototypes were decreased in this range of pectin. The optimum region consisted of 2 mixtures containing 5.35% TSP, 10.35% breadcrumbs and 0.3% pectin; and 4.8% TSP, 10.6% breadcrumbs and 0.6% pectin. The results indicated that prototypes containing 0.6% pectin were more stable than the other fish fingers during 6-month storage. The texture parameters obtained by instrumental methods were also strongly correlated with those obtained from sensory analysis.
Introduction
A need for development of innovative and unique high quality fish products using the greatest possible efficiency, experience and new knowledge is permanently present in the Iranian seafood industry. This goal can be achieved by continued development of new value-added products and by taking advantage of present processing equipment and knowledge (Shaviklo, 2007; Shaviklo and Rafipour, 2012). The aquaculture industry is currently the most important sub-sector of fisheries in Iran and its rapid development has attracted considerable attention in recent years. Since the potential for marine capture fisheries is limited, aquaculture is considered as the sector with good potential to increase animal protein (Salehi, 2011). More than 90% of aquaculture productions in Iran comes from fresh water cultures, mostly Chinese carp. Seafood consumption per capita in Iran is lower than that reported for world average (Shilat, 2012). In recent years, besides aquaculture developing plans, several studies have been done on how to increase the per capita fish consumption. The findings show that production of value added products is the best way to increase seafood consumption (Shaviklo, 2011). Total production of warm water species in the country was about 60000 MT, in 2011 (Shilat, 2012). Production of formulated fish products from cultured fish provides an excellent use of cultured fish (Shaviklo, 2006, 2007; Elyasi et al., 2010).
Besides increasing of fishery production and utilization, the market for ready-to-eat (RTE) seafood have been growing rapidly in the Near East including Iran for the last years. They have been driven by consumer demand for convenience food, value for money and increasing product awareness (Shaviklo and Rafipour, 2012; Euromonitor, 2013). Production of fish finger from silver carp mince was commercialized in Iran in recent decade with success (Shaviklo, 2006). Changing in consumer preferences and expectations leads industry to reformulate/ develop new products or to apply new ingredient (Velasco and Williams, 2011; Hathwar et al., 2012). Several ingredients such as polysaccharides were examined for quality improvement of formulated seafood products including fish fingers. In view of structural and functional properties of polysaccharides, pectin is probably one of the most interesting cell wall polymers because of numerous industrial applications (Van Buren, 1979). Structurally, pectin represents a group of heterogeneous polysaccharides of substantial diversity depending on its botanical origin (Huisman et al., 2001). From a technical point of view, pectin which is extracted from apples, citrus, sunflowers and sugar beet increase the solubility, emulsification, gelation and foaming properties (Mishra et al., 2001; Nubia et al., 2008; Biswas et al., 2011). It has also been used as a cryoprotectant in surimi (Sych et al., 1990; Ueng and Chu, 1996). Pectin at 1% improved the mechanical properties of surimi gels from silver carp (H. molitrix) (Barrera et
Keywords
Formulated fish finger Silver carpPectinTexture propertiesSensory evaluation
Article history
Received: 1 April 2013Received in revised form: 16 September 2013Accepted: 17 September 2013
284 Shaviklo, A. R. and Fahim, A./IFRJ 21(1): 283-290
al., 2002) and sole (Cyclopsetta chittendenii) (Uresti et al., 2003). No studies exist in the application of pectin to formulated/restructured products from silver carp mince/surimi.
The increasingly competitive environment, leads food industry more emphasis than ever on developing and sustaining new products. New food product development is defined as improving upon the existing product or producing new types of products. These must match both product functionality and consumer needs and desires in the most innovative way possible. Reformulating of the existing products is carried out to meet the needs of consumers’ expectations and may benefit the company (Perry and Cochet, 2009). However, formulated new fish products using new ingredients, such as pectin, can be used for the purpose of reaching young consumers (Cardoso et al., 2009). Texture assessment is often an important step in developing a new food product or optimizing processing variables. Both instrumental measurements and sensory evaluation methodes are used in food texture research to assess texture parameters (Meullenet, 1998; Hyldig, 2007). The process can be usually be accomplished comparatively inexpensively and within a relatively short development time (Moskowitz et al., 2006). The objective of this paper was to improve textural properties of an existing fish finger through optimizing the level of major elements including pectin influencing texture and to study quality changes of the prototypes during 6-month storage at -18°C. This information helps to motive process or product improvement or develop new product ideas.
Materials and Methods
Raw materialsFresh silver carp (Hypophthalmichthys molitrix)
with total weight 20 kg (25 individuals) were obtained in June from a local fish market (Rasht, Guilan, Iran) and transported by ice (1:1) to National fish processing research centre (NFPRC, Anzali, Guilan, Iran). Individual fishes (weight range: 620 - 930 g) were gutted, dressed and filleted manually and minced by employing a mechanical deboner (Baader model 694, Lubeck Germany). Breadcrumbs, Textured soy protein (TSP) and low methoxyl citrus pectin were obtained from the Amoon Shirin Part Company, (Karaj, Iran), Zardaneh soy protein (Esfehan, Iran) and Sigma-Aldrich Co., (St. Louis, MO, USA) respectively. Fresh onion, fresh garlic, salt, spices, vegetable oil, dried vegetable, wheat flour and corn flour were purchased from a local market (Anzali, Guilan, Iran).
Fish finger preparationThree fish finger prototypes including control
(existing product) were formulated separately. Silver carp mince and other ingredients (mixtures containing pectin and control) were mixed with a kitchen blender (Panasonic, MJ. W176P, Japan). The fish fingers formed manually using a plastic former, followed by battering (30% wheat flour, 10% corn flour and 60% cold water) and breading (conventional breadcrumbs, Amoon Shirin Part Company) and deep frying (for 30 s at 180ºC in sunflower oil) using a pilot processing line (Convenience Food Systems, Bakel, The Netherlands). fried prototypes were individually quick frozen at -40˚C for 20 min and packed in polyethylene bags, sealed and stored at -18˚C. During the storage the frozen prototypes were removed from the freezer and were put in a refrigerator for thawing overnight before the measurements.
Chemical compositionsProximate composition was determined
according to Association of Analytical Chemists (AOAC, 1990) methods. Crude protein content was determined using the Kjeldahl method (Kjeltex System-Texator, Sweden). Crude lipid content was determined by the Soxhlet method (Soxtec System-Texator, Sweden) (AOAC, 1990). Ash content was determined by heating samples overnight at 550°C. The moisture content was determined by drying samples for 4 h at 105°C until constant weight was achieved. The peroxide value (PV) was determined by the modified AOAS method (1990) and expressed as milliequivalent of oxygen per kilogram of lipid. Total volatile basic nitrogen (TVBN) was determined according to Pearson (1975).
Texture analysisThe textural evaluation of fish fingers was carried
out by sensory and instrumental analysis. Sensory attributes were evaluated by 10 experts (6 females) at NFPRC (Anzali, Guilan, Iran) who had been selected according to the general guidance of the International Organization for Standardization (ISO, 1983) for the selection, training and monitoring of assessors. Sensory evaluation was performed in a well-constructed and controlled sensory facility. The average age of the panellists was 28 years, ranged from 22 to 45 years and they were familiar with the sensory analysis methods. The panellists had experiences in sensory evaluation of RTE seafood and they were trained during two sessions to evaluate attributes of the samples using the quantitative descriptive analysis method (Meilgaard et al., 2007). A list of sensory lexicon (Table 1) to describe the
Shaviklo, A. R. and Fahim, A./IFRJ 21(1): 283-290 285
intensity of each attribute using an unstructured scale was adapted and modified from Shaviklo et al. (2010) and Kasapis (2012). All sample observations were conducted according to general guidance of ISO for the design of test rooms (ISO, 1988). Fresh/thawed prototypes were heated for sensory evaluation by putting them in a hot-air oven (Convotherm OEB/OGB, Eglfing, Bavaria, Germany) at 270 ± 2˚C for 3 min. All prototypes were coded with 3-digit random numbers and presented to the panellists on a tray in individual booths. Orders of serving were completely randomized in duplicate. Water was provided between evaluations to cleanse the palate. The panellists evaluated the samples without information about the storage time and product types, using the list of sensory lexicon developed during training and above mentioned protocol. They were asked to evaluate each sample by deep sniffing alone and then by consuming the test sample. They rinsed their mouths with water after tasting each sample and they were asked to rest 2-3 minutes between 2 evaluations (Shaviklo and Rafipour, 2012). Sensory properties of the formulated fish fingers during 6-month storage at -18 ºC were evaluated with 1 month intervals.
The TPA was carried out using a texture analysis
machine (Stable Micro System, Model TA-XT2, Texture Expert, Surrey, UK), operating software Texture Expert. The prototypes were equilibrated to room temperature for 2 h prior to the texture measurement. Fish fingers were subjected to two cycle compression at 50% compression using the texture analyzer with a 70 mm TPA compression plate attachment moving at a speed of 127 mm/min (Bourne, 1978; Bryant et al., 1995; Cheret et al., 2005). The profile analysis was considered hardness (N), cohesiveness, springiness, gumminess and chewiness. Each analysis was carried out in 3 replicates. Hardness was defined by peak force during the first compression cycle. Cohesiveness was calculated as the ratio of the area under the second curve to the area under the first curve. Springiness was defined as a ratio of the time recorded between the start of the second area and the second probe reversal at the time recorded between the start of the first area and the first probe reversal. Chewiness was obtained by multiplying hardness, cohesiveness and springiness. Gumminess was obtained by multiplying hardness and cohesiveness. Adhesiveness was the negative area under the curve obtained between cycles (Pons and Fizsman, 1996; Meullenet et al.,
Table 1. Lexicon for sensory texture analysis of silver carp fingers (adapted from Shaviklo et al., 2010; Kasapis 2012)
Table 2. Experimental design for optimizing 3 main components* of fish fingers and sensory responsesRun Component 1:
Breadcrumbs (%)Component 2: Textured soy protein (%)
Component 3: Pectin (%)
Response 1: Softness
Response 2: Juiciness
Response 3: adhesiveness
Response 4: cohesiveness
Response 5: chewiness
Response 6: overall
palatability1 9.90 4.90 1.20 85.32 79.2 34.58 49.15 75.41 60.712 9.80 5.60 0.60 85.32 79.2 34.58 49.15 75.25 60.713 8.80 6.00 1.20 66.25 75.6 41.26 47.51 70.36 89.274 10.35 5.35 0.30 79.65 69.89 26.25 47.08 72.24 55.955 11.00 5.00 0.00 77.21 75.32 25.85 41.67 68.36 51.236 11.00 3.80 1.20 69.87 78.25 32.51 47.15 65.47 58.657 8.80 6.00 1.20 70.32 70.25 24.57 51.65 71.51 60.328 11.00 4.40 0.60 80.25 68.98 28.51 58.52 69.21 61.259 10.00 6.00 0.00 57.08 37.08 35.41 47.93 49.45 59.36
10 11.00 5.00 0.00 51.25 30.81 32.92 42.91 50.12 66.0511 9.90 4.90 1.20 43.32 67.89 29.36 43.46 65.41 85.1212 10.60 4.50 0.90 75.41 65.32 39.60 36.66 70.32 68.3213 9.40 6.00 0.60 51.26 42.07 40.12 47.61 52.23 57.6514 11.00 3.80 1.20 63.25 32.92 32.5 46.25 63.02 80.35
*The 3 mixture components, breadcrumb, textured soy protein and pectin, made up a total of 16% of the actual formulation, with the complement being fish mince (75%), fresh onion (2.9%), fresh garlic (1%), salt (1.3%), spices (0.3%), dried parsley (1%) and vegetable oil (2.5%) used to make up 100% of the formulation.
Table 3. Experimental design for optimizing 3 main components* of fish fingers and instrumental texture responsesRun Component 1:
Breadcrumbs (%)Component 2: Textured soy protein (%)
Component 3: Pectin (%)
Response 1: I. Hardness
Response 2: I. Cohessiveness
Response 3: I. Springiness
Response 4: I. Gumminess
Response 5: I. Chewiness
1 9.90 4.90 1.20 25.31 0.65 0.22 15.21 18.652 9.80 5.60 0.60 22.34 0.63 0.2 13.25 16.323 8.80 6.00 1.20 26.23 0.64 0.23 15.14 17.984 10.35 5.35 0.30 28.33 0.66 0.22 14.90 18.125 11.00 5.00 0.00 27.25 0.71 0.21 14.85 18.656 11.00 3.80 1.20 24.64 0.59 0.21 13.65 17.897 8.80 6.00 1.20 29.55 0.62 0.23 15.32 18.558 11.00 4.40 0.60 18.61 0.43 0.17 12.65 15.329 10.00 6.00 0.00 17.56 0.45 0.18 12.98 14.89
10 11.00 5.00 0.00 25.66 0.59 0.21 13.54 17.2111 9.90 4.90 1.20 29.35 0.56 0.24 15.98 17.9812 10.60 4.50 0.90 17.91 0.5 0.18 12.42 14.6513 9.40 6.00 0.60 25.73 0.56 0.19 14.14 15.2114 11.00 3.80 1.20 23.52 0.54 0.18 13.98 14.65
*The 3 mixture components, breadcrumb, textured soy protein and pectin, made up a total of 16% of the actual formulation, with the complement being fish mince (75%), fresh onion (2.9%), fresh garlic (1%), salt (1.3%), spices (0.3%), dried parsley (1%) and vegetable oil (2.5%) used to make up 100% of the formulation.
Sensory attribute Scale (0-100) DefinitionsSoftness ��firm: soft Softness in the first bite.Cohesiveness low: high The ability of the sample to stick together during chewing. Place the sample in the mouth
and chew 2-4 times between the molars: Low (the sample disintegrates into many smallpieces) , High ( it stays together)
Juiciness dry: juicy When chewing: Dry (sample draws liquid from the mouth), Juicy (Samples give awayliquid)
Adhesiveness low: high The force required to remove the sample from the roof of the mouth after chewing: Low(the sample falls), High (it requires force to be applied by the tongue to remove it).
Chewiness low: high The net energy required to chew the test sample to the point required for swallowing it.Overall palatability dislike: like How much do you like the product overall?
286 Shaviklo, A. R. and Fahim, A./IFRJ 21(1): 283-290
1998). Cohesiveness, springiness, gumminess, and chewiness do not have units.
Experimental design and statistical analysisStatistical software package Design-Expert
(version 7.0.0, State-Ease, Minneapolis, MN, USA) was applied to construct as well as to analyze the design. A 3-component D-optimal Mixture Design (Oliveria et al., 1995; Cunha et al., 1997) was applied to optimize the mixture components. A mixture experiment is a special type of response surface experiment in which the factors are the components of a mixture and the response is a function of the proportions of each ingredient. The mixture components consisted of breadcrumbs (X1), TSP (X2), and pectin (X3). With 3 components, the experimental region is a triangle where each of the three vertexes corresponds to a mixture that is made up of a pure component. The upper and lower boundaries of the high-impact ingredients in the mixture were 8.8 - 11.0% breadcrumbs (X1), 3.6-8.0% TSP (X2), and 0.0 - 1.2% pectin (X2), which added up to a total of 16% of the mixture design. Other ingredients which made up a total of 84% of the actual formulation were: silver carp mince (75%), fresh onion (2.9%), fresh garlic (1.0%), salt (1.3%), spices (0.3%), dried parsley (1.0%) and vegetable oil (2.5%). Accordingly, 14 representative recipes (1-14) were prepared (Tables 2 & 3). Means and standard deviations (SD) were calculated for sensory, instrumental, and chemical compositions data using the statistical program NCSS 2007 (NCSS, UT, USA). The program was used to calculate multiple comparisons using Duncan’s test to determine if the prototypes were different. Significance of difference was defined at the 5% level. Pearson correlation coefficients were also generated to describe the relationship between TPA parameters, and sensory characteristics using linear regression and correlation procedure. Dependent variables included softness, cohesiveness, juiciness, adhesiveness, chewiness and overall palatability and TPA parameters of hardness, cohesiveness, springiness, gumminess and chewiness, were independent variables. PanelCheck software (version V1.3.2, Matforsk, Ås, Norway) was applied to monitor panellists performance and to analyse sensory data using principal component analysis (PCA).
Results and Discussion
Chemical compositionsSilver carp mince used for product development
contained 17.3% protein, 78.8% moisture, 2.8% fat,
and 1.1% ash. No significant difference was found in proximate compositions of existing and formulated products (Table 4). TVBN and peroxide values of fish fingers increased during storage (Table 5). The increase was significant among storage times not among the prototypes. Peroxide value for formulated fish finger containing 0.6% pectin was lower than that observed for the existing product and the formulated product containing 0.3% pectin. However, until 6-month storage the TVBN and peroxide values were lower than the standard limits for formulating seafood products (20 mg/100 gN TVBN & 5 meq/ kg peroxide) (Shaviklo and Rafipour, 2012). Low
Table 4. Proximate analysis (%) of silver carp mince and fingers
Sample Protein Moisture Fat Ash CarbohydrateSilver carp mince 17.26±1.21a 78.81±0.91a 2.82±0.32b 1.11±0.10b 0.0b
Existing fish finger (control) 13.01±0.51b 59.32±1.01b 7.02±0.21a 3.33±0.17a 17.43±0.87a
Formulated Fish finger (1) 13.23±0.43b 59.51±0.96b 6. 90±0.14a 3.12±0.30a 17.32±0.51a
Formulated Fish finger (2) 13.54±0.62b 59.60±0.77b 7.11±0.53a 3.01±0.28a 16.83±0.49a
Values are means of 3 analyses. Different Superscripts denote significant differences within a column (p < 0.05). (1): Mixture 1 containing 5.35% TSP, 10.35% breadcrumbs and 0.3% pectin; (2): mixture 2 containing 4.8% TSP, 10.6% breadcrumbs and 0.6% pectin.
Table 5. TVBN and proxide values of fish fingers during 6-month storage at -18°C
Parameters M0 M1 M2 M3 M4 M5 M6TVBN (mg N/100 g)Existing fish finger (control) ** 13.6±0.11d 13.8±0.49d 14.9±0.81c 15.8±0.88c 17.2±0.87b 18.4±0.69ab 19.2±0.87a
Formulated Fish finger (1) *** 14.1±0.13d 14.0±0.60d 14.7±0.76c 16.1±0.61c 16.8±0.91b 17.7±0.81a 18.3±0.76a
Formulated Fish finger (2) ** 13.9±0.98d 14.2±0.56d 15.4±0.87c 16.8±0.75c 17.2±0.78b 18.8±0.95a 19.0±0.71a
NS NS NS NS NS NS NS
Peroxide value (meq/ kg)Existing fish finger (control) ** 0.0e 0.0e 0.51±0.10d 1.11±0.11c 2.01±0.15b 2.61±0.21b 4.71±0.34aA
Formulated Fish finger (1) * 0.0f 0.0f 0.42±0.08e 0.93±0.05d 1.84±0.17c 2.22±0.17b 3.61±0.21aA
Formulated Fish finger (2) *** 0.0f 0.0f 0.39±0.06e 0.85±0.07d 1.49±0.21c 1.85±0.16b 2.02±0.28aB
NS NS NS NS NS NS **
Values are means of 3 analyses. Different lower-case letters in the same row denote the significant differences. Different upper-case letters in the same column denote significant differences between products. (*p < 0.05, ** < 0.01, *** < 0.001). M0-M6 indicates storage months. NS, not significant (p > 0.05). (1): Mixture 1 containing 5.35% TSP, 10.35% breadcrumbs and 0.3% pectin; (2): mixture 2 containing 4.8% TSP, 10.6% breadcrumbs and 0.6% pectin.
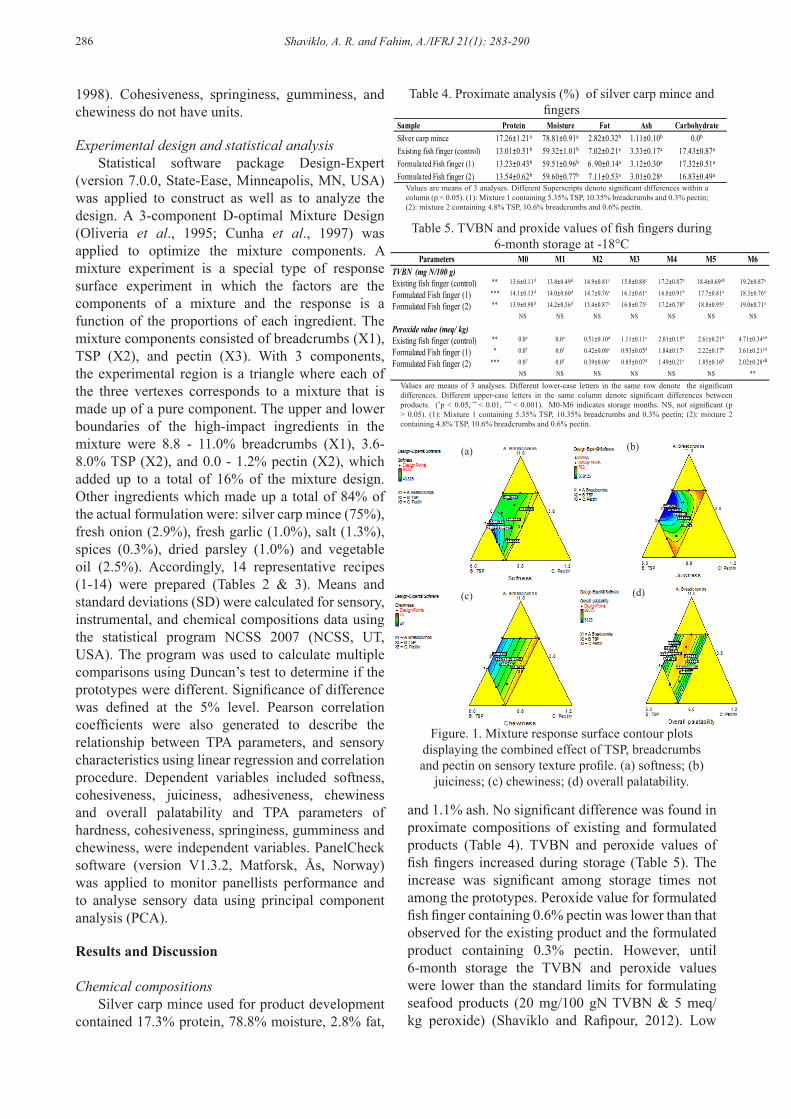
Figure. 1. Mixture response surface contour plots displaying the combined effect of TSP, breadcrumbs and pectin on sensory texture profile. (a) softness; (b)
juiciness; (c) chewiness; (d) overall palatability.
(a) (b)
(c) (d)
Shaviklo, A. R. and Fahim, A./IFRJ 21(1): 283-290 287
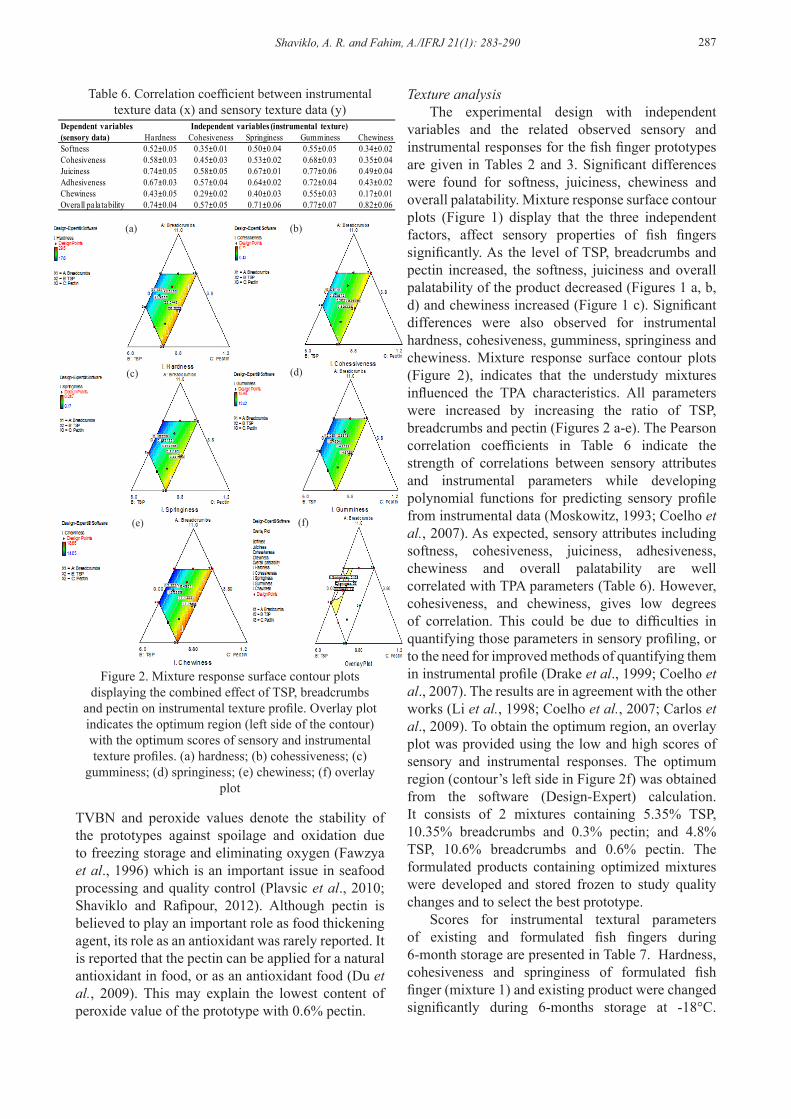
TVBN and peroxide values denote the stability of the prototypes against spoilage and oxidation due to freezing storage and eliminating oxygen (Fawzya et al., 1996) which is an important issue in seafood processing and quality control (Plavsic et al., 2010; Shaviklo and Rafipour, 2012). Although pectin is believed to play an important role as food thickening agent, its role as an antioxidant was rarely reported. It is reported that the pectin can be applied for a natural antioxidant in food, or as an antioxidant food (Du et al., 2009). This may explain the lowest content of peroxide value of the prototype with 0.6% pectin.
Texture analysisThe experimental design with independent
variables and the related observed sensory and instrumental responses for the fish finger prototypes are given in Tables 2 and 3. Significant differences were found for softness, juiciness, chewiness and overall palatability. Mixture response surface contour plots (Figure 1) display that the three independent factors, affect sensory properties of fish fingers significantly. As the level of TSP, breadcrumbs and pectin increased, the softness, juiciness and overall palatability of the product decreased (Figures 1 a, b, d) and chewiness increased (Figure 1 c). Significant differences were also observed for instrumental hardness, cohesiveness, gumminess, springiness and chewiness. Mixture response surface contour plots (Figure 2), indicates that the understudy mixtures influenced the TPA characteristics. All parameters were increased by increasing the ratio of TSP, breadcrumbs and pectin (Figures 2 a-e). The Pearson correlation coefficients in Table 6 indicate the strength of correlations between sensory attributes and instrumental parameters while developing polynomial functions for predicting sensory profile from instrumental data (Moskowitz, 1993; Coelho et al., 2007). As expected, sensory attributes including softness, cohesiveness, juiciness, adhesiveness, chewiness and overall palatability are well correlated with TPA parameters (Table 6). However, cohesiveness, and chewiness, gives low degrees of correlation. This could be due to difficulties in quantifying those parameters in sensory profiling, or to the need for improved methods of quantifying them in instrumental profile (Drake et al., 1999; Coelho et al., 2007). The results are in agreement with the other works (Li et al., 1998; Coelho et al., 2007; Carlos et al., 2009). To obtain the optimum region, an overlay plot was provided using the low and high scores of sensory and instrumental responses. The optimum region (contour’s left side in Figure 2f) was obtained from the software (Design-Expert) calculation. It consists of 2 mixtures containing 5.35% TSP, 10.35% breadcrumbs and 0.3% pectin; and 4.8% TSP, 10.6% breadcrumbs and 0.6% pectin. The formulated products containing optimized mixtures were developed and stored frozen to study quality changes and to select the best prototype.
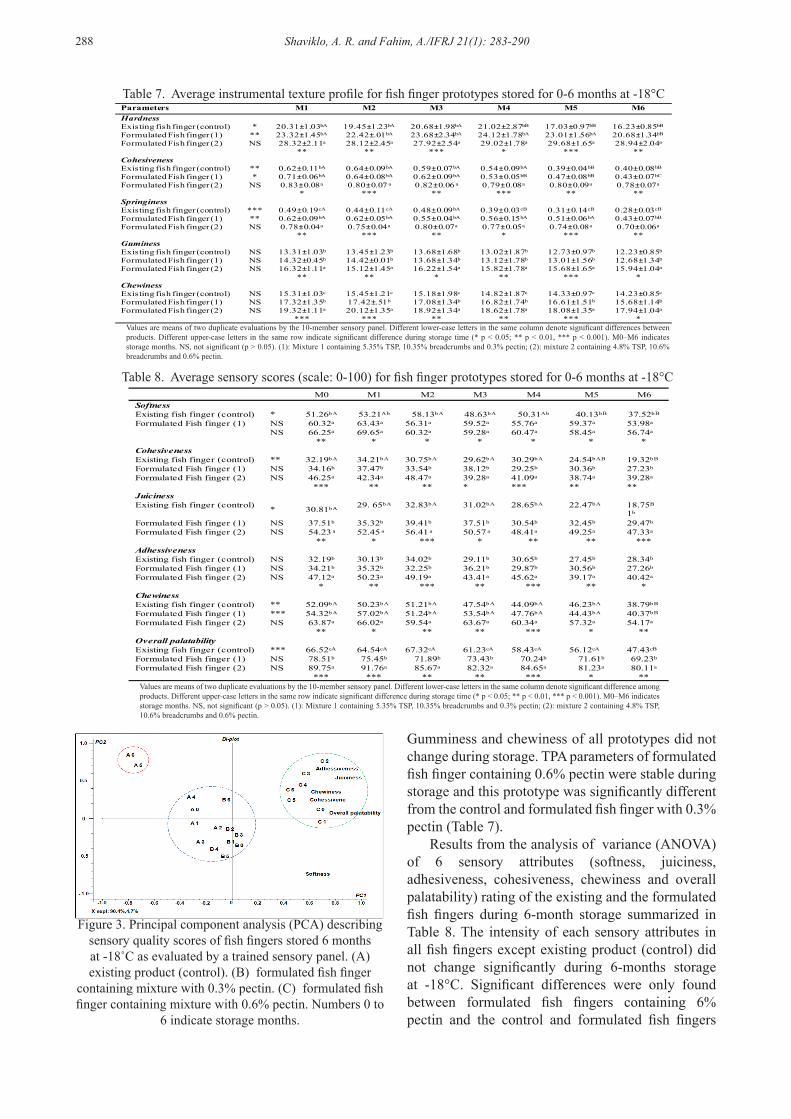
Scores for instrumental textural parameters of existing and formulated fish fingers during 6-month storage are presented in Table 7. Hardness, cohesiveness and springiness of formulated fish finger (mixture 1) and existing product were changed significantly during 6-months storage at -18°C.
Table 6. Correlation coefficient between instrumental texture data (x) and sensory texture data (y)
Dependent variables(sensory data)
Independent variables (instrumental texture)Hardness Cohesiveness Springiness Gumminess Chewiness
Softness 0.52±0.05 0.35±0.01 0.50±0.04 0.55±0.05 0.34±0.02Cohesiveness 0.58±0.03 0.45±0.03 0.53±0.02 0.68±0.03 0.35±0.04Juiciness 0.74±0.05 0.58±0.05 0.67±0.01 0.77±0.06 0.49±0.04Adhesiveness 0.67±0.03 0.57±0.04 0.64±0.02 0.72±0.04 0.43±0.02Chewiness 0.43±0.05 0.29±0.02 0.40±0.03 0.55±0.03 0.17±0.01Overall palatability 0.74±0.04 0.57±0.05 0.71±0.06 0.77±0.07 0.82±0.06
Figure 2. Mixture response surface contour plots displaying the combined effect of TSP, breadcrumbs
and pectin on instrumental texture profile. Overlay plot indicates the optimum region (left side of the contour) with the optimum scores of sensory and instrumental texture profiles. (a) hardness; (b) cohessiveness; (c)
gumminess; (d) springiness; (e) chewiness; (f) overlay plot
(a) (b)
(c) (d)
(e) (f)
288 Shaviklo, A. R. and Fahim, A./IFRJ 21(1): 283-290
Gumminess and chewiness of all prototypes did not change during storage. TPA parameters of formulated fish finger containing 0.6% pectin were stable during storage and this prototype was significantly different from the control and formulated fish finger with 0.3% pectin (Table 7).
Results from the analysis of variance (ANOVA) of 6 sensory attributes (softness, juiciness, adhesiveness, cohesiveness, chewiness and overall palatability) rating of the existing and the formulated fish fingers during 6-month storage summarized in Table 8. The intensity of each sensory attributes in all fish fingers except existing product (control) did not change significantly during 6-months storage at -18°C. Significant differences were only found between formulated fish fingers containing 6% pectin and the control and formulated fish fingers
Table 8. Average sensory scores (scale: 0-100) for fish finger prototypes stored for 0-6 months at -18°CM0 M1 M2 M3 M4 M5 M6
SoftnessExisting fish finger (control) * 51.26bA 53.21Ab 58.13bA 48.63bA 50.31Ab 40.13bB 37.52bB
Formulated Fish finger (1) NS 60.32a 63.43a 56.31a 59.52a 55.76a 59.37a 53.98a
NS 66.25a 69.65a 60.32a 59.28a 60.47a 58.45a 56.74a
** * * * * * *CohesivenessExisting fish finger (control) ** 32.19bA 34.21bA 30.75bA 29.62bA 30.29bA 24.54bAB 19.32bB
Formulated Fish finger (1) NS 34.16b 37.47b 33.54b 38.12b 29.25b 30.36b 27.23b
Formulated Fish finger (2) NS 46.25a 42.34a 48.47a 39.28a 41.09a 38.74a 39.28a
*** ** ** * *** ** **JuicinessExisting fish finger (control) * 30.81bA 29. 65bA 32.83bA 31.02bA 28.65bA 22.47bA 18.75B
1b
Formulated Fish finger (1) NS 37.51b 35.32b 39.41b 37.51b 30.54b 32.45b 29.47b
Formulated Fish finger (2) NS 54.23 a 52.45 a 56.41 a 50.57 a 48.41a 49.25a 47.33a
** * *** * ** ** ***AdhessivenessExisting fish finger (control) NS 32.19b 30.13b 34.02b 29.11b 30.65b 27.45b 28.34b
Formulated Fish finger (1) NS 34.21b 35.32b 32.25b 36.21b 29.87b 30.56b 27.26b
Formulated Fish finger (2) NS 47.12a 50.23a 49.19a 43.41a 45.62a 39.17a 40.42a
* ** *** ** *** ** *ChewinessExisting fish finger (control) ** 52.09bA 50.23bA 51.21bA 47.54bA 44.09bA 46.23bA 38.79bB
Formulated Fish finger (1) *** 54.32bA 57.02bA 51.24bA 53.54bA 47.76bA 44.43bA 40.37bB
Formulated Fish finger (2) NS 63.87a 66.02a 59.54a 63.67a 60.34a 57.32a 54.17a
** * ** ** *** * **Overall palatabilityExisting fish finger (control) *** 66.52cA 64.54cA 67.32cA 61.23cA 58.43cA 56.12cA 47.43cB
Formulated Fish finger (1) NS 78.51b 75.45b 71.89b 73.43b 70.24b 71.61b 69.23b
Formulated Fish finger (2) NS 89.75a 91.76a 85.67a 82.32a 84.65a 81.23a 80.11a
*** *** ** ** *** * **Values are means of two duplicate evaluations by the 10-member sensory panel. Different lower-case letters in the same column denote significant difference among products. Different upper-case letters in the same row indicate significant difference during storage time (* p < 0.05; ** p < 0.01, *** p < 0.001). M0–M6 indicates storage months. NS, not significant (p > 0.05). (1): Mixture 1 containing 5.35% TSP, 10.35% breadcrumbs and 0.3% pectin; (2): mixture 2 containing 4.8% TSP, 10.6% breadcrumbs and 0.6% pectin.
Parameters M1 M2 M3 M4 M5 M6HardnessExisting fish finger (control) * 20.31±1.03bA 19.45±1.23bA 20.68±1.98bA 21.02±2.87bB 17.03±0.97bB 16.23±0.85bB
Formulated Fish finger (1) ** 23.32±1.45bA 22.42±.01bA 23.68±2.34bA 24.12±1.78bA 23.01±1.56bA 20.68±1.34bB
Formulated Fish finger (2) NS 28.32±2.11a 28.12±2.45a 27.92±2.54a 29.02±1.78a 29.68±1.65a 28.94±2.04a
** ** *** * *** **CohesivenessExisting fish finger (control) ** 0.62±0.11bA 0.64±0.09bA 0.59±0.07bA 0.54±0.09bA 0.39±0.04bB 0.40±0.08bB
Formulated Fish finger (1) * 0.71±0.06bA 0.64±0.08bA 0.62±0.09bA 0.53±0.05bB 0.47±0.08bB 0.43±0.07bC
Formulated Fish finger (2) NS 0.83±0.08a 0.80±0.07 a 0.82±0.06 a 0.79±0.08a 0.80±0.09a 0.78±0.07a
* *** ** *** ** **SpringinessExisting fish finger (control) *** 0.49±0.19cA 0.44±0.11cA 0.48±0.09bA 0.39±0.03cB 0.31±0.14cB 0.28±0.03cB
Formulated Fish finger (1) ** 0.62±0.09bA 0.62±0.05bA 0.55±0.04bA 0.56±0.15bA 0.51±0.06bA 0.43±0.07bB
Formulated Fish finger (2) NS 0.78±0.04a 0.75±0.04a 0.80±0.07a 0.77±0.05a 0.74±0.08a 0.70±0.06a
** *** ** * *** **GuminessExisting fish finger (control) NS 13.31±1.03b 13.45±1.23b 13.68±1.68b 13.02±1.87b 12.73±0.97b 12.23±0.85b
Formulated Fish finger (1) NS 14.32±0.45b 14.42±0.01b 13.68±1.34b 13.12±1.78b 13.01±1.56b 12.68±1.34b
Formulated Fish finger (2) NS 16.32±1.11a 15.12±1.45a 16.22±1.54a 15.82±1.78a 15.68±1.65a 15.94±1.04a
** ** * ** *** *ChewinessExisting fish finger (control) NS 15.31±1.03c 15.45±1.21c 15.18±1.98c 14.82±1.87c 14.33±0.97c 14.23±0.85c
Formulated Fish finger (1) NS 17.32±1.35b 17.42±.51b 17.08±1.34b 16.82±1.74b 16.61±1.51b 15.68±1.14b
Formulated Fish finger (2) NS 19.32±1.11a 20.12±1.35a 18.92±1.34a 18.62±1.78a 18.08±1.35a 17.94±1.04a
*** *** ** ** *** *Values are means of two duplicate evaluations by the 10-member sensory panel. Different lower-case letters in the same column denote significant differences between products. Different upper-case letters in the same row indicate significant difference during storage time (* p < 0.05; ** p < 0.01, *** p < 0.001). M0–M6 indicates storage months. NS, not significant (p > 0.05). (1): Mixture 1 containing 5.35% TSP, 10.35% breadcrumbs and 0.3% pectin; (2): mixture 2 containing 4.8% TSP, 10.6% breadcrumbs and 0.6% pectin.
Table 7. Average instrumental texture profile for fish finger prototypes stored for 0-6 months at -18°C
Figure 3. Principal component analysis (PCA) describing sensory quality scores of fish fingers stored 6 months at -18˚C as evaluated by a trained sensory panel. (A) existing product (control). (B) formulated fish finger
containing mixture with 0.3% pectin. (C) formulated fish finger containing mixture with 0.6% pectin. Numbers 0 to
6 indicate storage months.
Shaviklo, A. R. and Fahim, A./IFRJ 21(1): 283-290 289
with 0.3% pectin in softness, cohesiveness, juiciness, adhesiveness, chewiness and overall palatability (Tables 8). Human perception of palatability of formulated products is derived from a complex interaction of sensory and physical processes during chewing (Meilgaard et al., 2007). Of the various subjective characteristics determining seafood palatability, juiciness is the most important (Jeremiah, 1982). However, the effect of storage and product on sensory attributes can be seen on the PCA in Figure 4 which explains 95.1% of the variation in the data. The control (A) and formulated fish finger (B) are located in the centre of the plot indicating sensory similarities between these prototypes. Formulated fish finger (C) was characterized by adhesiveness, cohesiveness, juiciness, chewiness parameter, and overall palatability thus demonstrated on the upper right side of the plot, and differs from the other two prototypes analysed by being apart from each other, on the right quadrant (Figure 3).
The observed changes in sensory and instrument properties of control and pectin contained samples also may reveal different behaviour of pectin, proteins and water in the different structure (Noel et al., 2007). Covalent protein-pectin interactions have been induced between protein and pectin, improving the functional properties of some proteins ‘i.e’ gelling, solubility, emulsifying and foaming properties (Sych et al., 1990; Mishra et al., 2001). Pectin-pectin interactions are also responsible for the improvement of textural properties (Barrera et al., 2002). However, the decrease in the textural properties might be associated with an increase in pectin-water interactions, inducing the swelling of the pectin and causing a disruptive effect on the gel structure (Uresti et al., 2003).
Conclusions
Reformulating of the existing silver carp fingers to improve textural properties indicated that the intended mixtures could influence the textural properties of the prototypes. applying pectin in the fish finger formulation improved texture properties and palatability of the prototypes. Texture parameters obtained by instrumental methods were strongly correlated with those obtained from sensory analysis. Formulated fish finger containing 0.6% pectin denoted the most stability and palatability scores during storage. Since, formulated fishery products are among the popular RTE food with a long history of manufacturing. Therefore, reformulating of the existing products to improve sensory attributes is a useful approach to stay on the market. However, the
success of a new product involves coordinated efforts between various departments at a food processing plant (Hathwar et al., 2012).
Acknowledgments
Supported by the Iranian Fisheries Research Organization (IFRO), National Fish Processing Research Centre for this study is gratefully acknowledged.
References
Association of Analytical Chemists (AOAC). 1990. Official Methods of Analysis. 15th edn. Washington, DC.
Barrera, A.M., Ramirez, J.A., Gonzalez-Cabriales, J.J. and Vazquez, M. 2002. Effect of pectins on the gelling properties of surimi from silver carp. Food Hydrocolloids 16: 441-447.
Cardoso, C.M.L., Mendes, P. and Nunes, M.L. 2009. Instrumental texture and sensory characteristics of cod frankfurter sausages. International Journal of Food Properties 12: 625-643.
Cheret, R., Chapleau, N., Delbarre-Ladrat, C., Verrez-Bagnis, V. and Lamballerie, M. D. 2005. Effects of high pressure on texture and microstructure of sea bass (Dicentrarchus labrax L.) fillets. Journal of Food Science 70: 477-483.
Coelho, G.M., Weschenfelder, A.V., Meinert, E.M., Amboni, R.D.M.C. and Beirão, LH. 2007. Effects of starch properties on textural characteristics of fish burgers: sensory and instrumental approaches. Boletim. Centro de Pesquisa e Processamento de Alimentos (CEPPA) 25: 37-50.
Cunha, L.M., Oliveir, F.A.R., Brandao, T.R.S. and Oliveira, J.C. 1997. Optimal design for estimating the kinetic parameters of the Bigelow model. Food Engineering 33:111-128.
Drake, M.A., Gerard, P.D., Truong, V.D. and Daubert, C.R. 1999. Relationship between instrumental and sensory measurements of cheese texture. Journal of Sensory Studies 30: 451-476.
Du, L., Li, T., Wang, N., Guo, M. and Zhang, H. 2009. Antioxidant activity of haw pectin hydrolyzates. Food Research Development 30: 18-21.
Elyasi, A., Zakipour Rahim Abadi, E., Sahari, M. A., Zare, P. 2010. Chemical and microbial changes of fish fingers made from mince and surimi of Common Carp. International Food Research Journal 17: 915-920.
Euromonitor. 2013. Country report; ready meals in Iran. Euromonitor International. Feb. 2013: 46.
Fawzya, Y.N., Muljanah, I. and Peranginangin, R. 1996. Quality evaluation of bread fortified with surimi and surimi flour during storage. In FAO Fisheries Report - R563, APFIC - Asia-Pacific Fishery Commission. Summary report of and papers presented at the tenth session of the Working Party on Fish Technology and
290 Shaviklo, A. R. and Fahim, A./IFRJ 21(1): 283-290
Marketing, p.271-278 Colombo, Sri Lanka, 4-7 June 1996.
Hathwar, S.C., Rai, A.K., Modi, V.K. and Narayan, B. 2012. Characteristics and consumer acceptance of healthier meat and meat product formulations-a review. Journal of Food Science and Technology 49: 653–664.
Hyldig, G. 2007. Sensory profiling of fish, fish product and shellfish. In: Nollet, L.M.L., Boylston, T., Chen, F., Coggins, P.C., Gloria, M.B., Hyldig, G.C.R., Kerth, L.H., McKee, and Hui, Y.H. (Eds), Handbook of meat poultry and seafood quality, Blackwell Publishing, p. 511-528, Oxford, UK.
International Organization for Standardization (ISO). 1983. Sensory analysis-general guidance for the selection, training and monitoring of assessors. Part 1: selected assessors, 8586-1, Geneva.
International Organization for Standardization (ISO). 1988. Sensory analysis-general guidance for the design of test rooms. 8589, Geneva.
Li, R., Carpenter, J.A. and Cheney, R. 1998. Sensory and instrumental properties of smoked sausage made with mechanically deboned poultry (MSP) meat and wheat protein. Journal of Food Science 63: 923-929.
Moskowitz, H.R. 1993. Sensory analysis procedure and viewpoints: intellectual history, current debates, future outlooks. Journal of Sensory Studies 8: 241-256.
Moskowitz, H.R., Beckley, J.H. and Resurreccion, A.V.A. 2006. Understanding consumers’ and customers’ needs - The growth engine. In: Moskowitz HR, Beckley JH, Resurreccion A.V.A. (Eds), Sensory and Consumer Research in Food Product Design and Development, 37–68 p., Ames, IA: Blackwell Publishing.
Mishra, S., Mann, B. and Joshi, V. K. 2005. Functional improvement of whey protein concentrate on interaction with pectin. Food Hydrocolloids 15: 9-15.
Meullenet, J. F., Lyon, B. G. Carpenter, J. A. and Lyon. C. E. 1998. Relationship between sensory and instrumental texture profile attributes. Journal of Sensory Studies 13:77-93.
Meilgaard, M.C., Civille, G. and Caar, B. T. 2007. Sensory Evaluation Techniques. 4th edition. CRC Press, Taylor and Francis Group.
Noel, T.R., Krzeminski, A., Moffat, J, Parker R. Wellner, N. and Ring S.G. 2007. The deposition and stability of pectin/protein and pectin/poly-L-lysine/protein multilayers. Carbohydrate Polymers 70: 393-405.
Rodríguez, N. R., Uresti, R. M., Velazquez, G., Vázquez, M. and Ramírez, J.A. 2008. Effects of amidated low methoxyl pectin on healthy restructured fish food from Mexican flounder (Cyclopsetta chittendeni). Journal of Food Process Engineering 31: 229–246.
Pearson, D. 1975. Laboratory techniques in food analysis. The Butterworth Group and Co (publishers) Inc., London, UK.
Perry, C. and Cochet M. 2009. Consumer packaged goods product development processes in the 21st century: product lifecycle management emerges as a key innovation driver. In: Moskowitz HR., Sam Saguy I., Straus T. (Eds.) An Integrated Approach to New Food Product Development, p.114-130, CRC Press Taylor
& Francis Group, Boca Raton, Salehi, H. 2011. Stock Enhancement of Sturgeon Fishes
in Iran. In: Faruk, A. (Ed.) Recent Advances in Fish Farms, Available from: http://www.intechopen.com/books/recentadvances-in-fish-farms/stock-enhancement-of-sturgeonfishes-in-iran.
Shaviklo, G.R. 2006. Quality improvement of farmed fish in Iranian markets. Aquaculture Asia 3: 30-32.
Shaviklo, G.R. 2007. Fish sausages from silver carp surimi. INFOFISH International 1: 34-38.
Shaviklo, G.R., Arason, S., Thorkelsson, G., Sveinsdottir, M. 2010. Sensory attributes of haddock balls affected by added fish protein isolate and frozen storage. Journal of Sensory Studies 3: 316-331.
Shaviklo, G.R. 2011. Using product development approach for increasing fish consumption in Near East region. INFOFISH International 4: 47-52.
Shaviklo, A.R. and Rafipour, F. 2012. Consumer-based development and optimization of fish strudel using D-optimal mixture design. Journal of Food Processing and Preservation, DOI: 10.1111/jfpp.12039.
Shilat. 2012. Year book of fishery statistics. Iranian Fisheries Organization (Shilat). Tehran, Iran.
Sych, J., Lacroix, C., Adambounou, L.T. and Castaigne, F. 1990. Cryoprotective effects of some materials on cod-surimi proteins during frozen storage. Journal of Food Science 55: 1222–1227.
Ueng, Y. E. and Chu, Y. J. 1996. Effect of dietary fibers on cold resistance of surimi. Food Science Taiwan 23: 266–275.
Uresti, R.M., López-Arias1, N., Ramírez J.A. and Vázquez, M. 2003. Effect of amidated low methoxyl pectin on fish mince. Food Technology and Biotechnology 41: 131–136.
Velasco, V. and Williams, P. 2011. Review: improving meat quality through natural antioxidants. Chilean Journal of Agricultural Research 2: 313-322.


![(14) IFRJ-2010-059 Azrina UPM[1]](https://img.pdfslide.us/doc/110x75/577cde151a28ab9e78ae5968/14-ifrj-2010-059-azrina-upm1.jpg)

![21 IFRJ 20 (01) 2013 Hayati (040)[1]](https://img.pdfslide.us/doc/110x75/577ce3b11a28abf1038cc32d/21-ifrj-20-01-2013-hayati-0401.jpg)
![(5) IFRJ-2010-076 Thawien Thailand[1]](https://img.pdfslide.us/doc/110x75/577cc3c31a28aba711971255/5-ifrj-2010-076-thawien-thailand1.jpg)