Embed Size (px)
Citation preview
1 Revised December 2014
Quality Improvement in Behavioral Health Care: Concepts and Tools
In preparation for the New Jersey Statewide Behavioral Health Quality Improvement Fair
Shula Minsky, Director, Quality Improvement, UBHC

2
Training Objectives Review quality improvement (QI) principles
Describe the quality improvement process
Examine QI tools and how & when to use them
Review principles and requirements for presentation of a QI project at the Annual QI Fair
2

3
WHAT IS QUALITY IMPROVEMENT ?
Quality improvement is...
A systematic approach to analyzing (current) performance in an organization
AND
designing, testing and monitoring interventions that bridge the gap
What should BE What IS The G A P
4 4
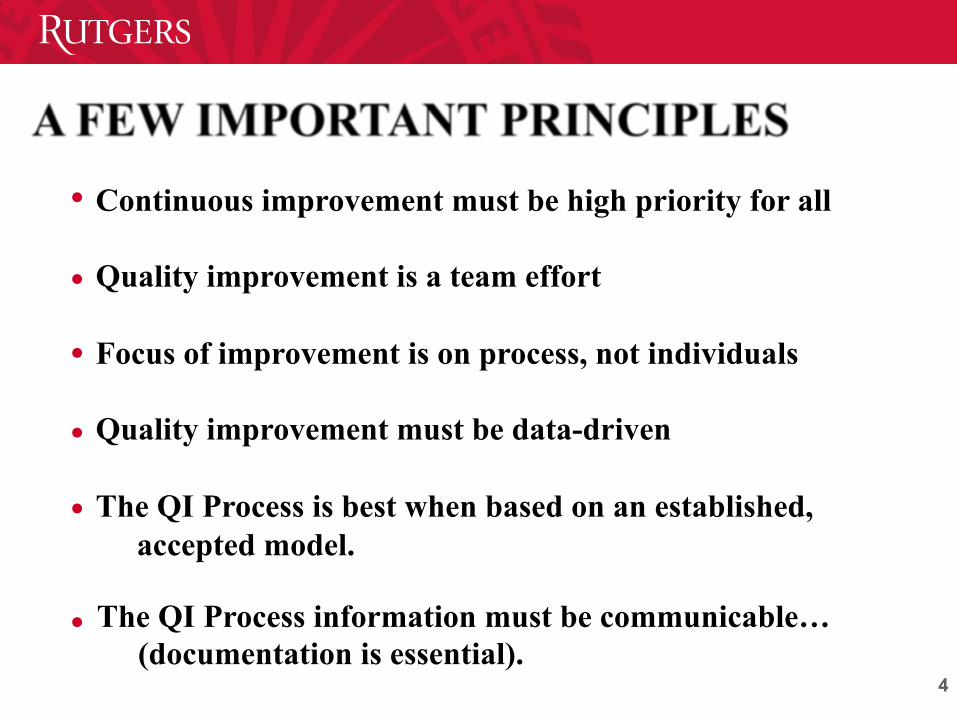
Continuous improvement must be high priority for all
Quality improvement is a team effort
Focus of improvement is on process, not individuals
Quality improvement must be data-driven
The QI Process is best when based on an established, accepted model.
The QI Process information must be communicable… (documentation is essential).
•
•
•
•
•
•

5
PLAN
DESIGN
Why do this (performance GAP!)? What are the objectives? Does it fit overall mission, values, plans? Who needs to participate? What are the expected results? What exactly will we do? For how long will we engage in this activity? How will we measure baseline performance? How will we measure outcome? How will we communicate our results?
A GENERAL MODEL FOR QUALITY IMPROVEMENT

6
Why do this? What are the objectives? Does it fit overall mission, values, plans? Who needs to participate? What are the expected results? What exactly will we do? For how long will we engage in this activity? How will we measure success? (baseline/outcome performance) How will we communicate our results?

7
PLAN
DESIGN
Why do this (performance GAP!)? What are the objectives? Does it fit overall mission, values, plans? Who needs to participate? What are the expected results? What exactly will we do? For how long will we engage in this activity? How will we measure baseline performance? How will we measure outcome? How will we communicate our results?
MEASURE
Implement your interventions, Collect relevant baseline and outcome data, analyze, compare with past performance and with external resources.
A GENERAL MODEL FOR QUALITY IMPROVEMENT

8 8
Implement your interventions, Collect relevant baseline and outcome data, analyze, compare with past performance and with external resources.

9
PLAN
DESIGN
Why do this (performance GAP!)? What are the objectives? Does it fit overall mission, values, plans? Who needs to participate? What are the expected results? What exactly will we do? For how long will we engage in this activity? How will we measure baseline performance? How will we measure outcome? How will we communicate our results?
MEASURE
Implement your interventions, Collect relevant baseline and outcome data, analyze, compare with past performance and with external resources.
ASSESS Evaluate the results, interpret, discuss, is the new process/ strategy/improvement useful? practical? cost-effective?
A GENERAL MODEL FOR QUALITY IMPROVEMENT

10 10
Evaluate the results, interpret, discuss, is the new process/ strategy/ improvement useful? practical? cost-effective?

11
PLAN
DESIGN
Why do this (performance GAP!)? What are the objectives? Does it fit overall mission, values, plans? Who needs to participate? What are the expected results? What exactly will we do? For how long will we engage in this activity? How will we measure baseline performance? How will we measure outcome? How will we communicate our results?
MEASURE
Implement your interventions, Collect relevant baseline and outcome data, analyze, compare with past performance and with external resources.
ASSESS Evaluate the results, interpret, discuss, is the new process/ strategy/improvement useful? practical? cost-effective?
IMPROVE
If it works, implement, disseminate, publicize, do training and in-service, and maintain gains.
A GENERAL MODEL FOR QUALITY IMPROVEMENT

12 12
If it works, implement, disseminate, publicize, do training and in-service, and maintain gains.
13
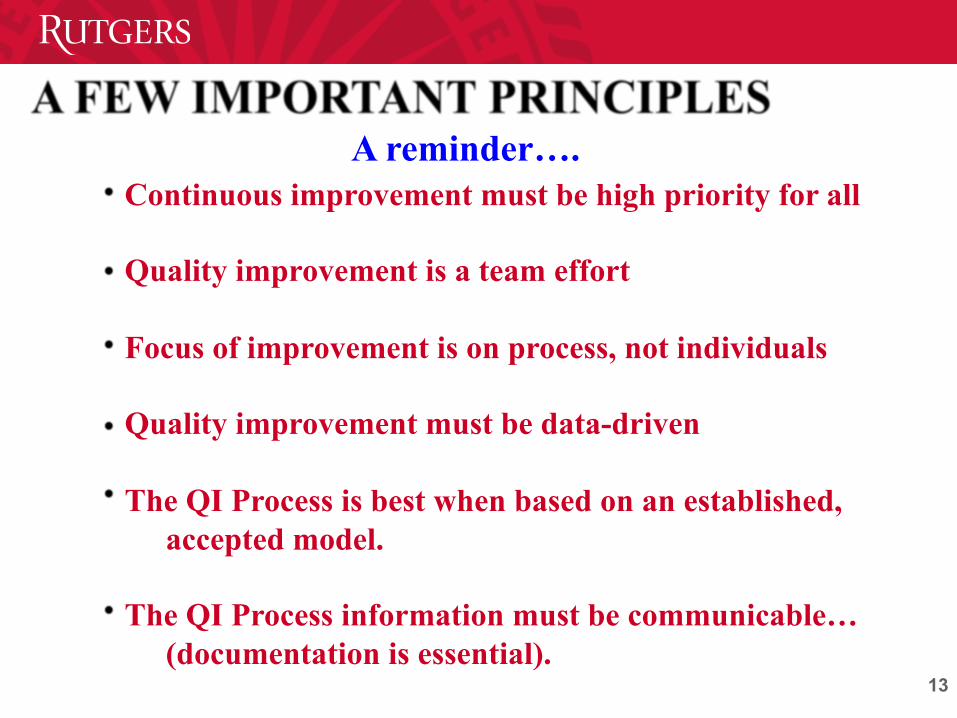
Continuous improvement must be high priority for all
Quality improvement is a team effort
Focus of improvement is on process, not individuals
Quality improvement must be data-driven
The QI Process is best when based on an established, accepted model.
The QI Process information must be communicable… (documentation is essential).
13
A reminder….

14
Data Collection
You must know in advance what you are gonna do with the stuff.”
Mark Twain
“Collecting data is much like collecting garbage……..

15
Collecting Data Consider:
What really needs to be measured?
What’s the best way to measure it?
How much data needs to be collected, for how long, and how often?
How will the data be used?
– If you cannot answer this question, don’t collect this information.

16
Collecting Data
Use (if possible) currently collected data, it will - help pinpoint your problem and the purpose of your QI team - provide ready-made baseline and outcome measures
If you have to use other measures, choose a tested and proven instrument
If you can’t find what you need, develop your own measure (very carefully)
Look for simple, concrete counts of things and events
Practical suggestions:
17
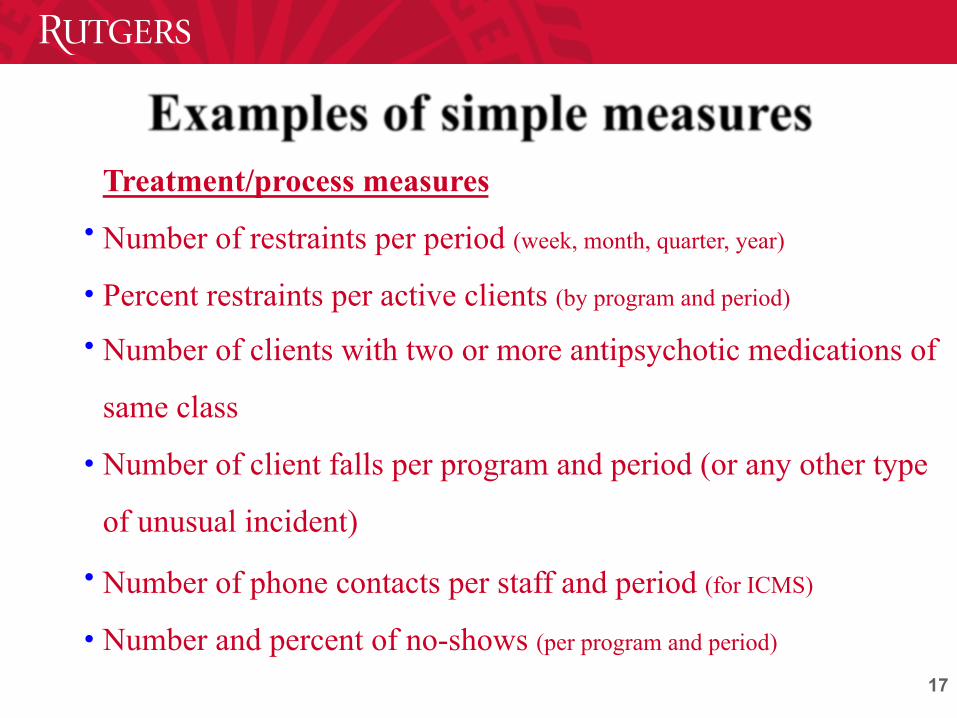
Treatment/process measures
Number of restraints per period (week, month, quarter, year)
Percent restraints per active clients (by program and period)
Number of clients with two or more antipsychotic medications of
same class
Number of client falls per program and period (or any other type
of unusual incident)
Number of phone contacts per staff and period (for ICMS)
Number and percent of no-shows (per program and period) 17
•
•
•
•
•
•

18
Integrating physical health into behavioral health
18
Number and percent of clients with PCP documented in the chart
Number and percent of clients with BMI documented in the chart
Percent of clients with BMI at or above 30 (the obesity threshold)
Number and percent of clients with blood pressure documented in the chart
Number and percent of clients at or above BP of 140/90
•
•
•
•
•
19
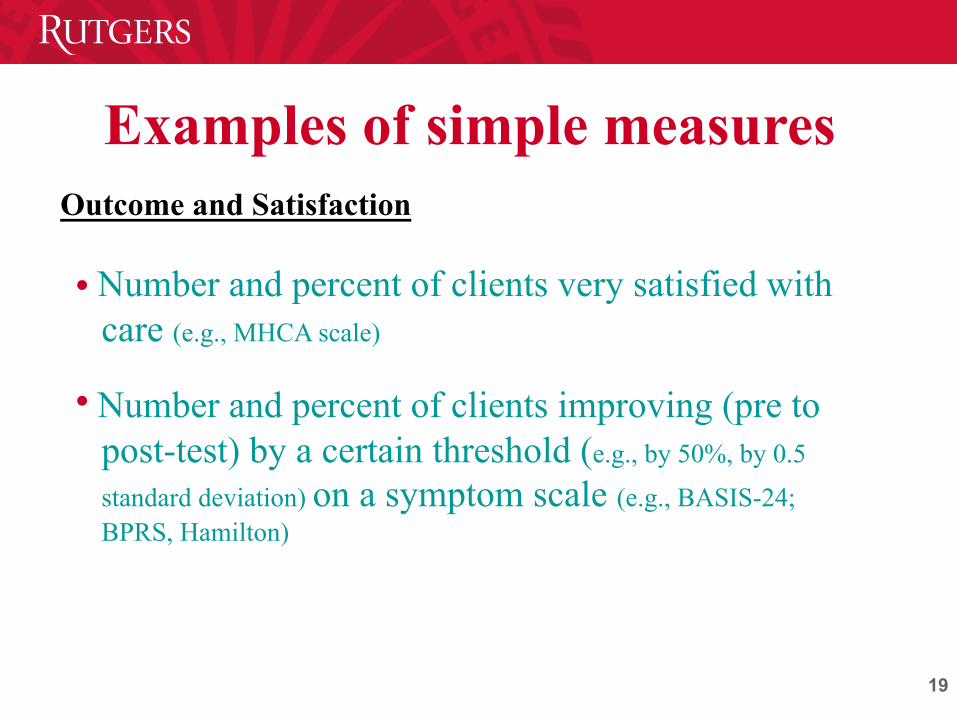
Outcome and Satisfaction
Number and percent of clients very satisfied with care (e.g., MHCA scale)
Number and percent of clients improving (pre to post-test) by a certain threshold (e.g., by 50%, by 0.5
standard deviation) on a symptom scale (e.g., BASIS-24; BPRS, Hamilton)
19
•
•
Examples of simple measures

20
QI Tools
20

21 21
Overview of useful QI tools
What they are. When and How to do them.
Process tools:
Brainstorming Multi-voting Pareto Charts Cause & Effect Diagrams (“Fishbone”) Flow Charts
Data display tools: Run Charts and Control Charts Work Plans and project tracking
22
Process Tools
22

23
Brainstorming WHAT: A formalized way to generate ideas efficiently and creatively and
get all team members involved in the process.
When embarking on a new project, and no one knows where to go and what to do.
When the team is “stuck” in the same old way of doing things and you want an influx of new, creative ideas.
When you want to have all members involved, and avoid having the group dominated by a few vocal members.
WHEN:
UTILITY/PURPOSE: Used to identify topic/problem for improvement at the planning stage, generate ideas about possible/probable causes of problems, or ideas for interventions.
23
24
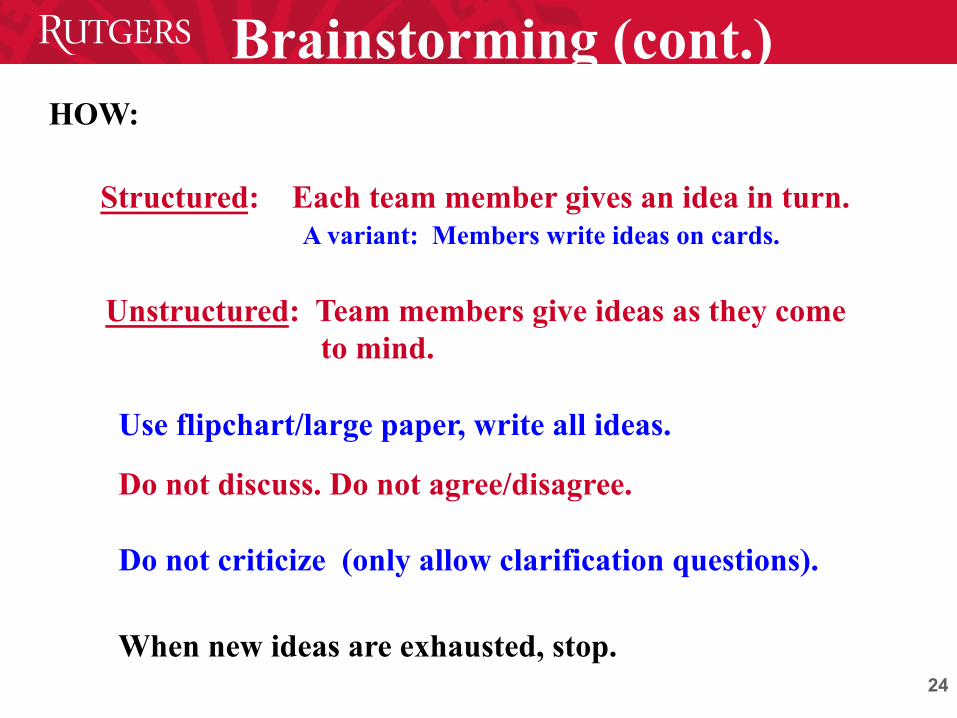
Brainstorming (cont.)
24
HOW:
Structured: Each team member gives an idea in turn. A variant: Members write ideas on cards.
Unstructured: Team members give ideas as they come to mind.
Use flipchart/large paper, write all ideas.
Do not discuss. Do not agree/disagree. Do not criticize (only allow clarification questions).
When new ideas are exhausted, stop.
25 26
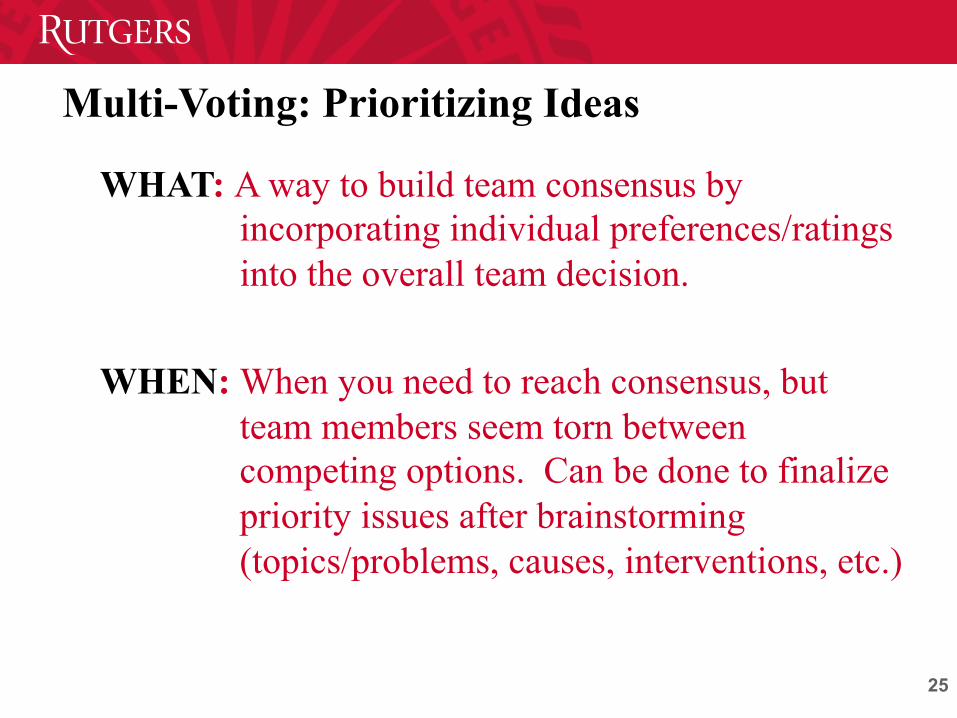
WHAT: A way to build team consensus by incorporating individual preferences/ratings into the overall team decision. WHEN: When you need to reach consensus, but team members seem torn between competing options. Can be done to finalize priority issues after brainstorming (topics/problems, causes, interventions, etc.)
Multi-Voting: Prioritizing Ideas

26
List all the options on a flipchart. Eliminate duplicates, or group similar items, clarify
meanings where/if necessary. Give each statement an identifier (a, b, c, etc.). Decide how many votes each member would have (3-5 is usual). Each team member (independently) places his/her
votes on an index card. Cards are collected, votes tallied on flipchart/large
paper. 26
Multi-Voting: Prioritizing Ideas
• •
• •
•
•
HOW:

27
Probable causes for no-show to MH appointment:
a. No transportation b. Have child care duties, no baby sitting c. Have medical doctor appointment d. Felt better, no need for MH services e. Forgot about the appointment
a . a . a . e . e.
b. e. e. c. a. 27
Example
a. 4 e. 4 b. 1 c. 1
Consensus: Two team member’s votes
28 29
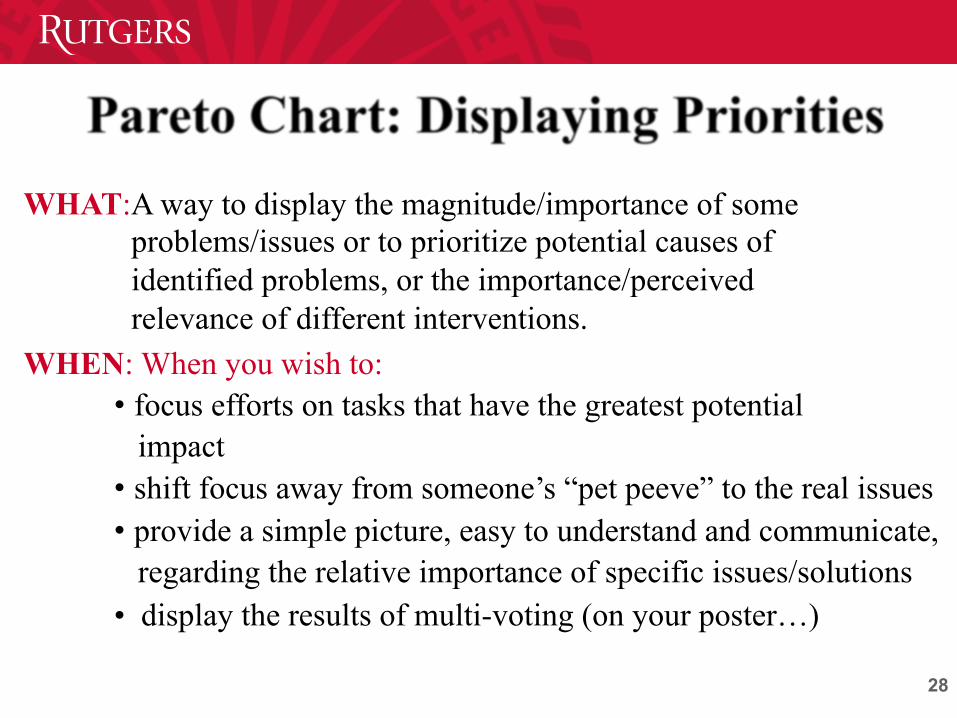
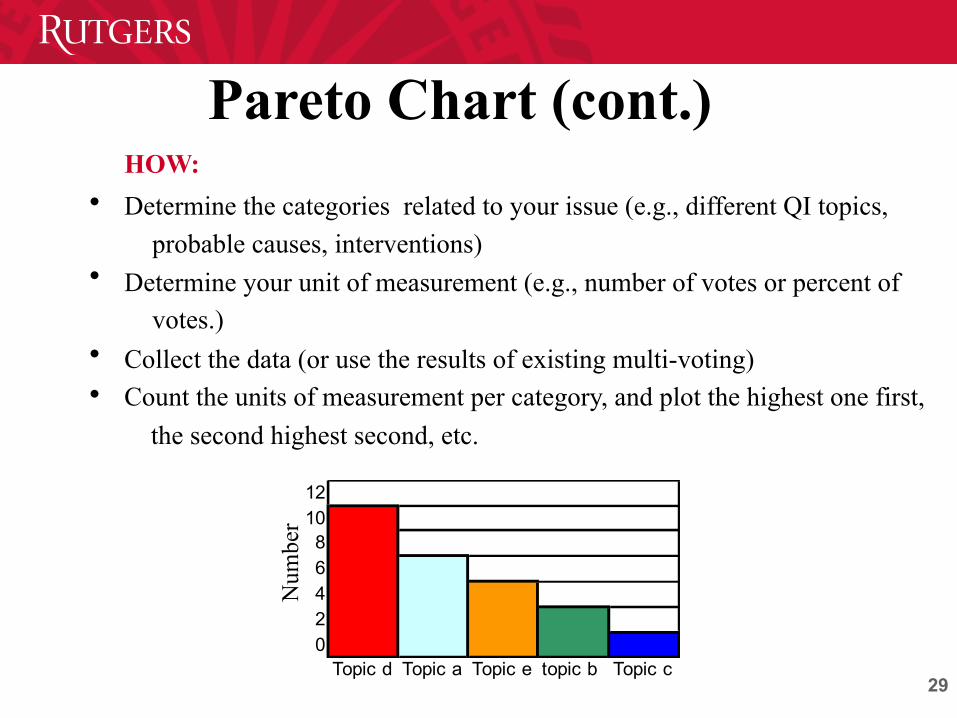
WHAT:A way to display the magnitude/importance of some problems/issues or to prioritize potential causes of identified problems, or the importance/perceived relevance of different interventions.
WHEN: When you wish to: • focus efforts on tasks that have the greatest potential impact • shift focus away from someone’s “pet peeve” to the real issues • provide a simple picture, easy to understand and communicate,
regarding the relative importance of specific issues/solutions • display the results of multi-voting (on your poster…)
29 30
Pareto Chart (cont.)
15
13
11
9
7
5
3
1
-1 Topic C
Num
ber o
f vot
es
HOW: Determine the categories related to your issue (e.g., different QI topics,
probable causes, interventions) Determine your unit of measurement (e.g., number of votes or percent of
votes.) Collect the data (or use the results of existing multi-voting) Count the units of measurement per category, and plot the highest one first, the second highest second, etc.
•
•
• •
121086420
Topic d Topic a Topic e topic b Topic c
Num
ber

30 31
Use the Three Process Tools to Identify Probable Causes of Your
Problem
Brainstorm a problem you want to address and/or the probable causes of the problem you identified
Prioritize the causes using multi-voting
Display your results in a Pareto chart
ON YOUR OWN…..
•
•
•
31
Cause & Effect Analysis: “Fishbone” Diagram
WHEN: When you need:
-- a simple, graphical way to explore and communicate possible causes
for an identified problem/event
-- to facilitate focusing on the main issues that need corrective action
WHAT: A formalized way to describe and prioritize potential causes to an
identified problem or event that:
-- focuses on the specific problem/event to be fixed
-- creates a snapshot of collective knowledge around a problem/event
-- focuses on potential causes, not symptoms
-- helps direct attention to possible interventions
32 33
HOW:
Work as a team Use a skeleton of a fishbone diagram (see next slide)
Place the identified problem or event in the box on the right
Decide on the major cause categories, and place them at the top of the main
“bones” (don’t plan on more than six) Brainstorm possible causes and place them all on the draft
Cause & Effect Analysis: “Fishbone” Diagram
• • • •
•
33
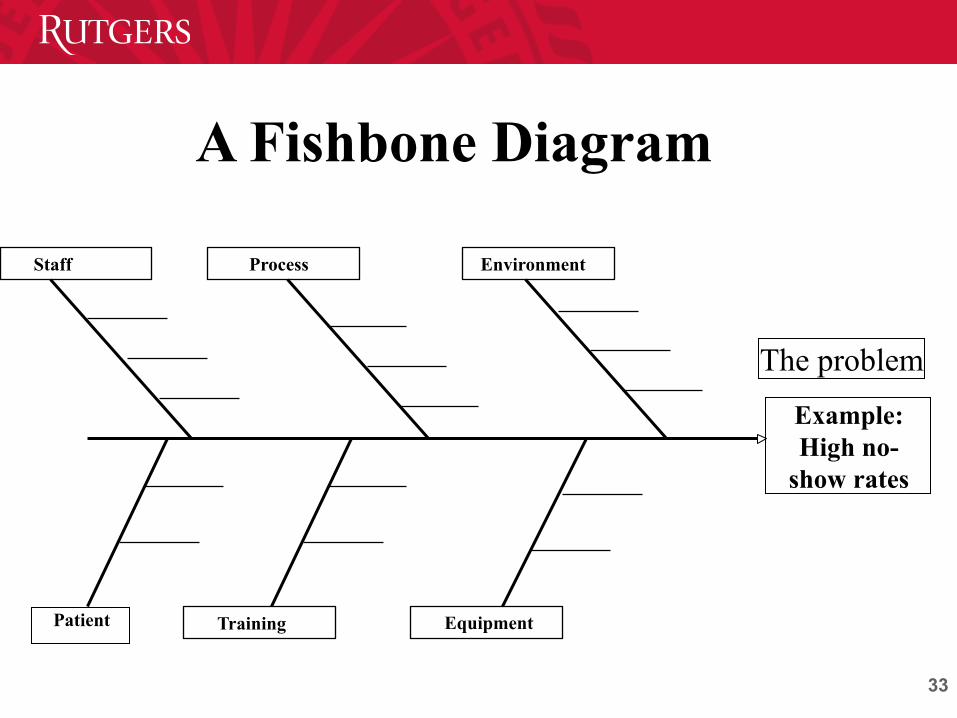
A Fishbone Diagram
Environment Staff Process
Equipment Training
The problem
Example: High no-
show rates
Patient

The problem
Communication Work Process Staff/Training
Resources Safety/security
Pt attempted suicide while
at APS
34
Pt arrived wo clin info/no chart
APS staff (+shift info)
Pt tranp. by police, not ambulance
No follow-up/ debriefing after pt left
ANM did not bring chart upon pt arrival.
Pt use of phone
Pt was not searched
Shoelaces not removed with belt
Control over pt whereabouts/ monitor in bathroom
Misinterpretation of clinical condition
Misinterpretation of clinical condition
Single nurse at APS needs coverage (ANM should get meds)
No holding room available at pt arrival
Single nurse at APS needs coverage 1:1 was not applied (ANM should get meds)
1:1 was not applied
No role definition for med team
Fishbone Analysis of Near Miss at APS, December 2005
Some items appear in several categories
1:1 was not applied
No staff assigned to other pts
No staff assigned to other pts.
1:1 was not applied

35
Flow Chart
35
WHEN: When you need to: -- understand what happened -- streamline a process -- design an intervention (in the right place) -- show change from past to the present -- share understanding about a specific event or process
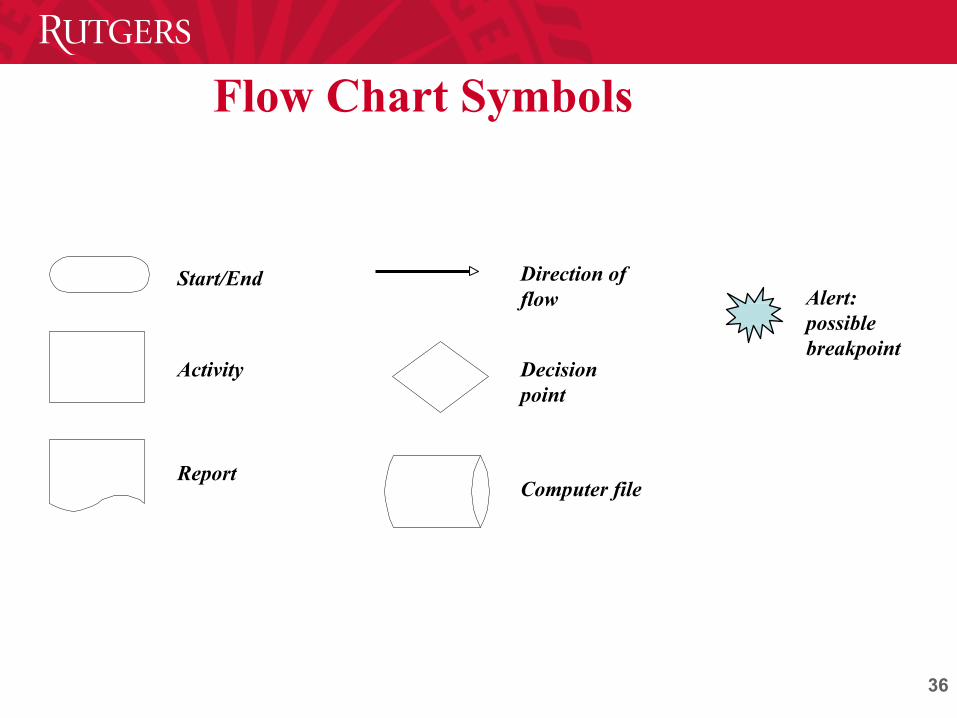
HOW: learn a few symbols ...can do by hand (but do not have to…) -- have input from all stakeholders -- do several drafts -- get consensus from all involved
WHAT:A formalized way to describe a process or an event
36
Flow Chart Symbols
Computer file
Start/End
Activity Decision point
Report
Direction of flow Alert:
possible breakpoint
36
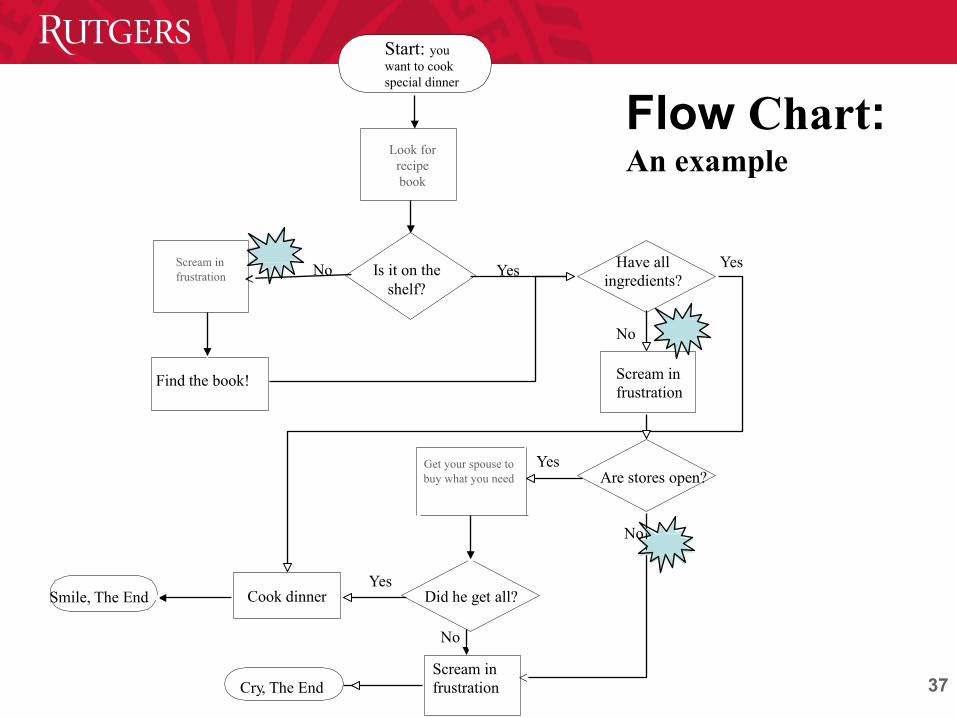
37 38
Start: you want to cook special dinner
Is it on the shelf?
Yes No Have all ingredients?
No
Scream in frustration
Are stores open?
Find the book!
Yes
Did he get all?
Scream in frustration
No
Yes Cook dinner Smile, The End
Cry, The End
Yes
No
Flow Chart: An example
Scream in frustration
Look for
recipe book
Get your spouse to buy what you need
38 39
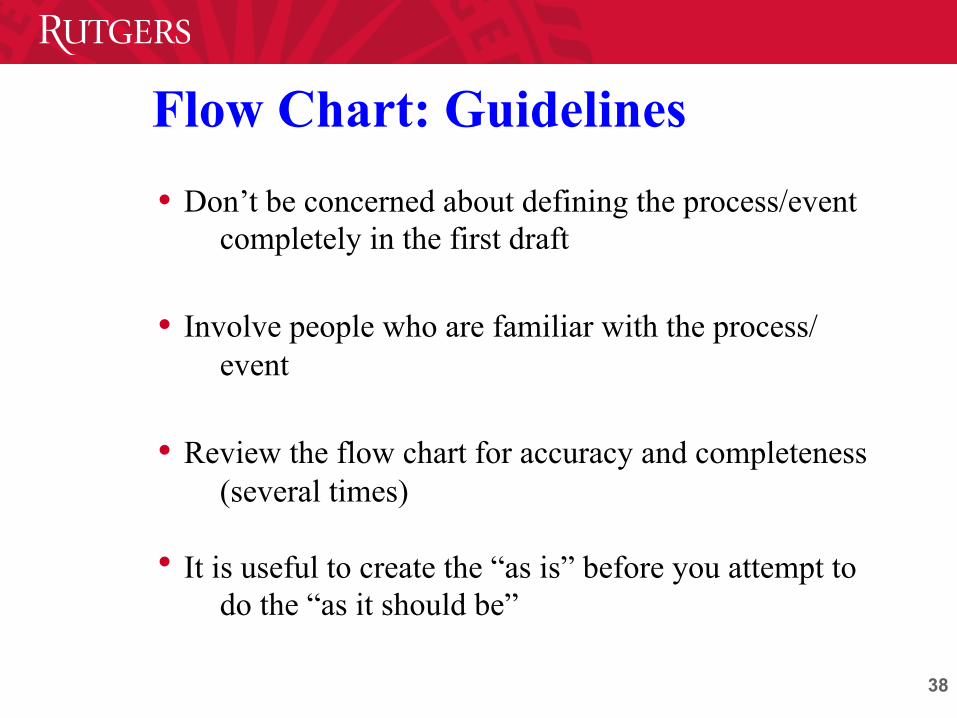
Flow Chart: Guidelines Don’t be concerned about defining the process/event
completely in the first draft Involve people who are familiar with the process/
event Review the flow chart for accuracy and completeness
(several times)
It is useful to create the “as is” before you attempt to do the “as it should be”
•
•
•
•

39
Improvement Planning Milestones
Before implementing the intervention, the team should have:
Clarified/specified the problem in need of
improvement
Established a baseline measurement Identified at least one probable significant cause
Considered several possible interventions that
address the identified cause
Selected a small set of interventions to start with
•
•
• •
•

40
Implementing Improvement
• Your interventions do not have to address ALL problems everywhere to be effective
Implement in small doses
• Monitor, measure and share even small performance improvements with peers, build acceptance and alliances
Sustainable improvement takes time
•
•

41
Data Display Tools
41

42
WHAT: Charting a specific measure over time.
For example, number of no-shows or restraints by quarter, number of patient falls by month, number of phone calls per day, number of BMI (BP) documented by month.
WHEN: When you want to:
monitor performance to detect trends or shifts, over time
compare a measure before and after an intervention
focus attention on changes in the process under scrutiny
42
•
•
•

43
HOW:
Select a performance measure
Gather enough data points (at least 20-30)
Create a graph with timeline on the horizontal axis (x axis)
and the measure on the vertical (y axis)
Plot the data points and connect them with a line (or use
PowerPoint to do it for you)
Calculate the mean for the measure and draw the line in your
graph
•
•
•
•
•

44
0
20
40
60
80
100
120
140
160
Q1
95
Q4
95
q3 9
6
Q2
97
Q1
98
Q4
98
Q3
99
Q2
00
Q1
01
Q4
01
Q3
02
Q2
03
Q1
04
Q4
04
Q3
05
Q2
06
Q1
07
Q4
07
Q3
08
Q2-
09
Q1-
10
Q4-
10
Q3-
11
Q2-
12
Q1-
13
Q4-
13
Q3-
14
Events
SECLUSIONS MEAN
SECLUSION RATES IN ADOLESCENT INPATIENT SETTING
Run Chart Example

45
Control Chart
45
WHAT: A way to look at run charts and facilitate recognition of meaningful variation.
WHEN: When you monitor ongoing performance measures and need to have a quick way to recognize trends or shifts that are meaningful or significant.
HOW: Develop a run chart, ensure you have enough data points
Calculate and plot the mean (central line)
Calculate the standard deviation (SD)
Add 1 SD to the mean to plot the upper control limit
Subtract 1 SD from the mean to plot the lower control limit Add 2 SD to the mean to plot the high upper (2 SD) control limit
•
•
•
•
•
•

46
-20
0
20
40
60
80
100
120
140
160
Q1 95Q3 9
5Q1 9
6q3 9
6Q1 9
7Q3 9
7Q1 9
8Q3 9
8Q1 9
9Q3 9
9Q1 0
0Q3 0
0Q1 0
1Q3 0
1Q1 0
2Q3 0
2Q1 0
3Q3 0
3Q1 0
4Q3 0
4Q1 0
5Q3 0
5Q1 0
6Q3 0
6Q1 0
7Q3 0
7Q1 0
8Q3 0
8Q1-0
9Q3-0
9Q1-1
0Q3-1
0Q1-1
1Q3-1
1Q1-1
2Q3-1
2Q1-1
3Q3-1
3Q1-1
4Q3-1
4
Percent
SECLUSIONS Mean 1SD 2SD -1SD
Control Chart Example
Lower control limit (-1SD)

47
Work Plans and Project Tracking
47
48 48
( if it was not documented, it was not done…)
Have a clear and consensual definition of your purpose (write it down…) Develop a work plan, with specific tasks,
responsibilities, and timeline (modify and revise
as you go along)
Have designated minutes-taker (you can rotate
the honor…) and facilitator (should be two
different people)
Document your QI Process •
•
•

49
Circulate minutes to members within a day or two
(keep it fresh…)
Keep all drafts used in your deliberations
(brainstorming lists, fishbone diagrams, flow
charts, Pareto charts, multi-voting results,
baseline data, etc.)
Document your QI team process
•
•

50
WORK PLANS : Two Examples What Who t1 t2 t3 t4 t5 t6 t7 t8 t9 t10
Task 1 Task 2 Task 3 Task 4
What Who Start date Due date Status (as of)
Task 1 Task 2 Task 3 Task 4
51
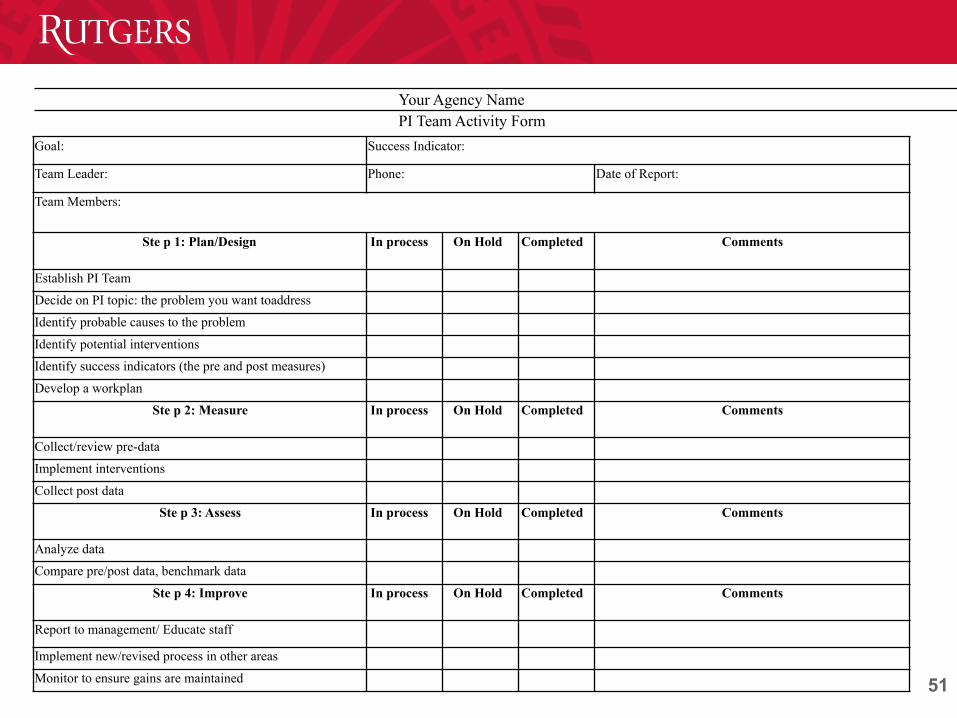
Your Agency Name PI Team Activity Form
Goal: Success Indicator:
Team Leader: Phone: Date of Report:
Team Members:
Ste p 1: Plan/Design In process On Hold Completed Comments
Establish PI Team
Decide on PI topic: the problem you want toaddress
Identify probable causes to the problem
Identify potential interventions
Identify success indicators (the pre and post measures)
Develop a workplan
Ste p 2: Measure In process On Hold Completed Comments
Collect/review pre-data
Implement interventions
Collect post data
Ste p 3: Assess In process On Hold Completed Comments
Analyze data
Compare pre/post data, benchmark data
Ste p 4: Improve In process On Hold Completed Comments
Report to management/ Educate staff
Implement new/revised process in other areas
Monitor to ensure gains are maintained

52
Use fewer words, more pictures; if you use words use large print.
Make the presentation colorful, vivid, interesting… (but don’t go overboard...)
Include enough detail to tell the story, but not too much (you will have a handout with details for those who are interested)
Plan your space well
Guidelines
•
•
•
•

53 54
(cont.)
Include in your poster:
The purpose of your project
Team members and their affiliation
Steps of the QI model you have used Methods used to select topic, and achieve
consensus on causes and interventions
A (short) description of your interventions
Baseline and outcome data and benchmarking
Conclusion/status/plans for the future
•
• •
•
• •
•

54 55
Do not read from your summary page (everyone knows how to read)
Keep it short, and stick to the main points. Keep eye contact with the audience, don’t hesitate to
express your enthusiasm. Consider your presentation an infomercial, a marketing
tool to whet audience appetite for more.
Guidelines for Your ORAL Presentation •
•
•
•

55
Listed below are the criteria we use to judge the QI projects:
A clear presentation of the purpose
A significant topic
Improving a high impact process
Appropriate team
A consistent, comprehensive planning process
Appropriate use of QI tools
Sound/explicit intervention and data-collection design
Evidence of commitment (future plans)
PROJECT JUDGING CRITERIA
• • •
• •
• • •

56
The main purpose of your project (the problem or process in need of improvement)
Your team members The methods used to arrive at prioritizing the problem, its probable
causes, and the proposed interventions A short description of your interventions Baseline and outcome data (your success indicators) and
benchmarking results, if available Conclusion/current status/plans for the future And it should not be longer then one page…
Required on One-Page-Summary •
•
•
•
• •
•

57 58
Submissions for the QI Fair
• Letter-of-intent (You will get information about its due date)
• If you have questions or need consultation regarding general QI issues or statistics, please e-mail [email protected]
• Final project: Poster and one-page summary