Embed Size (px)
Citation preview

1
PB 1643
Quality Deer ManagementGuidelines for Implementation
Agricultural Extension ServiceThe University of Tennessee

2
cover photo by Bill Lea

3
Contents
What is Quality Deer Management?
Age – The Determining Factor
Nutrition – A Manageable Agent
Genetics – The Underlying Infl uence
What Impact Can QDM Have on the Rut?
Implementing Sound Deer Management on Your Property
What Is the Best Restriction to Place on Buck Harvest?
What About Shooting Does?
What About Shooting Fawns?
Data Collection and Census Information
How Do You Age Deer by Looking at the Jawbone?
Using Infrared-triggered Cameras to Estimate Deer Populations
Examples of Quality Deer Management in Tennessee
Catoosa Wildlife Management Area
Southwest Quality Deer Management Cooperative
Rocky River Hunting Club
Conclusions
Acknowledgements
White-tailed Deer Kill Station Data Form
White-tailed Deer Observation Form
4
4
5
6
8
8
9
9
11
11
12
14
16
16
19
20
24
25
27
29

4
Quality Deer Management
H
Craig A. Harper, Associate ProfessorForestry, Wildlife and Fisheries
Guidelines for Implementation
What Is Quality Deer Management? istorically, deer managers have concentrated
on increasing deer populations by protecting antlerless deer from harvest. This approach helped restore deer populations from all-time lows in the early 1900s. Presently, the deer population in North America exceeds 30 million. Although deer populations may be low in some areas (e.g., the southern Appa-lachian region of east Tennessee and western North Carolina), deer herds are well established over most of their range and, in fact, are overpopulated in many areas. Today, progressive managers concentrate on improving herd quality where deer populations are established.
Quality deer management (QDM) is a strategy and philosophy that involves managing deer herds in a biologically and socially sound manner within exist-ing habitat conditions. Simply put, QDM is sound deer management. QDM is not trophy deer management, where emphasis is placed on producing bucks with ant-lers large enough to qualify for the Boone and Crockett (B&C) Record Book. Also, QDM is not just about shooting does. QDM encourages active participation in an antler-less deer harvest where appropriate and advocates the protection of young bucks. The recommended ant-lerless harvest should be determined by deer density, sex ratio, habitat conditions and landowner objectives. Hunters practicing QDM, in essence, become managers by improving the age structure (allowing yearling bucks to survive to maturity) and sex ratio (harvesting adequate numbers of does), managing the habitat and keeping detailed records on deer observed and killed.
It is also important to realize QDM is not about put-ting a “monster buck” behind every tree. Further, prac-ticing QDM will not necessarily make the deer on your property look like those from Alberta, Wisconsin, Illinois, or south Texas. Every area has its own limitations, from
the genetic makeup of the deer herd to soil fertility to land-use practices (with many others in between). As a hunter/landowner interested in managing deer, you must realize these limitations and concentrate on allowing the deer herd in your area reach its potential, without unrealistic expectations. Managing a deer herd is com-plex and infl uenced by many factors, many of which are not fully understood. Nonetheless, there are three factors that greatly infl uence a deer management program: age, nutrition and genetics.
Age — The Determining FactorAge structure is arguably the most important fac-
tor in a quality deer herd. The presence of mature deer helps ensure normal social behavior within the herd. Mature bucks and does maintain a dominance hierarchy, whereby the “fi ttest” bucks do the majority of breeding and the older does command the best habitats, providing increased recruitment and higher fawn survival.
In many areas across the country, more than 80 percent of the bucks harvested annually are yearlings (1½ years old). In other words, if a deer with antlers (of any size) walks out, it is shot. How can you expect to see mature bucks on your property when they are shot at 1½ years old? As one writer put it, “There is no such thing as a big spike, and a dead one won’t grow!” Bucks achieve maximum skeletal growth at 2½ years old, but do not reach their peak weight until 4½ or 5½. Further, maximum antler length and weight are not reached until bucks are 5½ to 6½ years old.
A common response by hunters regarding QDM is: “If I let a small buck walk by, someone else will shoot it.” That may be true, especially if the property is relatively small (<2000 acres), broken-up, or linear in shape. The attitudes and practices of hunters on adjoining proper-ties defi nitely affect deer management on small areas.

5
Each property contains a set amount of resources, which can support a limited number of animals. The resource in limited supply determines the carrying capacity of that property. The browse line evident in this photo indicates the deer herd has exceeded the carrying capacity. In this example, food is a limiting factor.
Relatively small areas (<2,000 acres) are not large enough to encompass home ranges of several bucks. Thus, these deer spend a con sid er able amount of time on adjacent properties.
property boundary
individual buck home range
Although small properties are not large enough to contain home ranges of several bucks, a successful deer man-agement program is possible. Cooperation is the key. If the property you hunt is relatively small, talk to neighbors and encourage them to form a deer management cooper-ative. Many hunters/landowners have reported that when they began harvesting larger deer, QDM became conta-gious and adjoining landowners wanted to know how they could get in on the action. The old adage, “Nothing ven-tured, nothing gained,” certainly applies here. For every movement away from tradition, there must be a leader. For your area, that may be you.
Nutrition — A Manageable AgentAvailable nutrition varies widely from area to area
and infl uences body size, antler size, reproductive suc-cess, fawn survival and timing of the rut. It is important to realize body growth, maintenance and survival of an individual (buck or doe) takes precedence over antler growth, fawn production and lactation. For example, a buck restricted to a diet averaging 10 percent protein will not achieve optimal antler growth. Likewise, healthy adult does (> 2½ years old) normally produce two fawns per year; however, a mature doe in poor physical condition may give birth to only one fawn per year, if she gives birth to any at all. Once born, fawns nursing malnourished does may suffer increased mortality because of inad-equate milk production. Studies have shown survival of fawns from malnourished does can be less than 10 per-cent, whereas fawn survival from healthy, well-nourished
does may exceed 95 percent. Poor nourishment also can affect (delay) the timing of estrus and increase the gestation period. When estrus is delayed, date of birth is delayed. Gestation periods for underfed does may be ex-tended by a week or more. Fawns born later in the sum-mer (July – September) do not have as much time to grow and build fat reserves as those fawns born earlier (May – June). This infl uences survival through the fi rst winter, the percentage of doe fawns that reproduce and antler growth of buck fawns the following year (as yearlings).
Providing adequate nutrition to the deer herd re-quires maintaining the population in balance with the available habitat. Often, this requires shooting does, which goes against tradition in some areas and has been met with resistance. This mentality originated when deer numbers were low and populations were being established through restocking efforts. Today, where populations have been re-established, an antlerless deer harvest is not detrimental — it is necessary! As Tennes-see was being settled, “natural” predators of deer (e.g., mountain lions, red wolves, black bears, bobcats) were eradicated or severely reduced in number. Now, regu-lated hunting is the primary means of keeping the deer population in balance with the available habitat. When deer populations exceed the land’s carrying capacity, other wildlife species suffer as well. Overabundant deer can decimate the forest understory, which negatively af-fects the food, cover and structural requirements of other species, including wild turkeys, ruffed grouse, songbirds, small- and mid-sized mammals, salamanders, and rap-tors. In effect, a poorly managed deer herd can alter the entire forest community.

6
AREA A:Population above carrying capacity-
low recruitment
AREA B:Population below carrying capacity-
high recruitment
Buck
Doe
Buck
Buck
Doe
Doe
Buck
Buck
Doe
Doe
Buck
By keeping the deer population below the carrying capacity of the available habitat, more forage (nutrition) is available per deer. Thus, does are healthier, reproductive success is higher and more does are able to carry two fawns. Ironically, this can result in a greater deer harvest each year. Depending on the relationship of the popula-tion and the carrying capacity, an “optimum sustained yield” can be achieved where a relatively high reproduc-tive rate allows an abundant harvest each fall. With high-quality habitat and increased nutrition, the percentage of doe fawns that breed their fi rst fall increases (sometimes up to 25 percent). Also, a higher percentage of yearling does produce two fawns instead of one. Because fawns are born at approximately a 1:1 sex ratio, more bucks may be born each year. Therefore, in some areas, you actually can increase the number of bucks born by shooting more does.
Along with population management, habitat manage-ment is essential to ensure deer receive optimum nutri-
When deer populations are above carrying capacity, the number of fawns born per doe is reduced. This is dictated by available nutrition and stress. When populations are kept below carrying capacity by including does in the harvest, available nutrition is increased and more fawns are born per doe. In Area A, only three fawns per 10 does are born annually. On Area B, more than twice as many fawns are born each year from HALF as many does. The optimum sustained yield is that harvest level where the population is kept below carrying capacity and recruitment is at its highest. Note that both populations shown above have an equal number of deer. Where populations are established, this type of management requires a certain number of does to be killed each year.
tion. To provide increased nutritional benefi ts to a deer herd, 2 to 5 percent of a management area may need to be planted in quality warm- and cool-season food plots (as opposed to tall fescue or orchardgrass) properly distributed across the property (see Planting Chart for Wildlife Food Plots in Tennessee, SP 550-A). This strategy helps prevent overgrazing and provides nutrition on a year-round basis, especially during late summer and late winter stress periods. Other habitat management practices that can improve the quantity and quality of for-age available to deer (thus increasing carrying capacity) include: forest management (e.g., timber harvest and/or thinning), controlled burning (both old fi elds and woods — especially after thinning), using selective herbicides, and planting soft and hard mast-bearing shrubs and trees (especially in hedgerows designed to break-up fi elds larger than two acres).
Genetics — The Underlying Infl uence Factors infl uencing genetic quality are complex. It is important to realize genetic traits are determined and passed on by both sexes, not just males. Antler characteristics, as well as other physical traits, are genetically based but infl uenced by environmental factors. That is, the genetic potential of any deer herd can never be expressed until adequate nutrition is available and the animals are able to reach maturity within a sound social structure. The most-discussed topic regarding genetics is whether or not spike yearling bucks are genetically “inferior” to fork-antlered yearlings. Several studies have addressed this question and researchers are not in complete agreement. Some claim larger-racked yearlings (6 – 8 points) produce antlers with a higher average gross B&C score and more mass at maturity than small-racked yearlings (spikes and forkhorns). Other studies have suggested these smaller yearlings are the result of later birthing dates, young age and/or inadequate nutrition — not genetics — and that there is little to no difference in antler score or mass once those bucks reach 3½ and 4½ years of age. Nonetheless, the question remains: Should spikes be culled in a QDM program? To answer that question, other questions should be addressed and several factors taken into consideration. To begin, how many acres are being managed? If the area cannot “contain” the majority of dispersing yearling bucks, those 6- and 8-point yearlings not culled may be moving > 3 – 5 miles away during or after the hunting season, never to return. Concurrently, spikes from neighboring properties are likely moving in and establishing home ranges on that same property where

7
photos by Dr. Harry Jacobson
Do you think spikes should be “culled” ? This photo sequence shows the progression of a buck that produced spike antlers as a yearling. This is a wild, free-ranging deer, not one in a fenced-in area. By the time he was 3½ he had “caught-up” with the other bucks in his age class. Note the increased mass at 4½ years. This is what is possible when deer are allowed to express their genetic potential, but they have to reach maturity! This photo sequence is a common scenerio and provides evidence that spikes should not be culled in a QDM program.
Progression of Buck No. 40 – note the ear tag in each of the photos
1 1/2 yrs. old
2 1/2 yrs. old
3 1/2 yrs. old
4 1/2 yrs. old
other spikes were culled. If spikes are culled, were they born on that property (with adequate nutrition) or born several miles away on another property (where habitat management has not been practiced and nutrition is a limiting factor)? In terms of genetic potential, those deer could be equal! Is adequate nutrition available to the deer herd, especially during stressful periods (late summer, late winter)? In areas with poor habitat, spike yearlings are quite common. One study in Florida found all yearling bucks were spikes. In this scenario, if spikes were culled, eventually there would be no deer! Even on properties with quality habitat, available nutrition can be a limiting factor during years with poor rainfall, which can affect the percentage of spike yearlings in the buck population. Is the social structure sound, or is the herd overpopulated and skewed heavily in favor of does? Many deer herds are never able to express their genetic potential because the vast majority of the buck population are yearlings. In this situation, nearly every buck has the opportunity to breed, and yearling bucks (not necessarily the dominant, most vigorous bucks as nature intended) are able to breed the majority of does. Overpopulation obviously limits nutrition, but too many animals also can limit animal performance in other ways. As deer density increases, stress does also, which can negatively affect the physical and physiological condition of the herd. Studies in Michigan showed social stress within high-density deer herds led to decreased antler size and a higher percentage of short spikes as yearlings, even when an overabundance of high-protein supplemental feed (pellet ration) was available year-round. Can hunters on the management area (hunting club or lease) recognize a 10-point difference in antler score? That is, would a 4½-year-old buck (that was an 8-point yearling) scoring 130 B&C points be “greater” than a 4½-year-old buck (that was a spike yearling) scoring 120 B&C points? What is “statistically greater” may not be different at all in the hunters’ eyes. And, it certainly does not mean the animal is “inferior.” It is relatively common to hear of a buck with “huge” antlers that was defeated in a fi ght and driven off by another mature buck with a smaller rack. This is where the tire meets the road. The buck that breeds is the “superior” animal, the one passing on his genetic traits!
8
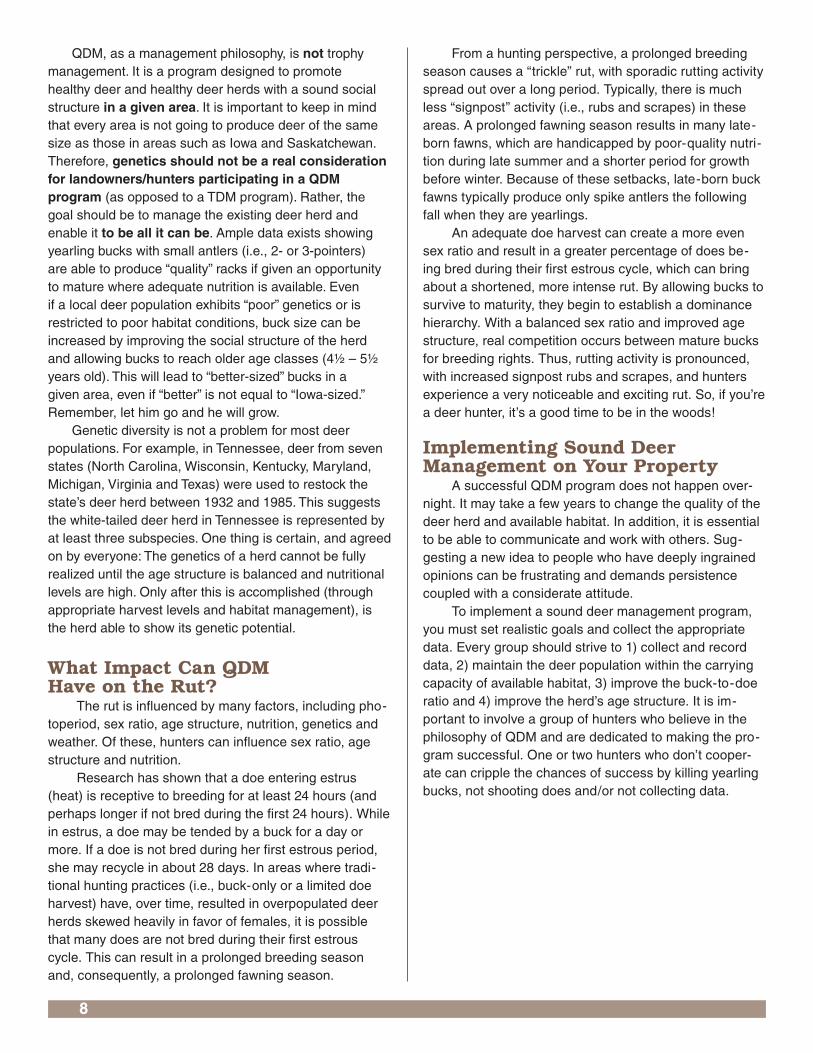
What Impact Can QDM Have on the Rut?
The rut is infl uenced by many factors, including pho-toperiod, sex ratio, age structure, nutrition, genetics and weather. Of these, hunters can infl uence sex ratio, age structure and nutrition.
Research has shown that a doe entering estrus (heat) is receptive to breeding for at least 24 hours (and perhaps longer if not bred during the fi rst 24 hours). While in estrus, a doe may be tended by a buck for a day or more. If a doe is not bred during her fi rst estrous period, she may recycle in about 28 days. In areas where tradi-tional hunting practices (i.e., buck-only or a limited doe harvest) have, over time, resulted in overpopulated deer herds skewed heavily in favor of females, it is possible that many does are not bred during their fi rst estrous cycle. This can result in a prolonged breeding season and, consequently, a prolonged fawning season.
From a hunting perspective, a prolonged breeding season causes a “trickle” rut, with sporadic rutting activity spread out over a long period. Typically, there is much less “signpost” activity (i.e., rubs and scrapes) in these areas. A prolonged fawning season results in many late-born fawns, which are handicapped by poor-quality nutri-tion during late summer and a shorter period for growth before winter. Because of these setbacks, late-born buck fawns typically produce only spike antlers the following fall when they are yearlings.
An adequate doe harvest can create a more even sex ratio and result in a greater percentage of does be-ing bred during their fi rst estrous cycle, which can bring about a shortened, more intense rut. By allowing bucks to survive to maturity, they begin to establish a dominance hierarchy. With a balanced sex ratio and improved age structure, real competition occurs between mature bucks for breeding rights. Thus, rutting activity is pronounced, with increased signpost rubs and scrapes, and hunters experience a very noticeable and exciting rut. So, if you’re a deer hunter, it’s a good time to be in the woods!
Implementing Sound Deer Management on Your Property
A successful QDM program does not happen over-night. It may take a few years to change the quality of the deer herd and available habitat. In addition, it is essential to be able to communicate and work with others. Sug-gesting a new idea to people who have deeply ingrained opinions can be frustrating and demands persistence coupled with a considerate attitude.
To implement a sound deer management program, you must set realistic goals and collect the appropriate data. Every group should strive to 1) collect and record data, 2) maintain the deer population within the carrying capacity of available habitat, 3) improve the buck-to-doe ratio and 4) improve the herd’s age structure. It is im-portant to involve a group of hunters who believe in the philosophy of QDM and are dedicated to making the pro-gram successful. One or two hunters who don’t cooper-ate can cripple the chances of success by killing yearling bucks, not shooting does and/or not collecting data.
QDM, as a management philosophy, is not trophy management. It is a program designed to promote healthy deer and healthy deer herds with a sound social structure in a given area. It is important to keep in mind that every area is not going to produce deer of the same size as those in areas such as Iowa and Saskatchewan. Therefore, genetics should not be a real consideration for landowners/hunters participating in a QDM program (as opposed to a TDM program). Rather, the goal should be to manage the existing deer herd and enable it to be all it can be. Ample data exists showing yearling bucks with small antlers (i.e., 2- or 3-pointers) are able to produce “quality” racks if given an opportunity to mature where adequate nutrition is available. Even if a local deer population exhibits “poor” genetics or is restricted to poor habitat conditions, buck size can be increased by improving the social structure of the herd and allowing bucks to reach older age classes (4½ – 5½ years old). This will lead to “better-sized” bucks in a given area, even if “better” is not equal to “Iowa-sized.” Remember, let him go and he will grow. Genetic diversity is not a problem for most deer populations. For example, in Tennessee, deer from seven states (North Carolina, Wisconsin, Kentucky, Maryland, Michigan, Virginia and Texas) were used to restock the state’s deer herd between 1932 and 1985. This suggests the white-tailed deer herd in Tennessee is represented by at least three subspecies. One thing is certain, and agreed on by everyone: The genetics of a herd cannot be fully realized until the age structure is balanced and nutritional levels are high. Only after this is accomplished (through appropriate harvest levels and habitat management), is the herd able to show its genetic potential.

9
One of the most reliable harvest restrictions used to protect yearling bucks is a spread restriction of 15 inches — the approx-imate distance from ear tip to ear tip. Point restrictions (e.g., 3 or 4 points on a side) may protect spikes and forkhorns, but not those yearlings with the highest potential for the following year (i.e., “basket-racked” 6- and 8-pointers). The yearling buck pictured above would not be harvested with a 15-inch spread restriction. Regardless, restrictions implemented should be based upon antler characteristics of bucks in the managed area.
15˝
What is the Best Restriction to Place on the Buck Harvest?
The most popular restrictions used to protect year-ling (1½ years old) bucks and many 2½-year-old bucks include point restrictions (i.e., a buck has to have a certain number of total points or points to a side before it can be taken) and spread restrictions (i.e., only bucks whose antler spread is greater than a predetermined width can be taken). There is no best restriction for all areas. Restrictions implemented in a particular area should be based upon the antler characteristics of bucks in that area. This cannot be determined until data have been gathered over one or two years. For example, in one area, an 8-point limit may effectively protect all of the yearling bucks and 50 percent of the 2½-year-olds. In another area, 30 percent of the yearling bucks may have 8 points or more; therefore, this restriction would allow cropping yearling bucks with the highest potential for the following year. If available, data collected by state wildlife offi cials (or other hunting clubs) from bucks killed in sur-rounding areas may be used. In general, for most areas, a spread restriction of 15 inches (the approximate distance from ear tip to ear tip has been very effective in protecting more than 95 percent of the yearling bucks and, in some cases, as much as 40 percent of the 2½-year-old buck population. How much of the 2½-year-old population you wish to protect is up to you. That is, use restrictions that best help you meet your management goals and objectives.
To maintain a sound deer management program, the average age of bucks killed should exceed 2½ years. Obviously, if yearling bucks are not shot, the average age of bucks killed will be above 2½ years. The dressed weight of 2½-year-old bucks in Tennessee should exceed 110 pounds. If the average dressed weight is below 130 pounds, nutrition is probably limited. This may be a result of overall poor habitat (e.g., vastly forested areas with little early regeneration available) or an increasing deer density that has reached carrying capacity, or it may be from natural fl uctuations in available nutrition following certain weather conditions (e.g., reduced rainfall limiting forb production). If excessive browsing is evident, the doe harvest should be increased.
Restrictions for buck harvest should not be set in stone, especially in areas where the deer population needs to be lowered. After a few years of implementing a QDM program, the average size of yearling and 2½-year-old bucks should increase. Increased nutrition (provided through habitat management and/or an appropriate doe harvest where needed) coupled with earlier fawning dates (late May – early June) should produce an increase in the average number of points and average spreads among these age classes.
One last point to consider when implementing a deer management program is to have fun! Do not get so caught up in adhering to restrictions that hunting is not enjoyable. Although some type of fi ne or penalty may be required to keep hunters from killing “non-legal” bucks, these penalties can cause some members to become disenchanted and lose interest in the program. Each club should think carefully when setting guidelines and rules. Even experienced hunters occasionally make mistakes. Consider youngsters. It may be more important to allow a child who has never killed a deer before to shoot a fork-horn, if it is the only opportunity, than to let the deer pass by. Only you can make that call.
What About Shooting Does?A major objective in a sound deer management
program is to establish and maintain a 1:1 adult sex ratio. This is achieved through a doe harvest. Because a 1:1ratio can be diffi cult to reach, it may be more realistic to strive for a 1:2 buck to doe ratio, at least initially. The effect of a doe harvest is related to deer density, sex ratio and habitat quality. Where there are well-established deer populations, a general rule is to shoot 1 doe per 50 – 100 acres each year. The goal is to maintain the deer herd be-low carrying capacity and keep recruitment high. At least 80 percent of the does harvested should show sign of lactation, or being “in milk.” This indicates a high level of productivity. If the lactation rate is below 80 percent, deer
10
density may be too high for the available habitat and an increased doe harvest may be recommended. Be aware that increased fawn mortality can make the lactation rate appear low. To determine if does have been lactat-ing, strip the teats or cut into the udder and check for the presence of milk. Use caution when determining lactation rates because sign of lactation depends entirely on timing. Approximately one month after fawns have been weaned, milk remaining in the udder will begin drying-up. Depending on the timing of the rut and deer density, does may continue to nurse fawns into September or October; thus, lactation may be evident later in some areas than others. Be careful not to determine lactation is low by examining does that might have already dried-up.
Some folks fear if they shoot a doe with a fawn, the fawn will die of starvation. Fawns usually double their birth weight at roughly 2 weeks, begin grazing soon after and triple their birth weight by the time they are 1 month old. They become functional ruminants when they are approximately 2 months old and are essentially weaned by 10 weeks of age—about the time they lose their spots. Research has shown survival of orphaned fawns is not affected once they have become functional ruminants, at which time they normally weigh 30 pounds or more. In ar-eas with overabundant deer populations and skewed sex ratios, it is not uncommon to observe fawns with spots into September and October.
Another factor to consider is that adult does normally force their buck offspring to disperse by the time he is 18 months old. Research has shown yearling buck dispersal takes place primarily in late spring/early summer (when 12 months old) or the following fall (when approximately 18 months old). Dispersing bucks typically establish their home range several miles from where they were born. This is nature’s way of preventing inbreeding. Buck fawns whose mothers were killed during the hunting season may remain in that area because the doe is no longer a factor in dispersal.
Research has shown the number of fawns per doe increases with age (the average number of fetuses per doe is consistently higher among does 3½ years old and older). It is also known that mature does command the best habitats during the fawning and nursing periods,
while younger does may be relegated to sub-optimal habitats through competition. Thus, more mature does may produce larger, healthier fawns. Experience helps them better protect their fawns from predation, which leads to increased fawn survival. As a result, it is certainly not necessary, and may not be advisable, to selectively shoot older does.
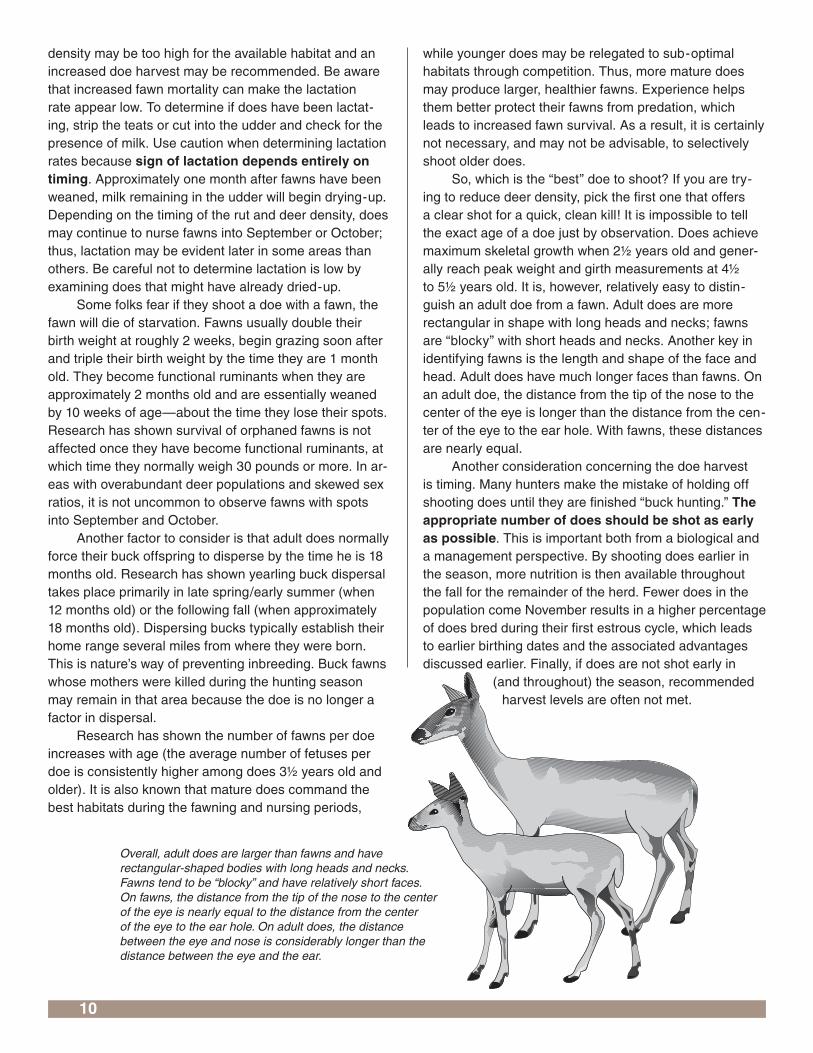
So, which is the “best” doe to shoot? If you are try-ing to reduce deer density, pick the fi rst one that offers a clear shot for a quick, clean kill! It is impossible to tell the exact age of a doe just by observation. Does achieve maximum skeletal growth when 2½ years old and gener-ally reach peak weight and girth measurements at 4½ to 5½ years old. It is, however, relatively easy to distin-guish an adult doe from a fawn. Adult does are more rectangular in shape with long heads and necks; fawns are “blocky” with short heads and necks. Another key in identifying fawns is the length and shape of the face and head. Adult does have much longer faces than fawns. On an adult doe, the distance from the tip of the nose to the center of the eye is longer than the distance from the cen-ter of the eye to the ear hole. With fawns, these distances are nearly equal.
Another consideration concerning the doe harvest is timing. Many hunters make the mistake of holding off shooting does until they are fi nished “buck hunting.” The appropriate number of does should be shot as early as possible. This is important both from a biological and a management perspective. By shooting does earlier in the season, more nutrition is then available throughout the fall for the remainder of the herd. Fewer does in the population come November results in a higher percentage of does bred during their fi rst estrous cycle, which leads to earlier birthing dates and the associated advantages discussed earlier. Finally, if does are not shot early in
(and throughout) the season, recommended harvest levels are often not met.
Overall, adult does are larger than fawns and have rectangular-shaped bodies with long heads and necks. Fawns tend to be “blocky” and have relatively short faces. On fawns, the distance from the tip of the nose to the center of the eye is nearly equal to the distance from the center of the eye to the ear hole. On adult does, the distance be tween the eye and nose is considerably longer than the distance between the eye and the ear.

11
Buck fawn Doe fawn
Distinguishing buck fawns from doe fawns and yearling does (11/2 years old) sometimes can be accomplished by studying the shape of the head. The top of the head of buck fawns appears “fl attened” as pedicels develop. The top of the head is more rounded on doe fawns and yearlings. Be aware that buck fawns may be larger than doe fawns; therefore, size is not always an indicator of sex or age.
What About Shooting Fawns?Fawns suffer the highest annual mortality rate of any
age class. A considerable amount of this mortality takes place in winter, especially up North and in other areas where the carrying capacity has been exceeded and relatively little winter food is available. In these situations, fawns offer a “surplus” for hunters—deer that are going to die anyway. It has been argued that when fawns comprise a relatively large proportion of the antlerless harvest, it allows the age structure of the does to increase while keeping the population stable. This may be desirable in areas where the deer population is not out of balance with the available habitat. Then, the benefi ts of having an older age-class of does can be realized. Regardless, fawns provide superior table fare!
The problem is if fawns are killed, some of them are going to be buck fawns (“button bucks”). This is not desir-able from a buck recruitment point of view. Nonetheless, some buck fawns are going to be included in the antler-less harvest, so care should be taken to keep this number as low as possible. In fact, in most states, 20 – 25 percent of the antlerless harvest is comprised of buck fawns. However, when hunters are informed how to identify buck fawns, their percentage in the annual antlerless harvest may drop to 5 percent or lower. Buck fawns sometimes can be distinguished from doe fawns by the shape of their head. Developing antler bases on button bucks give the appearance of a “fl attened” head, while the top of the head is more rounded on doe fawns. Do not judge the sex of fawns by the presence of “buttons,” as only 5 to 10 percent of buck fawns produce polished button antlers during their fi rst autumn. For those that do, it usually does not occur until December and they are normally shed in March.
To avoid killing buck fawns, it is wise not to shoot “lone” antlerless deer, especially when hunting over a food plot. Buck fawns often are the fi rst deer to appear in a fi eld to feed. Conversely, while traveling single-fi le in the woods, the lead doe usually is the dominant animal in the doe group. Deer are curious by nature, and oftentimes when spooked, will circle downwind to investigate the “problem.” Often, the dominant doe leads this investiga-tion. When all the deer in a doe group appear to be the same size and you are unsure of which animal to take, watch for behavioral clues. Adult does may be aggres-sive, or seem overly wary, while fawns are sometimes playful, chasing each other around. Again, some buck fawns are going to be shot each year accidentally. How-ever, allowing yearling and 2½-year-old bucks to survive to the next age class is more important to the overall program than accidentally shooting a few buck fawns.
Data Collection and Census InformationA deer management program is no better than the
data collected — it is the key to evaluating your success. It is important to keep accurate records on each deer killed every year and to seek assistance from wildlife biologists who are knowledgeable concerning deer popu-lation dynamics to decipher data and provide harvest recommendations. Data from deer killed should include date, deer identifi cation number, sex, age (jawbone), weight, lactation and antler measurements (Form 813 in the back of this publication). Dressed weight, especially among fawns and yearlings, is a better indicator of overall herd condition than live weight. Collecting these data is much easier if a well-equipped check station is estab-lished on or near the property (see The Hunters’ Guide to a Successful Hunting Lease, PB 1709). All hunters should be required to bring every deer they kill on the area by the check station. This should be a place where the hunters want to come! The check station should be easily accessible, well-lighted, have running water and an area where deer can be raised for weighing, dressing and/or skinning. Scales and jawbone pullers should be available with a hanging wire basket to place numbered and labeled jawbones. Also, a secure, weatherproof box or other structure should be maintained to keep data sheets. Materials needed to equip a check station are available through the Quality Deer Management Associa-tion (QDMA; 1-800-209-3337) or Forestry Suppliers, Inc. (1-800-647-5368). Biologists will provide assistance with aging jawbones if they are collected and numbered.

12
How Do You Age a Deer by Looking at the Jawbone?
Two methods are commonly used to age deer — the cementum annuli technique and the tooth replacement
and wear technique. The cementum annuli technique is similar to aging a tree by counting growth rings. As a deer
ages, enamel is deposited on the external root surface of the teeth. Deposition is affected by stress brought on
by seasonal and physiological changes. This technique requires specialized laboratory equipment — cutting a
cross section of the tooth, coloring the tooth with dye and inspection under a microscope. This takes time and is
relatively expensive to have performed. Thus, the vast majority of deer killed are aged based on the tooth replace-
ment and wear technique, which requires only a jawbone be removed or the cheek cut away so the teeth can be
inspected closely.
The tooth replacement and wear technique is based on which teeth are present in the jawbone and how much
wear they have received. A jaw from a healthy adult white-tailed deer has eight teeth — two incisors, three pre-
molars and three molars. The incisors are the teeth found in the front of a deer’s mouth. Premolars and molars are
located along the side of the jaw. Incisors are separated from premolars and molars by a wide gap, called the dia-
stema. [Note: deer do not have any top front teeth (incisors), only a rough palate. As a result, vegetation bitten off
by deer appears to have been torn off and has a rough edge — as opposed to vegetation snipped off by rabbits or
groundhogs, which is clean and smooth. This is because rabbits and groundhogs (like squirrels and beavers) have
both top and bottom incisors, which they use to “cut” vegetation. This can help you identify what animal is browsing
in your woods, food plots or garden.] By determining which teeth are present, a deer can be separated into one of
three age classes — fawn, yearling or adult. This is very straightforward and easy to recognize with a little practice.
Aging a deer past 2½ years requires more practice and experience for an accurate estimation. Here, you will learn
how to age a deer as a fawn, yearling or adult.
Fawns will have only three or four fully erupted teeth along the side of each jaw. The fi rst three are temporary
premolars (P1, P2, and P3) and are called “milk teeth” since deer are born with these teeth. Note the 3rd premolar
(P3). It has three crests — this will be important later. If a 4th tooth is present, it is the 1st molar (M1). If there are
only three or four fully erupted teeth along the jaw, it is a fawn.
Yearlings should have six fully erupted teeth along the side of each jaw. If the deer was born late or if killed
early in the hunting season, the 3rd molar (M3) may not be fully erupted. Nonetheless, six teeth should be present
along the jaw. The premolars (milk teeth) have not been replaced yet (this usually occurs after 18 or 19 months of
age). Note the 3rd premolar (P3). It has not been replaced by a permanent P3 yet; thus, it still has three crests. If
the jawbone has six teeth along the side and P3 has three crests, it is a yearling (1½ years old).
Adult deer >2½ years old will have six fully erupted teeth along the side of each jawbone, including three
permanent premolars and three permanent molars. Once again, note P3. It is now a permanent tooth and has only
two crests. This is the key to identifying adult deer from yearlings. If the jawbone has six teeth along the side and
P3 has two crests, it is (most likely) an adult deer. If the animal was an early-born fawn or killed late in the hunting
season (into January), it is possible that a yearling could have a P3 with two crests. This, however, will be obvious
and easily recognizable, because the new P3 will be very white (unstained), show virtually no wear and may not be
fully erupted.
Further aging adult deer requires evaluating the amount of wear on the teeth. Over time, the teeth wear down,
increasing the width of dentine (brown) exposed along each tooth’s crest. Specifi c age is estimated by comparing
the width of dentine in relation to the width of enamel (white), while measuring overall wear. For additional infor-
mation on aging white-tailed deer by the tooth replacement and wear technique, contact the QDMA (1-800-209-
3337) to receive a laminated color poster explaining the procedure in detail. These posters are excellent sources of
information to pin on the wall of your check station.

13
Some measure of deer density, sex ratio, age struc-ture and habitat quality is needed to set harvest recom-mendations. Accomplish this by recording deer sightings and evaluating the habitat on your property. All deer sight-ings should be recorded on an observation form (Form 814 in the back of this publication). Most hunters are will-ing to record these data during or after each hunt; how-ever, deer sightings on the property should be recorded year-round. Naturally, mid-July through mid-September is the best time to get estimates on the number of fawns per doe. Over a few years, trends will become apparent as to whether the deer population is increasing, decreas-
ing or remaining stable and if recruitment (fawns per doe) has changed. It is best if observation data are collected the same way each year and comparisons made by season or month (i.e., don’t compare deer sightings in June with those in November). If total observation time per day is recorded, these hours can be totaled later and relative abundance can be determined. For example, if you recorded 50 hours of observation during the hunting season and you saw 20 deer, then your sighting rate (20 divided by 50) was 0.40 deer per hour. These data can be broken down further to provide information on relative abundance of mature bucks, adult buck to adult doe ratio
1.5 years old (yearling jawbone)
2.5 years old (mature jawbone)
0.5 years old (fawn jawbone)
Note that P3 has 3 crests
Note that P3 now has been re placed by a “permanent tooth” that is no longer 3-cusped

14
Accuracy of this population estimate hinges on the ability to identify individual bucks (based on antler characteristics and various markings) in the pictures taken. Note the population estimate for bucks (see above) is used to calculate the number of does and fawns.
and fawns per doe. Over time, your sighting rate should correlate with the deer population (and with any deer cen-sus conducted) to give you a good idea of what the deer population is doing.
In the past, spotlight surveys have been used to estimate deer populations. However, there are several limitations associated with spotlight surveys, not the least
of which is that they are illegal in many states or certain areas. Recent research has discovered a more accurate method of estimating deer density and various param-eters using infrared-triggered cameras (available through the QDMA or various mail-order catalogs specializing in hunting equipment).
Using Infrared-triggered Cameras to Estimate Deer Populations
Accurate census data are as important as habitat assessment regarding wildlife management recommenda-tions. To implement a sound deer management program, it is important to have a reliable estimate of deer density. In many areas, spotlighting is used to estimate deer numbers; however, spotlighting is illegal in many states, includ-ing Tennessee. An improved method for estimating deer numbers has been developed by Drs. Harry Jacobson (ret.) of Mississippi State University and James Kroll of Stephen F. Austin State University. This method uses infrared-triggered cameras and has the potential to revolutionize population estimation.
The method works by placing the cameras evenly over the property in areas frequented by deer. The best sites are established in spring with the use of salt/mineral licks. Deer become accustomed to using these “census stations” through summer. In August, bait (corn and apples work well) is placed at the stations. Bait is readily con-sumed at this time of year because natural forages are becoming stemmy and less palatable and mast (acorns and beechnuts) has not begun to fall. Allow deer one week to fi nd the bait and get used to feeding at the site. An infra-red-triggered camera is then set with the bait in front of the camera. As deer cross the infrared sensor, a picture is taken, night or day. [Note: hunting over bait is illegal in Tennessee; therefore all bait has to be removed at least 10 days prior to hunting the area.]
Cameras can be mounted on trees or stakes driven into the ground. All vegetation should be cleared from the area in front of each camera where deer will be photographed. Cameras should be set approximately 2 feet above ground and programmed to operate on a 5- to 15-minute delay.
Following are procedures Jacobson and Kroll recommend to obtain a camera census for white-tailed deer. Cameras must be left in place a minimum of 10 days to “capture” >90% of the bucks in a particular area. A com-plete census requires at least one camera station per 160 acres; however, three or four stations can be run with one camera within a census period (i.e., August – September). Thus, a minimum of one camera is needed to cen-sus 640 acres.
Sample calculations for population estimation:
Acres sampled—4,800Camera stations used—31Census period—mid-July – August 2001Photographs of deer—1,021 Buck photographs—259 Doe photographs—780 Fawn photographs—146 Individual Bucks—60 Buck-to-Doe Ratio (excluding fawns)—1:3 Fawns per Doe—0.19
Population estimate: Bucks—60 Does—181 [60 (780 divided by 259)] Fawns—34 [60 (146 divided by 259)] Total population—275 Acres/deer—17.5 [4,800 divided by 275] Deer per square mile—36.6 [(640 acres; 640
divided by 17.5)]

15
These cameras provide a rela-tively easy and fun way to estimate deer numbers. They also provide pictures of those elusive bucks you never knew were on your property and can tell you when and where they travel! Census data should be coupled with an evaluation of the available habitat. By simply walking over the area and studying preferred deer browse species (e.g., straw-berry bush, honeysuckle, greenbriar, young brambles, buffalo-nut), you can get an indication of deer density in relation to the carrying capacity of that area. If most of the preferred browse species have been browsed 50 percent or more, an increased doe harvest is probably needed. Again, a competent wildlife biologist can assist you in making this determination.
Not only can infrared-triggered cameras provide you images of deer and other wildlife on your property, they also can be used to census the deer population.
Evaluating the habitat is necessary in order to estimate deer density in relation to the carrying capacity of a particular area. In this case, pokeberry has been browsed heavily. When preferred plant species are overbrowsed, or non-existent, available nutrition may be limiting.

16
Examples of Quality Deer Management in Tennessee
Catoosa Wildlife Management AreaThe Catoosa WMA is approximately 79,700 acres
managed by the Tennessee Wildlife Resources Agency (TWRA). The area is located in Cumberland and Morgan Counties and is comprised primarily of upland mixed-hardwood forest. The terrain is relatively steep and moun-tainous, typical of the Cumberland Plateau. Elevations range from 1,100 – 1,380 feet and the soils on Catoosa are considered low to moderately low in productivity. The Catoosa WMA is vastly forested, providing relatively poor habitat for deer. Approximately 2 percent of the area, however, is comprised of openings managed for wildlife or maintained under a sharecrop agreement. Approximately 400 acres of timber are harvested on Catoosa annually, providing deer much-needed browse and cover within three years post harvest. Prescribed burning in hardwood stands and beetle-killed pine stands also help provide additional forage.
Like many areas in the South, white-tailed deer num-bers were at all-time lows in the Catoosa area in the early 1900s. In 1942, the Tennessee Game and Fish Commis-sion (now the TWRA) purchased 324 deer from the state of Wisconsin and released them on Catoosa. Managed hunts were initiated in 1952. Since that time, most deer hunts on Catoosa have been through quota permits. However, in the last 20 years, some of these hunts have been converted into non-quota hunts, including nine days of either-sex archery hunting and three days of buck-only gun hunting in 2002.
In 1998, as a result of public interest, TWRA initiated a 4-point-to-a-side antler restriction, whereby a buck must have at least 4 points >1-inch long on at least one main beam before it can be shot legally. To track the suc-cess of the deer management program on the Catoosa WMA, data are presented below for the four years prior to implementing the antler restriction and fi ve years after.
After fi ve years of implementing the 4-point antler restriction, the number of yearling bucks killed each year has decreased by an average of 88 percent. As a result, surviving yearlings are able to mature and show up in the harvest in older age classes. In fact, the number of ma-ture bucks in the harvest has increased 193 percent from 1997 (the year prior to the restriction) to 2002 (fi ve years after the restriction) and the total number of bucks killed now exceeds that from 1997. Perhaps the most interesting statistic is the reduction in the number of acres per adult buck (>2½) killed. The number of acres per mature buck
killed in 2002 was less than half the 4-year average prior to implementing the antler restriction!
Because of a perceived decline in the overall deer population on the Catoosa WMA, opportunities for a legal antlerless harvest were limited to nine days of either-sex archery in 1998 (the same year the antler restriction was implemented). This change signifi cantly reduced the doe harvest in 1998 – 1999. However, by 2001, the doe harvest was nearly equal that in 1997 prior to the revised regulations.
The TWRA is to be commended for implementing a progressive deer management strategy at Catoosa. It is obvious the antler restriction has been success-ful in increasing the mature buck harvest. Nonetheless, improvements are still possible. In each of the past four years, the percentage of buck fawns and yearlings in the total buck harvest has increased. In 1999, 19 percent of the bucks killed at Catoosa were fawns or yearlings. By 2002, that number had increased to 27 percent — more than one out of four bucks in the harvest were killed before reaching maturity under the current antler restric-tion. This is limiting the recruitment of young bucks into older age classes and, more specifi cally, it is cropping some of those yearling bucks with the highest potential as 2½-year-olds (7- and 8-point yearlings). It is inevitable a certain percentage of buck fawns will be killed any-time there is an antlerless harvest. However, the number of yearling bucks killed is largely a result of the antler restriction implemented. Hunter education can reduce the number of buck fawns mistaken for does. Implement-ing an antler-spread restriction (based on the spread of yearling bucks killed under the current point restriction) would reduce the number of yearling bucks in the annual harvest at Catoosa signifi cantly. A spread restriction is the most popular restriction used on properties managed under QDM guidelines and is accepted readily by hunters. Hunters agree that recognizing whether an antler spread is at or beyond the ear tips at 100 yards is certainly easier than trying to count points at least one inch long.

17
num
ber
of d
eer
yearling bucks mature bucks
1994 1996 1998 2000 20020
50
100
150
200
250
1995 1997 1999 2001
does buck fawns
1994 1996 1998 2000 20020
50
100
150
200
250
1995 1997 1999 2001
Antlered Deer Harvest on the Catoosa Wildlife Management Area, 1994–2002
Antlerless Deer Harvest on the Catoosa Wildlife Management Area, 1994–2002
num
ber
of d
eer
NO ANTLER RESTRICTION 4 POINTS TO 1 SIDE RESTRICTION
Under traditional management, the number of mature bucks in the harvest was declining annually. After implementing an antler-point restriction, the number of mature bucks killed at Catoosa increased sharply. In fact, fi ve years later the number of mature bucks killed had increased 193 percent from 1997 (the year prior to the restriction).
In 1998, the opportunity for legal antlerless harvest was reduced considerably because of a perceived decline in the overall deer population. Thus, the doe harvest at Catoosa declined appreciably. By 2001, the doe harvest equalled that in 1997, the year before the regulations changed.
NO ANTLER RESTRICTION 4 POINTS TO 1 SIDE RESTRICTION
18
mature bucks does
1994 1996 1998 2000 20020
500
1000
1500
2000
2500
1995 1997 1999 2001
Acres Per Deer Killed on the Catoosa Wildlife Management Area 1994–2002
acre
s
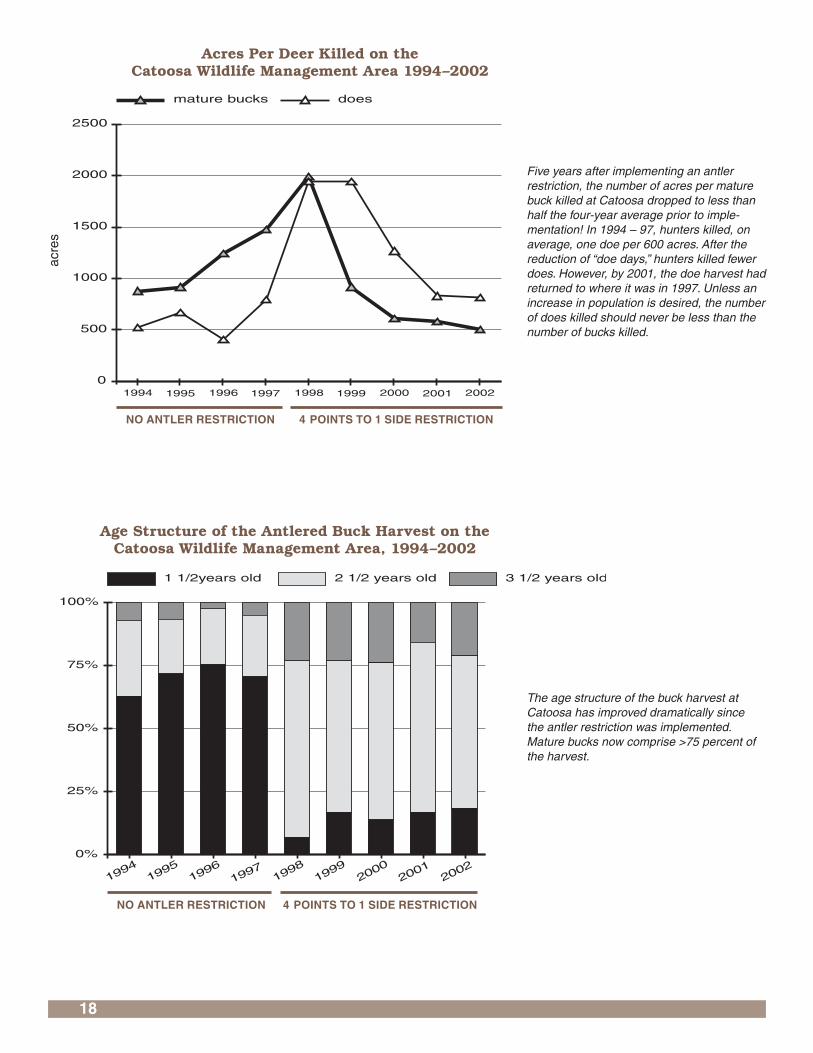
Five years after implementing an antler restriction, the number of acres per mature buck killed at Catoosa dropped to less than half the four-year average prior to imple-mentation! In 1994 – 97, hunters killed, on average, one doe per 600 acres. After the reduction of “doe days,” hunters killed fewer does. However, by 2001, the doe harvest had returned to where it was in 1997. Unless an increase in population is desired, the number of does killed should never be less than the number of bucks killed.
3 1/2 years old2 1/2 years old1 1/2years old
19941995
19961997
19981999
20002001
20020%
25%
50%
75%
100%
Age Structure of the Antlered Buck Harvest on the Catoosa Wildlife Management Area, 1994–2002
The age structure of the buck harvest at Catoosa has improved dramatically since the antler restriction was implemented. Mature bucks now comprise >75 percent of the harvest.
NO ANTLER RESTRICTION 4 POINTS TO 1 SIDE RESTRICTION
NO ANTLER RESTRICTION 4 POINTS TO 1 SIDE RESTRICTION

19
Southwest Quality Deer Management Cooperative
The Southwest Quality Deer Management Coopera-tive (SQDMC) is a deer-hunting club in Benton County, Tennessee. Kevin Furr, president of the association, and a group of friends had grown tired of seeing nothing but does and “scrub” bucks. As Kevin put it, “After years of killing the fi rst little buck that walks by, you lose the desire to go. We as landowners got tired and were not motivated to get up on a cold morning knowing all we would see would be a spike or maybe a 6-pointer.” They wanted something more. So, in August of 1998, he and 15 other hunters formed a cooperative representing 10 landowners comprising approximately 2,000 acres in the southwest portion of Benton County. Although they had not collected any data, they felt does far outnumbered bucks in their area. Therefore, it was decided to concentrate on the doe harvest and improve the sex ratio. They wanted to see mature bucks when hunting, so they decided to pass on all yearling bucks and thought a 15-inch inside spread restriction was a good starting point.
They drew up a written agreement stating members should 1) concentrate on the doe harvest, 2) shoot no deer with less than a 15-inch inside spread, 3) allow juve-nile hunters to shoot one buck of any size, then follow ant-ler restriction, 4) report all deer killed, regardless of size, and 5) educate all guests hunting on the property. That fall, they went to work. The group killed 68 does (approxi-
mately one doe per 30 acres) and not a single yearling buck. Two mature bucks (2½ years old) were killed (one per 1,000 acres) and only one button buck.
In 1999, the club grew to 40 members, representing 23 landowners comprising approximately 5,000 acres. Their plan remained the same — concentrate on the doe harvest and let yearling bucks walk. However, with a reduced number of antlerless days available for Benton County in 1999, the group was only able to kill 35 antler-less deer, including one button buck. This amounted to roughly one doe per 150 acres. The mature buck harvest increased (which was expected because the cooperative increased in size) to 11 (one per 450 acres) and the club continued to refrain from shooting yearling bucks.
During 2000 – 2001, the club grew to 50 members, representing 26 landowners comprising approximately 6,000 acres. Club objectives remained the same for 2000. The group killed 58 does (one per 100 acres) along with 17 mature bucks (one per 350 acres). Two yearling bucks were shot — one by a member and another by a juvenile hunter. Additionally, six button bucks were taken.
In September 2001, the group met and several members decided they wanted to “voluntarily hold out” for larger bucks — at least 3½-year-olds. Other members liked the current system. That fall, the group killed 41 does (one per 150 acres), 10 mature bucks (one per 600 acres) and four yearling bucks. The decrease in the num-ber of mature bucks killed was a result of several mem-
mature bucks does
1998 1999 2000 2001 20020
500
1000
1500
Acres Per Deer Killed at Southwest QDM Cooperative
acre
s
After implementing an antler restriction of 15 inches minimum inside spread, acres per mature buck killed by the SQDMC decreased from 1,000 acres to 350 acres in only three years! After the group decided to “hold out” for bucks ≥ 3½ years old, they now kill a mature buck per 500 acres.

20
bers passing up 2½-year-olds. Juvenile hunters and/or guests killed the yearling bucks.
This trend continued during the 2002-03 hunting season. With the membership remaining unchanged, 31 does were killed (one per 194 acres), along with 12 ma-ture bucks (one per 500 acres), two yearling bucks (killed by juvenile hunters) and one button buck. At the end of the season, Mr. Furr stated, “Some of the hunters are now letting 2½ -year-old bucks walk, but some are still happy with this size buck, which is OK. The program does have an impact on buck size. Many hunters [in the coopera-tive] said this year they are seeing better deer, which is encouraging to them and good for the program.”
Although members of the SEQDMC are killing more mature bucks than ever before, it should be noted that during the past fi ve years, 60 percent of the mature bucks killed did not meet the minimum inside spread restriction of 15 inches. The majority of these just missed the 15-inch requirement, measuring between 14 and 15 inches. Initially, it can be diffi cult for an individual to progress from shooting four or fi ve yearling bucks per year to watching these deer walk by while waiting for a mature buck with a 15 – 18-inch spread. This change often takes time. Now, after having gone from shooting yearlings to 2½-year-olds, the membership seems ready for the next step — that is, managing for bucks 3½+ years old, which is one of the primary goals in a sound deer management program.
Although members were “breaking” the written agreement, no fi nes or penalties were implemented — this is a voluntary cooperative of adjoining landown-ers (or lessees). Members joined because they wanted to and because they were committed to make a difference.
In only three years, the voluntary cooperative pro-gram in Benton County realized a huge difference in the number of mature bucks they were killing (i.e., going from killing one mature buck per 1,000 acres to killing one per 350 acres). Indeed, this group has been quite success-ful. The members have done a good job collecting data from deer killed, though observation and census data are needed to quantify the impact of the program on sex ratio and recruitment. The membership has grown each year and, thus far, no one has dropped out of the program. Members of the SQDMC are excited about the future of their program. As Kevin Furr says, “We’re just an average group of hunters in an average situation in Tennessee. But we’ve made a difference. We’re seeing better bucks, we’re more excited about hunting and we’re really looking forward to the next few years.”
Rocky River Hunting ClubThe Rocky River Hunting Club is located on 4,800
acres of the Cumberland Plateau in Sequatchie, Van Buren and Warren Counties. This club was established in the spring of 2000 and represents a textbook example of how a group should begin a QDM program. The RRHC and its deer management program are under the direc-tion of Mike Black, R.F., Sequatchie Forest and Wildlife. Before RRHC was formed, the property was plagued by rampant trespassing of poachers and ATV riders. Their disrespectful actions ultimately led the landowners to lease the property, hoping to “regain control.” The tactic worked and the result is a very structured club comprised of 72 members who follow state regulations along with their own set of restrictions. The primary objectives for the club were to regain control of the property and implement a sound deer management program.
The initial survey of the property showed overbrows-ing by deer, and an initial census showed an overabun-dance of deer for a vastly wooded tract with very little early successional habitat. Reducing the deer herd and balancing the sex ratio became the focus of the group. Extensive data collection at RRHC is required and a condition of membership. RRHC has a central check station where all members check in and out as they enter and exit the property. This is a “full-service, self-service” check station, where members collect and record data themselves. The walls of the check station are covered with educational posters, publications, charts and data sheets that help the hunters learn more about sound deer management and keep track of the deer harvest on their property. Here, hunters are required to fi ll out deer sight-ing cards and record post-harvest data, including hours hunted, deer sighted, fi eld-dressed weights, age (jaw-bone removal) and lactation rates. Jawbones are aged and antlers scored by the club manager. Two Polaroid pictures are taken of every deer killed, one for the check station bulletin board and one to be attached to the har-vest card, which is put into the “data box.” (An additional picture can be taken if the hunter wants one to keep.) The club manager collects cards and jawbones twice per week.
Members at RRHC are limited to two male deer (including buck fawns) and a “legal” antlered buck must have 100 gross inches of antler as scored on the Boone and Crockett scale. Thus, there is no minimum spread or point restriction; however, on this property, most bucks are 3½ years old with 8 points and a spread of approxi-mately 14 inches before they score 100 inches. This type of restriction has allowed hunters at Rocky River to kill “wide” 6- or 7-pointers and “high-racked” 8-pointers with a relatively narrow spread. So far, this restriction

21
2000 2001 2002
0
10
20
30
40
50
White-tailed Deer Population Estimate at Rocky River
deer
per
squ
are
mile Every knowledgeable grocery store manager
knows how much stock he has. So should every knowledgeable deer manager! The group at Rocky River has successfully brought the deer herd below the carrying capacity for their area as evidenced by a lack of overbrowsing. Their camera census has tracked their progress from 41 deer/mi2 in 2000 to 33 deer/mi2 in 2002.
camera estimate observation cards
2000 2001 2002
0
1
2
3
4
Sex Ratio of White-tailed Deer at Rocky River
does
per
buc
k This graph shows what dedicated hunters can do! By increasing the doe harvest, the sex ratio at Rocky River is now two does per buck. Data collected by hunters (observation cards) while hunting virtually mirrors that identifi ed by their camera census.

22
antlered deer total deer
2000 2001 2002
0
5
10
15
20
25
Hours Per Deer Sighted While Huntingat Rocky River
hour
s
does mature bucks buck fawns
2000 2001 2002
0
10
20
30
40
num
ber
of d
eer
As a result of their efforts, the number of hours per antlered deer sighted has de-creased each year, while the number of hours per total deer has remained steady.This means more bucks are being seen while hunting.
An aggressive doe harvest has been neces-sary to get the herd under carrying capacity. The number of mature bucks killed appears to be increasing. This is facilitated by the fact that the hunters at Rocky River have not killed any yearling bucks! The 100-point-gross-score restriction is obviously working well.
White-tailed Deer Harvest at Rocky River
23
2000 2001 2002
85
90
95
100
105
Average Boone and Crockett Score of Bucks Killed at Rocky River
B &
C s
core
mature bucks does
2000 2001 2002
0
100
200
300
400
500
600
Acres Per Deer Killed at Rocky River
acre
s
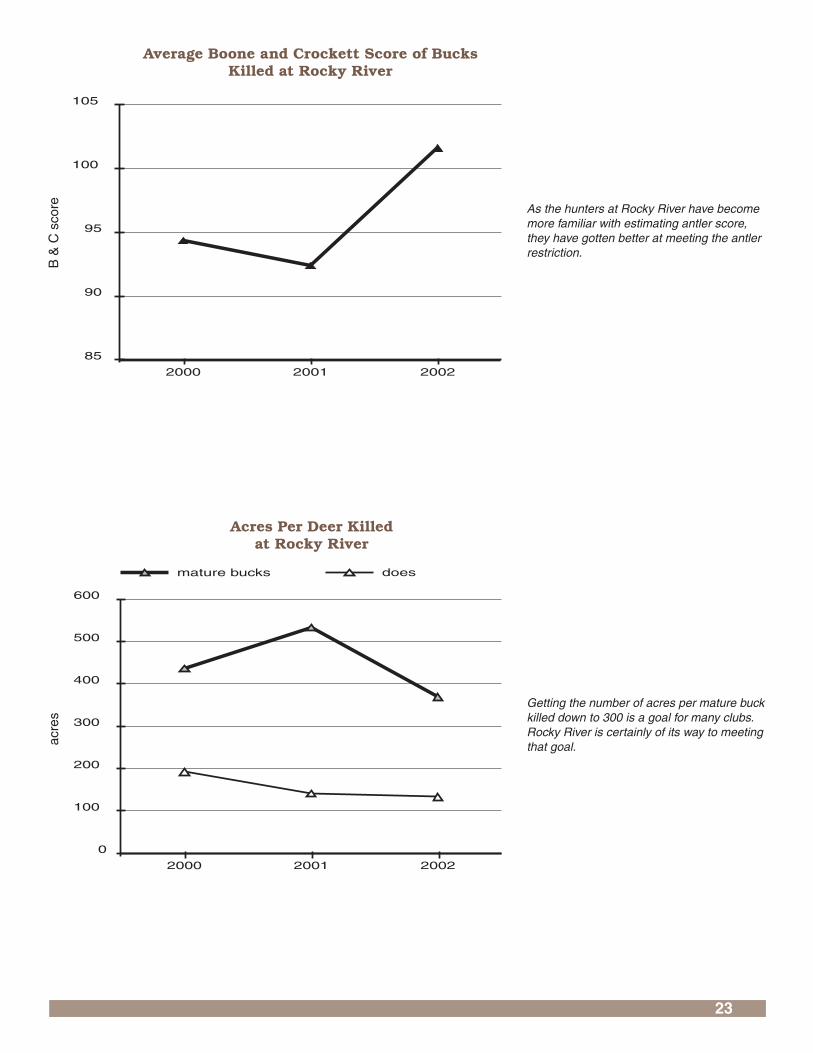
As the hunters at Rocky River have become more familiar with estimating antler score, they have gotten better at meeting the antler restriction.
Getting the number of acres per mature buck killed down to 300 is a goal for many clubs. Rocky River is certainly of its way to meeting that goal.

24
has been very effective, as the group has yet to shoot a yearling buck.
Although RRHC has just gotten started with their deer management efforts, the data show the group is headed in the right direction. In just two years, the deer population was reduced to the point where excessive browsing was no longer evident. It is important to note the habitat on this property was managed through timber management only until 2002 when a few warm-season plots were planted. The intention of the club is to get the structure of the deer herd balanced before additional nutrition is made available. Nonetheless, small clearcuts and daylighting logging roads have increased early suc-cessional growth and provided additional food resources. The buck-to-doe ratio has been improved substantially through a doe harvest and the hours hunted per adult buck sighting have decreased as well. The group has done an excellent job of collecting data (in fact, it’s the best the author has ever seen). The buck-to-doe ratio estimated from deer sighting cards closely resembles the estimate from infrared-triggered cameras. By continuing to collect data as they are, this group defi nitely will be able to identify and document changes in the deer herd and the impact of their efforts.
In summary, the RRHC has worked hard to 1) regain control of the property from poachers and other trespass-ers, 2) reduce the deer population below carrying capac-ity and 3) correct the buck-to-doe ratio. Now that these factors have been addressed and continue to improve, the group is poised to begin a more intensive habitat management program that will increase the availability of nutrients to the deer herd. With this, there is no doubt that increases in weights, lactation rates, fawns per doe and antler size are sure to follow in the near future. This group realizes changes in population structure do not hap-pen overnight, but they can see the tide turning already. Indeed, it will be exciting to follow the progress of RRHC in years to come.
ConclusionsSound deer management promotes not only a well-
balanced, healthy deer herd, but for many hunters it also ensures a quality hunting experience. In addition, farm-ers are beginning to realize QDM can be used to combat deer-crop depredation problems. By allowing hunters to implement QDM guidelines, farmers are able to increase the doe harvest on properties experiencing crop depreda-tion problems. It is a win-win situation — hunters kill more deer (and take home more meat) while promoting sound deer management, and crop losses for farmers are reduced.
The important thing to realize is that QDM is not a dream — it is achievable. Sound deer management is being implemented all across the country by average hunters in average situations. The ability to hunt a deer herd with a well-balanced sex ratio and good numbers of mature bucks is an exciting experience — one that is being realized by an increasing number of hunters and landowners. Nonetheless, QDM may not be for everyone. Some hunters are more interested in deer quantity than deer quality. But for those who wish to actively participate in managing the deer herd and desire an opportunity to hunt mature bucks, QDM is the only sound strategy.
For more information on QDM, or a free brochure, contact the Quality Deer Management Association (QDMA) at 1-800-209-DEER or visit their website at www.qdma.com. The QDMA is a non-profi t wildlife con-servation organization dedicated to ethical hunting, sound deer management and a sustainable future for white-tailed deer and white-tailed deer hunting.

25
AcknowledgementsThe manuscript for this publication was improved
by the review and suggestions of Dr. David Guynn, Jr. (Clemson University), Joe Hamilton (The Nature Conser-vancy) and Dr. Karl Miller (University of Georgia).
Mike Black, R.F. (Sequatchie Forest and Wildlife, Jasper, TN) provided the data presented in the camera census sidebar and the information and data for the Rocky River Hunting Club. Ben Layton (TWRA) provided the information and data for the Catoosa WMA. Kevin Furr provided the information and data for the Southwest Quality Deer Management Cooperative.
References and suggestions for further reading:
Brothers, A. and M.E. Ray, Jr. 1998. Producing quality whitetails (Revised Edition). Texas Wildlife Association, San Antonio, Texas.
Demarais, S., D. Stewart, and R.N. Griffi n. 1999. A hunter’s guide to aging and judging live white-tailed deer in the Southeast. Mississippi State Cooperative Extension Service, Publication 2206.
Halls, L.K., editor. 1984. White-tailed deer: Ecology and management. Stackpole Books, Mechanicsburg, Pennsylvania.
Kroll, J.C. 1991. A practical guide to producing and harvesting white-tailed deer. Stephen F. Austin State University Press, Nacogdoches, Texas.
McShea, W.J., H.B. Underwood, J.H. Rappole, editors. 1997. The science of overabundance: Deer ecology and population management. Smithsonian Institution.
Miller, K.V. and R.L. Marchinton, editors. 1995. Quality whitetails: The how and why of quality deer manage ment. Stackpole Books, Mechanicsburg, Pennsylvania.
Quality Whitetails. Journal of the Quality Deer Management Association.

27
Form
813
Agricultural E
xtension ServiceT
he University of Tennessee
White-tailed D
eer Kill Station D
ata
Deer
Dressed
Tim
e N
umber* D
ate Sex Age L
ive (most im
portant) Yes or N
o
Left R
ight L
eft Right
Hunter of K
ill Weapon
Weight
Lactating
Num
berof P
oints(>1” long)
Inside spread
Main B
eamL
engthM
ain Beam
Circum
ference
* Each jaw
bone should be identifi ed by this number.
For additional copies of this form, visit your county E
xtension offi ce.

29
Form 814
White-tailed Deer Ob ser va tion Form
DateTotal
observation time
Agricultural Extension ServiceThe University of Tennessee
Location/ behavior/comments 1
Deer sighted
# antleredbucks
# does # fawns # unknownsex/age
1 In woods? In fi eld? Crossing road? If doe, was fawn with her?
For additional copies of this form, visit your county Extension offi ce.

32
Visit the Agricultural Extension Service Web site at:http://www.utextension.utk.edu/
The Agricultural Extension Service offers its programs to all eligible persons regardless of race, color, national origin, sex, age, disability, religion or veteran status and is an Equal Op por tu ni ty Em ploy er.
COOPERATIVE EXTENSION WORK IN AGRICULTURE AND HOME ECONOMICS The University of Tennessee Institute of Agriculture, U.S. De part ment of Agriculture,
and county governments cooperating in furtherance of Acts of May 8 and June 30, 1914. Agricultural Extension Service
Charles L. Norman, Dean
PB1643-2M-8/03 E12-4915-00-002-04