Embed Size (px)
Citation preview
1
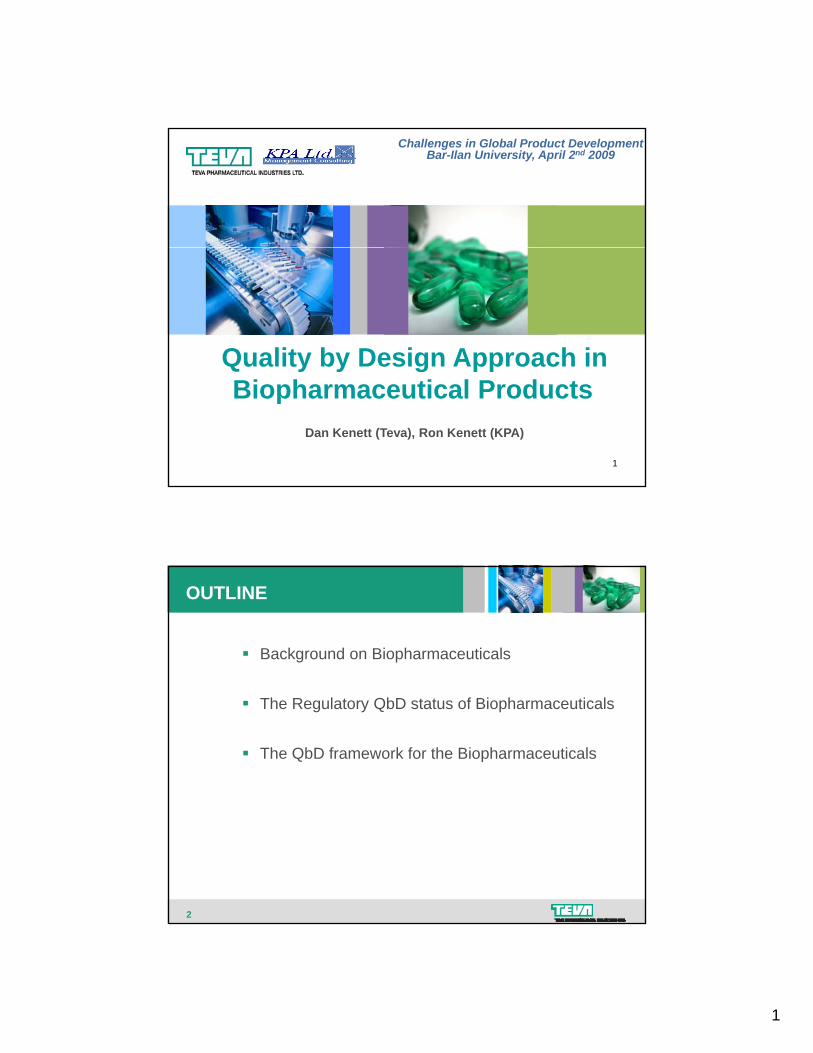
Challenges in Global Product DevelopmentBar-Ilan University, April 2nd 2009
Quality by Design Approach in
1
Q y y g ppBiopharmaceutical Products
Dan Kenett (Teva), Ron Kenett (KPA)
OUTLINE
Background on Biopharmaceuticals
The Regulatory QbD status of Biopharmaceuticals
The QbD framework for the Biopharmaceuticals
2
2
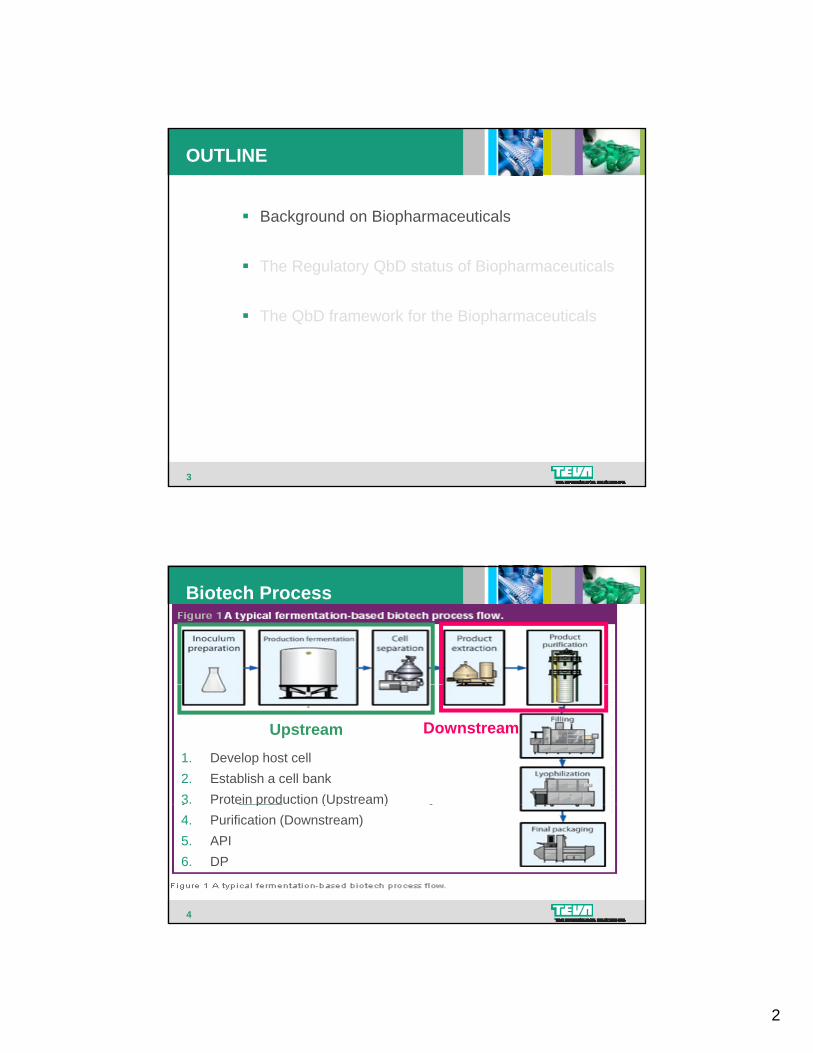
OUTLINE
Background on Biopharmaceuticals
The Regulatory QbD status of Biopharmaceuticals
The QbD framework for the Biopharmaceuticals
3
Biotech Process
Upstream Downstream
1. Develop host cell2. Establish a cell bank3. Protein production (Upstream)
4
http://www.ptemag.com/pharmtecheurope/Biopharmaceuticals/The-development-of-PAT-in-biotech-manufacturing/ArticleStandard/Article/detail/391530?contextCategoryId=37828&ref=25
p ( p )4. Purification (Downstream)5. API 6. DP
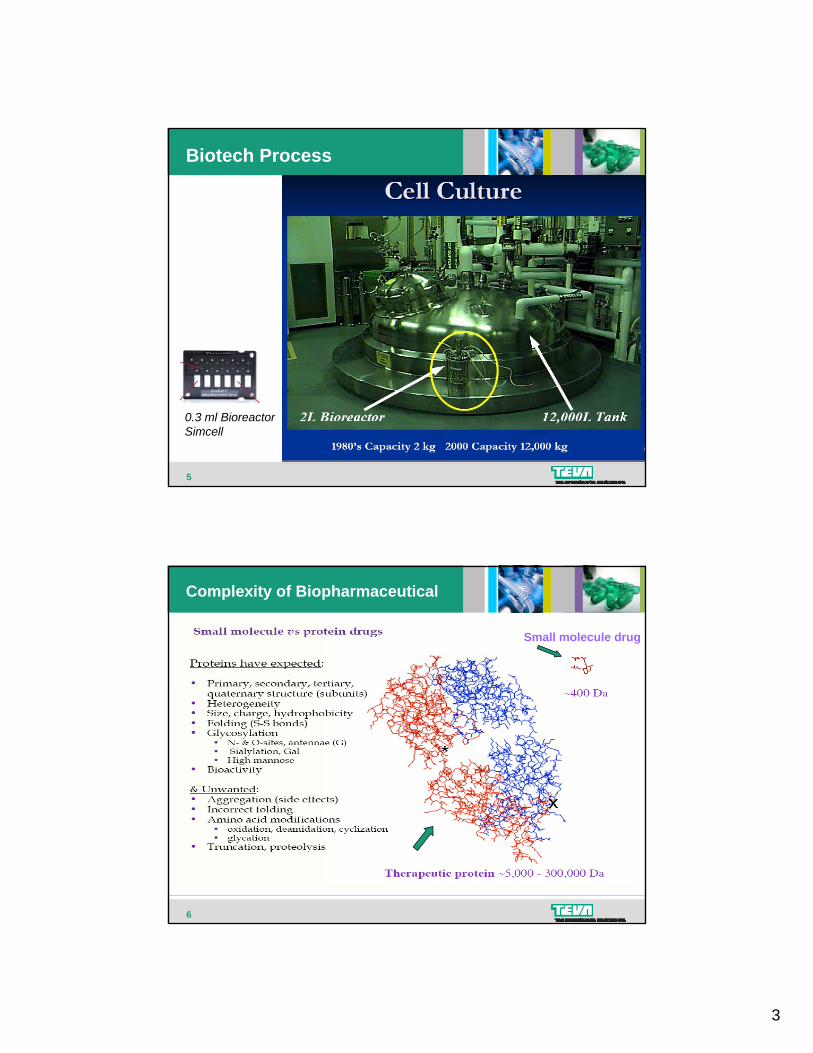
3
Biotech Process
5
0.3 ml BioreactorSimcell
Complexity of Biopharmaceutical
Small molecule drugSmall molecule drug
6
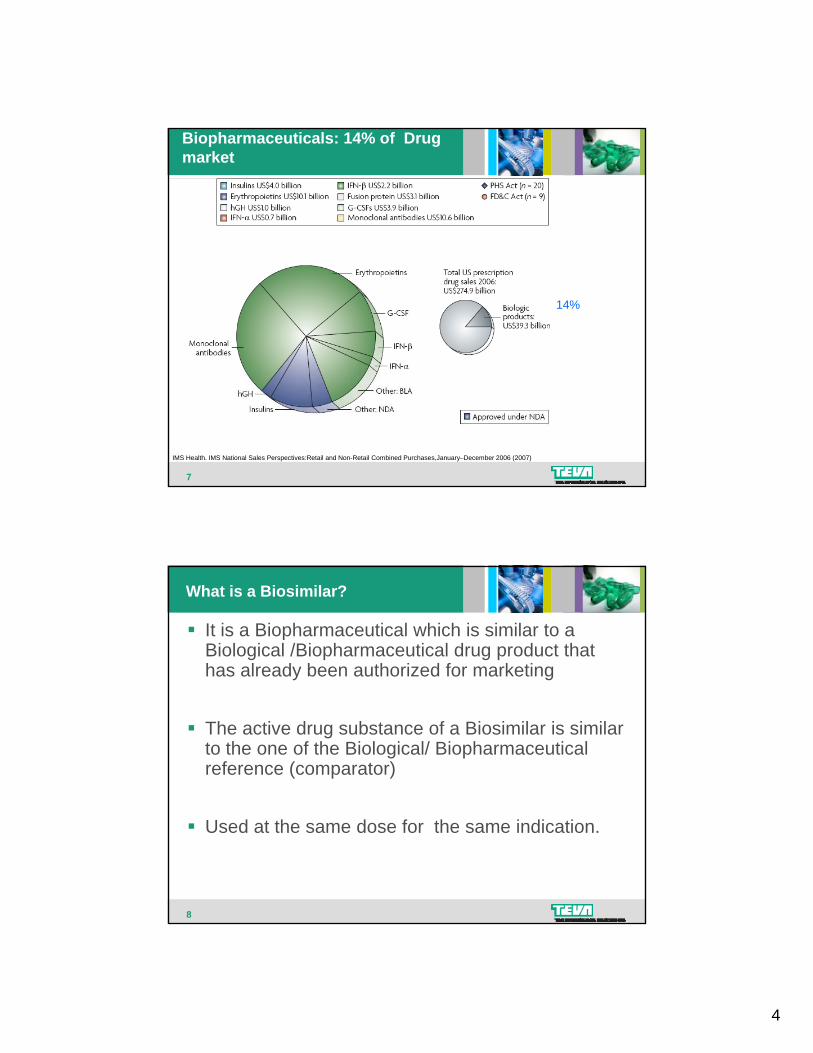
4
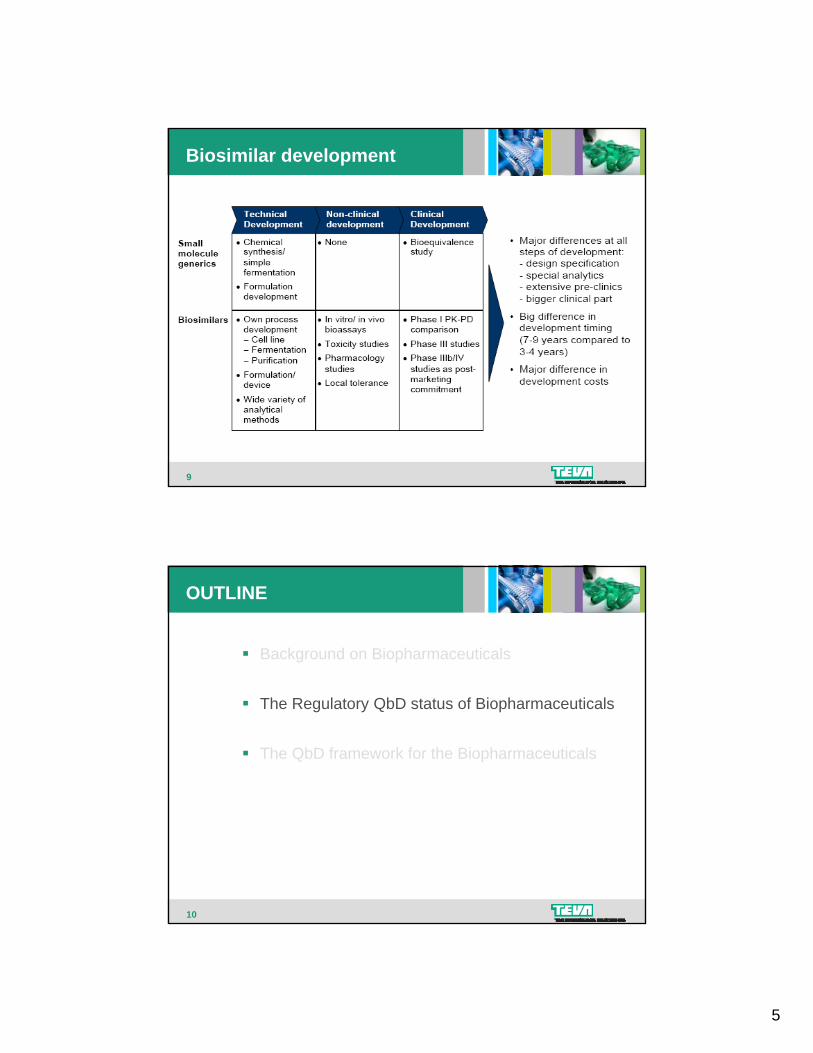
Biopharmaceuticals: 14% of Drug market
14%
7
IMS Health. IMS National Sales Perspectives:Retail and Non-Retail Combined Purchases,January–December 2006 (2007)
What is a Biosimilar?
It is a Biopharmaceutical which is similar to a Biological /Biopharmaceutical drug product that has already been authorized for marketing
The active drug substance of a Biosimilar is similar to the one of the Biological/ Biopharmaceutical reference (comparator)
8
Used at the same dose for the same indication.
5
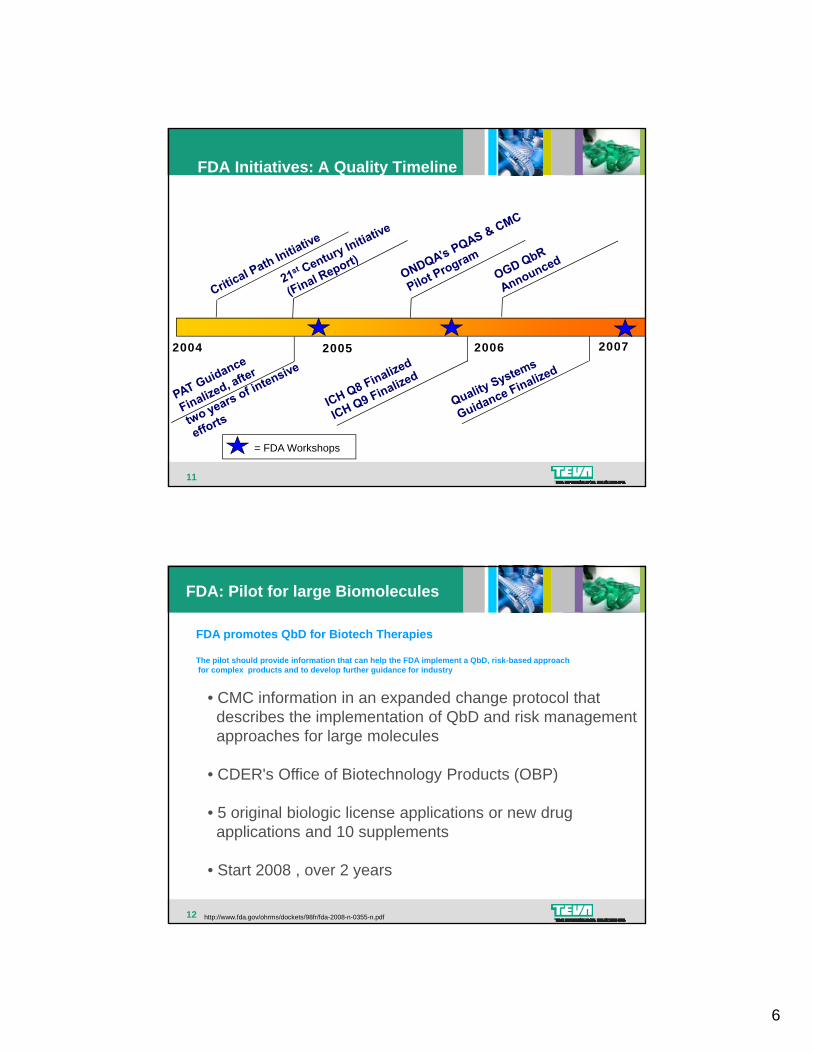
Biosimilar development
9
OUTLINE
Background on Biopharmaceuticals
The Regulatory QbD status of Biopharmaceuticals
The QbD framework for the Biopharmaceuticals
10
6
FDA Initiatives: A Quality Timeline
2004 2005 2006 2007
11
= FDA Workshops
FDA: Pilot for large Biomolecules
FDA promotes QbD for Biotech Therapies
The pilot should provide information that can help the FDA implement a QbD, risk-based approachfor complex products and to develop further guidance for industry
• CMC information in an expanded change protocol thatdescribes the implementation of QbD and risk management approaches for large molecules
• CDER's Office of Biotechnology Products (OBP)
12 http://www.fda.gov/ohrms/dockets/98fr/fda-2008-n-0355-n.pdf
• 5 original biologic license applications or new drug applications and 10 supplements
• Start 2008 , over 2 years
7
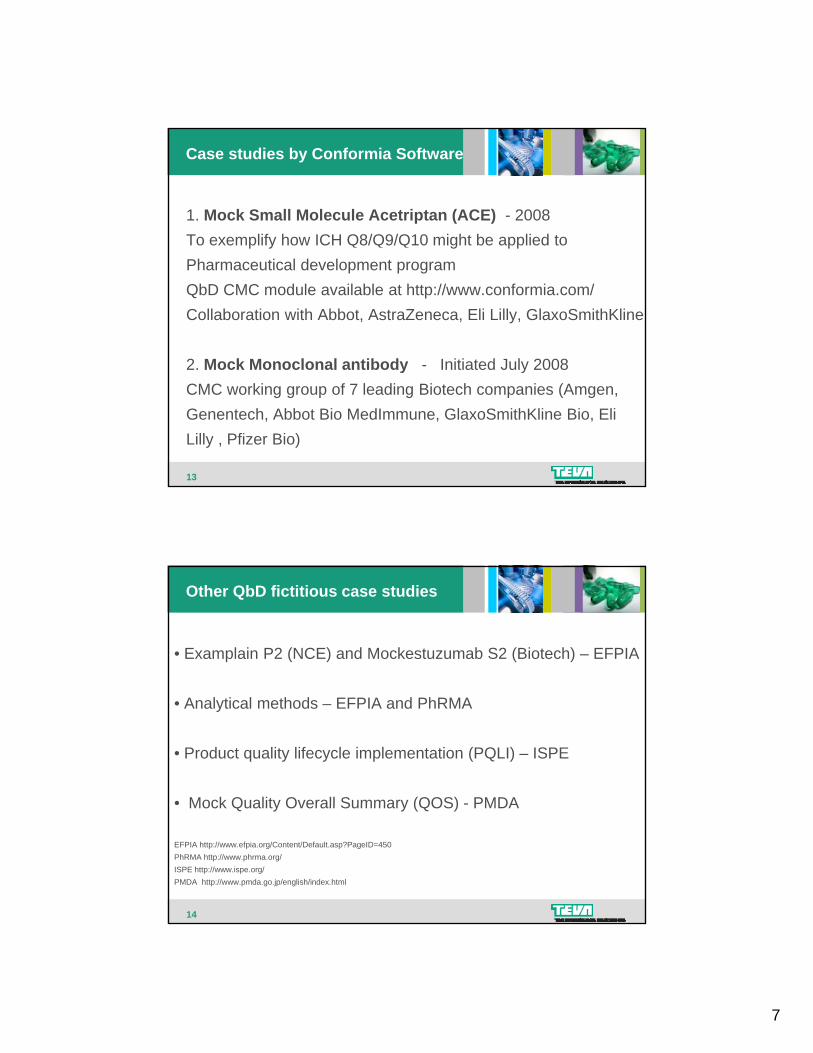
Case studies by Conformia Software
1. Mock Small Molecule Acetriptan (ACE) - 2008To exemplify how ICH Q8/Q9/Q10 might be applied to p y g ppPharmaceutical development programQbD CMC module available at http://www.conformia.com/Collaboration with Abbot, AstraZeneca, Eli Lilly, GlaxoSmithKline
2 Mock Monoclonal antibody - Initiated July 2008
13
2. Mock Monoclonal antibody Initiated July 2008CMC working group of 7 leading Biotech companies (Amgen, Genentech, Abbot Bio MedImmune, GlaxoSmithKline Bio, Eli Lilly , Pfizer Bio)
Other QbD fictitious case studies
• Examplain P2 (NCE) and Mockestuzumab S2 (Biotech) – EFPIA
• Analytical methods – EFPIA and PhRMA
• Product quality lifecycle implementation (PQLI) – ISPE
• Mock Quality Overall Summary (QOS) - PMDA
14
Mock Quality Overall Summary (QOS) - PMDA
EFPIA http://www.efpia.org/Content/Default.asp?PageID=450PhRMA http://www.phrma.org/ISPE http://www.ispe.org/PMDA http://www.pmda.go.jp/english/index.html

8
QbD and EMEA
From a presentation by Luigetti (EMEA) at Siena 2008:
• QbD approach is supported by the regulatory community in EU
• QbD implementation in the EU is ongoing
• The Design Space concept is included in the EU legislation
15 http://www.emea.europa.eu/Inspections/docs/Presentations/RL-QbDSiena081006.pdf
• The PAT team is the key for implementation of QbD in the EU
QbD and EMEA
16
9
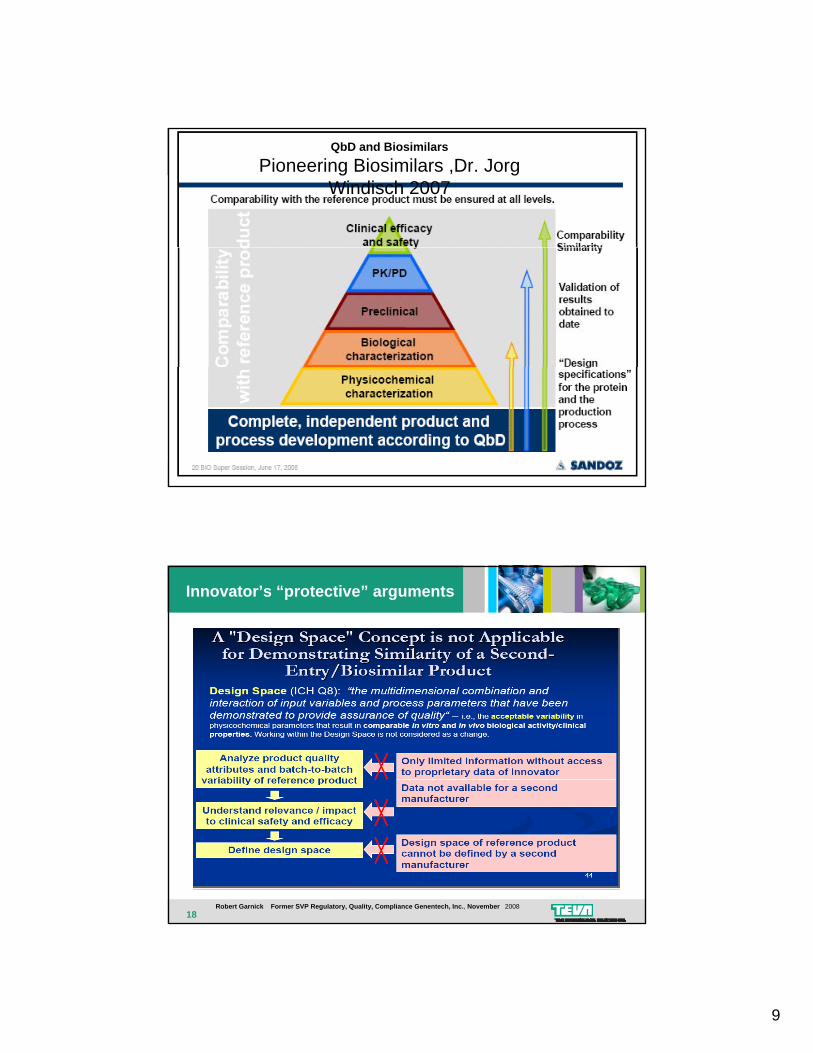
QbD and Biosimilars
Pioneering Biosimilars ,Dr. Jorg Windisch 2007
17
Innovator’s “protective” arguments
18Robert Garnick Former SVP Regulatory, Quality, Compliance Genentech, Inc., November 2008
10
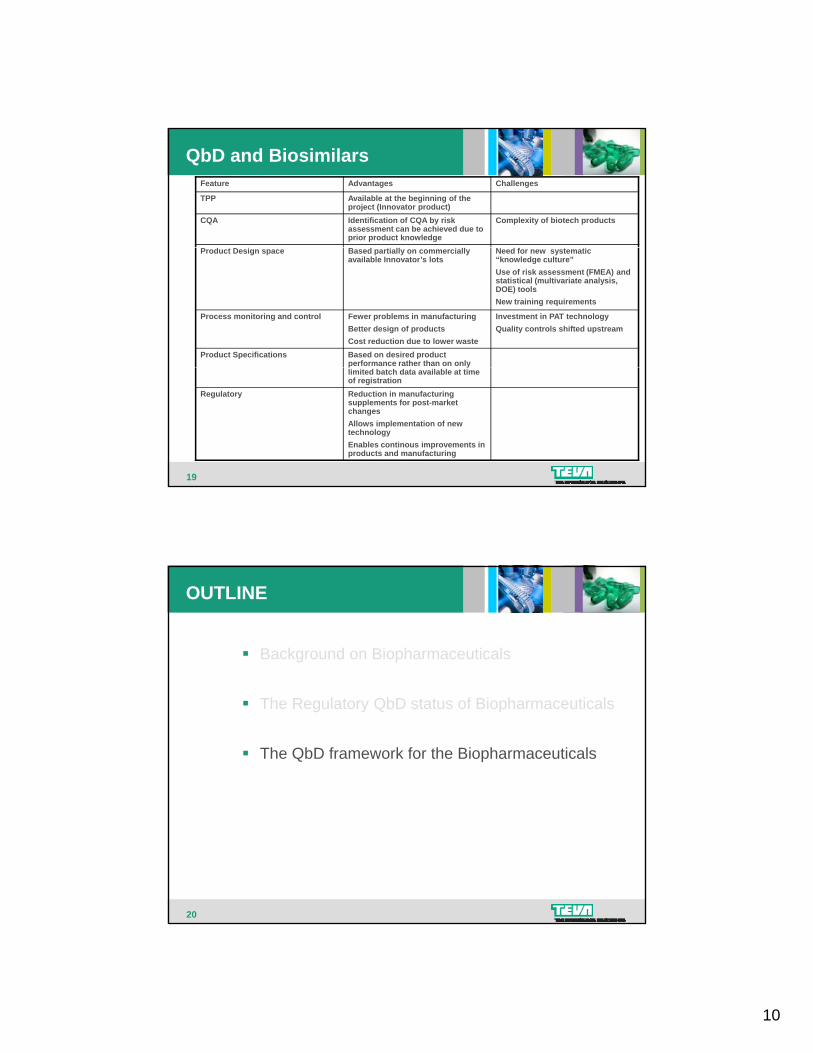
QbD and BiosimilarsFeature Advantages Challenges
TPP Available at the beginning of the project (Innovator product)
CQA Identification of CQA by risk assessment can be achieved due to prior product knowledge
Complexity of biotech products
Product Design space Based partially on commercially available Innovator’s lots
Need for new systematic “knowledge culture”Use of risk assessment (FMEA) and statistical (multivariate analysis, DOE) toolsNew training requirements
Process monitoring and control Fewer problems in manufacturingBetter design of productsCost reduction due to lower waste
Investment in PAT technologyQuality controls shifted upstream
Product Specifications Based on desired product performance rather than on only
19
p ylimited batch data available at time of registration
Regulatory Reduction in manufacturing supplements for post-market changesAllows implementation of new technologyEnables continous improvements in products and manufacturing
OUTLINE
Background on Biopharmaceuticals
The Regulatory QbD status of Biopharmaceuticals
The QbD framework for the Biopharmaceuticals
20
11
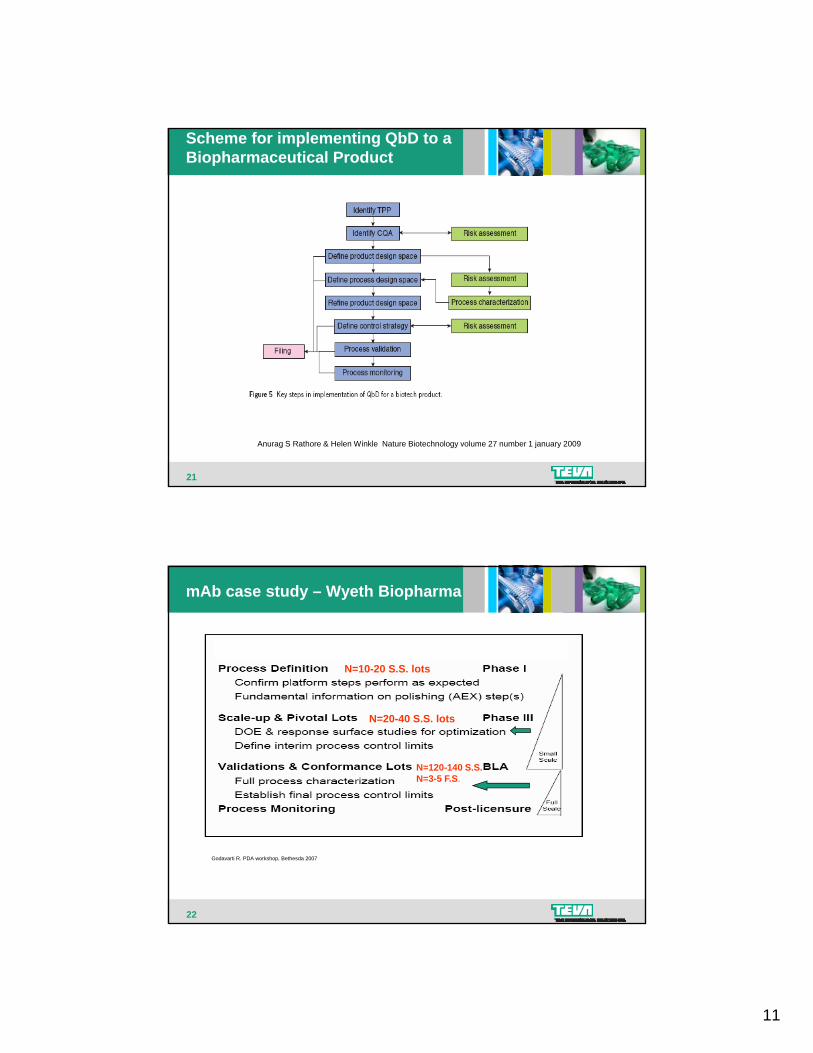
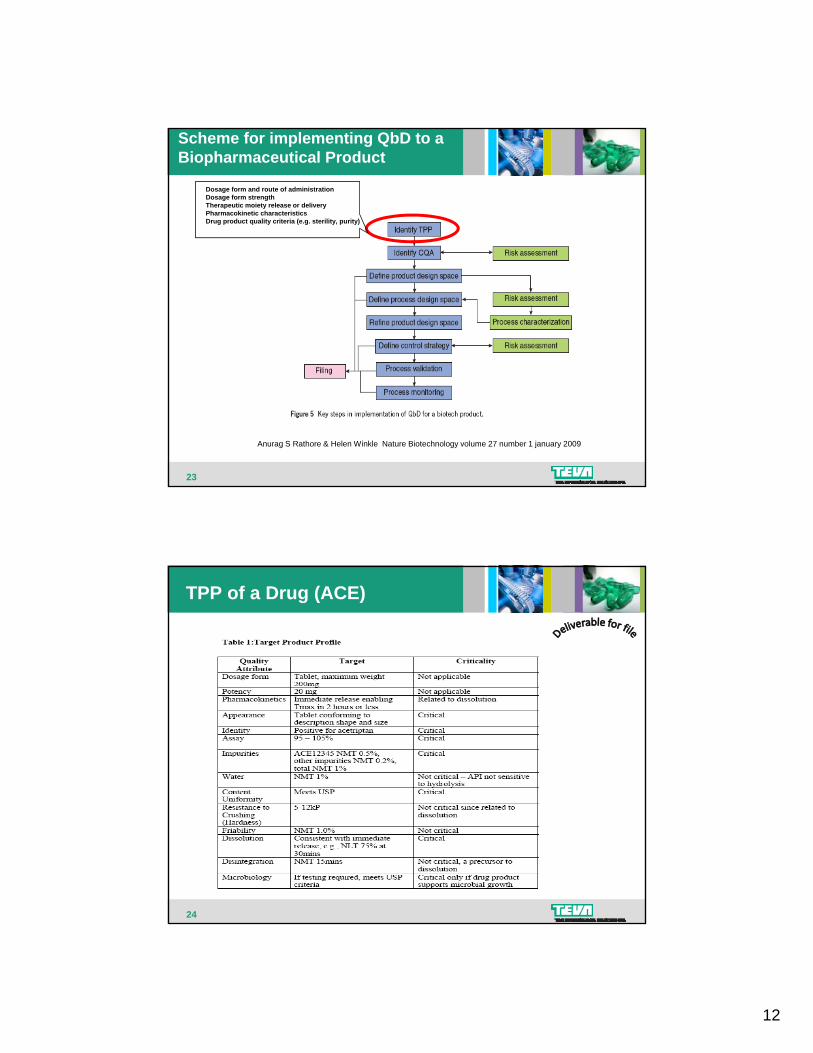
Scheme for implementing QbD to a Biopharmaceutical Product
21
Anurag S Rathore & Helen Winkle Nature Biotechnology volume 27 number 1 january 2009
mAb case study – Wyeth Biopharma
N=10-20 S.S. lots
N=20-40 S.S. lots
N=120-140 S.S.N=3-5 F.S.
22
Godavarti R. PDA workshop, Bethesda 2007
12
Scheme for implementing QbD to a Biopharmaceutical Product
Dosage form and route of administrationDosage form strengthTherapeutic moiety release or deliveryPharmacokinetic characteristicsDrug product quality criteria (e.g. sterility, purity)
23
Anurag S Rathore & Helen Winkle Nature Biotechnology volume 27 number 1 january 2009
TPP of a Drug (ACE)
24
13
Scheme for implementing QbD to a Biopharmaceutical Product
Product-related variantsProcess-related impuritiesProduct composition-strengthAventitious agents
25
Anurag S Rathore & Helen Winkle Nature Biotechnology volume 27 number 1 january 2009
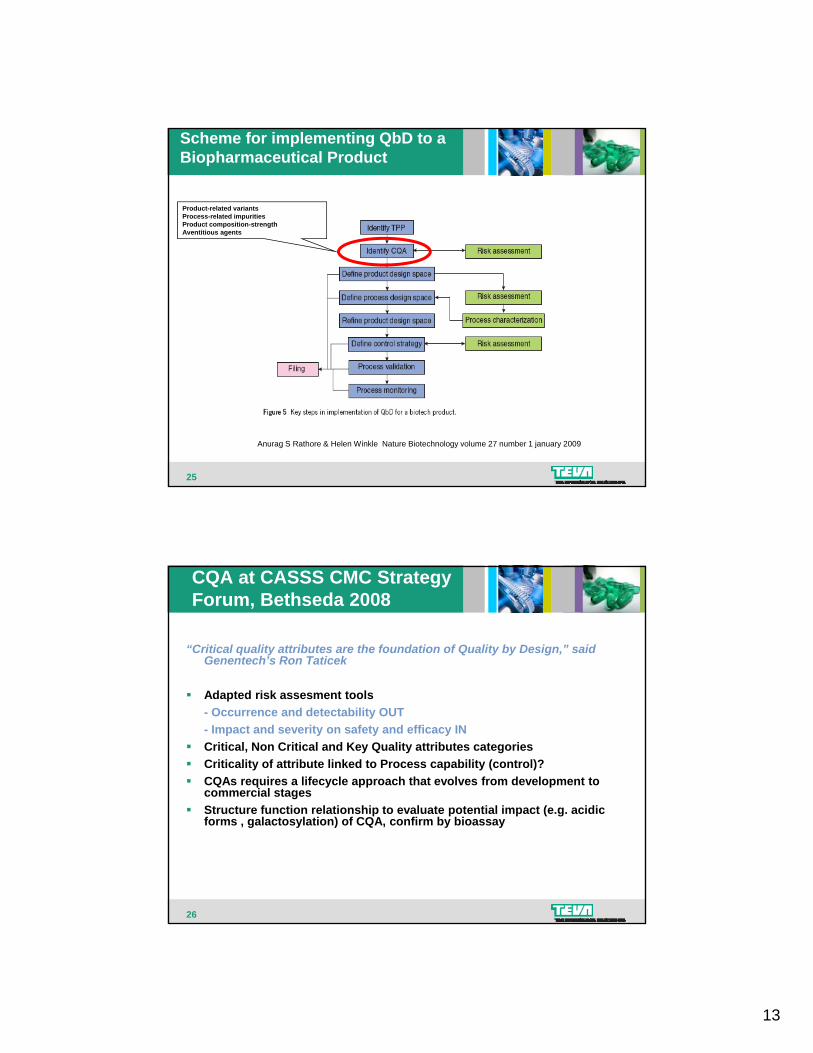
CQA at CASSS CMC Strategy Forum, Bethseda 2008
“Critical quality attributes are the foundation of Quality by Design,” said Genentech’s Ron Taticek
Adapted risk assesment tools- Occurrence and detectability OUT- Impact and severity on safety and efficacy INCritical, Non Critical and Key Quality attributes categoriesCriticality of attribute linked to Process capability (control)?CQAs requires a lifecycle approach that evolves from development to commercial stages
26
Structure function relationship to evaluate potential impact (e.g. acidic forms , galactosylation) of CQA, confirm by bioassay
14
Scheme for implementing QbD to a Biopharmaceutical Product
Specifications for:In process, drug substance and drug product attributes
Acceptable ranges for the key and critical process
parameters
27
Anurag S Rathore & Helen Winkle Nature Biotechnology volume 27 number 1 january 2009
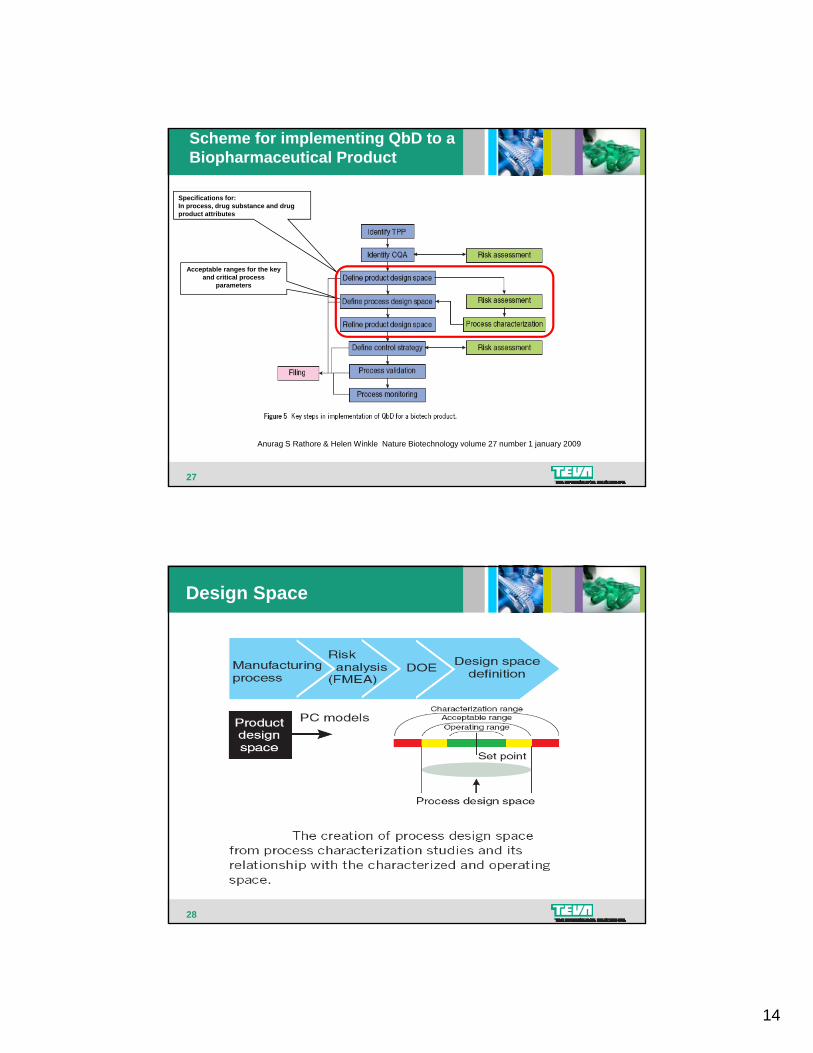
Design Space
28

15
Risk identification
Which input variables have the potential to affect the analytical method performance?
Fishbone
29
Method Mapping1. Borman, P., Nethercote, P., Chatfield, M., Thompson, D., Truman, K. (2007)
Risk analysis by FMEA (Failure Mode and Effects Analysis)
30 P. Nethercote, GSK
16
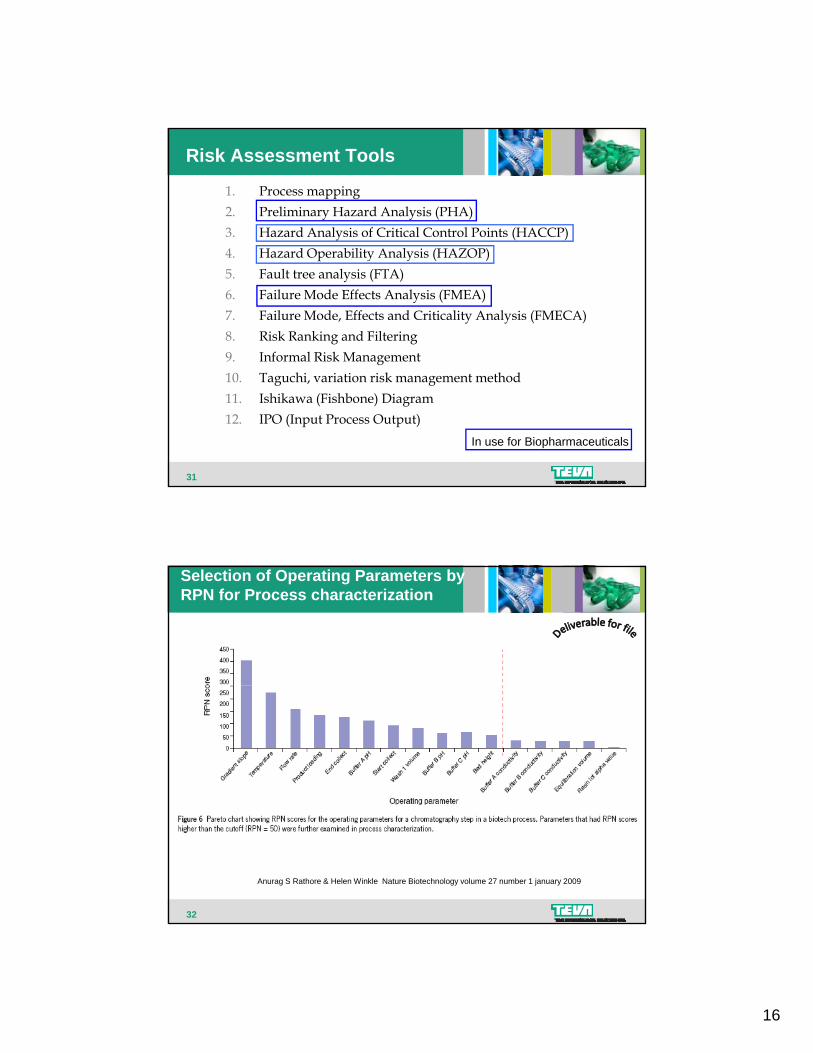
1. Process mapping2. Preliminary Hazard Analysis (PHA)3. Hazard Analysis of Critical Control Points (HACCP)
Risk Assessment Tools
4. Hazard Operability Analysis (HAZOP)5. Fault tree analysis (FTA)6. Failure Mode Effects Analysis (FMEA)7. Failure Mode, Effects and Criticality Analysis (FMECA)8. Risk Ranking and Filtering9. Informal Risk Management
31
10. Taguchi, variation risk management method11. Ishikawa (Fishbone) Diagram12. IPO (Input Process Output)
In use for Biopharmaceuticals
Selection of Operating Parameters by RPN for Process characterization
32
Anurag S Rathore & Helen Winkle Nature Biotechnology volume 27 number 1 january 2009
17
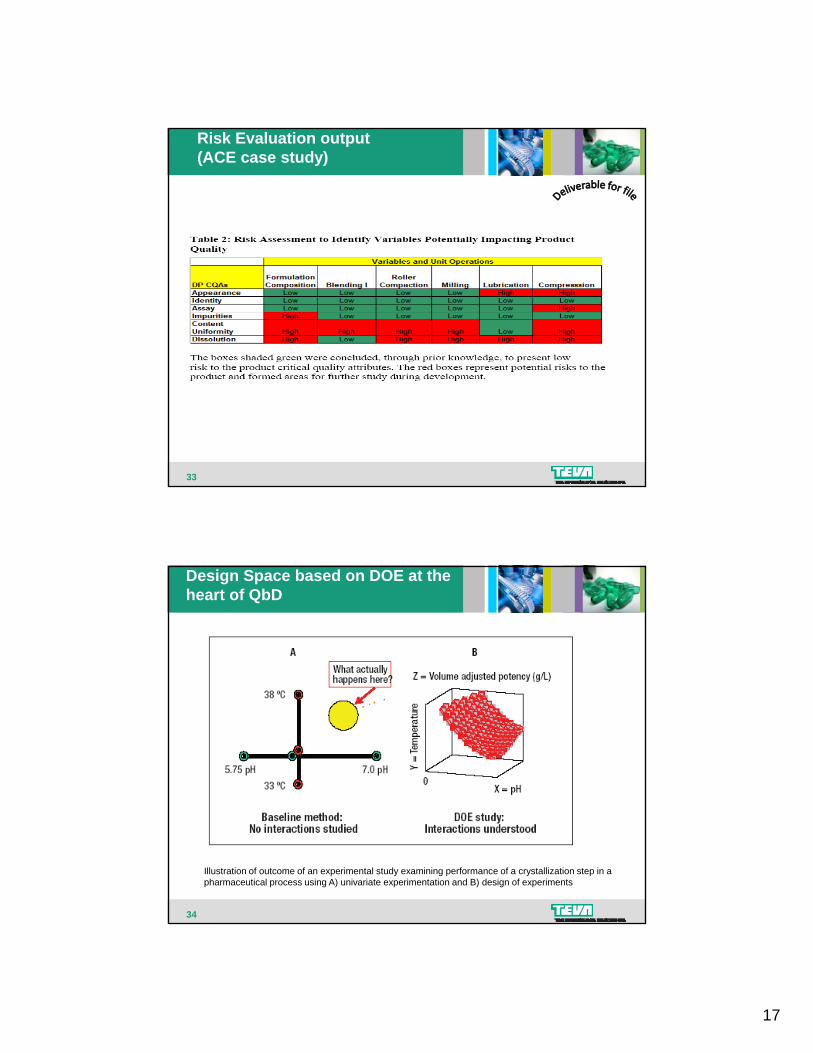
Risk Evaluation output (ACE case study)
33
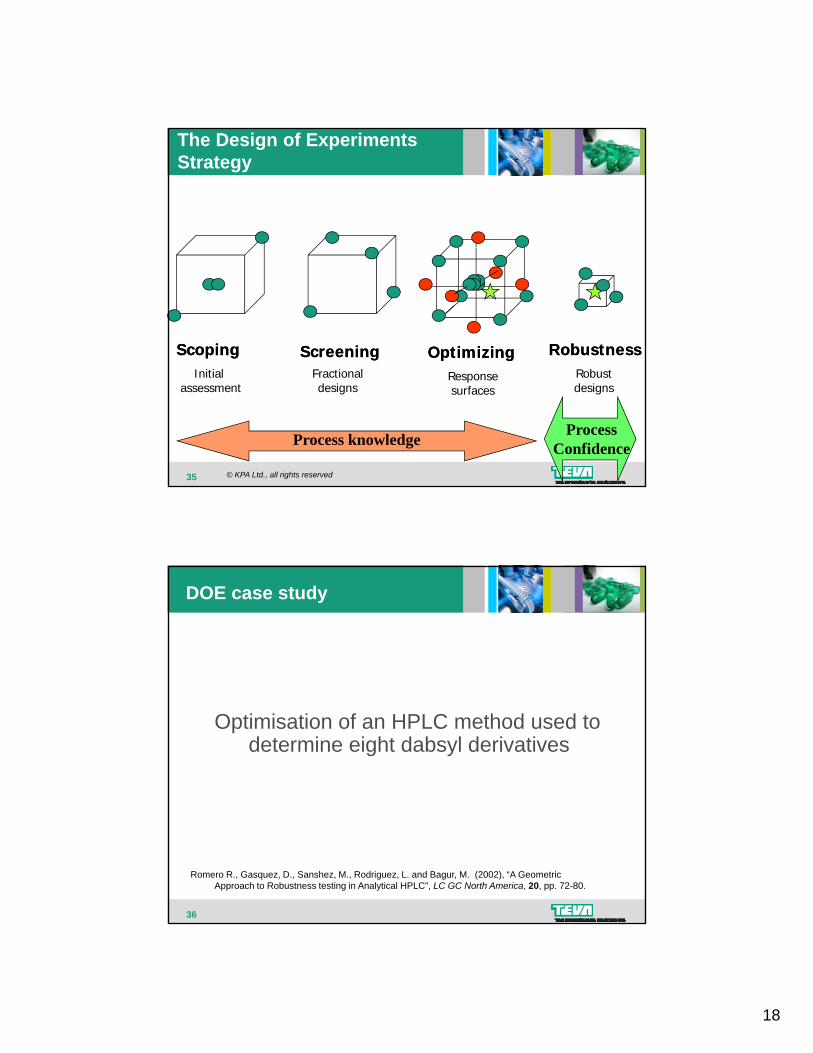
Design Space based on DOE at the heart of QbD
34
Illustration of outcome of an experimental study examining performance of a crystallization step in a pharmaceutical process using A) univariate experimentation and B) design of experiments
18
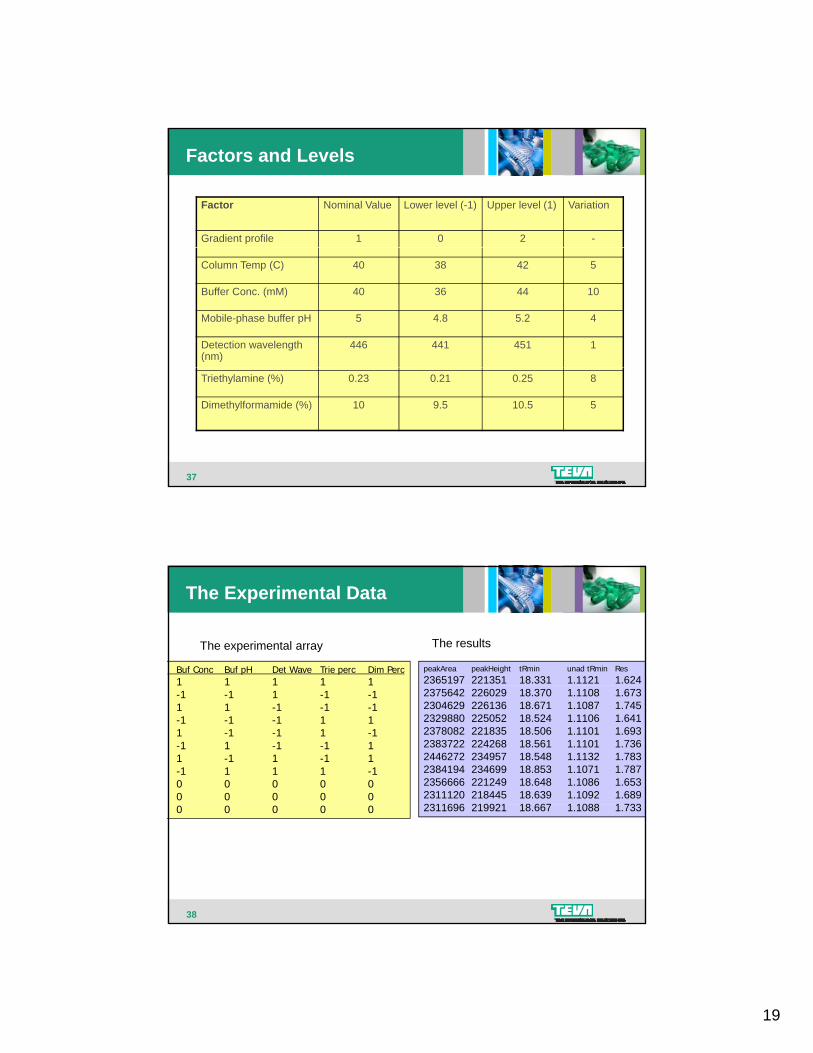
The Design of Experiments Strategy
ScopingScoping ScreeningScreening OptimizingOptimizing RobustnessRobustness
35
Initial assessment
Fractionaldesigns
Responsesurfaces
Robustdesigns
Process knowledge ProcessConfidence
© KPA Ltd., all rights reserved
DOE case study
Optimisation of an HPLC method used to determine eight dabsyl derivatives
36
Romero R., Gasquez, D., Sanshez, M., Rodriguez, L. and Bagur, M. (2002), “A Geometric Approach to Robustness testing in Analytical HPLC”, LC GC North America, 20, pp. 72-80.
19
Factors and Levels
VariationUpper level (1)Lower level (-1)Nominal ValueFactor
-201Gradient profile
5423840Column Temp (C)
10443640Buffer Conc. (mM)
45.24.85Mobile-phase buffer pH
1451441446Detection wavelength (nm)
37
80.250.210.23Triethylamine (%)
510.59.510Dimethylformamide (%)
The Experimental Data
Buf Conc Buf pH Det Wave Trie perc Dim Perc1 1 1 1 1
peakArea peakHeight tRmin unad tRmin Res2365197 221351 18.331 1.1121 1.624
The experimental array The results
1 1 1 1 1-1 -1 1 -1 -11 1 -1 -1 -1-1 -1 -1 1 11 -1 -1 1 -1-1 1 -1 -1 11 -1 1 -1 1-1 1 1 1 -10 0 0 0 00 0 0 0 0
2375642 226029 18.370 1.1108 1.6732304629 226136 18.671 1.1087 1.7452329880 225052 18.524 1.1106 1.6412378082 221835 18.506 1.1101 1.6932383722 224268 18.561 1.1101 1.7362446272 234957 18.548 1.1132 1.7832384194 234699 18.853 1.1071 1.7872356666 221249 18.648 1.1086 1.6532311120 218445 18.639 1.1092 1.6892311696 219921 18 667 1 1088 1 733
38
0 0 0 0 0 2311696 219921 18.667 1.1088 1.733
20
Resolution Main Effects
Main Effects Plot (data means) for ResCenterpoint
1-1 1-1 1-1 1-1 1-1 1-1 1-1
1.75
1.73
1.71
1.69
Res
39
Dim PercTrie percDet WaveBuf pHBuf ConcCol TempGradient1.67
Interaction Plot
1-11-11-11-11-11-1
1.751.701.65
1.751 70
Gradient
Col Temp1
1-1
Interaction Plot (data means) for ResCenterpoint
No interactions
Interactions
1.701.65
1.751.701.65
1.751.701.65
1.751.701.65
1.751.701.65
Buf Conc
Buf pH
Det Wave
Trie perc
Dim Perc
1-1
1-1
1-1
1-1
-1No interactions
40
Dim Perc
Res= Y + a x Gradient + b x Col. Temp. + c x Buff. Conc. + d x Det. Wave+ e x interactions
Output: Mathematical function relating response to process parameters
21
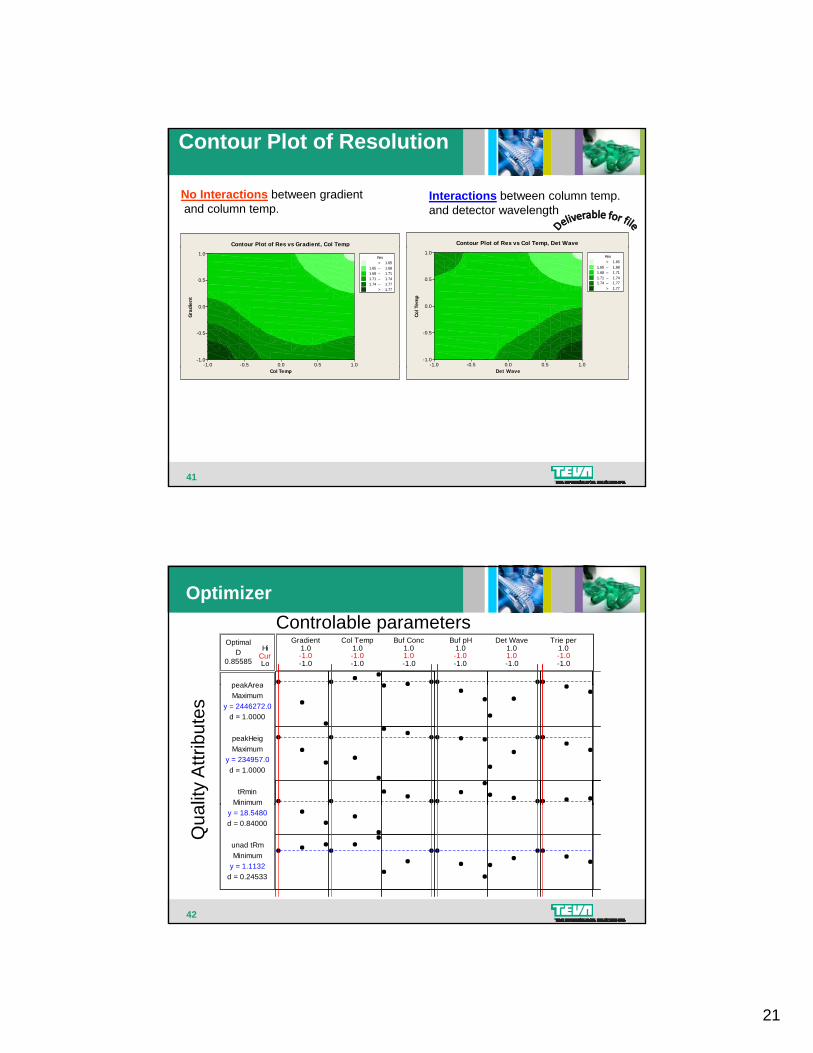
Contour Plot of Resolution
Contour Plot of Res vs Col Temp, Det WaveContour Plot of Res vs Gradient, Col Temp
No Interactions between gradientand column temp.
Interactions between column temp. and detector wavelength
Col T
emp
1.00.50.0-0.5-1.0
1.0
0.5
0.0
-0.5
-1.0
> – – – – < 1.65
1.65 1.681.68 1.711.71 1.741.74 1.77
1.77
Res
Grad
ient
1.00.50.0-0.5-1.0
1.0
0.5
0.0
-0.5
-1.0
> – – – – < 1.65
1.65 1.681.68 1.711.71 1.741.74 1.77
1.77
Res
41
Det WaveCol Temp
Hi
Lo0.85585D
Optimal
Cur
peakArea
-1.0
1.0
-1.0
1.0
-1.0
1.0
-1.0
1.0
-1.0
1.0
-1.0
1.0Col Temp Buf Conc Buf pH Det Wave Trie perGradient
-1.0 -1.0 1.0 -1.0 1.0 -1.0
OptimizerControlable parameters
MinimumtRmin
d = 1.0000
MaximumpeakHeig
d = 1.0000
MaximumpeakArea
y = 234957.0
y = 2446272.0
lity
Attr
ibut
es
42
d = 0.24533
Minimumunad tRm
d = 0.84000
u
y = 1.1132
y = 18.5480
Qua

22
Optimizer
Response OptimizationParameters
Goal Lower Target Upper Weight ImportpeakArea Maximum 2300000 2400000 2400000 1 3peakHeight Maximum 220000 230000 230000 1 3p gtRmin Minimum 19 19 19 1 1unad tRmin Minimum 1 1 1 1 1Res Maximum 2 2 2 1 5Global SolutionGradient = -1Col Temp = -1Buf Conc = 1Buf pH = -1Det Wave = 1Trie perc = -1Dim Perc = 1
43
Dim Perc = 1Predicted ResponsespeakArea = 2446272, desirability = 1.00000peakHeight = 234957, desirability = 1.00000tRmin = 19, desirability = 0.84000unad tRmin = 1, desirability = 0.24533Res = 2, desirability = 0.91500Composite Desirability = 0.85585
The Design Space of the HPLC method:Reaction Temperature and pH Interactions
DESIGN-EXPERT Plot
Th b b llActual Factors:
X = pH
Y = temp
Actual Constants:
gl-7-aca = 45.00
enzyme = 7.000.000
0.240
0.479
0.719
0.959
Des
irabi
lity
The baseball hat
44 7.00
7.37
7.75
8.12
8.50
10.00
13.75
17.50
21.25
25.00
pH temp
23
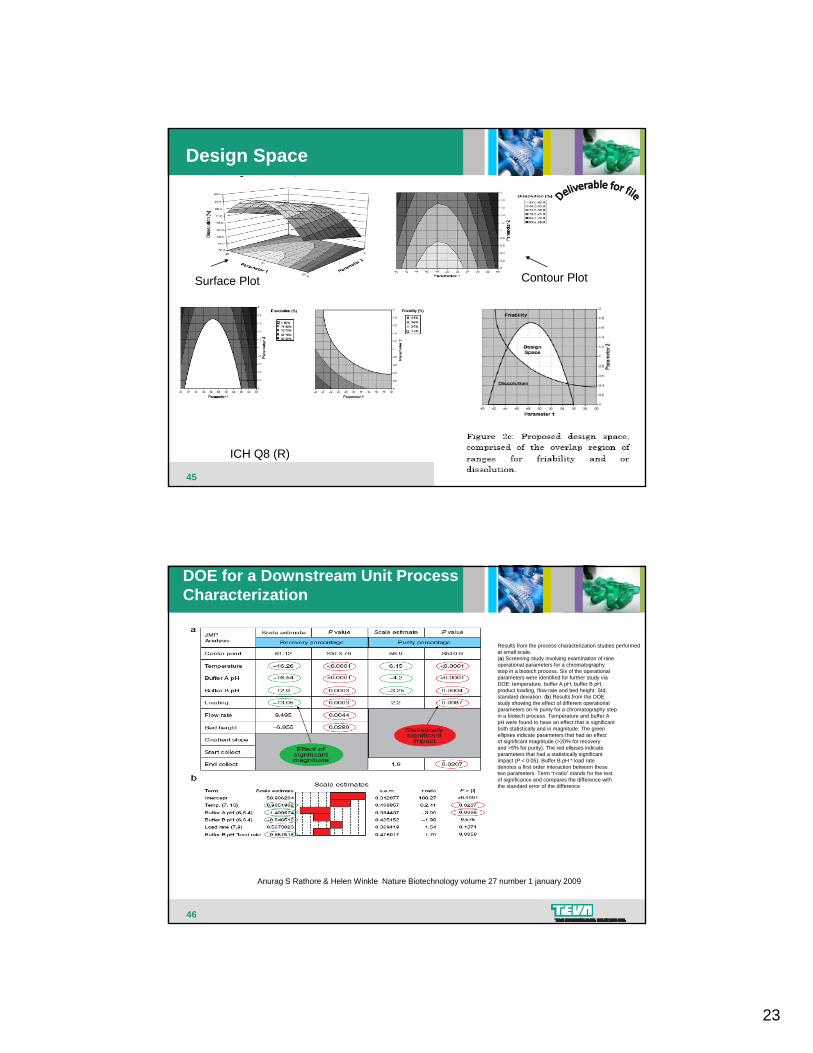
Design Space
Surface Plot Contour Plot
45
ICH Q8 (R)
DOE for a Downstream Unit Process Characterization
Results from the process characterization studies performed at small scale.(a) Screening study involving examination of nineoperational parameters for a chromatographystep in a biotech process. Six of the operationalparameters were identified for further study viaDOE: temperature buffer A pH buffer B pHDOE: temperature, buffer A pH, buffer B pH,product loading, flow rate and bed height. Std,standard deviation. (b) Results from the DOEstudy showing the effect of different operationalparameters on % purity for a chromatography stepin a biotech process. Temperature and buffer ApH were found to have an effect that is significantboth statistically and in magnitude. The greenellipses indicate parameters that had an effectof significant magnitude (>20% for recoveryand >5% for purity). The red ellipses indicateparameters that had a statistically significantimpact (P < 0.05). Buffer B pH * load ratedenotes a first order interaction between thesetwo parameters. Term “t-ratio” stands for the testof significance and compares the difference withthe standard error of the difference
46
Anurag S Rathore & Helen Winkle Nature Biotechnology volume 27 number 1 january 2009

24
Process Design Space
47
Anurag S Rathore & Helen Winkle Nature Biotechnology volume 27 number 1 january 2009
Clinical Design spaceFor Innovator (from clinical lots)For Biosimilar (from Innovator lots)
Product Design space
1 Lot 5 Lots
Product Design space
Process Design space
48Anurag S Rathore & Helen Winkle Nature Biotechnology volume 27 number 1 january 2009
25
49
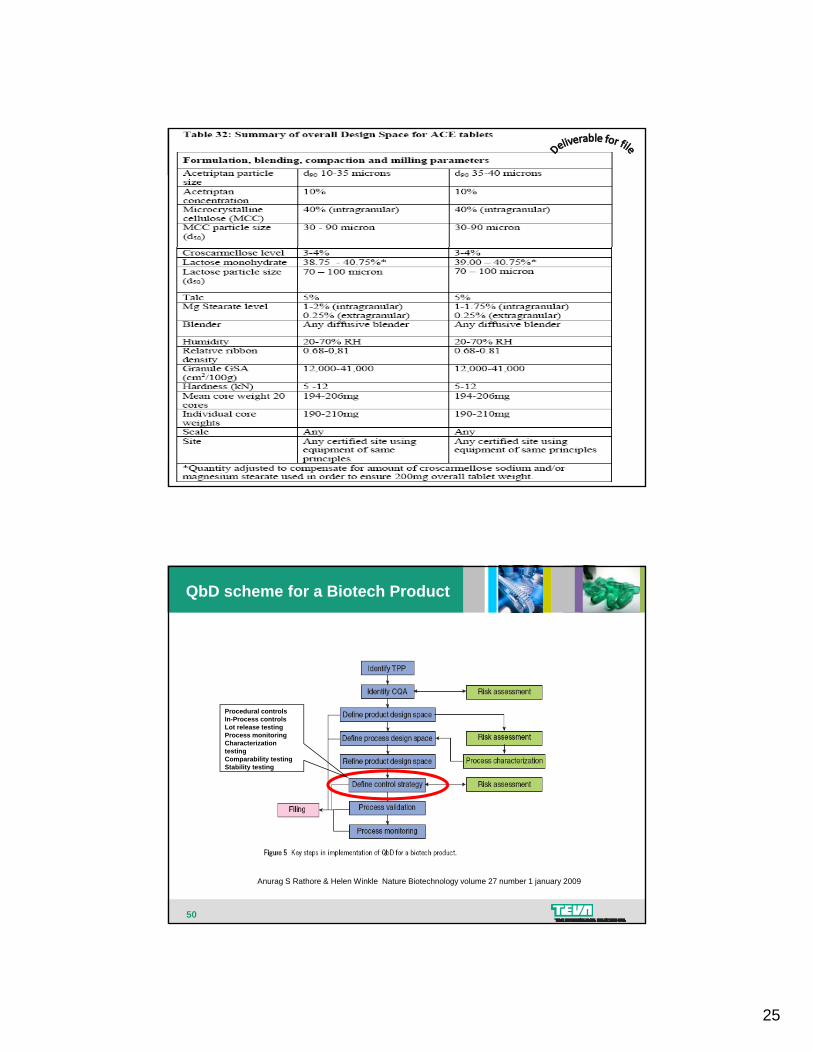
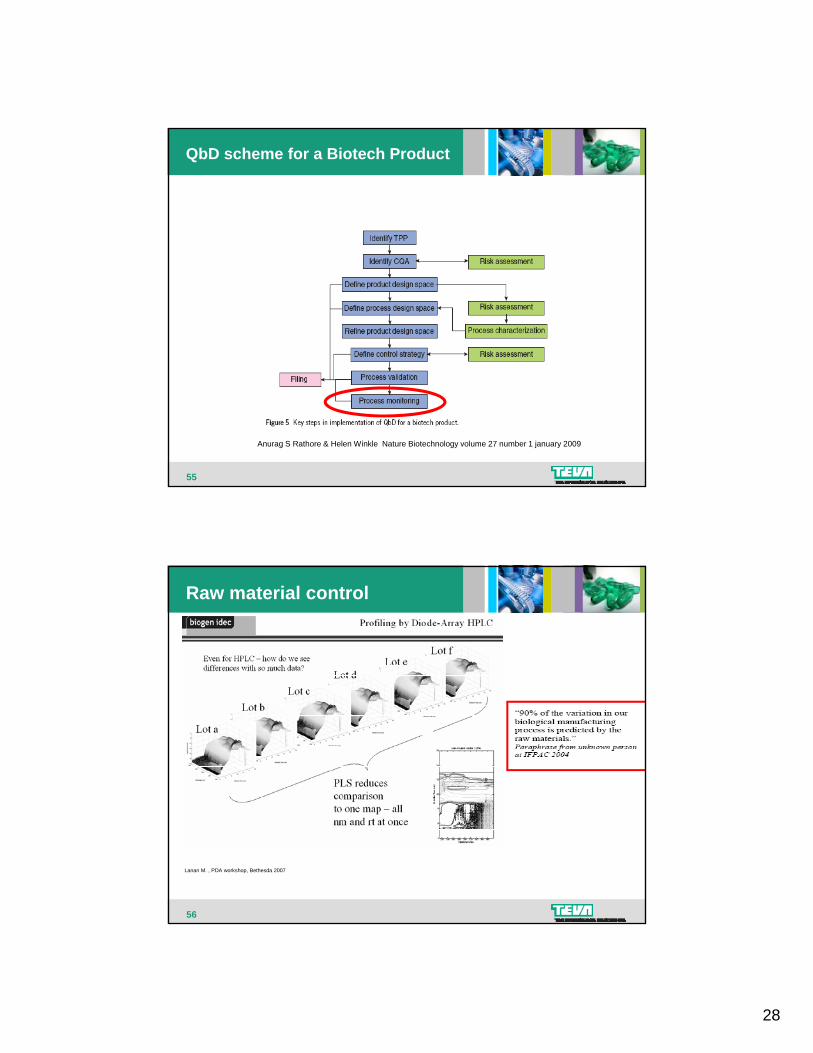
QbD scheme for a Biotech Product
Procedural controlsIn-Process controlsLot release testingProcess monitoringCharacterization testingComparability testingStability testing
50
Anurag S Rathore & Helen Winkle Nature Biotechnology volume 27 number 1 january 2009
26
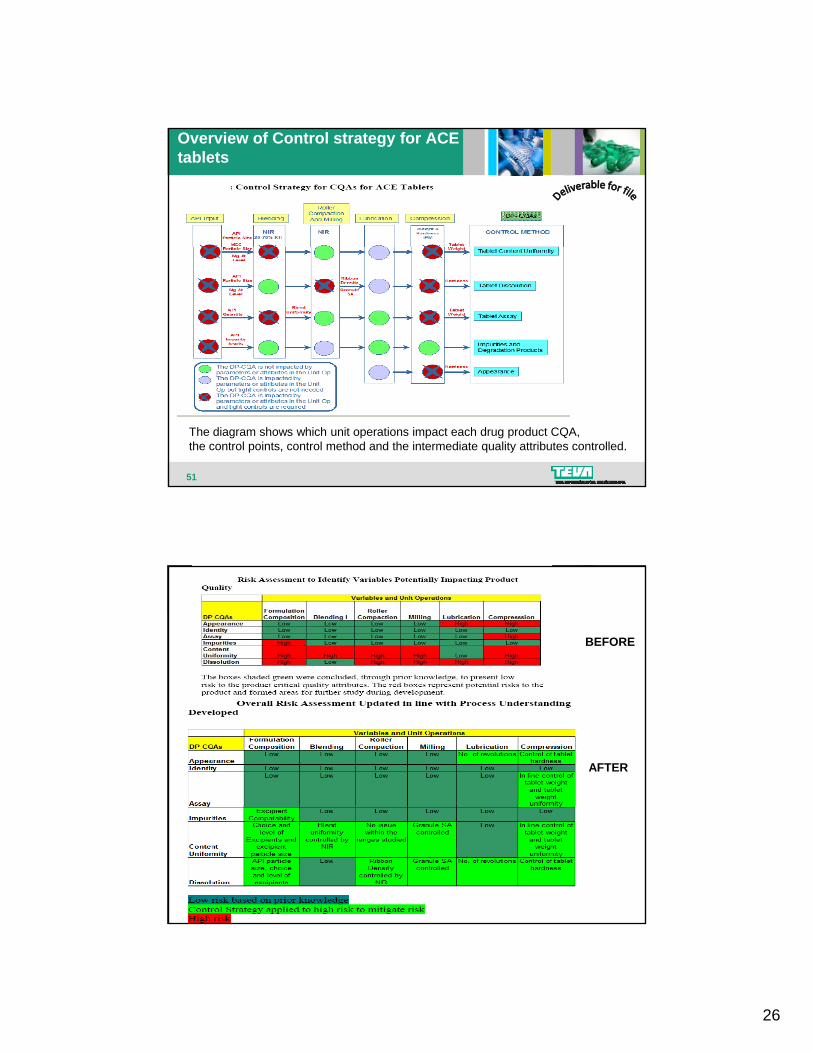
Overview of Control strategy for ACE tablets
51
The diagram shows which unit operations impact each drug product CQA, the control points, control method and the intermediate quality attributes controlled.
BEFORE
AFTER
52

27
QbD scheme for a Biotech Product
53
Anurag S Rathore & Helen Winkle Nature Biotechnology volume 27 number 1 january 2009
Process Validation
Aim to demonstrate:1. Process delivers a product of acceptable quality if operated p p q y p
within Design Space2. Small scale/Pilot system used for the establishment of the
Design Space performs like the manufacturing scale process
Validation acceptance criteria = limits of acceptable variability
54
Validation acceptance criteria = limits of acceptable variability in product quality and process performance
28
QbD scheme for a Biotech Product
55
Anurag S Rathore & Helen Winkle Nature Biotechnology volume 27 number 1 january 2009
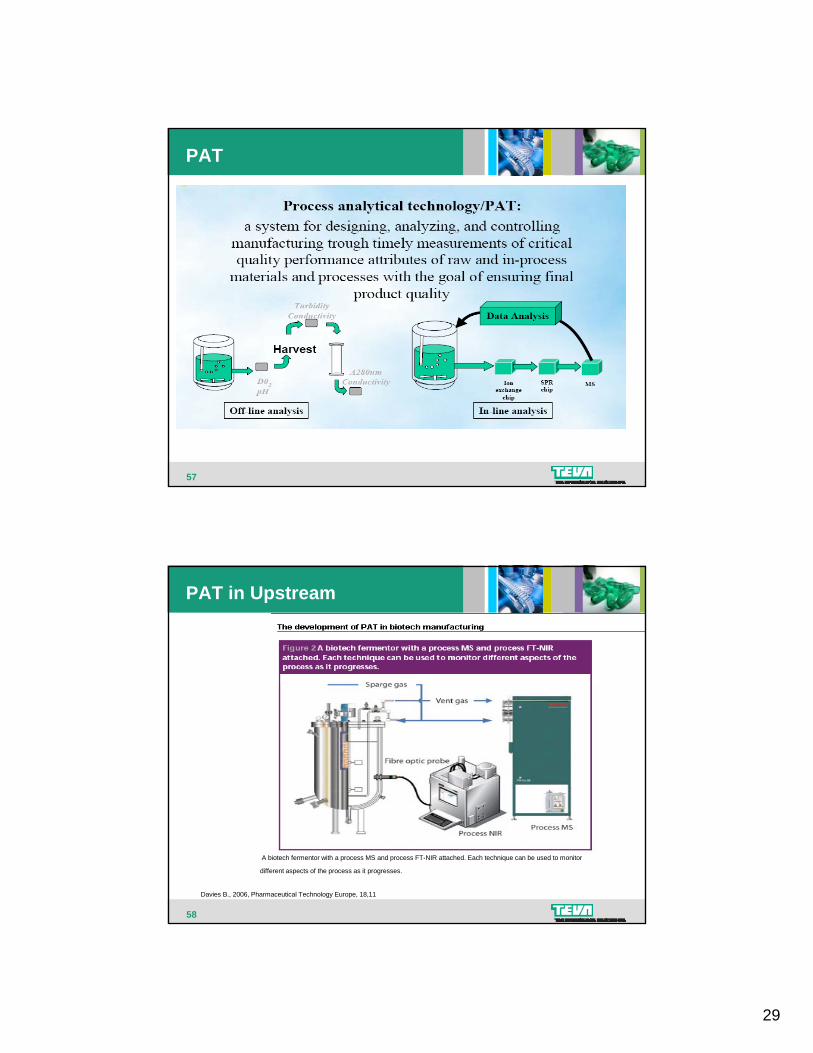
Raw material control
56
Lanan M. , PDA workshop, Bethesda 2007
29
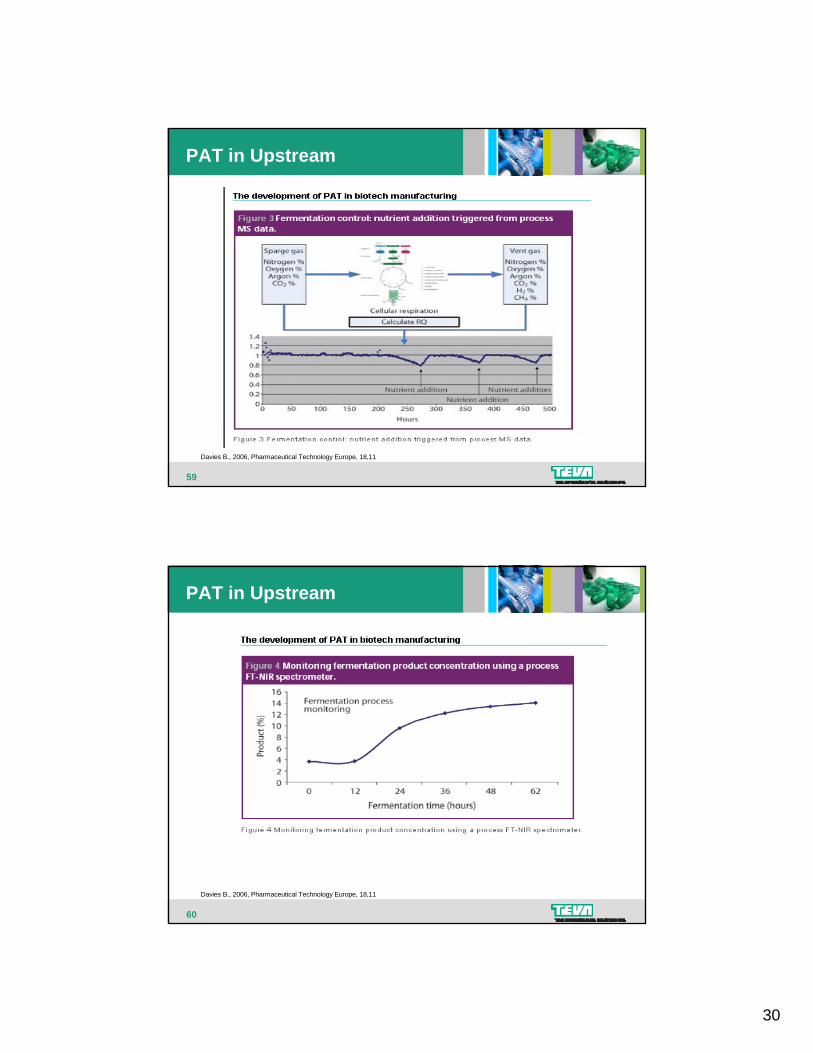
PAT
57
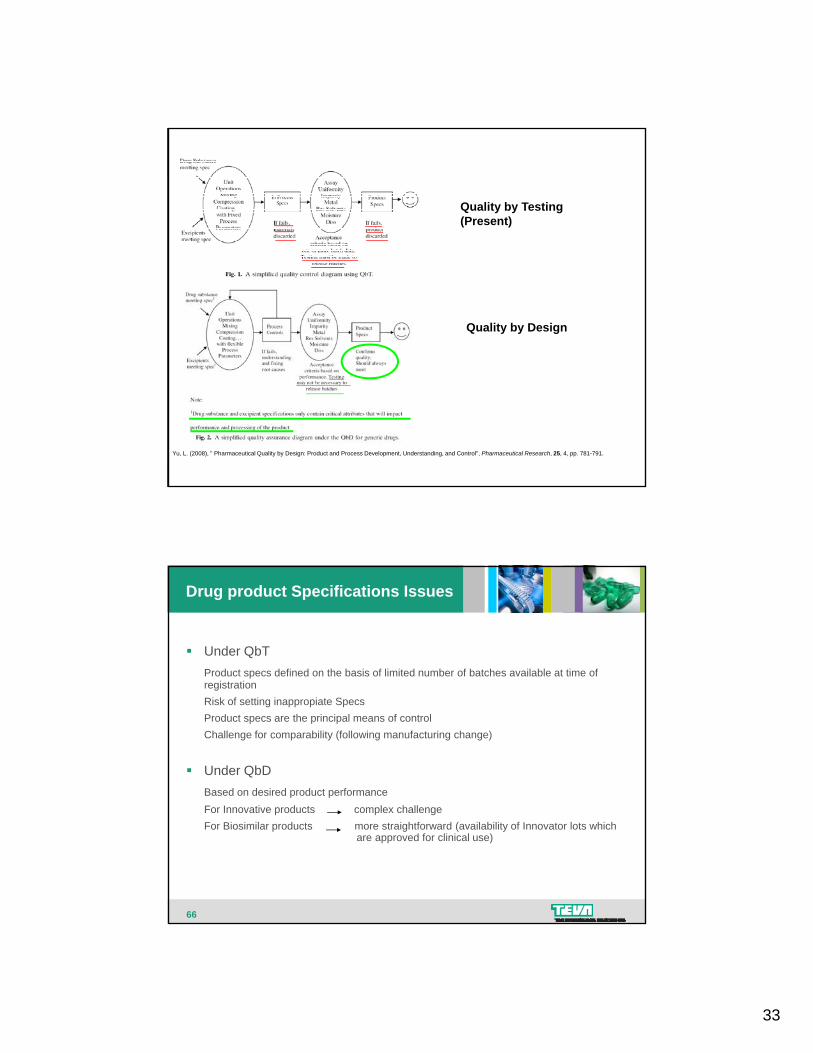
PAT in Upstream
58
A biotech fermentor with a process MS and process FT-NIR attached. Each technique can be used to monitor
different aspects of the process as it progresses.
Davies B., 2006, Pharmaceutical Technology Europe, 18,11
30
PAT in Upstream
59
Davies B., 2006, Pharmaceutical Technology Europe, 18,11
PAT in Upstream
60
Davies B., 2006, Pharmaceutical Technology Europe, 18,11

31
PAT in Downstream
61
Rathore et al 2008 Biotechnol. Bioeng. 100, 306-16
PAT in Downstream
62
Rathmore 2009 Nature Biotechnology

32
Scheme for implementing QbD to a Biopharmaceutical Product
63
Anurag S Rathore & Helen Winkle Nature Biotechnology volume 27 number 1 january 2009
Regulatory Filings
Includes:Process Design SpaceO i f D P dOperating space for Drug ProductRefined Product design spaceDescription of control strategyProcess Validation Plan for Process Monitoring
64
Plan for Process MonitoringComparability or Expanded Change Protocol (to allow future flexibility)
33
What is QbT?
Quality by Testing(Present)
Quality by Design
65
Yu, L. (2008), " Pharmaceutical Quality by Design: Product and Process Development, Understanding, and Control", Pharmaceutical Research, 25, 4, pp. 781-791.
Drug product Specifications Issues
Under QbTProduct specs defined on the basis of limited number of batches available at time of registrationregistrationRisk of setting inappropiate Specs Product specs are the principal means of controlChallenge for comparability (following manufacturing change)
Under QbDBased on desired product performance
66
For Innovative products complex challengeFor Biosimilar products more straightforward (availability of Innovator lots which
are approved for clinical use)
34
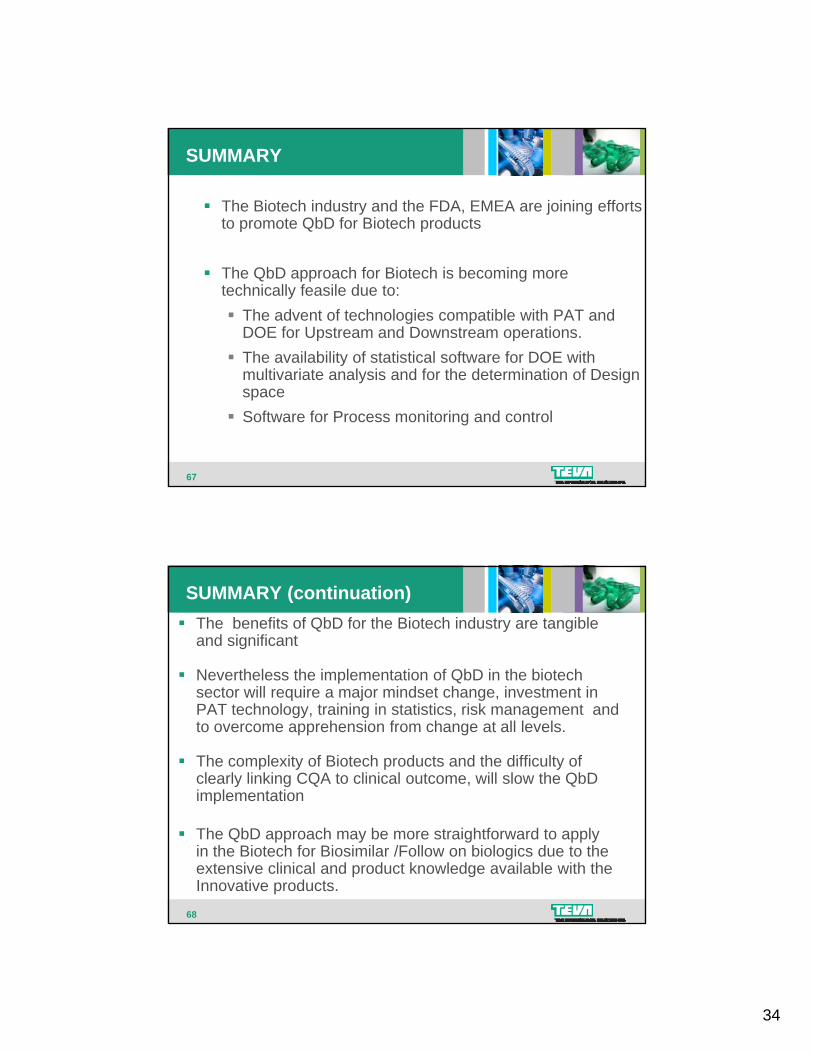
SUMMARY
The Biotech industry and the FDA, EMEA are joining efforts to promote QbD for Biotech products
The QbD approach for Biotech is becoming more technically feasile due to:
The advent of technologies compatible with PAT and DOE for Upstream and Downstream operations.The availability of statistical software for DOE with
67
multivariate analysis and for the determination of Design spaceSoftware for Process monitoring and control
SUMMARY (continuation)The benefits of QbD for the Biotech industry are tangible and significant
Nevertheless the implementation of QbD in the biotech sector will require a major mindset change, investment in PAT technology, training in statistics, risk management and to overcome apprehension from change at all levels.
The complexity of Biotech products and the difficulty of clearly linking CQA to clinical outcome, will slow the QbD implementation
68
The QbD approach may be more straightforward to apply in the Biotech for Biosimilar /Follow on biologics due to the extensive clinical and product knowledge available with the Innovative products.
35
References1. Burnett Gail, Genentech,“Quality by Design in Biotechnology”, BioProcess International analytical and Quality summit, Boston 20082. Moheb Nasr, FDA, “Quality by Design- A modern system approach to Pharmaceutical Development and manufacturing- FDA perspective “ FDA
workshop, North Betsheda 20073. Shacter Emily, FDA, “FDA perspectives on the analytical characterization of Follow-on Protein Products” CASSS Mass Spec 20084. Luigetti Riccardo, EMEA, “QbD a global Implementation Perspective- The EU Perspective. “The Siena conference on product and process
optimization 20085. Windisch Jorg, Sandoz “Pioneering Biosimilars- Perspective of a company that develops Biopharmaceuticals as well as Biosimilars” Vienna
20076. Rathore Anurag, Amgen, “Quality by design for Biopharmaceuticals” Nature Biotechnology ,2009, 27, 26-347. ACE case study, Conformia software, http://www.conformia.com/8. Rathmore Anurag et al., Amgen, “Quality by Design: Industrial case studies on defining and implementing Design space for Pharmaceutical
Processes – Part 1” BioPharm International December 2008, 37-479. Rathore Anurag et al., Amgen,”Case study and application of PAT towards bioprocessing” Biotechnol. Bioeng. 2008,100,306-1610. Rathmore Anurag et al. Amgen, “Quality by Design: Industrial case studies on defining and implementing Design space for Pharmaceutical
Processes – Part 1” BioPharm International January 2009, 36-4411. Ho K. ,EMEA, “Quality by Design Application and Prspectives for Biologicals”12. Levine Howard, BioProcess technology consultants “The use of critical process analysis to reduce risk and increse Biologics product quality” FIP
quality conference, London 2007.13. Davies Brian, “The development of PAT in biotech manufacturing’ Pharmaceutical technology, 2006, vol 18, issue 1114. Q8(R) Pharmaceutical Development, ICH guideline , http://www.ich.org/cache/compo/276-254-1.html15. Q9 Quality risk management, ICH guideline, http://www.ich.org/cache/compo/276-254-1.html16. Q10 Pharmaceutical quality System, ICH guideline, http://www.ich.org/cache/compo/276-254-1.html17. Yu, L. " Pharmaceutical Quality by Design: Product and Process Development, Understanding, and Control", Pharmaceutical Research, 25, 4,
pp. 781-791, 2008.
69
18. Romero R., Gasquez, D., Sanshez, M., Rodriguez, L. and Bagur, M. “A Geometric Approach to Robustness testing in Analytical HPLC”, 2002 , LC GC North America, 20, pp. 72-80
19. Godavarti R. Wyeth, PDA workshop, Bethesda 200720. Lanan M. , Wyeth, PDA workshop, Bethesda 200721. Borman, P., Nethercote, P., Chatfield, M., Thompson, D., Truman, K. (2007), "The Application of Quality by Design to Analytical Methods",
Pharmaceutical Technology.
70