Embed Size (px)
Citation preview
United States Office of Water EPA-823-R-05-005 Environmental Protection 4303T April 2005 Agency Washington, DC 20460
Quality Assurance Report for the NationalStudy of Chemical Residues
in Lake Fish Tissue:Analytical Data for Years 1 through 4
Prepared for:
U.S. Environmental Protection AgencyOffice of WaterOffice of Science and Technology
Prepared by:
CSC Environmental Programs Group
Prepared under:
MOBIS Contract No. GS-23F-9820, Task 68-C-00-137
April 2005

Quality Assurance Reportfor the
National Study of Chemical Residues in Lake Fish Tissue:Year 1 through Year 4 Analytical Data
April 2005
Prepared for
United States Environmental Protection AgencyOffice of Water
Office of Science and Technology
Prepared byCSC Environmental Programs Group
underMOBIS Contract No. GS-23F-9820, Task 68-C-00-137

QA Report for the National Lake Fish Tissue Study i April 2005
TABLE OF CONTENTS
Page
Chapter 1 Introduction . . . . . . . . . . . . . . . . . . . . . . . . . . . . . . . . . . . . . . . . . . . . . . . . . . . . . . . . . 1Section 1.1 Description of Study Objectives and Study Design . . . . . . . . . . . . . . . 1Section 1.2 Study Participants . . . . . . . . . . . . . . . . . . . . . . . . . . . . . . . . . . . . . . . . . 3Section 1.3 References . . . . . . . . . . . . . . . . . . . . . . . . . . . . . . . . . . . . . . . . . . . . . . . 3
Chapter 2 QA Program . . . . . . . . . . . . . . . . . . . . . . . . . . . . . . . . . . . . . . . . . . . . . . . . . . . . . . . . . 5Section 2.1 Collaborative Study Design . . . . . . . . . . . . . . . . . . . . . . . . . . . . . . . . . . 5Section 2.2 Implementation of Approved Quality Assurance Project Plans for
Sampling and Analysis Activities . . . . . . . . . . . . . . . . . . . . . . . . . . . . . 5Section 2.3 Implementation of a Field Orientation/Training Program . . . . . . . . . . 6Section 2.4 Development of Study-Specific Sample Documentation and
Sampling Kits . . . . . . . . . . . . . . . . . . . . . . . . . . . . . . . . . . . . . . . . . . . . 6Section 2.5 Daily Monitoring of Sampling and Laboratory Activities . . . . . . . . . . 6Section 2.6 Weekly to Monthly Reporting of Project Status as Appropriate . . . . . 7Section 2.7 Monthly Project Meetings among EPA Headquarters Staff and
Contractors Responsible for Coordination of Activities . . . . . . . . . . . . 7Section 2.8 Implementation of Thoroughly Documented Methods That
Included All QC Elements Needed to Support Quality ObjectivesEstablished for the Study . . . . . . . . . . . . . . . . . . . . . . . . . . . . . . . . . . . . 7
Section 2.9 Three Levels of Data Quality Assessment and Application ofStandardized Data Qualifiers . . . . . . . . . . . . . . . . . . . . . . . . . . . . . . . . . 8
Section 2.10 Implementation of Standardized Data Format to Allow All Results to be Reported Consistently and Accurately to Data Users . . . 8
Chapter 3 Analytical Methods Employed . . . . . . . . . . . . . . . . . . . . . . . . . . . . . . . . . . . . . . . . . . 9Section 3.1 Sample Prep Lab Procedures . . . . . . . . . . . . . . . . . . . . . . . . . . . . . . . . . 9Section 3.2 Dioxins/Furans . . . . . . . . . . . . . . . . . . . . . . . . . . . . . . . . . . . . . . . . . . 10Section 3.3 Polychlorinated Biphenyls (PCBs) . . . . . . . . . . . . . . . . . . . . . . . . . . . 11Section 3.4 Total Mercury . . . . . . . . . . . . . . . . . . . . . . . . . . . . . . . . . . . . . . . . . . . 11Section 3.5 Arsenic Species . . . . . . . . . . . . . . . . . . . . . . . . . . . . . . . . . . . . . . . . . . 11Section 3.6 Organochlorine Pesticides . . . . . . . . . . . . . . . . . . . . . . . . . . . . . . . . . . 12Section 3.7 Organophosphorus Pesticides . . . . . . . . . . . . . . . . . . . . . . . . . . . . . . . 12Section 3.8 Semivolatile Organics . . . . . . . . . . . . . . . . . . . . . . . . . . . . . . . . . . . . . 12
Chapter 4 Data Quality Assessment . . . . . . . . . . . . . . . . . . . . . . . . . . . . . . . . . . . . . . . . . . . . . . 15Section 4.1 Pre-Qualification Review . . . . . . . . . . . . . . . . . . . . . . . . . . . . . . . . . . 15Section 4.2 Individual Data Package Review . . . . . . . . . . . . . . . . . . . . . . . . . . . . 19Section 4.3 Overall Data Quality Assessment . . . . . . . . . . . . . . . . . . . . . . . . . . . . 30
April 2005 ii QA Report for the National Lake Fish Tissue Study
LIST OF EXHIBITS
Exhibit 1-1 Study Design Highlights . . . . . . . . . . . . . . . . . . . . . . . . . . . . . . . . . . . . . . . . . . . . 2Exhibit 1-2 Overview of Study Participants . . . . . . . . . . . . . . . . . . . . . . . . . . . . . . . . . . . . . . . 3Exhibit 3-1 National Lake Fish Tissue Study Target Analytes and Corresponding
Analysis Methods . . . . . . . . . . . . . . . . . . . . . . . . . . . . . . . . . . . . . . . . . . . . . . . . 13Exhibit 4-1A Summary (Target Analytes) of Data Review Qualifiers Used for Year 1
through Year 4 of the National Lake Fish Tissue Study . . . . . . . . . . . . . . . . . . . 34Exhibit 4-1B Summary (Non-Target Analytes) of Data Review Qualifiers Used for Year 1
through Year 4 of the National Lake Fish Tissue Study . . . . . . . . . . . . . . . . . . . 48
QA Report for the National Lake Fish Tissue Study 1 April 2005
Chapter 1Introduction
This report documents the quality of data gathered during the National Study of ChemicalResidues in Lake Fish Tissue (hereafter referred to as either the “National Lake Fish TissueStudy” or, more simply, “the Study.” Please note that the abbreviated name for the studychanged from “National Fish Tissue Study” during 2004.). For reference purposes, this reportprovides a brief overview of the study and outlines the primary participants and the analyticalparameters measured. Additional details concerning the design and implementation of this studycan be found in the references listed at the end of this chapter.
SECTION 1.1 DESCRIPTION OF STUDY OBJECTIVES AND STUDY DESIGN
The National Lake Fish Tissue Study is a screening-level study designed to estimate the nationaldistribution of selected persistent, bioaccumulative, and toxic (PBT) chemical concentrations infish tissue from lakes and reservoirs of the contiguous United States. The study involves thecollection of predator and bottom-dwelling fish from 500 randomly selected lakes and reservoirsin the lower 48 states (excluding the Great Lakes) over a period of 4 years (~125 lakes per year). The study began during the fall of 1999; however, full implementation did not commence until2000. For this reason, tissue samples collected during the 1999 mobilization and 2000implementation periods cumulatively represent Year 1 of the Study.
The study design resulted from a comprehensive planning effort that included a nationalworkshop involving more than 50 scientists from state, federal, and tribal agencies to obtaintechnical input on sampling design, target analytes, sampling methods and data management. The final study design is described in Reference 1 of this chapter and highlighted in Exhibit 1-1.
Implementation of the study is a collaborative effort being led by the Environmental ProtectionAgency’s (EPA) Office of Science and Technology (OST), within the Office of Water (OW),with extensive support from participating states and tribes, EPA Regions, and the Office ofResearch and Development’s (ORD) Environmental Monitoring and Assessment Program(EMAP). States, Tribes, and EPA Regional staff collected most of the fish for the study. Contractor support is being provided by Tetra Tech (for study design, orientation/training,workshops, field sampling activities, data compilation, and project reporting), CSCEnvironmental Programs Group ([formerly DynCorp Environmental] for sampling kits, samplecoordination and tracking, data review and reporting, and database development), and thefollowing laboratories: Axys Analytical Services in Sydney, British Columbia, Canada; BattelleOcean Sciences in Duxbury, MA; Battelle Marine Sciences in Sequim, WA; and PacificAnalytical Inc., in Carlsbad, CA (see Exhibit 1-2, Overview of Study Participants.)
The 500 lakes sampled for the study were statistically selected to meet study objectives. Toallow study objectives to be met in the event that all four years of sampling could not becompleted, the lakes were statistically sub-sampled and classified as Year 1, Year 2, Year 3, orYear 4 lakes. These statistical designations did not always conform to resources available at thestate level in the assigned years. Therefore, some states requested and received permission tocollect samples from a lake in a year other than the year that the lake was designated to besampled. Consequently, it is important to note that the Year 1, Year 2, Year 3, and Year 4 data
April 2005 2 QA Report for the National Lake Fish Tissue Study
sets described in this report do not correspond to the annual statistical subsets of lakes. Todistinguish the annual statistical subsets from the lakes actually sampled during the first throughthe fourth years of the study, they are now being referred to as Panel 1, Panel 2, Panel 3, andPanel 4 lakes. The 500 lakes sampled during the four years of the study consisted of 120 Panel 1lakes, 109 Panel 2 lakes, 105 Panel 3 lakes, 109 Panel 4 lakes, and 57 lakes from a set ofstatistically drawn “reserve” lakes.
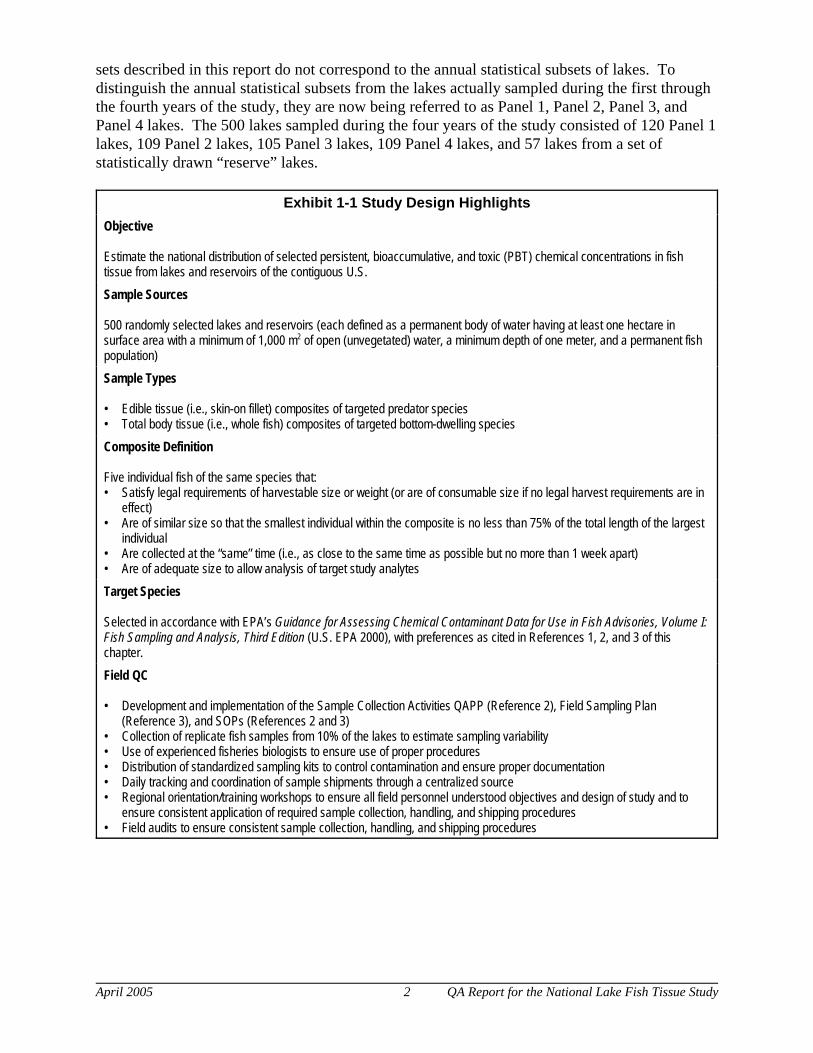
Exhibit 1-1 Study Design HighlightsObjective
Estimate the national distribution of selected persistent, bioaccumulative, and toxic (PBT) chemical concentrations in fishtissue from lakes and reservoirs of the contiguous U.S.Sample Sources
500 randomly selected lakes and reservoirs (each defined as a permanent body of water having at least one hectare insurface area with a minimum of 1,000 m2 of open (unvegetated) water, a minimum depth of one meter, and a permanent fishpopulation)Sample Types
• Edible tissue (i.e., skin-on fillet) composites of targeted predator species• Total body tissue (i.e., whole fish) composites of targeted bottom-dwelling speciesComposite Definition
Five individual fish of the same species that:• Satisfy legal requirements of harvestable size or weight (or are of consumable size if no legal harvest requirements are in
effect)• Are of similar size so that the smallest individual within the composite is no less than 75% of the total length of the largest
individual• Are collected at the “same” time (i.e., as close to the same time as possible but no more than 1 week apart)• Are of adequate size to allow analysis of target study analytesTarget Species
Selected in accordance with EPA’s Guidance for Assessing Chemical Contaminant Data for Use in Fish Advisories, Volume I:Fish Sampling and Analysis, Third Edition (U.S. EPA 2000), with preferences as cited in References 1, 2, and 3 of thischapter.Field QC
• Development and implementation of the Sample Collection Activities QAPP (Reference 2), Field Sampling Plan(Reference 3), and SOPs (References 2 and 3)
• Collection of replicate fish samples from 10% of the lakes to estimate sampling variability• Use of experienced fisheries biologists to ensure use of proper procedures• Distribution of standardized sampling kits to control contamination and ensure proper documentation• Daily tracking and coordination of sample shipments through a centralized source• Regional orientation/training workshops to ensure all field personnel understood objectives and design of study and to
ensure consistent application of required sample collection, handling, and shipping procedures• Field audits to ensure consistent sample collection, handling, and shipping procedures
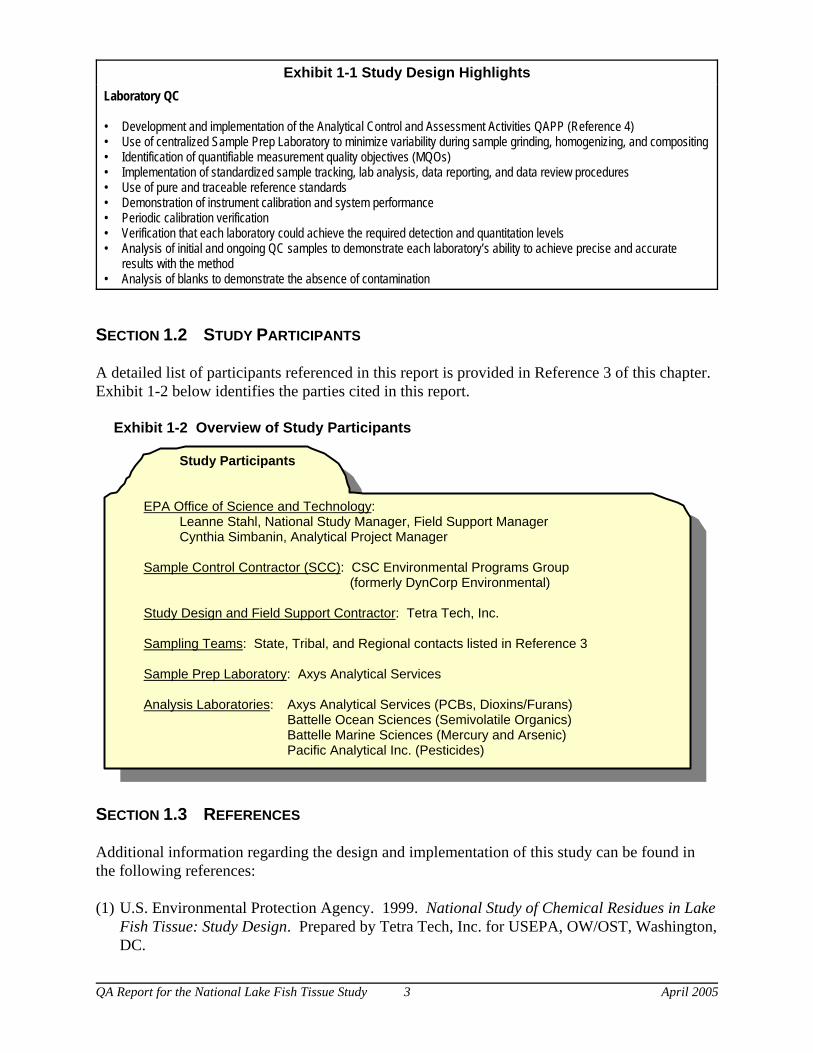
Exhibit 1-1 Study Design Highlights
QA Report for the National Lake Fish Tissue Study 3 April 2005
Laboratory QC
• Development and implementation of the Analytical Control and Assessment Activities QAPP (Reference 4)• Use of centralized Sample Prep Laboratory to minimize variability during sample grinding, homogenizing, and compositing• Identification of quantifiable measurement quality objectives (MQOs)• Implementation of standardized sample tracking, lab analysis, data reporting, and data review procedures• Use of pure and traceable reference standards• Demonstration of instrument calibration and system performance• Periodic calibration verification• Verification that each laboratory could achieve the required detection and quantitation levels• Analysis of initial and ongoing QC samples to demonstrate each laboratory’s ability to achieve precise and accurate
results with the method• Analysis of blanks to demonstrate the absence of contamination
SECTION 1.2 STUDY PARTICIPANTS
A detailed list of participants referenced in this report is provided in Reference 3 of this chapter. Exhibit 1-2 below identifies the parties cited in this report.
Exhibit 1-2 Overview of Study Participants
Study Participants
EPA Office of Science and Technology:Leanne Stahl, National Study Manager, Field Support ManagerCynthia Simbanin, Analytical Project Manager
Sample Control Contractor (SCC): CSC Environmental Programs Group (formerly DynCorp Environmental)
Study Design and Field Support Contractor: Tetra Tech, Inc.
Sampling Teams: State, Tribal, and Regional contacts listed in Reference 3
Sample Prep Laboratory: Axys Analytical Services
Analysis Laboratories: Axys Analytical Services (PCBs, Dioxins/Furans)Battelle Ocean Sciences (Semivolatile Organics)Battelle Marine Sciences (Mercury and Arsenic)Pacific Analytical Inc. (Pesticides)
SECTION 1.3 REFERENCES
Additional information regarding the design and implementation of this study can be found inthe following references:
(1) U.S. Environmental Protection Agency. 1999. National Study of Chemical Residues in LakeFish Tissue: Study Design. Prepared by Tetra Tech, Inc. for USEPA, OW/OST, Washington,DC.
April 2005 4 QA Report for the National Lake Fish Tissue Study
(2) U.S. Environmental Protection Agency. 2000. Quality Assurance Project Plan for SampleCollection Activities for a National Study of Chemical Residues in Lake Fish Tissue. Prepared by Tetra Tech, Inc., for USEPA, OW/OST, Washington, DC.
(3) U.S. Environmental Protection Agency. 2000. Field Sampling Plan for the National Studyof Chemical Residues in Lake Fish Tissue. Prepared by Tetra Tech, Inc. for USEPA,OW/OST, Washington, DC.
(4) U.S. Environmental Protection Agency. 2000. Quality Assurance Project Plan forAnalytical Control and Assessment Activities in the National Study of Chemical Residues inLake Fish Tissue. Prepared by CSC Environmental Programs Group (formerly DynCorpEnvironmental) for USEPA, OW/OST, Washington, DC.
The first three documents are available from Leanne Stahl, National Study Manager, and thefinal document is available from Cynthia Simbanin, Analytical Project Manager, at the followingaddresses:
Leanne StahlUSEPA/OST (4305T)
1200 Pennsylvania Avenue, NWWashington, DC [email protected]
Cynthia SimbaninUSEPA/OST (4303T)
1200 Pennsylvania Avenue, NWWashington, DC 20460
QA Report for the National Lake Fish Tissue Study 5 April 2005
Chapter 2QA Program
At the outset of the National Lake Fish Tissue Study, EPA managers recognized that datagathered from the study would be used extensively by individuals responsible for makingenvironmental, economic, and policy decisions. Environmental measurements always containsome level of uncertainty. Decision makers, therefore, must recognize the uncertainty associatedwith the data on which their decisions are based. In recognition of this, the study managersestablished a quality assurance (QA) program intended to ensure that data produced under theNational Lake Fish Tissue Study would meet defined standards of quality within a specifiedlevel of confidence (see Chapter 1, References 2 and 4).
Implementation of the QA Program ensured that all Measurement Quality Objectives(MQOs) were met in Year 1, Year 2, Year 3, and Year 4 of the Study and that not asingle sample was lost or misidentified.
The study QA program prescribes minimum requirements to which all organizations that gatherdata are required to adhere. All of these elements were followed during each year of the study,and data quality was defined, controlled, and assessed through these QA program activities. Theremainder of this chapter highlights the QA program employed during the study.
SECTION 2.1 COLLABORATIVE STUDY DESIGN
Development of the study design was a collaborative effort among EPA’s Office of Water (OW),Office of Research and Development (ORD), and Office of Prevention, Pesticides, and ToxicSubstances (OPPTS), with significant involvement by biologists, chemists, and statisticians inOW's Office of Science and Technology (OST), statisticians in ORD’s EnvironmentalMonitoring Assessment Program (EMAP), and chemists in OPPTS. The draft design wasreviewed by experts throughout federal, state, and tribal organizations (including EPA, theNational Oceanic and Atmospheric Administration (NOAA), U.S. Geological Survey (USGS),and state and tribal environmental, wildlife, and fisheries management agencies) via a two-dayworkshop. Input obtained during this workshop was incorporated into the final study design.
SECTION 2.2 IMPLEMENTATION OF APPROVED QUALITY ASSURANCE PROJECTPLANS FOR SAMPLING AND ANALYSIS ACTIVITIES
Two Quality Assurance Project Plans (QAPPs) were developed and approved by EPA to supportthis study. The Quality Assurance Project Plan for Sample Collection Activities for a NationalStudy of Chemical Residues in Lake Fish Tissue (May 2000) establishes data quality goals for allsample collection and handling activities and describes the QA/Quality Control (QC) techniquesemployed by field teams and the field support contractor to support those goals. The QualityAssurance Project Plan for Analytical Control and Assessment Activities in the National Study ofChemical Residues in Lake Fish Tissue (September 2000) establishes MQOs for laboratory datagenerated during the study and describes QA/QC techniques employed by laboratory and samplecontrol contractor (SCC) staff to ensure these goals are met.
April 2005 6 QA Report for the National Lake Fish Tissue Study
SECTION 2.3 IMPLEMENTATION OF A FIELD ORIENTATION/TRAINING PROGRAM
Because the study design relied on a large number of state, tribal, and federal sampling teams,EPA established a field orientation and training program to ensure that personnel responsible forsampling activities within each organization understood the study objectives, were familiar withpaperwork developed specifically to document sample collection activities under the study, andwere prepared to collect, document, and ship samples in accordance with the standard operatingprocedures (SOPs) and the sample collection QAPP.
SECTION 2.4 DEVELOPMENT OF STUDY-SPECIFIC SAMPLE DOCUMENTATION ANDSAMPLING KITS
The study design calls for collection of fish samples by multiple teams from participating states,tribes, and EPA Regions. To ensure samples were consistently documented by such a large anddiverse group, several documentation materials were custom-designed for the study. Theseforms include a:
• Field Record Form to document information about each lake sampled and individualspecimens collected from the lake,
• Sample Identification Label to accompany and identify each fish specimen,
• Chain-of-Custody Form to provide constant tracking information for all samples, and
• Chain-of-Custody Label to seal each shipping container.
These forms were being provided annually in custom-made sampling kits prepared by the SCC. The kits also contained contaminant-free materials needed to store each specimen (i.e., solvent-rinsed aluminum foil and food grade polyethylene tubing), a reference instruction sheet withcontact phone numbers, and pre-completed forms needed to ship the specimens to the SamplePrep Laboratory for homogenization and compositing. In addition, sample Traffic Reports werecreated for use by the Sample Prep Laboratory to document each homogenized composite aliquotthat was sent to either an Analysis Lab or to the Sample Repository for long-term storage. Implementation of these tools in all four sampling years of the study (2000-2003) was highlysuccessful.
SECTION 2.5 DAILY MONITORING OF SAMPLING AND LABORATORY ACTIVITIES
To ensure effective communication among all organizations involved in the study, the fieldsupport and SCC contractors were tasked with establishing and implementing a series ofprocedures for the following activities: preparing and distributing sampling kits; coordinatingand tracking sample shipments; identifying corrective actions in the event of lost shipments;reviewing Field Record Forms to identify and notify EPA of fish samples that deviated from thesample criteria and recommending corrective actions; obtaining laboratory analyses; reviewinglaboratory data; and generating a STORET-compatible database of study results. Theseactivities were highly successful in controlling the quality of data during all four years of thestudy. Not a single sample was lost during the study, and all potential deviations from the studydesign were mitigated by these early identification techniques.
QA Report for the National Lake Fish Tissue Study 7 April 2005
SECTION 2.6 WEEKLY TO MONTHLY REPORTING OF PROJECT STATUS ASAPPROPRIATE
Each of the contractors routinely reported the status of project activities to EPA so that theNational Study Manager could monitor study progress (e.g., samples collected, samplesanalyzed, etc.), notify senior EPA management of potential problems and success stories, andcommunicate project status to other organizations supporting the study. Such communicationsprovided a real time means through which the study manager could notify study participants ofimportant issues (e.g., the need to halt sample shipments until air traffic returned to normalfollowing the 2001 terrorist attacks; clarifications concerning the amount of dry ice needed whenshipping coolers; and the need for alternate documentation procedures to streamline the shipmentof samples from the field through Customs to the Sample Prep Laboratory).
SECTION 2.7 MONTHLY PROJECT MEETINGS AMONG EPA HEADQUARTERS STAFFAND CONTRACTORS RESPONSIBLE FOR COORDINATION OF ACTIVITIES
During Year 1 of the study, the National Study Manager held monthly meetings with EAD staffresponsible for managing laboratory and data review activities and with each team of contractorsresponsible for daily tracking of activities. With a full year of study experience behind theteams, the frequency of these meetings was reduced to an as-needed basis in the remaining yearsof the study. The purpose of each meeting was to review study progress, discuss upcomingschedules, and identify and resolve issues. Depending on project activities, additional staff werebrought into these meetings to facilitate planning and resolve issues. Notably, OWrepresentatives responsible for developing and managing STORET were invited to meetings thatincluded discussions of database designs, STORET data upload, and data distribution plans. Likewise, EAD statisticians responsible for interpreting study results were invited to participatein discussions of the procedures used to review, qualify, and report laboratory results.
SECTION 2.8 IMPLEMENTATION OF THOROUGHLY DOCUMENTED METHODS THATINCLUDED ALL QC ELEMENTS NEEDED TO SUPPORT QUALITYOBJECTIVES ESTABLISHED FOR THE STUDY
A suite of EPA 1600-series methods was employed to support the study. Each participatinglaboratory, including the Sample Prep Laboratory, was required to demonstrate their ability topractice these methods before preparing or analyzing samples collected in the study. Chapter 3describes these methods in detail.
April 2005 8 QA Report for the National Lake Fish Tissue Study
SECTION 2.9 THREE LEVELS OF DATA QUALITY ASSESSMENT AND APPLICATION OFSTANDARDIZED DATA QUALIFIERS
All analytical data generated during the study were subjected to three levels of review:
• A pre-qualification review was performed on data submitted by each laboratory todemonstrate that the labs were qualified to prepare and/or analyze tissue samples collectedduring the study.
• Each submission of tissue sample results was carefully scrutinized to verify that the sampleswere analyzed as directed and that supporting QC results demonstrated the quality of resultsgenerated. In evaluating these submissions, data reviewers employed a suite of standardizeddata qualifiers and abbreviated qualifier codes to consistently and accurately document thequality of all data generated so that both the primary data users (statisticians) at EPAHeadquarters and secondary data users within states, tribes, and other organizations couldmake informed decisions regarding their use.
• A third level of data review was performed at the conclusion of each of the four annual datareview processes to determine if overall data quality supported study objectives. These end-of-year evaluations indicated that all MQOs were met for all four years of the study. Chapter 4 describes the data quality assessment procedures employed in the study.
SECTION 2.10 IMPLEMENTATION OF STANDARDIZED DATA FORMAT TO ALLOW ALLRESULTS TO BE REPORTED CONSISTENTLY AND ACCURATELY TO DATAUSERS
All data generated during the study are being compiled in a centralized, custom-developeddatabase designed for the following: eventual upload of results to the national STORETdatabase system, statistical manipulation of results, export of results to user-friendly formatssuch as Excel spreadsheets, and consistency in data format and nomenclature across laboratoriesand over time.
QA Report for the National Lake Fish Tissue Study 9 April 2005
Chapter 3Analytical Methods Employed
To control variability among tissue sample results, all samples collected during the study wereanalyzed by a single set of methods, and all analyses performed with a given method wereperformed by only one laboratory. Further control of variability was ensured by utilizing asingle laboratory to prepare, composite, homogenize, and aliquot samples in a strictly controlled,contaminant-free environment. The methods employed by the Sample Prep Laboratory and byeach Analysis Laboratory are described below. A complete list of the chemicals measured bythese laboratories is provided at the end of this chapter in Exhibit 3-1.
SECTION 3.1 SAMPLE PREP LAB PROCEDURES
Each composite tissue sample prepared by the Sample Prep Lab consisted of five individual fish(where available) of a single species. Bottom-dwelling species were prepared as whole fishcomposites (i.e., the entire specimen, including the head, skin, internal organs, muscle, andbones were thoroughly homogenized). Predator/gamefish were prepared as skin-on (scalesremoved) fillet composites. All tissue sample preparation, filleting, and homogenizationactivities were performed in accordance with EPA’s Guidance for Assessing ChemicalContaminant Data for Use in Fish Advisories, Volume 1: Fish Sampling and Analysis, ThirdEdition, November 2000 (the “Fish Advisory Guidance”) in a strictly controlled, contaminant-free environment. Equipment rinsates were collected during each day of sample preparationactivities and analyzed to document the absence of contamination. Upon receipt of samples fromthe field, the Sample Prep Lab:
• Checked that each shipping container arrived undamaged and verified that samples were stillfrozen and in good condition upon receipt. All samples collected and shipped throughout thefour years were received frozen. Fish composite samples that did not conform to establishedstudy criteria (i.e., “nonroutine” composite samples) were frozen pending a determination byEPA concerning procedures for analysis. EPA documented all processing and analysisdecisions for nonroutine fish composite samples (e.g., accepting composites with fewer orgreater than 5 specimens), and these decisions were entered into the study database.
• Forwarded all associated paperwork to the field support contractor for full verification ofcompleteness and accuracy. All QA problems were successfully resolved and reported backto the SCC for entry of field data into the database.
• Verified that all specimens listed on the paperwork for each composite were included in theshipment and were properly wrapped and labeled. Deviations were rare, and they wereimmediately reported to EPA (via SCC) for resolution and noted in the study database.
• Signed the chain-of-custody form and forwarded it to the Field Support Contractor with acopy to the SCC.
• Documented information about each specimen in a laboratory notebook.
April 2005 10 QA Report for the National Lake Fish Tissue Study
All grinding and homogenization activities were performed in accordance with Section 7.2.2.9 ofthe Fish Advisory Guidance (for fillet composites) and Appendix G of the guidance (for wholefish composites) with the following exceptions:
• The laboratory was required to use equipment known to be free from contamination of alltarget analytes at the concentrations of interest.
• For predator fillets, the Sample Prep Lab used the entire fillet from both sides of each fish(skin-on, scales removed, with belly flap attached) instead of measuring and homogenizingequal weights of each fillet.
• For bottom feeders, each entire fish was homogenized and included in the composite insteadof compositing equal weights of individually homogenized fish.
Once homogenized and composited, the Sample Prep Lab aliquoted samples for distribution toeach of the Analysis Labs. If volume allowed, the Sample Prep Lab also prepared “extravolume” aliquots for shipment to a sample repository for archiving. Aliquots intended fororganics analyses were placed into 125-mL trace-organics clean amber jars with fluoropolymer(FEP)-lined lids. Metals aliquots were stored in 125-mL I-Chem™ Level III trace metals clean(or equivalent) glass jars, also equipped with FEP-lined lids. Each aliquot was further storedinside two food-grade plastic bags to avoid sample loss in the event of breakage. To avoidbreakage, the jars were filled to no more than 80% capacity. All aliquots were frozen (-20°C)pending distribution to the Analysis Labs and the Sample Repository.
The Sample Prep Lab determined the lipid content of each sample. This lipid determination wasperformed using the procedure described in EPA Methods 1613B and 1668A, and is the sameprocedure used in EPA’s National Dioxin Study.
The Sample Prep Lab assigned a unique five-digit EPA sample number to each composite tissuesample and documented the sample number, and corresponding percent lipids result, on a TrafficReport that accompanied each aliquot to the designated Analysis Lab. The Sample Prep Labalso prepared a series of “blind composite duplicates” on 5% of the samples. These blindcomposite duplicates were also assigned five-digit EPA sample numbers and sent to the AnalysisLabs in exactly the same manner as were true field tissue sample aliquots. The blind samplealiquots were used by EPA to verify that Sample Prep Lab procedures were yieldinghomogeneous aliquots and to characterize variability arising from the entire sample preparation,re-distribution, and analysis processes.
SECTION 3.2 DIOXINS/FURANS
The presence and concentration of seventeen 2,3,7,8-substituted chlorinated dibenzo-p-dioxinsand dibenzofurans (CDDs and CDFs) in each sample was determined by a slightly modifiedversion of EPA Method 1613, Revision B (Tetra- through Octa- Chlorinated Dioxins andFurans by Isotope Dilution HRGC/HRMS, EPA-821-B-94-005).
Modifications were made to the procedures specified in Method 1613B in order to allow fordetermination of dioxins and furans at levels ten times lower than those specified in the method.Specifically, the method was modified to increase the tissue sample size used for analysis and to
QA Report for the National Lake Fish Tissue Study 11 April 2005
add a sixth calibration solution that contained all the method-specified analytes at levels lowerthan the levels specified in the method to verify linearity at the lower concentrations targeted.
SECTION 3.3 POLYCHLORINATED BIPHENYLS (PCBS)
EPA Method 1668, Revision A (Chlorinated Biphenyls Congeners in Water, Soil, Sediment, andTissue by HRGC/HRMS, EPA-821-R-00-002) was used to determine PCB congenerconcentrations in tissue samples collected during the study. There are 209 possible congeners,12 of which have toxicological significance (i.e., the “toxic” PCBs identified by the WorldHealth Organization). Method 1668A can unambiguously determine 126 of the 209 congenersas separate chromatographic peaks. The remaining 83 congeners do not appear as separatepeaks, but elute from the gas chromatograph in groups of 2 to 6 congeners that cannot becompletely resolved by the instrumentation. Ten of the 12 “toxic” congeners are resolved, andthe remaining two congeners (PCB 156 and PCB 157) elute as a congener pair. Because PCB156 and 157 have identical toxicity equivalency factors, however, it is possible to accuratelycalculate PCB toxic equivalence based on the 12 toxic congeners.
For reporting purposes, each tissue sample is associated with 126 results that represent the 126single PCB congeners, and another 33 results that represent co-eluting congener groups for theremaining 83 congeners, for a total of 159 PCB congener “results.” In addition, each sample isassociated with 10 values corresponding to the 10 possible levels of chlorination for the parentbiphenyl. Each of these 10 values represents the sum of the concentrations of all of thecongeners in a given level of chlorination (i.e., a total of the monochlorinated PCBs, a total ofthe total dichlorinated PCBs, etc). Finally, each sample is associated with a total PCB value,which represents the sum of the 126 congener results plus the 33 values for the co-elutingcongeners. All told, states and other study partners receive 170 unique PCB records for eachsample (126 + 33 + 10 + 1), and 11 of these records represent totals drawn from the first 159records (126 + 33).
SECTION 3.4 TOTAL MERCURY
Total mercury (Hg) concentrations were determined by EPA Method 1631, Revision B (Mercuryin Water by Oxidation, Purge and Trap, and Cold Vapor Atomic Fluorescence Spectrometry)and its Appendix (Digestion Procedures for the Determination of Total Mercury in Tissue,Sludge, Sediment, and Soil).
SECTION 3.5 ARSENIC SPECIES
Total inorganic arsenic, arsenic (III), monomethylarsonic acid (MMA), and dimethylarsinic acid(DMA) were directly determined by Method 1632, Revision A (Chemical Speciation of Arsenicin Water and Tissue using Hydride Generation Quartz Furnace Atomic AbsorptionSpectrometry). Arsenic (V) was determined by mathematically subtracting the measuredconcentration of arsenic (III) from the measured concentration of total inorganic arsenic. Strictlyspeaking, the techniques provided in Method 1632A allow for determination of the valencestates of arsenic (III) and arsenic (V) rather than the species of inorganic arsenic. The actualspecies of inorganic arsenic are assumed to be those predicted by a geochemical equilibriummodel. Total arsenic (which includes organic forms such as arsenobetaine) was not measured. Although it is commonly found in fish, arsenobetaine was not targeted in the study because of itslow toxicity to fish and humans.
April 2005 12 QA Report for the National Lake Fish Tissue Study
SECTION 3.6 ORGANOCHLORINE PESTICIDES
Organochlorine pesticides and total Aroclors were determined by Method 1656, Revision A(Organo-Halide Pesticides in Wastewater, Soil, Sludge, Sediment, and Tissue by GC/HSD),except that tissue sample extracts were concentrated by a factor of five beyond method-specifiedlevels before instrumental analysis. This modification ensured that all target pesticides could bequantified at levels equal to or lower than the screening values published in EPA’s FishAdvisory Guidance.
SECTION 3.7 ORGANOPHOSPHORUS PESTICIDES
EPA Method 1657, Revision A (Organophosphorus Pesticides in Water, Soil, and Tissue byGC/FPD) was used to determine the presence and concentration of organophosphorus pesticideslisted in Exhibit 3-1.
SECTION 3.8 SEMIVOLATILE ORGANICS
The remainder of the target organic analytes were analyzed by a modified version of EPAMethod 1625, Revision C (Semivolatile Organic Compounds by Isotope Dilution GC/MS). Themodifications involved fractionating the samples by gel permeation chromatography (GPC) toyield a fraction containing the phthalates and some of the lower molecular weight lipids and alipid-free fraction containing the polar target compounds. The phthalate/lipid fraction wasfurther cleaned using Alumina and then recombined with the lipid-free fraction so that all targetanalytes could be determined in a single run. Please note that 3,3'-dichlorobenzidine wasoriginally included as a target analyte in this study. However, the nature of this compound (andbenzidines in general) often results in poor recoveries of this compound and its labeled analog,3,3'-dichlorobenzidine-d6, from tissue samples and Ongoing Precision and Recovery (OPR)samples. Historically, the recovery problems have led to exclusion of large numbers ofanalytical results for 3,3'-dichlorobenzidine. Therefore, rather than exclude a large percentage ofthese results and include other results for this compound with recoveries that are very disparatefrom the other target analytes, EPA decided not to report results for 3,3'-dichlorobenzidine.
During Year 4 of the study only, the laboratory employed a Florisil cleanup instead of anAlumina cleanup in order to mitigate lipid interferences that were resulting in an excessivenumber of reextractions and reanalyses in the Year 3 samples. The use of Florisil did reduce thenumber of reanalyses required, suggesting that this approach should be considered in any furtherstudies.
QA Report for the National Lake Fish Tissue Study 13 April 2005
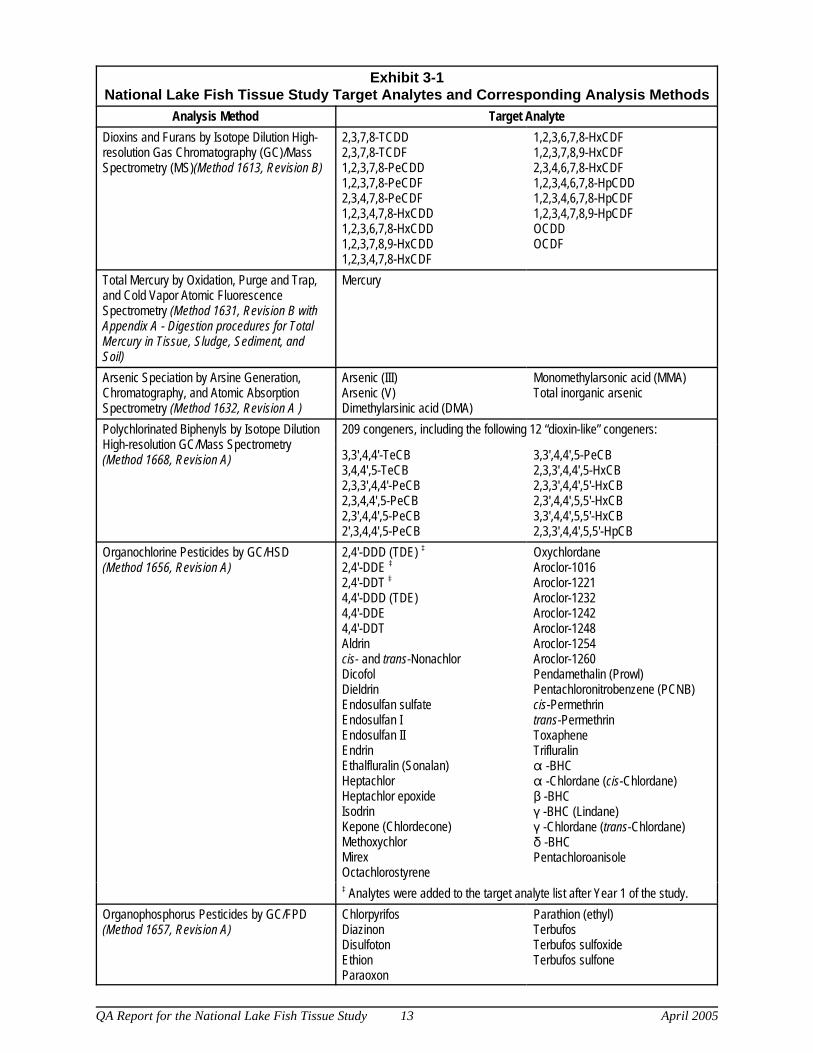
Exhibit 3-1National Lake Fish Tissue Study Target Analytes and Corresponding Analysis Methods
Analysis Method Target AnalyteDioxins and Furans by Isotope Dilution High-resolution Gas Chromatography (GC)/MassSpectrometry (MS)(Method 1613, Revision B)
2,3,7,8-TCDD2,3,7,8-TCDF1,2,3,7,8-PeCDD1,2,3,7,8-PeCDF2,3,4,7,8-PeCDF1,2,3,4,7,8-HxCDD1,2,3,6,7,8-HxCDD1,2,3,7,8,9-HxCDD1,2,3,4,7,8-HxCDF
1,2,3,6,7,8-HxCDF 1,2,3,7,8,9-HxCDF2,3,4,6,7,8-HxCDF1,2,3,4,6,7,8-HpCDD1,2,3,4,6,7,8-HpCDF1,2,3,4,7,8,9-HpCDFOCDDOCDF
Total Mercury by Oxidation, Purge and Trap,and Cold Vapor Atomic FluorescenceSpectrometry (Method 1631, Revision B withAppendix A - Digestion procedures for TotalMercury in Tissue, Sludge, Sediment, andSoil)
Mercury
Arsenic Speciation by Arsine Generation,Chromatography, and Atomic AbsorptionSpectrometry (Method 1632, Revision A )
Arsenic (III)Arsenic (V)Dimethylarsinic acid (DMA)
Monomethylarsonic acid (MMA)Total inorganic arsenic
Polychlorinated Biphenyls by Isotope DilutionHigh-resolution GC/Mass Spectrometry(Method 1668, Revision A)
209 congeners, including the following 12 “dioxin-like” congeners:
3,3',4,4'-TeCB3,4,4',5-TeCB2,3,3',4,4'-PeCB2,3,4,4',5-PeCB2,3',4,4',5-PeCB2',3,4,4',5-PeCB
3,3',4,4',5-PeCB2,3,3',4,4',5-HxCB2,3,3',4,4',5'-HxCB2,3',4,4',5,5'-HxCB3,3',4,4',5,5'-HxCB2,3,3',4,4',5,5'-HpCB
Organochlorine Pesticides by GC/HSD(Method 1656, Revision A)
2,4'-DDD (TDE) ‡
2,4'-DDE ‡2,4'-DDT ‡4,4'-DDD (TDE)4,4'-DDE4,4'-DDTAldrincis- and trans-NonachlorDicofolDieldrinEndosulfan sulfateEndosulfan IEndosulfan IIEndrinEthalfluralin (Sonalan)HeptachlorHeptachlor epoxideIsodrinKepone (Chlordecone)MethoxychlorMirexOctachlorostyrene
OxychlordaneAroclor-1016Aroclor-1221Aroclor-1232Aroclor-1242Aroclor-1248Aroclor-1254Aroclor-1260Pendamethalin (Prowl)Pentachloronitrobenzene (PCNB)cis-Permethrintrans-PermethrinToxapheneTrifluralin" -BHC" -Chlordane (cis-Chlordane)$ -BHC( -BHC (Lindane)( -Chlordane (trans-Chlordane)* -BHCPentachloroanisole
‡ Analytes were added to the target analyte list after Year 1 of the study.Organophosphorus Pesticides by GC/FPD(Method 1657, Revision A)
ChlorpyrifosDiazinonDisulfotonEthionParaoxon
Parathion (ethyl)TerbufosTerbufos sulfoxideTerbufos sulfone
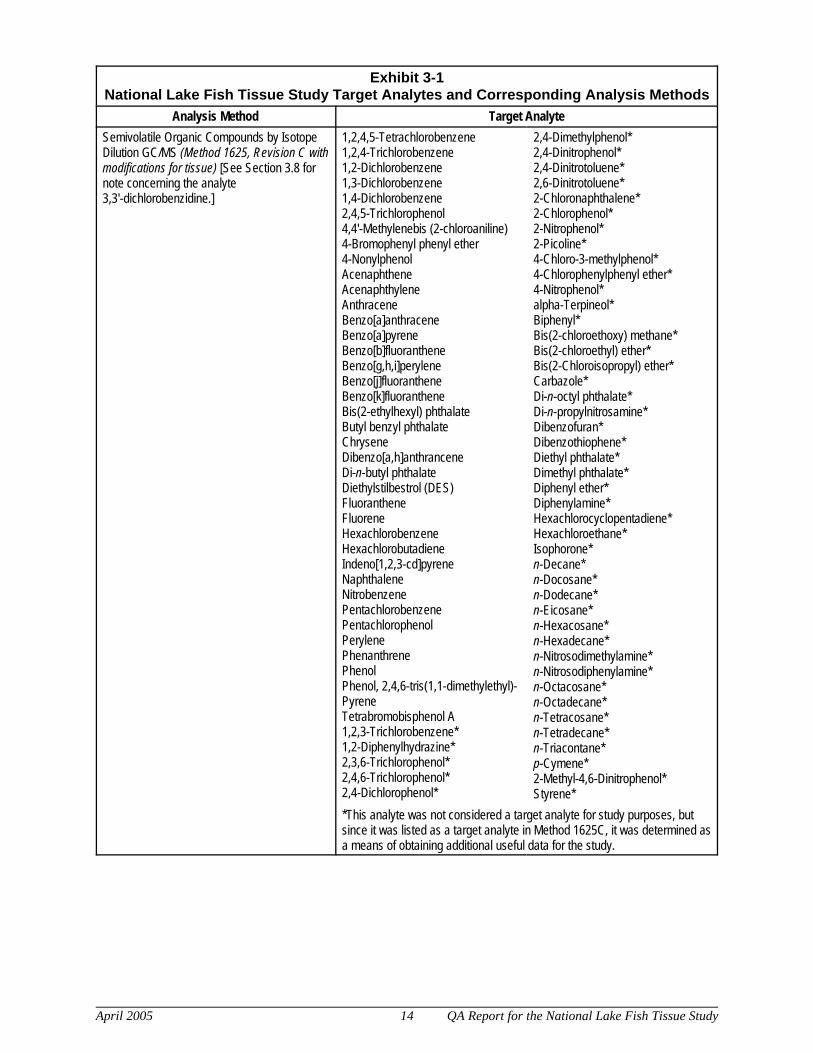
Exhibit 3-1National Lake Fish Tissue Study Target Analytes and Corresponding Analysis Methods
Analysis Method Target Analyte
April 2005 14 QA Report for the National Lake Fish Tissue Study
Semivolatile Organic Compounds by IsotopeDilution GC/MS (Method 1625, Revision C withmodifications for tissue) [See Section 3.8 fornote concerning the analyte3,3'-dichlorobenzidine.]
1,2,4,5-Tetrachlorobenzene1,2,4-Trichlorobenzene1,2-Dichlorobenzene1,3-Dichlorobenzene1,4-Dichlorobenzene2,4,5-Trichlorophenol4,4'-Methylenebis (2-chloroaniline)4-Bromophenyl phenyl ether4-NonylphenolAcenaphtheneAcenaphthyleneAnthracene Benzo[a]anthracene Benzo[a]pyrene Benzo[b]fluoranthene Benzo[g,h,i]perylene Benzo[j]fluoranthene Benzo[k]fluorantheneBis(2-ethylhexyl) phthalateButyl benzyl phthalateChrysene Dibenzo[a,h]anthrancene Di-n-butyl phthalate Diethylstilbestrol (DES)Fluoranthene FluoreneHexachlorobenzeneHexachlorobutadieneIndeno[1,2,3-cd]pyrene NaphthaleneNitrobenzenePentachlorobenzenePentachlorophenol Perylene Phenanthrene PhenolPhenol, 2,4,6-tris(1,1-dimethylethyl)-Pyrene Tetrabromobisphenol A1,2,3-Trichlorobenzene*1,2-Diphenylhydrazine*2,3,6-Trichlorophenol*2,4,6-Trichlorophenol*2,4-Dichlorophenol*
2,4-Dimethylphenol*2,4-Dinitrophenol*2,4-Dinitrotoluene*2,6-Dinitrotoluene*2-Chloronaphthalene*2-Chlorophenol*2-Nitrophenol*2-Picoline*4-Chloro-3-methylphenol*4-Chlorophenylphenyl ether*4-Nitrophenol*alpha-Terpineol*Biphenyl*Bis(2-chloroethoxy) methane*Bis(2-chloroethyl) ether*Bis(2-Chloroisopropyl) ether*Carbazole*Di-n-octyl phthalate*Di-n-propylnitrosamine*Dibenzofuran*Dibenzothiophene*Diethyl phthalate*Dimethyl phthalate*Diphenyl ether*Diphenylamine*Hexachlorocyclopentadiene*Hexachloroethane*Isophorone*n-Decane*n-Docosane*n-Dodecane*n-Eicosane*n-Hexacosane*n-Hexadecane*n-Nitrosodimethylamine*n-Nitrosodiphenylamine*n-Octacosane*n-Octadecane*n-Tetracosane*n-Tetradecane*n-Triacontane*p-Cymene*2-Methyl-4,6-Dinitrophenol*Styrene*
*This analyte was not considered a target analyte for study purposes, butsince it was listed as a target analyte in Method 1625C, it was determined asa means of obtaining additional useful data for the study.
QA Report for the National Lake Fish Tissue Study 15 April 2005
Chapter 4Data Quality Assessment
Three levels of review were applied to all data generated in the National Lake Fish Tissue Study. First, a pre-qualification review was performed prior to analysis of tissue samples to verify thateach laboratory was qualified to analyze the tissue samples in accordance with the prescribedmethods. Second, ongoing reviews were performed to verify that the results of each datasubmission were, in fact, generated in accordance with all method and study requirements. Finally, overall data quality was evaluated at the end of Year 1, Year 2, Year 3, and Year 4 toverify that data as a whole were meeting established MQOs. The procedures employed for eachof these three data review levels are described in Sections 4.1 through 4.3. Section 4.1 describesthe procedures employed for reviewing laboratory prequalification data submitted prior toanalysis of tissue samples during the study. Section 4.2 describes our process for reviewingindividual data packages as they were submitted throughout the study, and describes ourassessment of overall data quality in terms of the items reviewed. Section 4.3 discusses initialMQOs established for the study, and summarizes how well the overall study data set measuredup against those MQOs. Where applicable, quantitative measures (e.g., percent of data that metCriterion X) of data quality are presented; these measures were calculated using results fromstudy target analytes. Specific data qualifiers applied to the target analytes are presented inExhibit 4-1A, and specific data qualifiers applied to non-target analytes measured during thestudy are presented in Exhibit 4-1B.
SECTION 4.1 PRE-QUALIFICATION REVIEW
Prior to preparing or analyzing tissue samples collected during the study, each laboratory wasrequired to submit data demonstrating their ability to achieve the sensitivity, precision, andaccuracy goals established for the study.
Labs did not analyze fish tissue samples until they submitted pre-qualification datademonstrating they could achieve the sensitivity, precision, and accuracy goals definedfor the study.
4.1.1 Sensitivity
4.1.1.1 Sensitivity Goals
Analytical sensitivity reflects the minimum concentration of an analyte above which a data usercan be reasonably confident that the analyte was reliably detected and quantified. For this study,the method detection limit (MDL) and the minimum level (ML) of quantitation were used todefine the sensitivity of each measurement process.
The MDL is defined as the measured concentration at which there is 99% confidence that agiven analyte is present in a given sample matrix. Prior to analyzing tissue samples collected inYear 1 of the study, all laboratories were required to perform MDL studies in accordance withthe procedures specified by EPA at 40 CFR 136, Appendix B.
April 2005 16 QA Report for the National Lake Fish Tissue Study
Quantitative sensitivity in this study was established by the ML. The ML is defined as thelowest concentration at which the entire analytical system gives a recognizable signal andacceptable calibration for an analyte. The ML is equivalent to the lowest calibration standardanalyzed by a specific analytical procedure, assuming that all the method-specified sampleweights, volumes, and processing steps have been employed. The EPA 1600-series methodsdescribed in Chapter 3 specify MLs for tissue and/or aqueous samples. Generally speaking, MLsare approximately three times greater than the MDL and are comparable to the AmericanChemical Society’s Limit of Quantitation.
In accordance with study objectives, each laboratory was required to demonstrate it couldachieve MLs that were equal to or lower than those listed in the analytical method they would beusing in the study. The only exceptions were as follows:
• The laboratory tasked with analyzing tissue samples for dioxins/furans was required toachieve MLs that were ten times lower than those specified in EPA Method 1613B. Thiswas accomplished by increasing the tissue sample size used for analysis (to increasemeasurement sensitivity) and by adding a sixth calibration solution that contained all themethod-specified analytes at levels lower than the levels specified in the method (to verifylinearity at the lower target concentrations).
• The laboratory tasked with analyzing the organochlorine pesticide tissue samples wasinstructed to further concentrate its sample extracts in order to quantify all the targetpesticides at levels that were equal to or lower than the screening values published by EPA inthe Fish Advisory Guidance.
• The laboratory tasked with determining total mercury was permitted to target a ML of 2 ng/ginstead of the 1 ng/g figure cited in the tissue appendix to Method 1631B. The allowed MLof 2 ng/g was considered to be acceptable because it is well below the EPA’s recommendedscreening value for mercury.
4.1.1.2 Sensitivity Assessments
The Sample Prep Lab was responsible for receiving, filleting (where appropriate),homogenizing, aliquoting, and distributing samples to the analysis laboratories. Because theseprocesses could theoretically affect the results generated by all other laboratories, it was criticalto demonstrate that the Sample Prep Lab processes would not introduce contamination of anytarget analytes at the levels of interest in this study. To do so, the Sample Prep Lab was requiredto analyze equipment blanks (rinsates) before preparing any samples collected in the study. Inconjunction with this, the Sample Prep Lab was required to perform MDL studies to demonstratethe lab’s ability to measure blanks at the levels of interest in the study. These Sample Prep LabMDL studies were performed in reagent water. Reagent water was used as a reference matrix forthe equipment rinsates generated to demonstrate the absence of contamination.
The Analysis Labs were required to perform their MDL studies in a reference tissue matrix,using the same analytical methods they would be using in the study (see Exhibit 1-2). Whenpossible, actual fish tissue was used for the MDL studies. However, it was often not possible tolocate fish that were free of the analyte of interest at the low detection limits targeted in thisstudy. In such cases, an alternative matrix, such as chicken breast or corn oil, was used.
QA Report for the National Lake Fish Tissue Study 17 April 2005
Each MDL submission was reviewed to verify that:
• The MDL procedures specified at 40 CFR 136, Appendix B were followed correctly, withrespect to the number of replicates, the spiking levels, and the statistics applied indetermining the MDL;
• The laboratory used the analytical method(s) they would be employing in the study toanalyze actual tissue (or, for the Sample Prep Lab, equipment rinsate) samples whenperforming their MDL studies;
• The laboratory performed their MDL studies on a calibrated instrument;
• The laboratory used an appropriate reference matrix when performing their MDL studies;and
• The MDLs determined by the laboratory supported the ML that would be targeted in thestudy (i.e., the MDLs were at least three times lower than the target MLs).
After evaluating the MDL results and, where necessary, obtaining clarification or missinginformation from the laboratories, the MDL data submitted by each laboratory for metals,dioxins, PCB congeners, and pesticides were deemed to meet method and study requirements.For the semivolatile organic analytes, all of the MDL study results were below the method-derived MLs for tissue samples; however, a few instances occurred in which the measured MDLwas above this objective. These cases included the following target analytes: 1,2-dichlorobenzene, 1,3-dichlorobenzene, 1,4-dichlorobenzene, di-n-butyl phthalate, and bis(2-ethylhexyl) phthalate. This was not considered to be an issue because the instrument wascalibrated at the ML and non-detects were reported at the ML rather than the MDL. To furtherclarify, any result above the calculated MDL that met method-specified criteria would bereported as a “hit”; however, any result detected below the calculated MDL would be reportedas a non-detect at the ML (see Section 4.2.2). Also, the measured MDLs for some of theanalytes, such as the phthalates, were considered to be elevated by analyte contributions from thereference matrix used, and it was evident that other analytes, such as the dichlorobenzenes, couldbe detected at much lower levels (the measured MDLs were elevated by variability among thereplicate measurements).
4.1.1.3 Reporting Thresholds for Sensitivity
As noted above, all of the 1600-series methods used for this study list MLs for aqueous and/ortissue samples. The appendices to Methods 1631B (mercury) and 1632A (arsenic) give tissue-based MDLs and MLs. These method-specified thresholds were used as reporting thresholds inthe study for arsenic, but, as noted above, the laboratory-determined mercury ML of 2 ng/g wasapproved for use in this study. For consistency, the laboratory-determined mercury MDL alsowas used as the reporting threshold for detection limit sensitivity.
Method 1613B (dioxins/furans) provides MLs applicable to solids and tissues but, with theexception of 2,3,7,8-TCDD, does not provide corresponding MDLs. Because the method wasmodified as described in Section 3.2 to quantify dioxins/furans at levels 10 times lower thanspecified in the method, the quantitation limit thresholds reported in the database reflect themethod-specified MLs divided by a factor of 10. Laboratory-determined MDLs were used as the
April 2005 18 QA Report for the National Lake Fish Tissue Study
reporting threshold for detection limit sensitivity. As noted above, these laboratory-determinedMDLs were at least a factor of three lower than the target MLs.
Method 1668A (PCB congeners) provides estimated MDLs and MLs that were derived based onthe standard deviation of single lab blank measurements. Because these levels have not beenfinalized, laboratory generated MDLs and MLs were used as the detection and quantitation limitthresholds, respectively. As noted above, the laboratory’s calibration curve encompassed theirML, and the laboratory-determined MDLs were at least a factor of three lower than the targetMLs.
Methods 1656A (organochlorine pesticides) and 1657A (organophosphorus pesticides) providerecommended MLs for tissue samples and list recommended calibration standards intended tosupport the ML. These method-specified MLs were used as reporting thresholds for Method 1657A. For Method 1656A, the method MLs were divided by a factor of 5 to accountfor the five-fold extract concentration step described in Section 3.6 of this report and in thesensitivity goals discussion above. The laboratory MDLs, determined in fish tissue, were usedas the threshold for reporting detection limit sensitivity. As noted above, these MDLs supportedthe MLs targeted in the study.
Method 1625C (semivolatile organics) does not specify MLs in tissue, nor does the methodprovide MDLs in either tissue or aqueous samples. Therefore, target tissue-based MDLs weremathematically derived from the method-specified aqueous MLs by converting aqueous units tosolid units, accounting for the sample mass used in the tissue measurements, and dividing theresulting tissue MLs by 3. These method-derived MDLs and MLs were used as reporting limitsfor the semivolatile analytes.
4.1.2 Initial Demonstration of Precision and Accuracy
Prior to analyzing tissue samples collected during all four years of the study, each laboratory wasrequired to demonstrate its ability to achieve precise and accurate results with the requiredanalytical method. To do so, laboratories were required to prepare and analyze Initial Precisionand Recovery (IPR) samples as described in each method.
IPR samples consisted of four aliquots of a reference matrix spiked with a known level of thetarget analytes. The reference matrix was chosen to serve as an indicator of method performancethat could be expected for the tissue samples collected in the study. Accuracy was measured bydetermining the average recovery in the replicate IPR samples; precision was measured bycalculating the relative standard deviation (i.e., RSD = standard deviation/mean) of the measuredlevels in the IPR samples.
Each laboratory’s IPR submission was reviewed to verify the following:
• An appropriate reference matrix and spiking levels were used to prepare the four replicatesamples.
• The designated 1600-series method was used to analyze the samples.• The samples were generated on a properly calibrated instrument.• Calculations of analyte recovery and precision were performed correctly.
QA Report for the National Lake Fish Tissue Study 19 April 2005
After evaluating these factors and, where necessary, obtaining clarification or missinginformation from the laboratories, the IPR data submitted by each laboratory was deemed tomeet method and study requirements and the laboratories were considered to be pre-qualified toanalyze samples collected in Year 1 through Year 4 of the study.
SECTION 4.2 INDIVIDUAL DATA PACKAGE REVIEW
Upon completion of tissue sample preparation activities, each sample was assigned to a “sampledelivery group” (SDG) for analysis purposes. Each SDG consisted of an arbitrarily assignedgroup of 20 samples assembled to simplify sample distribution and minimize the number ofQuality Control (QC) samples that had to be prepared by each analytical laboratory. (Mostmethods specify that QC samples be prepared at a frequency of one per 20 tissue samples or oneper analytical batch, whichever is smaller.) Laboratories were also asked to report their data bySDG to standardize the size of each data package and expedite data review processes.
All Year 1, Year 2, Year 3, and Year 4 field results and supporting QC data were carefullyreviewed to determine if the method had been properly followed and if all systems werein control during sample preparation and analysis. QC deviations were assessed todetermine if they had an impact on the data, and these deviations and assessments werecoded directly into the study database with flags and descriptive comments.
When submitting results for each SDG, the laboratories were required to submit all resultsassociated with analysis of the samples in the SDG. This included results of the fish tissuesamples analyzed, as well as results associated with any supporting QC measurements (e.g.,instrument calibration, blank, and spike data). Results were to include both summary level data(the final measurement) and raw data (spectra, chromatograms, bench worksheets, etc.).
Each data package was thoroughly reviewed to ensure the following:
• All samples listed on the corresponding field and Sample Prep Lab documentation wereanalyzed and that results were provided.
• When possible, each analyte was uniquely identified with a Chemical Abstract RegistryService Number (CAS Number) to eliminate any ambiguity in naming conventions.
• All required QC samples were analyzed and these QC samples met specified acceptancecriteria.
• Results were provided for each sample analyzed, including any dilutions and reanalyses, andfor all associated QC samples.
• Required data reporting forms and/or electronic formats were provided for each of the fieldtissue sample and/or associated QC analyses.
• Raw data associated with each field tissue sample and QC sample was provided with eachdata package, and the instrument output (emission intensity, peak height, area, or other signalintensity) was traceable from the raw data to the final result reported.
• Any problems encountered and corrective actions taken were clearly documented.
April 2005 20 QA Report for the National Lake Fish Tissue Study
If anomalies were found, the laboratory was contacted and asked to provide the missing data,clarifications, and/or explanations so that a comprehensive data review could be performed toverify the quality of their results. Results of these data reviews were documented directly in thedatabase through the application of standardized data qualifier flags and descriptive commentsconcerning the reliability of the flagged results. Exhibit 4-1A (Target Analytes) at the end ofthis report summarizes flags and comments applied to the data for target analytes as a result ofthe review process described in subsections 4.2.1 - 4.2.7. Exhibit 4-1B (Additional or Non-Target Analytes) summarizes the flags applied to the 49 “non-target,” semivolatile organicanalytes measured as part of this study.
It is important to note that, because several of the methods used in the National Lake Fish TissueStudy contain a large number of analytes that are being tested simultaneously, there is always asmall statistical probability that QC results for some of these compounds will occasionally fail tomeet method specifications. Likewise, the large number of samples collected and the complexmatrices being analyzed suggest some probability of occasional QC failures. In other words, thepresence of QC failures and data qualifiers in the Year 1, Year 2, Year 3, and Year 4 data setsdoes not automatically suggest poor data quality in this study. To the contrary, EPA believesthat the overall quality of data generated in this study was high, as evidenced by the limitednumber of failures described in Sections 4.2.1 through 4.2.7, and by the fact that the overall dataset met all MQOs established for the study, as described in Section 4.3.
4.2.1 Assessment of Instrument Calibration
All of the methods used in the study required the laboratory to calibrate their instruments using aseries of standards that covered a range of target analyte concentrations. This initial calibrationprovides a quantitative determination of instrument response and generates qualitative criteriafor analyte identification. Methods 1631B (mercury), 1632A (arsenic), 1656A (organochlorinepesticides), and 1657A (organophosphorus pesticides), require a three-point calibration (i.e., theuse of three calibration standards that contain the target analytes at low, medium, and highconcentrations). Methods 1625C (semivolatile organics) and 1668A (PCBs) specify the use offive standards to calibrate the instrument. Method 1613B (dioxins/furans) requires the use offive standards, but as noted above in Section 4.1.1, a sixth calibration standard was used in thisstudy to achieve lower quantitation limits.
The relationship between the response of an analytical instrument to the concentrations oramounts of an analyte introduced into the instrument is referred to as the “calibration curve.” The 1600-series methods used in the study contain specific criteria for determining the linearityof calibration curves. When the applicable criterion is met, the calibration curve is considered tobe sufficiently linear to permit the laboratory to use an average response factor or calibrationfactor, and it is assumed that the calibration curve is a straight line that passes through thezero/zero calibration point. If the calibration curve is not linear, an alternative approach must beused to quantify sample results. This means that a regression line or other mathematical functionmust be employed to relate instrument response to the concentration.
Each data submission was reviewed to verify that the appropriate number of calibrationstandards were used and that the resulting calibration curve either met the linearity specificationsin the method or that the calibration curve was used to quantify samples. All Year 1, Year 2,
QA Report for the National Lake Fish Tissue Study 21 April 2005
Year 3, and Year 4 data were generated on instruments that met the linear calibrationrequirements specified in the referenced method.
Initial calibration data submitted with each data package also were examined to verify that thecalibration curve encompassed the MLs targeted in this study. The use of the ML as a point onthe calibration curve is the principal means by which to assure that measurements made at thequantitation level are reliable. All Year 1, Year 2, Year 3, and Year 4 data were generated oninstruments that were properly calibrated at or below the MLs in this study. In addition, all buttwo of the results reported in the study were analyzed within the instrument calibration range. These semivolatile organic results were coded with “REXC” to indicate that the result exceededthe calibration range and were further qualified as an “Estimated Value.”
Because analytical instruments are subject to drift over time, analytical methods typically requireperiodic analysis of standards to verify the instrument remains calibrated throughout the durationof analysis. The 1600-series methods used in the National Lake Fish Tissue Study specify thatthe calibration verification be performed by analyzing a mid-point standard. The concentrationof each analyte in this standard is determined using the initial calibration data and compared tothe specifications in the method. If the results are within the method specifications, thelaboratory is allowed to proceed with analysis without recalibrating and to continue using theinitial calibration data to quantify sample results. If calibration verification results fall outsidethe required limits, the laboratory is required to recalibrate their instrument before proceedingwith sample analysis. The frequency of this calibration verification varies according to theinstrumentation (more frequent verification is required for instruments that are highly prone todrift) and is specified in the method. Verifying calibration at the method-specified frequencyallows for early identification of problems and minimizes the need to reanalyze samples thatmight otherwise have been analyzed on an uncalibrated instrument.
Each Year 1, Year 2, Year 3, and Year 4 data package received was reviewed to verify that:
• Calibration verification was performed at the required frequency using appropriatecalibration standards, and
• Results of the calibration verification met method-specified acceptance criteria, or• If results did not meet method specified criteria, the laboratory re-calibrated the instrument
before proceeding with sample analysis.
If the calibration verification requirements were not met, the reviewer evaluated the data packageto verify that the laboratory followed the corrective action dictated by the method and that resultswere not affected. Although 284,973 field tissue sample results were generated during the first,second, third, and fourth years of the study, only 107 (6 samples in Year 1; 63 samples in Year 2;0 samples in Year 3; and 38 samples in Year 4) of these results were flagged with calibrationverification (CalVer) qualifiers. In Year 1 of the study, the six results flagged were fororganochlorine pesticides, an outcome that is not surprising given the large number of pesticidestargeted by the method and the fact that each pesticide is determined on two separate columns. When the analyte was found using both columns, the lowest of the measured results was reportedsince that value could be supported by both measurements. Reported results that failed to meetthe recovery specifications for Method 1656A were qualified with either “LVER” to indicate alow recovery of the calibration standard or “HVER” to indicate a higher recovery of thestandard. Failure to recover the analyte from the CalVer sample at all resulted in the applicationof a “NVER” flag. In Year 2 of the study, 63 of the arsenic speciation results (Method 1632A)
1MDLs reported in the study database reflect the study MDLs approved for the study, as discussed inSection 4.1.1. Because MDLs are determined in a single laboratory, measured MDL results are subject to slightchanges over time and between laboratories. For analytes, such as hexachlorobenzene and terbufos, where therecommended screening value was below the “study MDL,” but above a lab-determined MDL, any results reportedbetween the study MDL and the lab-determined MDLs were reported in the database with a “LJS” (e.g., “J flaggedresult was between the lab and study MDLs”).
April 2005 22 QA Report for the National Lake Fish Tissue Study
were qualified with “LVER” indicating a low recovery of the calibration standard. In Year 4 ofthe study, all of the 38 “LVER” and “NVER” codes were also associated with other dataqualifiers.
99.96% of the 284,973 field tissue sample results generated in the four years of thestudy met all instrument calibration requirements.
4.2.2 Reporting Thresholds
Each laboratory was instructed to report all positive results that met all method-specified criteria(i.e., “hits”) down to the MDL. The labs were further instructed to apply a “J” flag to any resultsreported above the MDL but below the ML.1 The purpose of the “J” flag was to indicate that,although the analyte was detected, it was detected at a value below the quantitation limit. Inother words, the presence of a “J” flag suggests the reported value is qualitative (the analyte isdefinitely present) but not quantitative (the reported value is an estimate of the trueconcentration).
Note: The PCB lab was instructed to include these “J” flagged results when reporting congenertotals for the PCBs. Because nearly all samples had at least a few “J” flagged PCBcongeners, nearly all the samples (964 samples out of a total of 1,003 samples analyzedfor PCBs) also have a “J” flag on total PCB congener values.
The MDL is designed to provide a 99% level of confidence that when an analyte is reported asbeing present, it really is present. The converse is not true, however. If an analyte is reported asnot being present at the MDL level, a 50% possibility exists that the result is a false negative. Toensure that results reported as non-detects are reliable indicators of the true concentration atwhich the analyte could not be detected, the reporting threshold for non-detects was set at theML. (For further clarification, see final paragraph of Section 4.1.1.2)
Positive results were reported to the MDL and flagged with a “J” if the results werebelow the ML. J-flagged results were further annotated as “Estimated Values” to cautionusers that the results are qualitative rather than quantitative.
All field tissue sample results submitted during Year 1, Year 2, Year 3, and Year 4 of theNational Lake Fish Tissue Study were carefully reviewed to verify that the laboratory adhered tothese reporting conventions.
QA Report for the National Lake Fish Tissue Study 23 April 2005
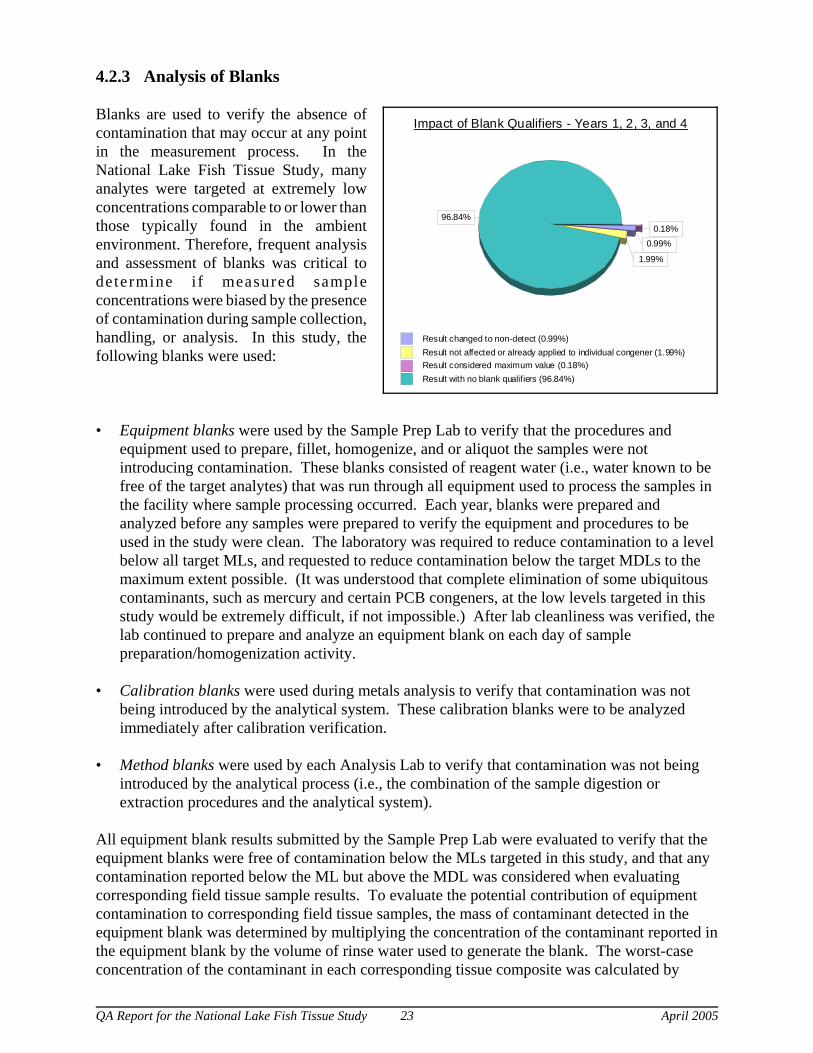
96.84%
1.99%
0.99%
0.18%
Result changed to non-detect (0.99%)Result not affected or already applied to individual congener (1.99%)Result considered maximum value (0.18%)Result with no blank qualifiers (96.84%)
Impact of Blank Qualifiers - Years 1, 2, 3, and 4
4.2.3 Analysis of Blanks
Blanks are used to verify the absence ofcontamination that may occur at any pointin the measurement process. In theNational Lake Fish Tissue Study, manyanalytes were targeted at extremely lowconcentrations comparable to or lower thanthose typically found in the ambientenvironment. Therefore, frequent analysisand assessment of blanks was critical todetermine i f measured sampleconcentrations were biased by the presenceof contamination during sample collection,handling, or analysis. In this study, thefollowing blanks were used:
• Equipment blanks were used by the Sample Prep Lab to verify that the procedures andequipment used to prepare, fillet, homogenize, and or aliquot the samples were notintroducing contamination. These blanks consisted of reagent water (i.e., water known to befree of the target analytes) that was run through all equipment used to process the samples inthe facility where sample processing occurred. Each year, blanks were prepared andanalyzed before any samples were prepared to verify the equipment and procedures to beused in the study were clean. The laboratory was required to reduce contamination to a levelbelow all target MLs, and requested to reduce contamination below the target MDLs to themaximum extent possible. (It was understood that complete elimination of some ubiquitouscontaminants, such as mercury and certain PCB congeners, at the low levels targeted in thisstudy would be extremely difficult, if not impossible.) After lab cleanliness was verified, thelab continued to prepare and analyze an equipment blank on each day of samplepreparation/homogenization activity.
• Calibration blanks were used during metals analysis to verify that contamination was notbeing introduced by the analytical system. These calibration blanks were to be analyzedimmediately after calibration verification.
• Method blanks were used by each Analysis Lab to verify that contamination was not beingintroduced by the analytical process (i.e., the combination of the sample digestion orextraction procedures and the analytical system).
All equipment blank results submitted by the Sample Prep Lab were evaluated to verify that theequipment blanks were free of contamination below the MLs targeted in this study, and that anycontamination reported below the ML but above the MDL was considered when evaluatingcorresponding field tissue sample results. To evaluate the potential contribution of equipmentcontamination to corresponding field tissue samples, the mass of contaminant detected in theequipment blank was determined by multiplying the concentration of the contaminant reported inthe equipment blank by the volume of rinse water used to generate the blank. The worst-caseconcentration of the contaminant in each corresponding tissue composite was calculated by
April 2005 24 QA Report for the National Lake Fish Tissue Study
dividing the mass of the contaminant in the equipment blank by the total tissue mass of eachcomposite. This calculation assumes that any equipment-related contamination in the compositesample would be equally distributed through the sample by the compositing process. The effectsof equipment blank contamination were then assessed as follows:
• If the analyte was detected in the equipment blank but was not detected in the associatedfield tissue samples, the sample data were considered to be acceptable.
• If the analyte was detected in the associated field tissue samples at levels far greater (i.e., atleast ten times more) than the levels detected in the equipment blank, the effect of the blankwas considered to be negligible and the field tissue sample data were considered to beacceptable. Such data were qualified with “B” and “RNAF” to indicate that equipment blankcontamination was present but the sample result was not affected by it.
• If the analyte was detected in the field tissue samples at levels close to (i.e., within 5 times)the level detected in the equipment blank, there are no means by which to ascertain if thetissue result reported was due to contamination. In such cases, the result reported by the labwas changed to a non-detect at the ML and coded with “B” and “RNON” qualifiers toindicate the change.
• If the analyte detected in the field tissue sample was more than 5 times but less than 10 timesthe concentration detected in the equipment blank, the field tissue sample result was codedwith “B” and “RMAX” qualifiers to indicate a possible high bias from contamination.
Blanks submitted by each Analysis Lab were reviewed and flagged according to the sameapproach. In applying these rules, data reviewers were careful to consider the impact of dilutionon the field tissue sample results (i.e., the concentration of a diluted sample was compared to theblank result multiplied by the dilution factor that was applied to the sample). For example, if 12 ppb of contaminant was found in the blank, and the associated sample extract was diluted bya factor of 6 relative to the extract from the blank, then the sample result would have to begreater than 12 x 6 x 10, or 720 ppb to be considered acceptable. (The result times the dilutionfactor times the 10 times rule described above.) If the sample result was reported to be between 360 ppb and 720 ppb, it would be flagged with “B” and “RMAX” qualifiers to indicate apossible high bias resulting from contamination as dictated by the between 5 times and 10 timesrule described above.
In all, 9,094 of the 284,973 field tissue sample results generated during Year 1 through Year 4 ofthe study were qualified due to blank contamination, and more than 6,000 of these qualifierswere applied to PCB congeners (other than the 12 dioxin-like congeners), which are ubiquitousin the environment and very difficult to eliminate at the low levels targeted in this study. Inaddition, most of the qualifiers were used to indicate that the results were determined to be notaffected by the blank contamination (i.e., flagged with “B, RNAF”) or were duplicatively appliedas a result of PCB congener summation (i.e., if an individual congener received a blank qualifierflag, the qualifier also was applied to the corresponding congener total). It is important to notethat no blank subtraction was performed to eliminate the effects of blank contamination detected
2 Mercury results were corrected for bubbler blank contamination as per sample calculation proceduresdescribed in Method 1631B. As with results from other analyses, however, none of the mercury results werecorrected for contamination observed in the equipment, calibration, or method blanks.
QA Report for the National Lake Fish Tissue Study 25 April 2005
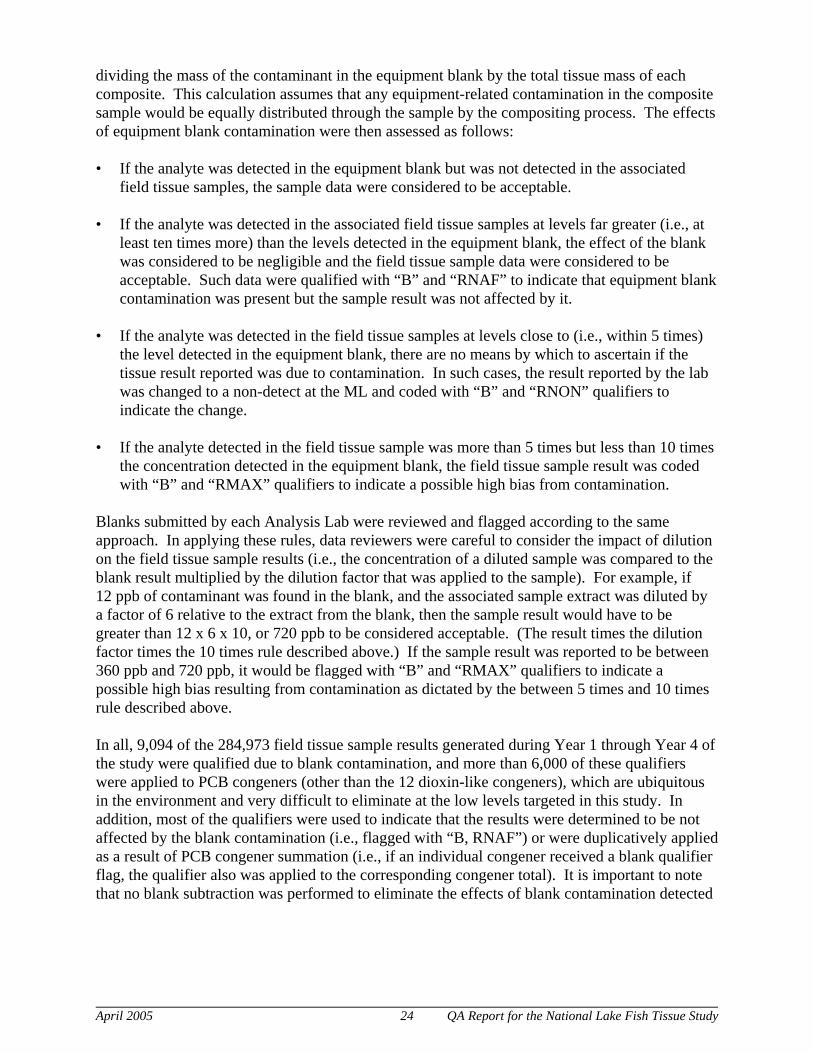
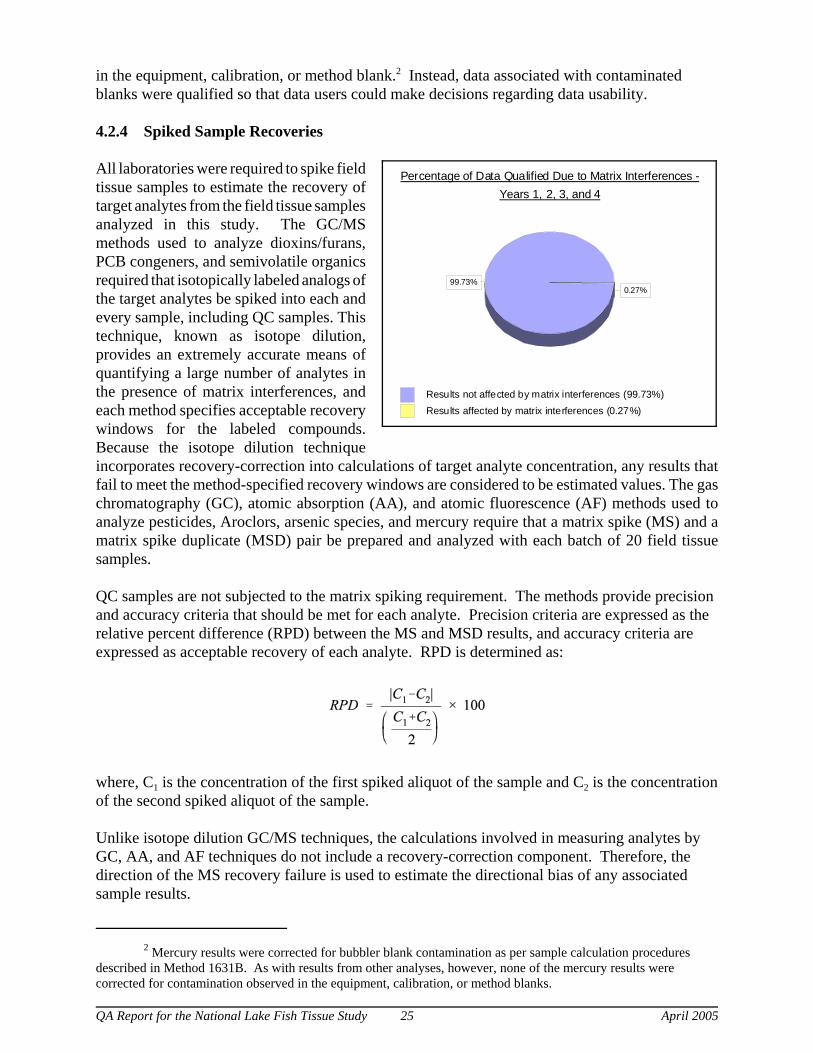
99.73%0.27%
Results not affected by matrix interferences (99.73%)Results affected by matrix interferences (0.27%)
Years 1, 2, 3, and 4Percentage of Data Qualified Due to Matrix Interferences -
in the equipment, calibration, or method blank.2 Instead, data associated with contaminatedblanks were qualified so that data users could make decisions regarding data usability.
4.2.4 Spiked Sample Recoveries
All laboratories were required to spike fieldtissue samples to estimate the recovery oftarget analytes from the field tissue samplesanalyzed in this study. The GC/MSmethods used to analyze dioxins/furans,PCB congeners, and semivolatile organicsrequired that isotopically labeled analogs ofthe target analytes be spiked into each andevery sample, including QC samples. Thistechnique, known as isotope dilution,provides an extremely accurate means ofquantifying a large number of analytes inthe presence of matrix interferences, andeach method specifies acceptable recoverywindows for the labeled compounds.Because the isotope dilution techniqueincorporates recovery-correction into calculations of target analyte concentration, any results thatfail to meet the method-specified recovery windows are considered to be estimated values. The gaschromatography (GC), atomic absorption (AA), and atomic fluorescence (AF) methods used toanalyze pesticides, Aroclors, arsenic species, and mercury require that a matrix spike (MS) and amatrix spike duplicate (MSD) pair be prepared and analyzed with each batch of 20 field tissuesamples.
QC samples are not subjected to the matrix spiking requirement. The methods provide precisionand accuracy criteria that should be met for each analyte. Precision criteria are expressed as therelative percent difference (RPD) between the MS and MSD results, and accuracy criteria areexpressed as acceptable recovery of each analyte. RPD is determined as:
where, C1 is the concentration of the first spiked aliquot of the sample and C2 is the concentrationof the second spiked aliquot of the sample.
Unlike isotope dilution GC/MS techniques, the calculations involved in measuring analytes byGC, AA, and AF techniques do not include a recovery-correction component. Therefore, thedirection of the MS recovery failure is used to estimate the directional bias of any associatedsample results.
April 2005 26 QA Report for the National Lake Fish Tissue Study
All labeled compound and MS/MSD results reported in Year 1, Year 2, Year 3, and Year 4 of theNational Lake Fish Tissue Study were carefully reviewed to evaluate the quality of data. Inreviewing these results, reviewers verified that appropriate spiking compounds and spikinglevels were used, that samples were spiked at the correct frequency, and that spiked sampleresults met method-specified criteria. In evaluating spiked sample results, data reviewers appliedthe following rules:
• If the isotopically labeled analog of a target compound was recovered in a sample abovemethod-specified criteria, the associated native compound was coded with “HLBL” toindicate the presence of a high labeled compound recovery. The result also was qualifiedwith an “Estimated Value” descriptor to indicate that, although there was no question as tothe identify of the analyte, there is some doubt as to the reliability of the measuredconcentration. In Year 1 through Year 4, only two results received this qualifier.
• If the isotopically labeled analog of a target compound was recovered below the method-specified criteria, the associated native compound in that sample was coded with “LLBL” toindicate the presence of a low labeled compound recovery. The result also was qualifiedwith an “Estimated Value” descriptor. In Year 1 through Year 4, eighteen (18) resultsreceived this qualifier.
• In rare cases, a labeled analog is not recovered from the sample at all. Due to the extremenature of this QC failure, any associated native (i.e., target) compound result is consideredunreliable and should, therefore, be excluded from the database. In Year 1 through Year 4,this situation occurred only for semivolatile organic and PCB congener analytes in 39samples (a total of 49 results). The 49 affected Year 1, Year 2, Year 3, and Year 4 resultswere excluded from the database, and the associated sample records were coded as “NLBL”and further qualified with “Exclude” to explain the absence of these results.
• If an analyte was recovered from an MS or MSD sample above method-specified criteria, allassociated samples with positive results were coded with “HMSR” to indicate the high MSrecovery. The associated samples also were qualified to indicate a “Potential High Bias”unless other flags (such as a “J”) applied to the same result suggested that the sample shouldbe qualified as an “Estimated Value.” In Year 1, Year 2, Year 3, and Year 4, only 25 resultswere qualified with the “HMSR” flag (the analytes affected were arsenic (III); *-BHC; cis-nonachlor; 4,4'-DDT; and dicofol). Ten of these results were qualified as having“Potential High Bias;” the remaining 15 results were reported below the quantitation limit orassociated with “RPDX” and/or “RNF2" flags and were qualified as “Estimated Values.” Non-detects in samples associated with the high MS/MSD recovery were not flaggedbecause it was clear that the potential high bias indicated by the MS or MSD had no adverseimpact on the sample result.
• If an analyte was recovered from an MS or MSD sample below method-specified criteria, allassociated samples were coded with “LMSR” to indicate the low MS recovery. Theassociated samples also were qualified to indicate a “Potential Low Bias.” All of the“LMSR” codes applied during Year 1, Year 2, Year 3, and Year 4 of the study were appliedto those analytes determined by Methods 1632A and 1656A, with the majority applied toMMA (during Year 1 of the study). The number of MMA qualifiers in Year 1 of the studysuggested that method improvements were needed to yield optimal results when determining
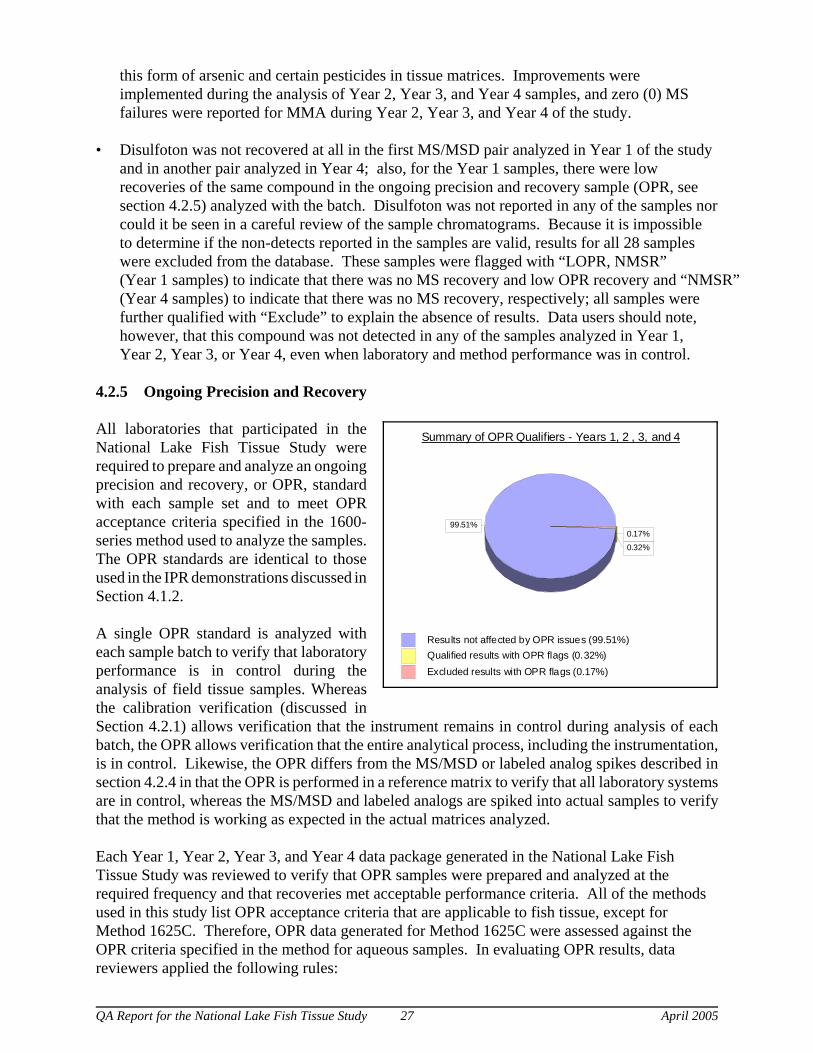
QA Report for the National Lake Fish Tissue Study 27 April 2005
99.51%
0.32%
0.17%
Results not affected by OPR issues (99.51%)Qualified results with OPR flags (0.32%)Excluded results with OPR flags (0.17%)
Summary of OPR Qualifiers - Years 1, 2 , 3, and 4
this form of arsenic and certain pesticides in tissue matrices. Improvements wereimplemented during the analysis of Year 2, Year 3, and Year 4 samples, and zero (0) MSfailures were reported for MMA during Year 2, Year 3, and Year 4 of the study.
• Disulfoton was not recovered at all in the first MS/MSD pair analyzed in Year 1 of the studyand in another pair analyzed in Year 4; also, for the Year 1 samples, there were lowrecoveries of the same compound in the ongoing precision and recovery sample (OPR, seesection 4.2.5) analyzed with the batch. Disulfoton was not reported in any of the samples norcould it be seen in a careful review of the sample chromatograms. Because it is impossibleto determine if the non-detects reported in the samples are valid, results for all 28 sampleswere excluded from the database. These samples were flagged with “LOPR, NMSR”(Year 1 samples) to indicate that there was no MS recovery and low OPR recovery and “NMSR”(Year 4 samples) to indicate that there was no MS recovery, respectively; all samples werefurther qualified with “Exclude” to explain the absence of results. Data users should note,however, that this compound was not detected in any of the samples analyzed in Year 1, Year 2, Year 3, or Year 4, even when laboratory and method performance was in control.
4.2.5 Ongoing Precision and Recovery
All laboratories that participated in theNational Lake Fish Tissue Study wererequired to prepare and analyze an ongoingprecision and recovery, or OPR, standardwith each sample set and to meet OPRacceptance criteria specified in the 1600-series method used to analyze the samples.The OPR standards are identical to thoseused in the IPR demonstrations discussed inSection 4.1.2.
A single OPR standard is analyzed witheach sample batch to verify that laboratoryperformance is in control during theanalysis of field tissue samples. Whereasthe calibration verification (discussed inSection 4.2.1) allows verification that the instrument remains in control during analysis of eachbatch, the OPR allows verification that the entire analytical process, including the instrumentation,is in control. Likewise, the OPR differs from the MS/MSD or labeled analog spikes described insection 4.2.4 in that the OPR is performed in a reference matrix to verify that all laboratory systemsare in control, whereas the MS/MSD and labeled analogs are spiked into actual samples to verifythat the method is working as expected in the actual matrices analyzed.
Each Year 1, Year 2, Year 3, and Year 4 data package generated in the National Lake FishTissue Study was reviewed to verify that OPR samples were prepared and analyzed at therequired frequency and that recoveries met acceptable performance criteria. All of the methodsused in this study list OPR acceptance criteria that are applicable to fish tissue, except forMethod 1625C. Therefore, OPR data generated for Method 1625C were assessed against theOPR criteria specified in the method for aqueous samples. In evaluating OPR results, datareviewers applied the following rules:
April 2005 28 QA Report for the National Lake Fish Tissue Study
• If the OPR results were only marginally outside the method criteria (i.e., results were within10% of the method-specified windows), the data were considered to be acceptable withoutqualification. This is because all OPR windows established for the 1600-series methods usedin this study reflect a 95% confidence interval.
• If the OPR recovery was below method-specified criteria, all tissue data associated with thatOPR were qualified with either “LOPR” to indicate that a low OPR recovery of the targetanalyte, “LLRO” to indicate a low labeled analog recovery from the OPR, or “LNRO” toindicate a low native compound recovery from the OPR. Results with low target analyterecoveries (i.e., “LOPR” results) were further qualified to indicate a “Potential Low Bias.” In Year 1, Year 2, Year 3, and Year 4, “LOPR” results were observed for 1.61% of thepesticides measurements, several of which were associated with other data qualifiers (e.g.,data also were reported below the ML). One semivolatile organic result was flagged with“LLRO” due to low labeled compound recovery in the OPR. This sample was also flaggedwith other data qualifiers (“B”, “LLBL”, and “RNAF”), as well. Results with low nativecompound recoveries in the OPR (i.e., “LNRO” results) were further qualified to indicate a“Potential Low Bias.” In Year 1, Year 2, Year 3, and Year 4, “LNRO” results were observedfor 0.12% of the semivolatile organics measurements.
• In rare cases, the native compound was not recovered from the OPR sample or there was noOPR spike recovery. For these cases, the associated results were excluded from thedatabase. The associated sample records were coded as either “NNRO” or “NOPR,”respectively, and further qualified with “Exclude” to explain the absence of any results. Thissituation occurred for 1.14% of the semivolatile organic measurements made by Method1625C (the vast majority of which were associated with the analyte tetrabromobisphenol A)and 0.03% of the pesticide measurements made by Method 1656A and 1657A.
4.2.6 Holding Time Assessments
Each data submission was reviewed to verify that all samples were received and maintained infrozen condition until analysis. When samples were thawed, the time between thawing andsample digestion, extraction, or analysis was assessed to verify that the holding times specifiedin each method were met. Samples that failed to meet the required holding times were codedwith “HTEX” to indicate the holding time exceedance. If no other QC failures occurred, the datawere coded to indicate a “Potential Low Bias.” One semivolatile organics result (in Year 1) wasanalyzed outside the holding time and was reported below the ML. This result was coded withboth “HTEX” and “J,” and was further qualified as “Estimated Value.” Thirteen other resultsalso were coded with an “HTEX” flag, but these results were excluded for other reasonspreviously cited in this report. Finally, one semivolatile organics result (in Year 4) was analyzedoutside the holding time and was associated with a low native recovery in the OPR. This resultwas coded with both “HTEX” and “LNRO,” and was further qualified as “Potential Low Bias.”
99.99% of the 284,973 sample results reported during Year 1 through Year 4 weredetermined within analytical holding times.
QA Report for the National Lake Fish Tissue Study 29 April 2005
4.2.7 Method-Specific Considerations
Pesticides
Methods 1656A and 1657A rely on the use of GC techniques coupled with selective detectors todetermine organochlorine and organophosphorus pesticides, respectively. The advantage ofthese techniques is that they allow for measurement of pesticides at lower concentrations than ispossible with GC/MS. The disadvantage is that compound identification with the selectivedetectors is not as reliable as compound identification via GC/MS. To overcome thisdisadvantage, the methods require that any analytes detected be verified by analysis on a secondcolumn and that the results from the second column closely agree with the primary columnresults (the results measured on the two columns must agree within a factor of two).
When such verification occurs, the laboratory reports the lower of the two results. In reviewingthe data package for each pesticide analysis, reviewers evaluated the data to verify that allpositive results were detected on two columns and that the results agreed within a factor of two. When the analyte was detected on both columns, but the results did not closely agree, the lowerresult was reported in the database and coded with “RNF2" to indicate that the results did notagree within a factor of two and further qualified as an “Estimated Value.” When the analytewas detected on one column but could not be confirmed on a second column, the result wascoded “NCNF” to indicate the lack of confirmation and further qualified as an “EstimatedValue.” This approach was taken to advise data users about the possibility that an analyte mightbe present so that informed decisions can be made about the value of gathering additional data.
For all pesticides, except kepone, unconfirmed results were reported as non-detects unlessconfirmation on the second column was not possible due to co-elution. Because kepone cannotbe independently resolved on the second column, unconfirmed kepone results were reported asdetects, but qualified as described above. Several possible kepone hits are reported and flaggedas “NCNF” in the database. One Year 1 result for trans-nonachlor and one 2,4'-DDE result fromYear 2 could not be confirmed because the compound co-eluted with another analyte on thesecond column. The co-eluted results also differed from the first column result by more than afactor of two. These results were flagged with “NCNF, RNF2" and further coded as an“Estimated Value.”
In addition, for Year 2, Year 3, and Year 4 of the study, several dicofol results were coded with“NCNF.” The Year 2 results were also associated with high and low MS recoveries (“HMSR”and “LMSR”, respectively), and one of the sample results was further coded with a “J” flag. These two results were given the overall qualifier of “Estimated Value.” Finally, several 2,4'-DDE, alpha-chlordane, cis-nonachlor, ethalfluralin, gamma-chlordane, trans-nonachlor, andtrifluralin results in the Year 2, Year 3, and Year 4 data sets were coded with “NCNF” (andpossibly other flags), which produced an overall qualification of “Estimated Value.”
Note: EPA reminds all data users that the identification of any pesticide qualified with “NCNF”or “RNF2" was not confirmed. Appropriate caution should be exercised when using suchresults.
Also, in Year 1 of the study, seven pesticide results were coded “MTRX” to indicate that thesample chromatograms suggested the presence of possible matrix interferences. In three of thesecases, the pesticide was detected on both columns, but the results did not agree within a factor oftwo, so the data were further coded with an “RNF2" flag. One of these three results also was
3Quality Assurance Project Plan for Analytical Control and Assessment Activities, September 2000,Prepared for the U.S. EPA OW by CSC Environmental Programs Group (formerly DynCorp Environmental).
April 2005 30 QA Report for the National Lake Fish Tissue Study
reported below the ML on one of the columns, so this result was further coded with a “J” flag. All six of these MTRX flagged results were qualified to indicate that they should be considered“Estimated Values.” In Year 4 of the study, one pesticide result for dicofol was qualified withthe “MTRX” code and should be considered an “Estimated Value.” In Year 3 of the study, 25PCB congener results were flagged with the “MTRX” code. These results were further codedwith “LLBL” or “NLBL” flags (See Section 4.2.4 - Spiked Sample Recoveries), and werequalified as an “Estimated Value” or “Exclude” from the database, respectively. There were no“MTRX” codes used for the results obtained from Year 2 of the study.
Semivolatile Organics
During Year 4 of the study, the laboratory initially reported “hits” for 4-nonylphenol in severalof the samples. Since only one sample had a detected result for 4-nonylphenol during the firstthree years of the study, the semivolatile organics laboratory investigated the situation andidentified several possible explanations, including 1) the possibility of contamination, 2) the factthat the interpretation was performed by a different lab staff member than in previous years, and3) the less likely possibility that the hits were actually present in the samples.
Based on re-evaluation of Year 4 data and comparison to results from previous years, it wasconcluded that, for all but 7 samples, the compound detected did not meet appropriateidentification criteria and should not be reported as 4-nonylphenol. It is not possible to tell withcertainty whether or not 4-nonylphenol was actually present in any of the samples. Thelaboratory reported that the remaining “hits” for 4-nonylphenol were probably due tointerference and/or contamination. The laboratory performed an independent study in an attemptto isolate the source of the contamination, evaluating the following:
• the procedures used to clean and prepare the Soxhlets for extraction• the soap used to clean the extraction glassware• the Florisil/alumina clean-up columns used during the extraction process
The results of all of their tests proved to be inconclusive. The sample results in which 4-nonylphenol was detected were reported as “hits” based on best professional judgement. However, these samples with concentrations of 4-nonylphenol detected above the MDL werequalified with a “SLIC” code to signify the result was probably due to interference and/orcontamination.
SECTION 4.3 OVERALL DATA QUALITY ASSESSMENT
Upon completion of all data review and database development activities for Year 1, Year 2, Year 3, and Year 4, the full data set was evaluated to determine if the results overall were fallingwithin the MQOs established in the study QAPP 3. Assessment of the data against these MQOsis described in Sections 4.3.1 through 4.3.5 below.
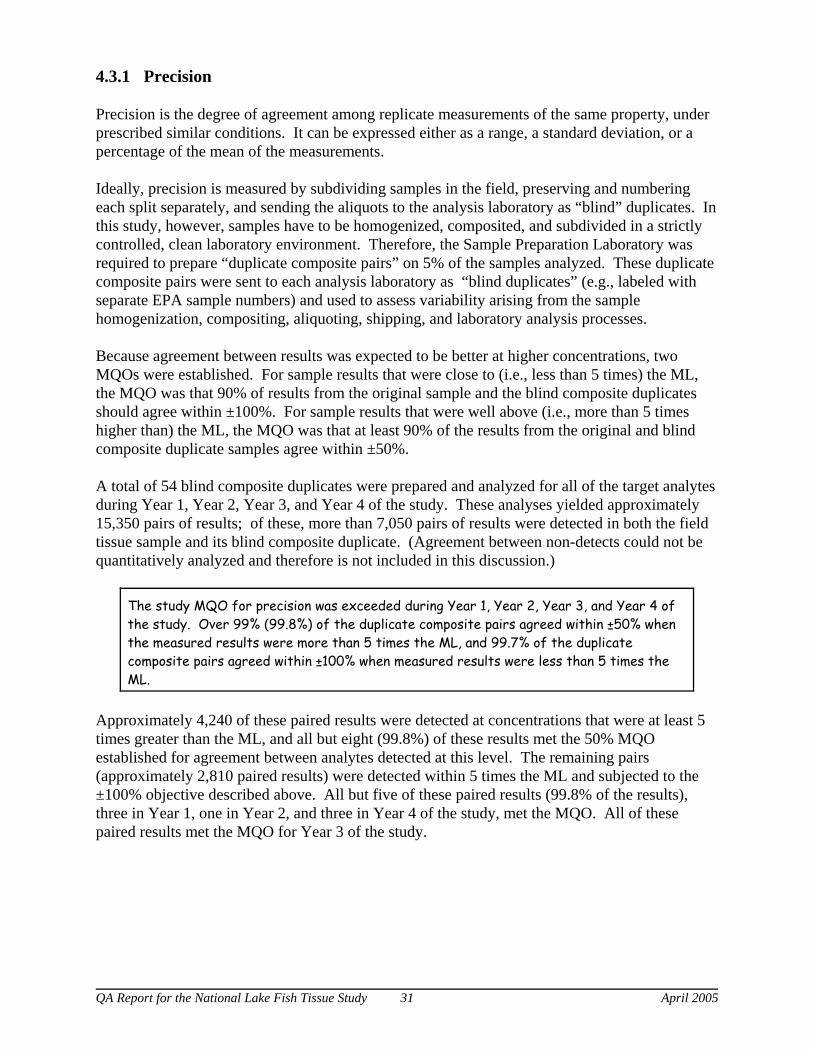
QA Report for the National Lake Fish Tissue Study 31 April 2005
4.3.1 Precision
Precision is the degree of agreement among replicate measurements of the same property, underprescribed similar conditions. It can be expressed either as a range, a standard deviation, or apercentage of the mean of the measurements.
Ideally, precision is measured by subdividing samples in the field, preserving and numberingeach split separately, and sending the aliquots to the analysis laboratory as “blind” duplicates. Inthis study, however, samples have to be homogenized, composited, and subdivided in a strictlycontrolled, clean laboratory environment. Therefore, the Sample Preparation Laboratory wasrequired to prepare “duplicate composite pairs” on 5% of the samples analyzed. These duplicatecomposite pairs were sent to each analysis laboratory as “blind duplicates” (e.g., labeled withseparate EPA sample numbers) and used to assess variability arising from the samplehomogenization, compositing, aliquoting, shipping, and laboratory analysis processes.
Because agreement between results was expected to be better at higher concentrations, twoMQOs were established. For sample results that were close to (i.e., less than 5 times) the ML,the MQO was that 90% of results from the original sample and the blind composite duplicatesshould agree within ±100%. For sample results that were well above (i.e., more than 5 timeshigher than) the ML, the MQO was that at least 90% of the results from the original and blindcomposite duplicate samples agree within ±50%.
A total of 54 blind composite duplicates were prepared and analyzed for all of the target analytesduring Year 1, Year 2, Year 3, and Year 4 of the study. These analyses yielded approximately15,350 pairs of results; of these, more than 7,050 pairs of results were detected in both the fieldtissue sample and its blind composite duplicate. (Agreement between non-detects could not bequantitatively analyzed and therefore is not included in this discussion.)
The study MQO for precision was exceeded during Year 1, Year 2, Year 3, and Year 4 ofthe study. Over 99% (99.8%) of the duplicate composite pairs agreed within ±50% whenthe measured results were more than 5 times the ML, and 99.7% of the duplicatecomposite pairs agreed within ±100% when measured results were less than 5 times theML.
Approximately 4,240 of these paired results were detected at concentrations that were at least 5times greater than the ML, and all but eight (99.8%) of these results met the 50% MQOestablished for agreement between analytes detected at this level. The remaining pairs(approximately 2,810 paired results) were detected within 5 times the ML and subjected to the±100% objective described above. All but five of these paired results (99.8% of the results),three in Year 1, one in Year 2, and three in Year 4 of the study, met the MQO. All of thesepaired results met the MQO for Year 3 of the study.
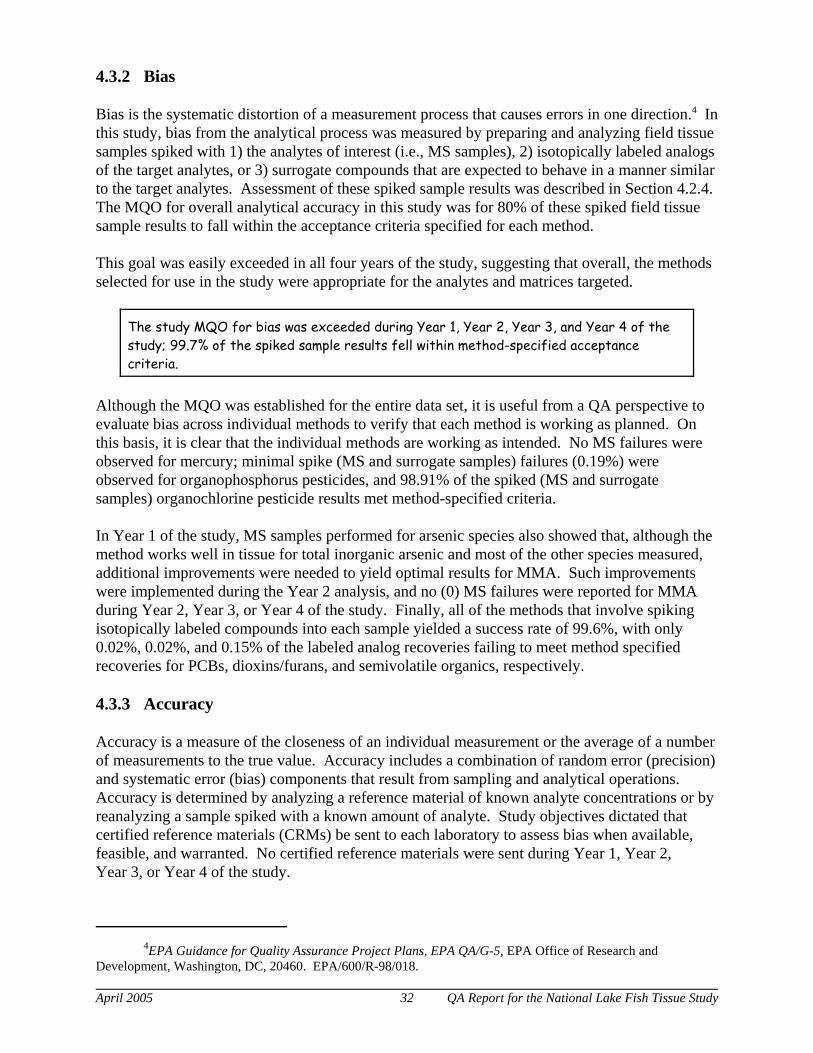
4EPA Guidance for Quality Assurance Project Plans, EPA QA/G-5, EPA Office of Research andDevelopment, Washington, DC, 20460. EPA/600/R-98/018.
April 2005 32 QA Report for the National Lake Fish Tissue Study
4.3.2 Bias
Bias is the systematic distortion of a measurement process that causes errors in one direction.4 Inthis study, bias from the analytical process was measured by preparing and analyzing field tissuesamples spiked with 1) the analytes of interest (i.e., MS samples), 2) isotopically labeled analogsof the target analytes, or 3) surrogate compounds that are expected to behave in a manner similarto the target analytes. Assessment of these spiked sample results was described in Section 4.2.4. The MQO for overall analytical accuracy in this study was for 80% of these spiked field tissuesample results to fall within the acceptance criteria specified for each method.
This goal was easily exceeded in all four years of the study, suggesting that overall, the methodsselected for use in the study were appropriate for the analytes and matrices targeted.
The study MQO for bias was exceeded during Year 1, Year 2, Year 3, and Year 4 of thestudy; 99.7% of the spiked sample results fell within method-specified acceptancecriteria.
Although the MQO was established for the entire data set, it is useful from a QA perspective toevaluate bias across individual methods to verify that each method is working as planned. Onthis basis, it is clear that the individual methods are working as intended. No MS failures wereobserved for mercury; minimal spike (MS and surrogate samples) failures (0.19%) wereobserved for organophosphorus pesticides, and 98.91% of the spiked (MS and surrogatesamples) organochlorine pesticide results met method-specified criteria.
In Year 1 of the study, MS samples performed for arsenic species also showed that, although themethod works well in tissue for total inorganic arsenic and most of the other species measured,additional improvements were needed to yield optimal results for MMA. Such improvementswere implemented during the Year 2 analysis, and no (0) MS failures were reported for MMAduring Year 2, Year 3, or Year 4 of the study. Finally, all of the methods that involve spikingisotopically labeled compounds into each sample yielded a success rate of 99.6%, with only0.02%, 0.02%, and 0.15% of the labeled analog recoveries failing to meet method specifiedrecoveries for PCBs, dioxins/furans, and semivolatile organics, respectively.
4.3.3 Accuracy
Accuracy is a measure of the closeness of an individual measurement or the average of a numberof measurements to the true value. Accuracy includes a combination of random error (precision)and systematic error (bias) components that result from sampling and analytical operations. Accuracy is determined by analyzing a reference material of known analyte concentrations or byreanalyzing a sample spiked with a known amount of analyte. Study objectives dictated thatcertified reference materials (CRMs) be sent to each laboratory to assess bias when available,feasible, and warranted. No certified reference materials were sent during Year 1, Year 2, Year 3, or Year 4 of the study.
QA Report for the National Lake Fish Tissue Study 33 April 2005
4.3.4 Sensitivity
As described in Section 4.1.1, all laboratories demonstrated their ability to achieve the studyMQOs established for sensitivity, and 100% of the results generated during Year 1, Year 2, Year 3, and Year 4 of the study were generated on instruments that were calibrated to encompassMLs. In addition, all results reported below the ML have been qualified in the database to alertdata users that, although the presence of the analyte was confirmed, the concentration reported inthe database is an estimate because it falls below the quantitation limit.
4.3.5 Completeness
Completeness is defined in terms of the percentage of data that are collected and deemed to beacceptable for use in the study. Three measures of completeness can be defined, as follows:
Sampling Completeness: The number of valid samples collected relative to the number ofsamples planned for collection;
Analytical Completeness: The number of valid sample measurements relative to the numberof valid samples collected; and
Overall Completeness: The number of valid sample measurements relative to the numberof samples planned for collection.
The analytical completeness goal in this study was that EPA obtain valid measurements from90% of the valid samples collected. This goal was exceeded during Year 1, Year 2, Year 3, andYear 4 of the study. Only two of the 1003 valid samples collected during the four years of thestudy could not be completely analyzed because they did not provide sufficient tissue. Thisresulted in EPA obtaining valid measurements from 99.8% of the valid samples collected in Year 1 through Year 4 of the study.
EPA obtained valid measurements from 99.8% of the samples collected in Year 1, Year 2,Year 3, and Year 4 of the study, thereby exceeding the MQO of 90% for analyticalcompleteness during the study.
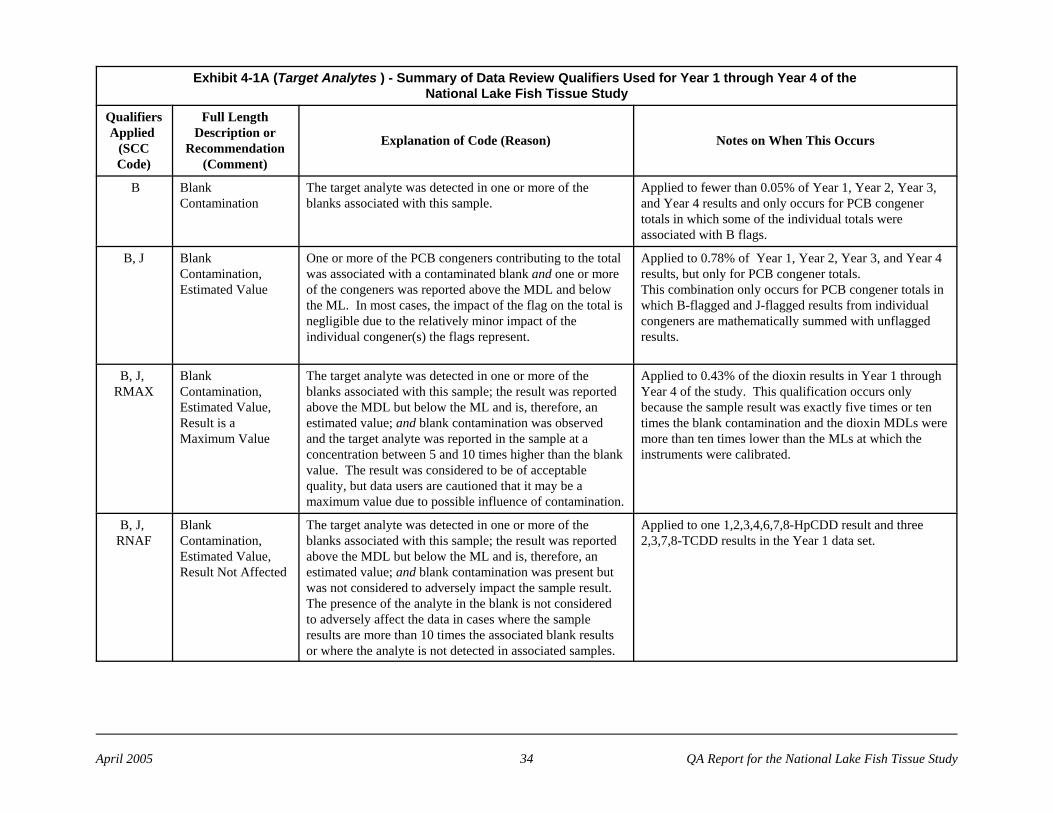
April 2005 34 QA Report for the National Lake Fish Tissue Study
Exhibit 4-1A (Target Analytes ) - Summary of Data Review Qualifiers Used for Year 1 through Year 4 of the National Lake Fish Tissue Study
QualifiersApplied
(SCCCode)
Full LengthDescription or
Recommendation(Comment)
Explanation of Code (Reason) Notes on When This Occurs
B BlankContamination
The target analyte was detected in one or more of theblanks associated with this sample.
Applied to fewer than 0.05% of Year 1, Year 2, Year 3,and Year 4 results and only occurs for PCB congenertotals in which some of the individual totals wereassociated with B flags.
B, J BlankContamination,Estimated Value
One or more of the PCB congeners contributing to the totalwas associated with a contaminated blank and one or moreof the congeners was reported above the MDL and belowthe ML. In most cases, the impact of the flag on the total isnegligible due to the relatively minor impact of theindividual congener(s) the flags represent.
Applied to 0.78% of Year 1, Year 2, Year 3, and Year 4results, but only for PCB congener totals.This combination only occurs for PCB congener totals inwhich B-flagged and J-flagged results from individualcongeners are mathematically summed with unflaggedresults.
B, J, RMAX
BlankContamination,Estimated Value,Result is aMaximum Value
The target analyte was detected in one or more of theblanks associated with this sample; the result was reportedabove the MDL but below the ML and is, therefore, anestimated value; and blank contamination was observedand the target analyte was reported in the sample at aconcentration between 5 and 10 times higher than the blankvalue. The result was considered to be of acceptablequality, but data users are cautioned that it may be amaximum value due to possible influence of contamination.
Applied to 0.43% of the dioxin results in Year 1 throughYear 4 of the study. This qualification occurs onlybecause the sample result was exactly five times or tentimes the blank contamination and the dioxin MDLs weremore than ten times lower than the MLs at which theinstruments were calibrated.
B, J, RNAF
BlankContamination,Estimated Value,Result Not Affected
The target analyte was detected in one or more of theblanks associated with this sample; the result was reportedabove the MDL but below the ML and is, therefore, anestimated value; and blank contamination was present butwas not considered to adversely impact the sample result. The presence of the analyte in the blank is not consideredto adversely affect the data in cases where the sampleresults are more than 10 times the associated blank resultsor where the analyte is not detected in associated samples.
Applied to one 1,2,3,4,6,7,8-HpCDD result and three2,3,7,8-TCDD results in the Year 1 data set.
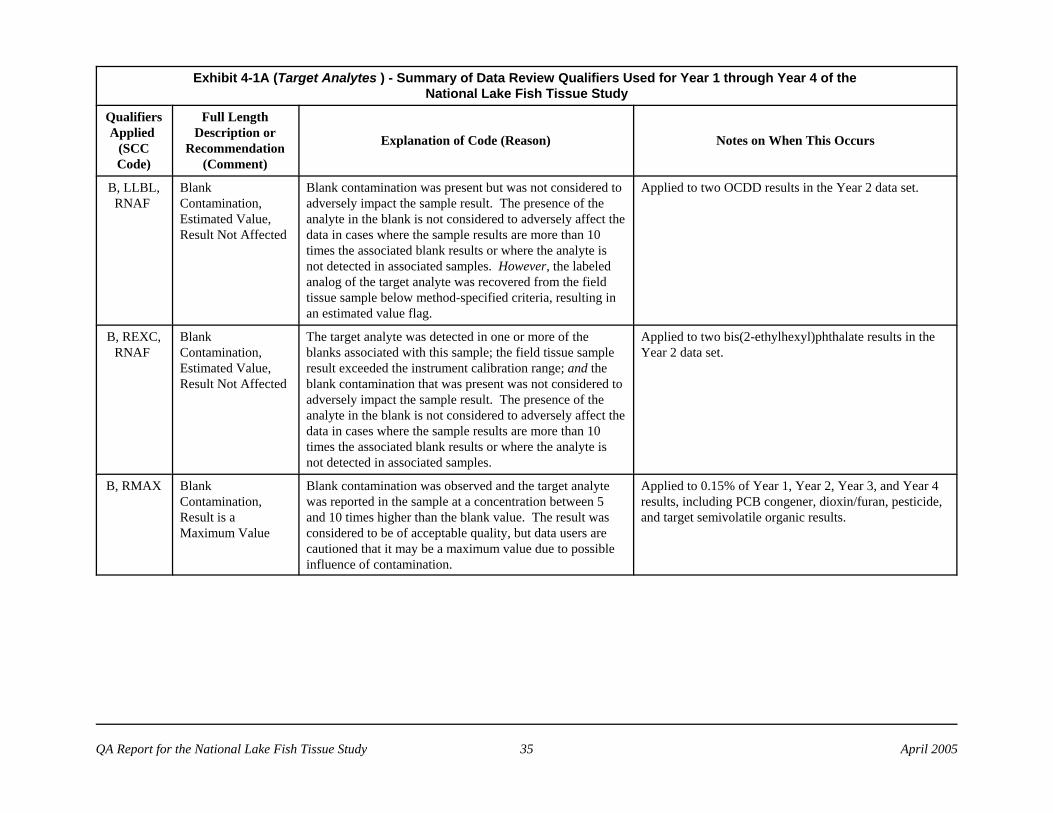
Exhibit 4-1A (Target Analytes ) - Summary of Data Review Qualifiers Used for Year 1 through Year 4 of the National Lake Fish Tissue Study
QualifiersApplied
(SCCCode)
Full LengthDescription or
Recommendation(Comment)
Explanation of Code (Reason) Notes on When This Occurs
QA Report for the National Lake Fish Tissue Study 35 April 2005
B, LLBL,RNAF
BlankContamination,Estimated Value,Result Not Affected
Blank contamination was present but was not considered toadversely impact the sample result. The presence of theanalyte in the blank is not considered to adversely affect thedata in cases where the sample results are more than 10times the associated blank results or where the analyte isnot detected in associated samples. However, the labeledanalog of the target analyte was recovered from the fieldtissue sample below method-specified criteria, resulting inan estimated value flag.
Applied to two OCDD results in the Year 2 data set.
B, REXC,RNAF
BlankContamination,Estimated Value,Result Not Affected
The target analyte was detected in one or more of theblanks associated with this sample; the field tissue sampleresult exceeded the instrument calibration range; and theblank contamination that was present was not considered toadversely impact the sample result. The presence of theanalyte in the blank is not considered to adversely affect thedata in cases where the sample results are more than 10times the associated blank results or where the analyte isnot detected in associated samples.
Applied to two bis(2-ethylhexyl)phthalate results in theYear 2 data set.
B, RMAX BlankContamination,Result is aMaximum Value
Blank contamination was observed and the target analytewas reported in the sample at a concentration between 5and 10 times higher than the blank value. The result wasconsidered to be of acceptable quality, but data users arecautioned that it may be a maximum value due to possibleinfluence of contamination.
Applied to 0.15% of Year 1, Year 2, Year 3, and Year 4results, including PCB congener, dioxin/furan, pesticide,and target semivolatile organic results.
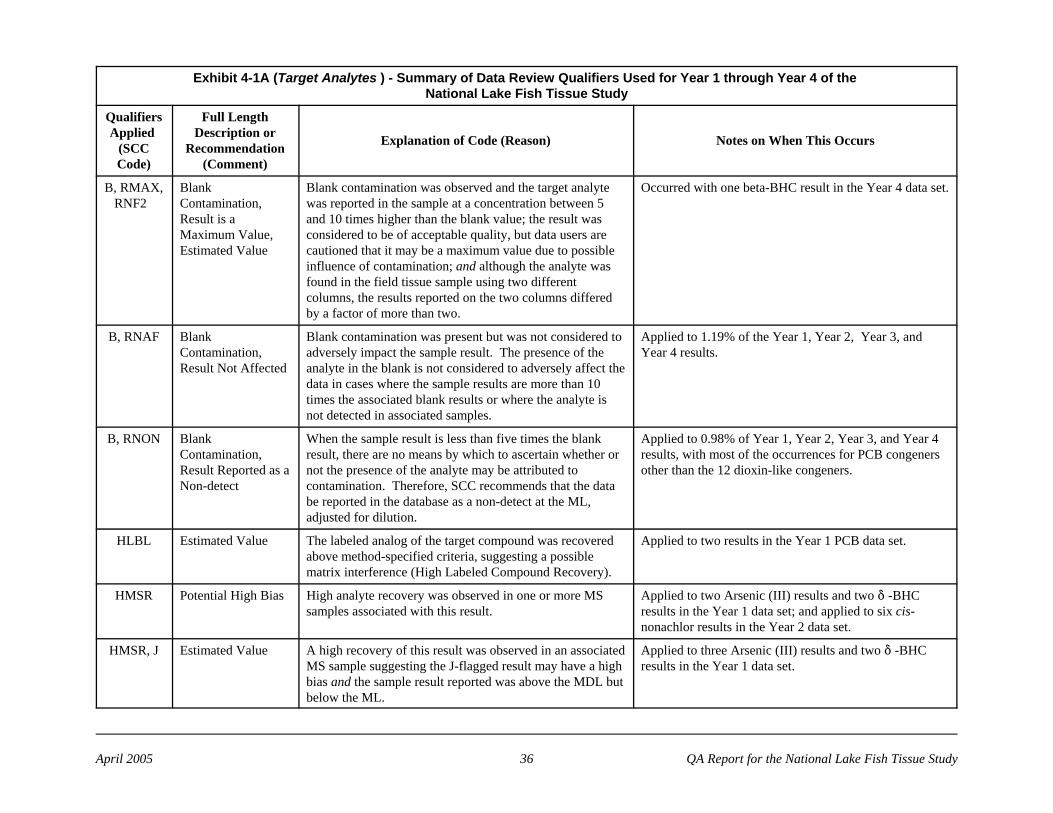
Exhibit 4-1A (Target Analytes ) - Summary of Data Review Qualifiers Used for Year 1 through Year 4 of the National Lake Fish Tissue Study
QualifiersApplied
(SCCCode)
Full LengthDescription or
Recommendation(Comment)
Explanation of Code (Reason) Notes on When This Occurs
April 2005 36 QA Report for the National Lake Fish Tissue Study
B, RMAX,RNF2
BlankContamination,Result is aMaximum Value,Estimated Value
Blank contamination was observed and the target analytewas reported in the sample at a concentration between 5and 10 times higher than the blank value; the result wasconsidered to be of acceptable quality, but data users arecautioned that it may be a maximum value due to possibleinfluence of contamination; and although the analyte wasfound in the field tissue sample using two differentcolumns, the results reported on the two columns differedby a factor of more than two.
Occurred with one beta-BHC result in the Year 4 data set.
B, RNAF BlankContamination,Result Not Affected
Blank contamination was present but was not considered toadversely impact the sample result. The presence of theanalyte in the blank is not considered to adversely affect thedata in cases where the sample results are more than 10times the associated blank results or where the analyte isnot detected in associated samples.
Applied to 1.19% of the Year 1, Year 2, Year 3, andYear 4 results.
B, RNON BlankContamination,Result Reported as aNon-detect
When the sample result is less than five times the blankresult, there are no means by which to ascertain whether ornot the presence of the analyte may be attributed tocontamination. Therefore, SCC recommends that the databe reported in the database as a non-detect at the ML,adjusted for dilution.
Applied to 0.98% of Year 1, Year 2, Year 3, and Year 4results, with most of the occurrences for PCB congenersother than the 12 dioxin-like congeners.
HLBL Estimated Value The labeled analog of the target compound was recoveredabove method-specified criteria, suggesting a possiblematrix interference (High Labeled Compound Recovery).
Applied to two results in the Year 1 PCB data set.
HMSR Potential High Bias High analyte recovery was observed in one or more MSsamples associated with this result.
Applied to two Arsenic (III) results and two * -BHCresults in the Year 1 data set; and applied to six cis-nonachlor results in the Year 2 data set.
HMSR, J Estimated Value A high recovery of this result was observed in an associatedMS sample suggesting the J-flagged result may have a highbias and the sample result reported was above the MDL butbelow the ML.
Applied to three Arsenic (III) results and two * -BHCresults in the Year 1 data set.
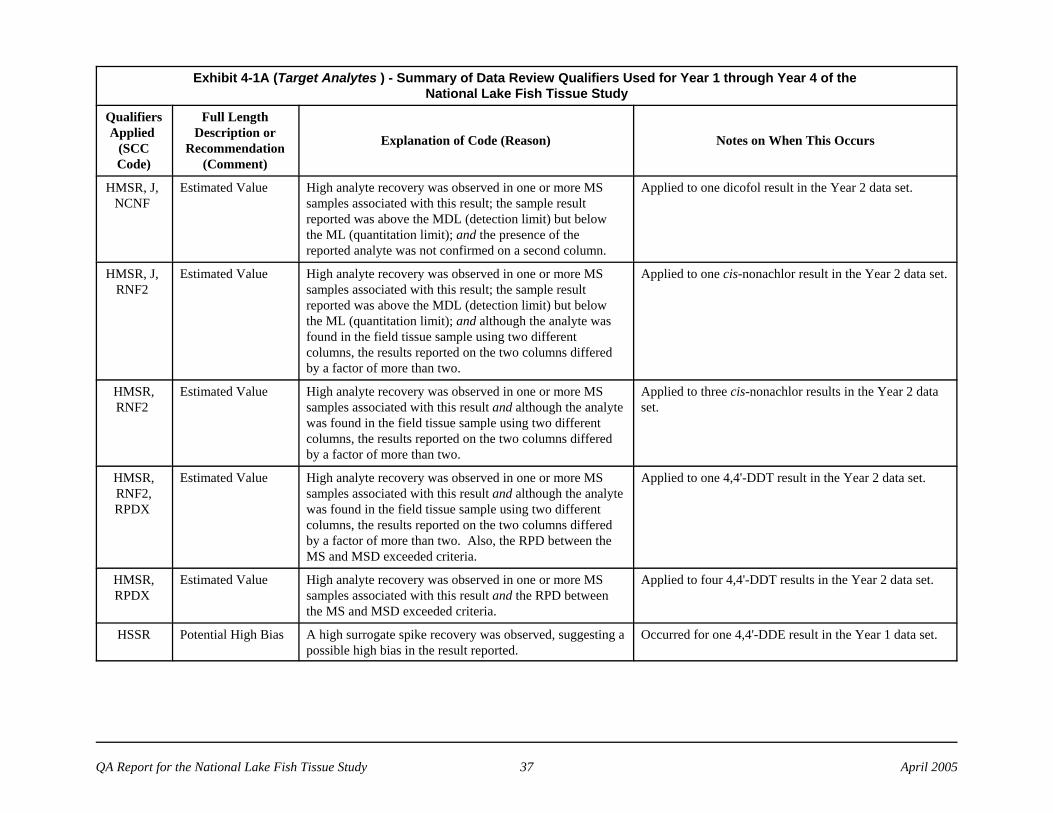
Exhibit 4-1A (Target Analytes ) - Summary of Data Review Qualifiers Used for Year 1 through Year 4 of the National Lake Fish Tissue Study
QualifiersApplied
(SCCCode)
Full LengthDescription or
Recommendation(Comment)
Explanation of Code (Reason) Notes on When This Occurs
QA Report for the National Lake Fish Tissue Study 37 April 2005
HMSR, J, NCNF
Estimated Value High analyte recovery was observed in one or more MSsamples associated with this result; the sample resultreported was above the MDL (detection limit) but belowthe ML (quantitation limit); and the presence of thereported analyte was not confirmed on a second column.
Applied to one dicofol result in the Year 2 data set.
HMSR, J, RNF2
Estimated Value High analyte recovery was observed in one or more MSsamples associated with this result; the sample resultreported was above the MDL (detection limit) but belowthe ML (quantitation limit); and although the analyte wasfound in the field tissue sample using two differentcolumns, the results reported on the two columns differedby a factor of more than two.
Applied to one cis-nonachlor result in the Year 2 data set.
HMSR,RNF2
Estimated Value High analyte recovery was observed in one or more MSsamples associated with this result and although the analytewas found in the field tissue sample using two differentcolumns, the results reported on the two columns differedby a factor of more than two.
Applied to three cis-nonachlor results in the Year 2 dataset.
HMSR,RNF2,RPDX
Estimated Value High analyte recovery was observed in one or more MSsamples associated with this result and although the analytewas found in the field tissue sample using two differentcolumns, the results reported on the two columns differedby a factor of more than two. Also, the RPD between theMS and MSD exceeded criteria.
Applied to one 4,4'-DDT result in the Year 2 data set.
HMSR,RPDX
Estimated Value High analyte recovery was observed in one or more MSsamples associated with this result and the RPD betweenthe MS and MSD exceeded criteria.
Applied to four 4,4'-DDT results in the Year 2 data set.
HSSR Potential High Bias A high surrogate spike recovery was observed, suggesting apossible high bias in the result reported.
Occurred for one 4,4'-DDE result in the Year 1 data set.
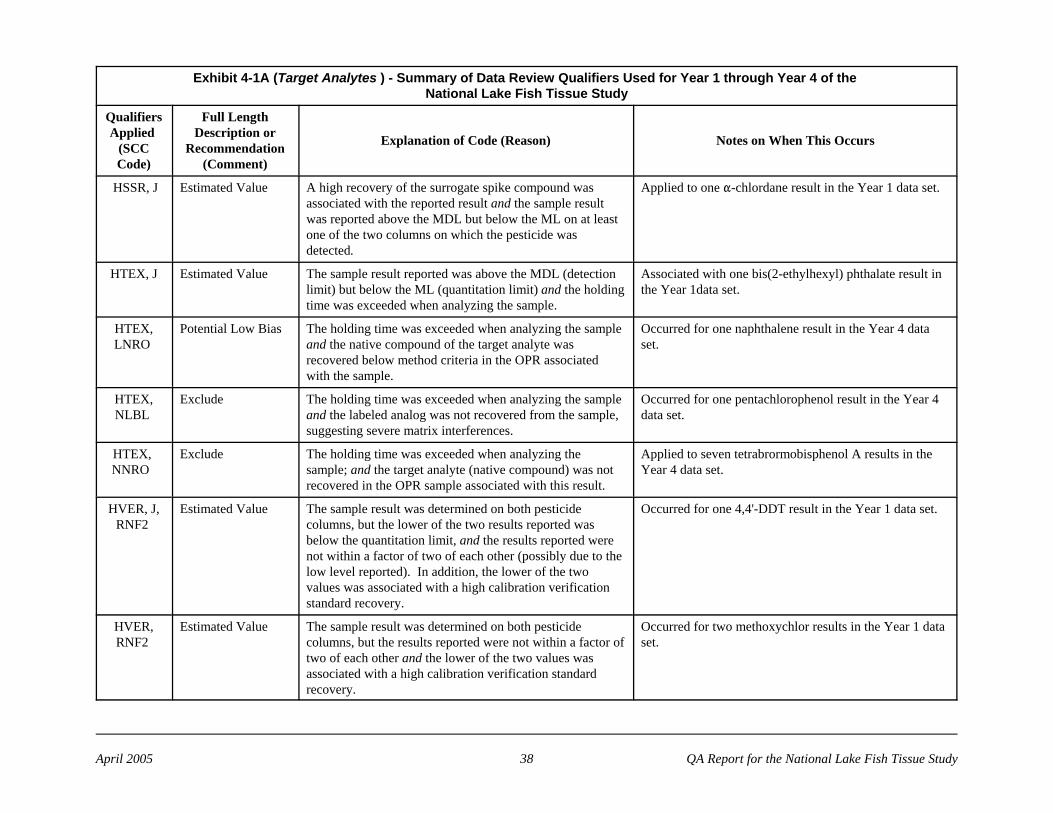
Exhibit 4-1A (Target Analytes ) - Summary of Data Review Qualifiers Used for Year 1 through Year 4 of the National Lake Fish Tissue Study
QualifiersApplied
(SCCCode)
Full LengthDescription or
Recommendation(Comment)
Explanation of Code (Reason) Notes on When This Occurs
April 2005 38 QA Report for the National Lake Fish Tissue Study
HSSR, J Estimated Value A high recovery of the surrogate spike compound wasassociated with the reported result and the sample resultwas reported above the MDL but below the ML on at leastone of the two columns on which the pesticide wasdetected.
Applied to one "-chlordane result in the Year 1 data set.
HTEX, J Estimated Value The sample result reported was above the MDL (detectionlimit) but below the ML (quantitation limit) and the holdingtime was exceeded when analyzing the sample.
Associated with one bis(2-ethylhexyl) phthalate result inthe Year 1data set.
HTEX,LNRO
Potential Low Bias The holding time was exceeded when analyzing the sampleand the native compound of the target analyte wasrecovered below method criteria in the OPR associatedwith the sample.
Occurred for one naphthalene result in the Year 4 dataset.
HTEX,NLBL
Exclude The holding time was exceeded when analyzing the sampleand the labeled analog was not recovered from the sample,suggesting severe matrix interferences.
Occurred for one pentachlorophenol result in the Year 4data set.
HTEX, NNRO
Exclude The holding time was exceeded when analyzing thesample; and the target analyte (native compound) was notrecovered in the OPR sample associated with this result.
Applied to seven tetrabrormobisphenol A results in theYear 4 data set.
HVER, J,RNF2
Estimated Value The sample result was determined on both pesticidecolumns, but the lower of the two results reported wasbelow the quantitation limit, and the results reported werenot within a factor of two of each other (possibly due to thelow level reported). In addition, the lower of the twovalues was associated with a high calibration verificationstandard recovery.
Occurred for one 4,4'-DDT result in the Year 1 data set.
HVER,RNF2
Estimated Value The sample result was determined on both pesticidecolumns, but the results reported were not within a factor oftwo of each other and the lower of the two values wasassociated with a high calibration verification standardrecovery.
Occurred for two methoxychlor results in the Year 1 dataset.
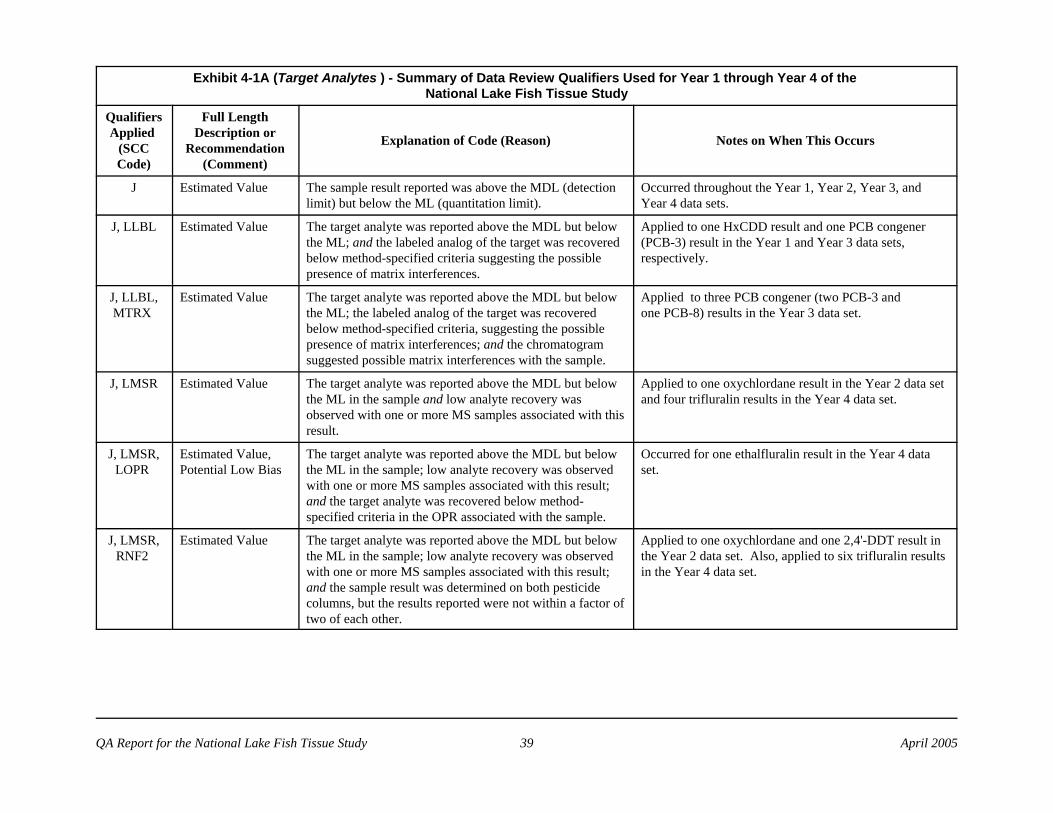
Exhibit 4-1A (Target Analytes ) - Summary of Data Review Qualifiers Used for Year 1 through Year 4 of the National Lake Fish Tissue Study
QualifiersApplied
(SCCCode)
Full LengthDescription or
Recommendation(Comment)
Explanation of Code (Reason) Notes on When This Occurs
QA Report for the National Lake Fish Tissue Study 39 April 2005
J Estimated Value The sample result reported was above the MDL (detectionlimit) but below the ML (quantitation limit).
Occurred throughout the Year 1, Year 2, Year 3, andYear 4 data sets.
J, LLBL Estimated Value The target analyte was reported above the MDL but belowthe ML; and the labeled analog of the target was recoveredbelow method-specified criteria suggesting the possiblepresence of matrix interferences.
Applied to one HxCDD result and one PCB congener(PCB-3) result in the Year 1 and Year 3 data sets,respectively.
J, LLBL,MTRX
Estimated Value The target analyte was reported above the MDL but belowthe ML; the labeled analog of the target was recoveredbelow method-specified criteria, suggesting the possiblepresence of matrix interferences; and the chromatogramsuggested possible matrix interferences with the sample.
Applied to three PCB congener (two PCB-3 and one PCB-8) results in the Year 3 data set.
J, LMSR Estimated Value The target analyte was reported above the MDL but belowthe ML in the sample and low analyte recovery wasobserved with one or more MS samples associated with thisresult.
Applied to one oxychlordane result in the Year 2 data setand four trifluralin results in the Year 4 data set.
J, LMSR,LOPR
Estimated Value,Potential Low Bias
The target analyte was reported above the MDL but belowthe ML in the sample; low analyte recovery was observedwith one or more MS samples associated with this result;and the target analyte was recovered below method-specified criteria in the OPR associated with the sample.
Occurred for one ethalfluralin result in the Year 4 dataset.
J, LMSR,RNF2
Estimated Value The target analyte was reported above the MDL but belowthe ML in the sample; low analyte recovery was observedwith one or more MS samples associated with this result;and the sample result was determined on both pesticidecolumns, but the results reported were not within a factor oftwo of each other.
Applied to one oxychlordane and one 2,4'-DDT result inthe Year 2 data set. Also, applied to six trifluralin resultsin the Year 4 data set.
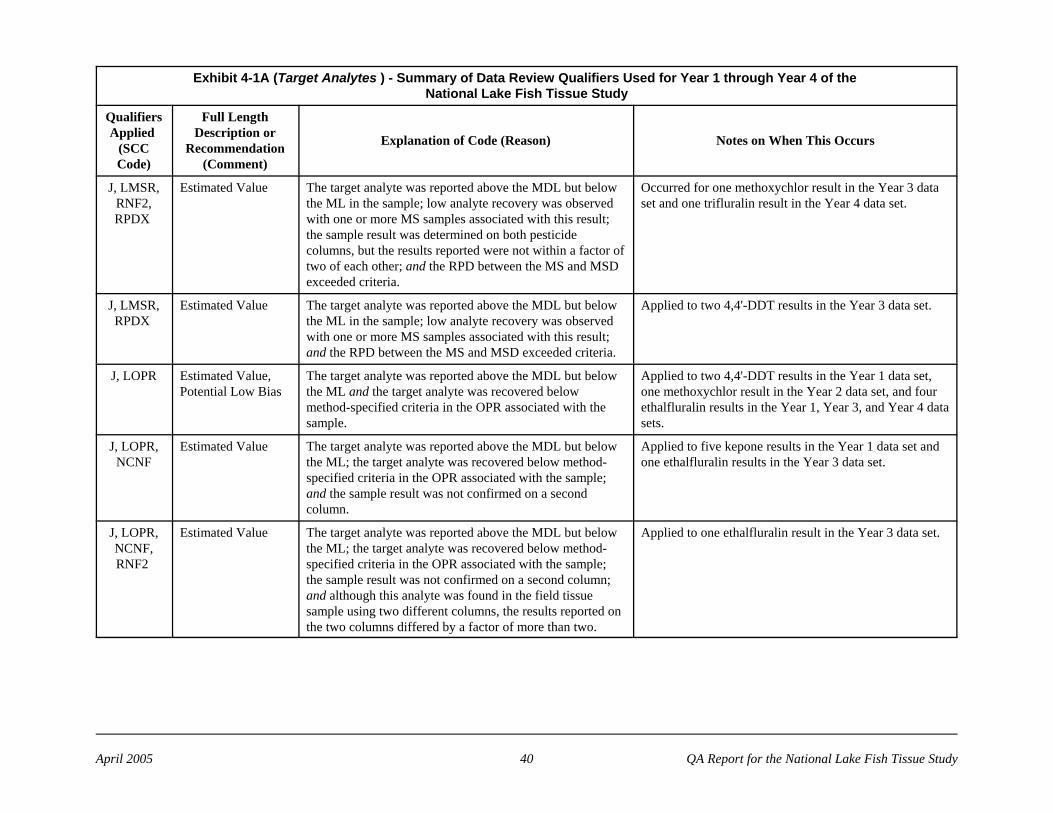
Exhibit 4-1A (Target Analytes ) - Summary of Data Review Qualifiers Used for Year 1 through Year 4 of the National Lake Fish Tissue Study
QualifiersApplied
(SCCCode)
Full LengthDescription or
Recommendation(Comment)
Explanation of Code (Reason) Notes on When This Occurs
April 2005 40 QA Report for the National Lake Fish Tissue Study
J, LMSR,RNF2,RPDX
Estimated Value The target analyte was reported above the MDL but belowthe ML in the sample; low analyte recovery was observedwith one or more MS samples associated with this result;the sample result was determined on both pesticidecolumns, but the results reported were not within a factor oftwo of each other; and the RPD between the MS and MSDexceeded criteria.
Occurred for one methoxychlor result in the Year 3 dataset and one trifluralin result in the Year 4 data set.
J, LMSR,RPDX
Estimated Value The target analyte was reported above the MDL but belowthe ML in the sample; low analyte recovery was observedwith one or more MS samples associated with this result;and the RPD between the MS and MSD exceeded criteria.
Applied to two 4,4'-DDT results in the Year 3 data set.
J, LOPR Estimated Value,Potential Low Bias
The target analyte was reported above the MDL but belowthe ML and the target analyte was recovered belowmethod-specified criteria in the OPR associated with thesample.
Applied to two 4,4'-DDT results in the Year 1 data set,one methoxychlor result in the Year 2 data set, and fourethalfluralin results in the Year 1, Year 3, and Year 4 datasets.
J, LOPR,NCNF
Estimated Value The target analyte was reported above the MDL but belowthe ML; the target analyte was recovered below method-specified criteria in the OPR associated with the sample;and the sample result was not confirmed on a secondcolumn.
Applied to five kepone results in the Year 1 data set andone ethalfluralin results in the Year 3 data set.
J, LOPR,NCNF,RNF2
Estimated Value The target analyte was reported above the MDL but belowthe ML; the target analyte was recovered below method-specified criteria in the OPR associated with the sample;the sample result was not confirmed on a second column;and although this analyte was found in the field tissuesample using two different columns, the results reported onthe two columns differed by a factor of more than two.
Applied to one ethalfluralin result in the Year 3 data set.
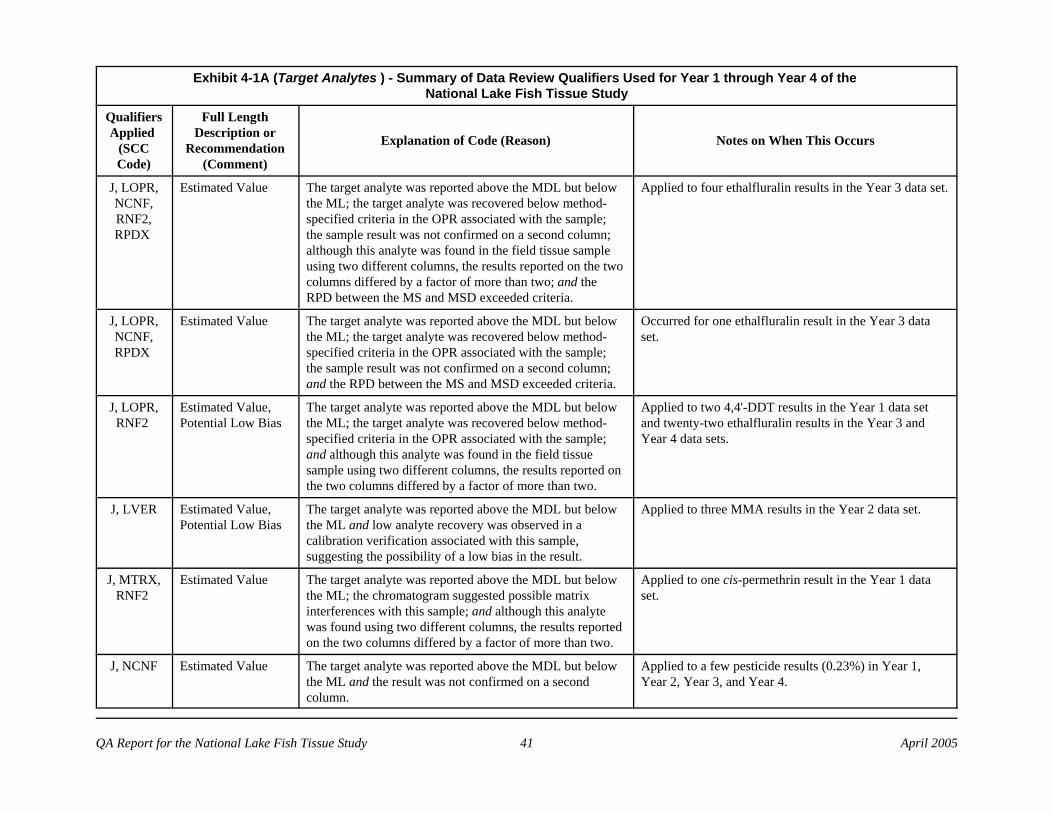
Exhibit 4-1A (Target Analytes ) - Summary of Data Review Qualifiers Used for Year 1 through Year 4 of the National Lake Fish Tissue Study
QualifiersApplied
(SCCCode)
Full LengthDescription or
Recommendation(Comment)
Explanation of Code (Reason) Notes on When This Occurs
QA Report for the National Lake Fish Tissue Study 41 April 2005
J, LOPR,NCNF,RNF2,RPDX
Estimated Value The target analyte was reported above the MDL but belowthe ML; the target analyte was recovered below method-specified criteria in the OPR associated with the sample;the sample result was not confirmed on a second column;although this analyte was found in the field tissue sampleusing two different columns, the results reported on the twocolumns differed by a factor of more than two; and theRPD between the MS and MSD exceeded criteria.
Applied to four ethalfluralin results in the Year 3 data set.
J, LOPR,NCNF,RPDX
Estimated Value The target analyte was reported above the MDL but belowthe ML; the target analyte was recovered below method-specified criteria in the OPR associated with the sample;the sample result was not confirmed on a second column;and the RPD between the MS and MSD exceeded criteria.
Occurred for one ethalfluralin result in the Year 3 dataset.
J, LOPR,RNF2
Estimated Value,Potential Low Bias
The target analyte was reported above the MDL but belowthe ML; the target analyte was recovered below method-specified criteria in the OPR associated with the sample;and although this analyte was found in the field tissuesample using two different columns, the results reported onthe two columns differed by a factor of more than two.
Applied to two 4,4'-DDT results in the Year 1 data setand twenty-two ethalfluralin results in the Year 3 andYear 4 data sets.
J, LVER Estimated Value,Potential Low Bias
The target analyte was reported above the MDL but belowthe ML and low analyte recovery was observed in acalibration verification associated with this sample,suggesting the possibility of a low bias in the result.
Applied to three MMA results in the Year 2 data set.
J, MTRX,RNF2
Estimated Value The target analyte was reported above the MDL but belowthe ML; the chromatogram suggested possible matrixinterferences with this sample; and although this analytewas found using two different columns, the results reportedon the two columns differed by a factor of more than two.
Applied to one cis-permethrin result in the Year 1 dataset.
J, NCNF Estimated Value The target analyte was reported above the MDL but belowthe ML and the result was not confirmed on a secondcolumn.
Applied to a few pesticide results (0.23%) in Year 1,Year 2, Year 3, and Year 4.
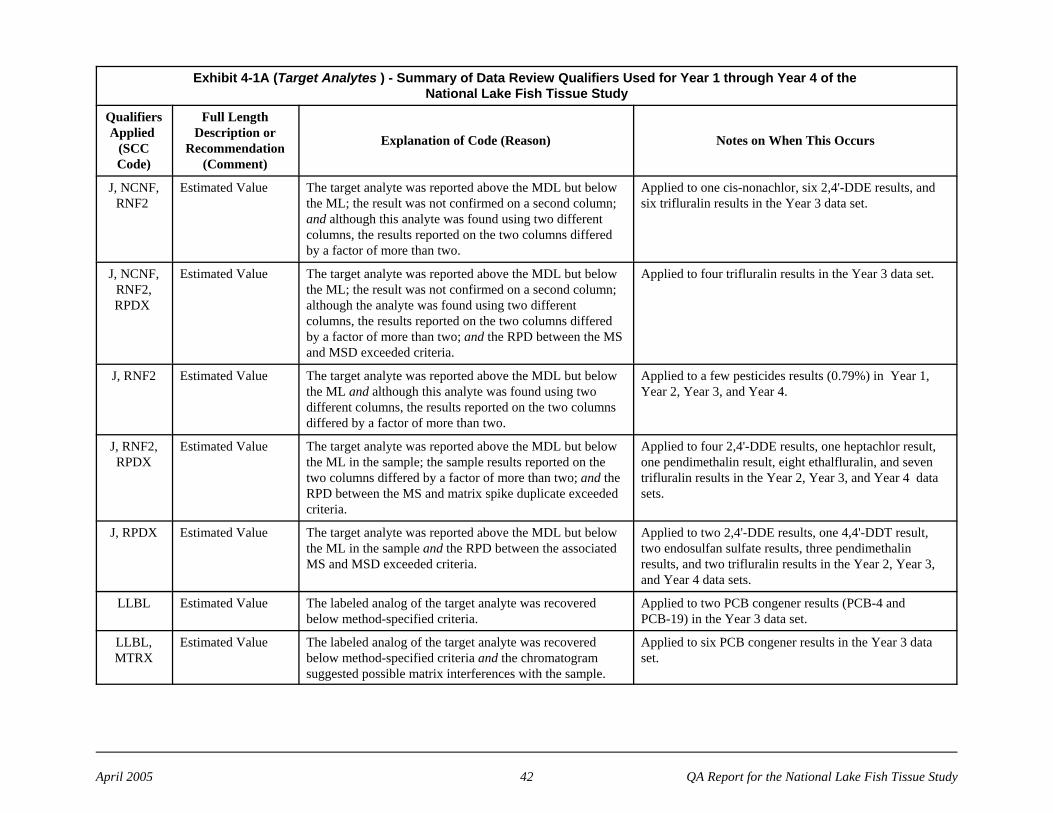
Exhibit 4-1A (Target Analytes ) - Summary of Data Review Qualifiers Used for Year 1 through Year 4 of the National Lake Fish Tissue Study
QualifiersApplied
(SCCCode)
Full LengthDescription or
Recommendation(Comment)
Explanation of Code (Reason) Notes on When This Occurs
April 2005 42 QA Report for the National Lake Fish Tissue Study
J, NCNF,RNF2
Estimated Value The target analyte was reported above the MDL but belowthe ML; the result was not confirmed on a second column;and although this analyte was found using two differentcolumns, the results reported on the two columns differedby a factor of more than two.
Applied to one cis-nonachlor, six 2,4'-DDE results, andsix trifluralin results in the Year 3 data set.
J, NCNF,RNF2,RPDX
Estimated Value The target analyte was reported above the MDL but belowthe ML; the result was not confirmed on a second column;although the analyte was found using two differentcolumns, the results reported on the two columns differedby a factor of more than two; and the RPD between the MSand MSD exceeded criteria.
Applied to four trifluralin results in the Year 3 data set.
J, RNF2 Estimated Value The target analyte was reported above the MDL but belowthe ML and although this analyte was found using twodifferent columns, the results reported on the two columnsdiffered by a factor of more than two.
Applied to a few pesticides results (0.79%) in Year 1,Year 2, Year 3, and Year 4.
J, RNF2,RPDX
Estimated Value The target analyte was reported above the MDL but belowthe ML in the sample; the sample results reported on thetwo columns differed by a factor of more than two; and theRPD between the MS and matrix spike duplicate exceededcriteria.
Applied to four 2,4'-DDE results, one heptachlor result,one pendimethalin result, eight ethalfluralin, and seventrifluralin results in the Year 2, Year 3, and Year 4 datasets.
J, RPDX Estimated Value The target analyte was reported above the MDL but belowthe ML in the sample and the RPD between the associatedMS and MSD exceeded criteria.
Applied to two 2,4'-DDE results, one 4,4'-DDT result,two endosulfan sulfate results, three pendimethalinresults, and two trifluralin results in the Year 2, Year 3,and Year 4 data sets.
LLBL Estimated Value The labeled analog of the target analyte was recoveredbelow method-specified criteria.
Applied to two PCB congener results (PCB-4 and PCB-19) in the Year 3 data set.
LLBL,MTRX
Estimated Value The labeled analog of the target analyte was recoveredbelow method-specified criteria and the chromatogramsuggested possible matrix interferences with the sample.
Applied to six PCB congener results in the Year 3 dataset.
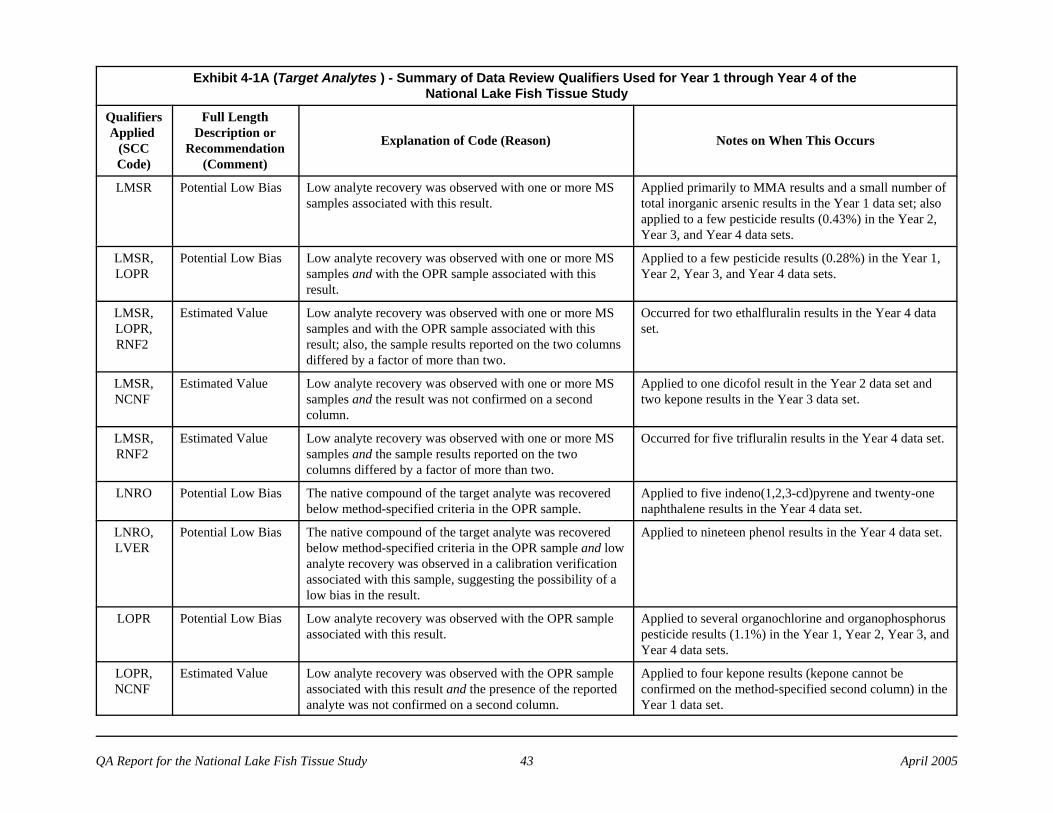
Exhibit 4-1A (Target Analytes ) - Summary of Data Review Qualifiers Used for Year 1 through Year 4 of the National Lake Fish Tissue Study
QualifiersApplied
(SCCCode)
Full LengthDescription or
Recommendation(Comment)
Explanation of Code (Reason) Notes on When This Occurs
QA Report for the National Lake Fish Tissue Study 43 April 2005
LMSR Potential Low Bias Low analyte recovery was observed with one or more MSsamples associated with this result.
Applied primarily to MMA results and a small number oftotal inorganic arsenic results in the Year 1 data set; alsoapplied to a few pesticide results (0.43%) in the Year 2,Year 3, and Year 4 data sets.
LMSR,LOPR
Potential Low Bias Low analyte recovery was observed with one or more MSsamples and with the OPR sample associated with thisresult.
Applied to a few pesticide results (0.28%) in the Year 1,Year 2, Year 3, and Year 4 data sets.
LMSR,LOPR,RNF2
Estimated Value Low analyte recovery was observed with one or more MSsamples and with the OPR sample associated with thisresult; also, the sample results reported on the two columnsdiffered by a factor of more than two.
Occurred for two ethalfluralin results in the Year 4 dataset.
LMSR,NCNF
Estimated Value Low analyte recovery was observed with one or more MSsamples and the result was not confirmed on a secondcolumn.
Applied to one dicofol result in the Year 2 data set andtwo kepone results in the Year 3 data set.
LMSR,RNF2
Estimated Value Low analyte recovery was observed with one or more MSsamples and the sample results reported on the twocolumns differed by a factor of more than two.
Occurred for five trifluralin results in the Year 4 data set.
LNRO Potential Low Bias The native compound of the target analyte was recoveredbelow method-specified criteria in the OPR sample.
Applied to five indeno(1,2,3-cd)pyrene and twenty-onenaphthalene results in the Year 4 data set.
LNRO,LVER
Potential Low Bias The native compound of the target analyte was recoveredbelow method-specified criteria in the OPR sample and lowanalyte recovery was observed in a calibration verificationassociated with this sample, suggesting the possibility of alow bias in the result.
Applied to nineteen phenol results in the Year 4 data set.
LOPR Potential Low Bias Low analyte recovery was observed with the OPR sampleassociated with this result.
Applied to several organochlorine and organophosphoruspesticide results (1.1%) in the Year 1, Year 2, Year 3, andYear 4 data sets.
LOPR,NCNF
Estimated Value Low analyte recovery was observed with the OPR sampleassociated with this result and the presence of the reportedanalyte was not confirmed on a second column.
Applied to four kepone results (kepone cannot beconfirmed on the method-specified second column) in theYear 1 data set.
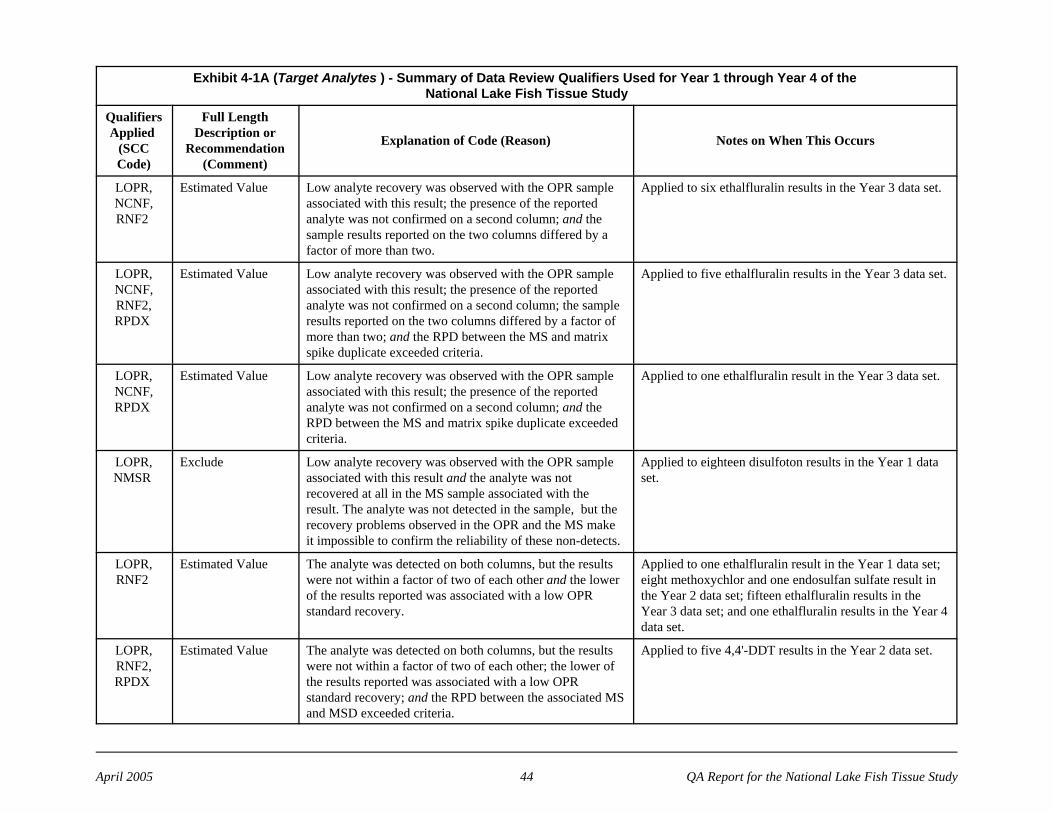
Exhibit 4-1A (Target Analytes ) - Summary of Data Review Qualifiers Used for Year 1 through Year 4 of the National Lake Fish Tissue Study
QualifiersApplied
(SCCCode)
Full LengthDescription or
Recommendation(Comment)
Explanation of Code (Reason) Notes on When This Occurs
April 2005 44 QA Report for the National Lake Fish Tissue Study
LOPR,NCNF,RNF2
Estimated Value Low analyte recovery was observed with the OPR sampleassociated with this result; the presence of the reportedanalyte was not confirmed on a second column; and thesample results reported on the two columns differed by afactor of more than two.
Applied to six ethalfluralin results in the Year 3 data set.
LOPR,NCNF,RNF2,RPDX
Estimated Value Low analyte recovery was observed with the OPR sampleassociated with this result; the presence of the reportedanalyte was not confirmed on a second column; the sampleresults reported on the two columns differed by a factor ofmore than two; and the RPD between the MS and matrixspike duplicate exceeded criteria.
Applied to five ethalfluralin results in the Year 3 data set.
LOPR,NCNF,RPDX
Estimated Value Low analyte recovery was observed with the OPR sampleassociated with this result; the presence of the reportedanalyte was not confirmed on a second column; and theRPD between the MS and matrix spike duplicate exceededcriteria.
Applied to one ethalfluralin result in the Year 3 data set.
LOPR,NMSR
Exclude Low analyte recovery was observed with the OPR sampleassociated with this result and the analyte was notrecovered at all in the MS sample associated with theresult. The analyte was not detected in the sample, but therecovery problems observed in the OPR and the MS makeit impossible to confirm the reliability of these non-detects.
Applied to eighteen disulfoton results in the Year 1 dataset.
LOPR,RNF2
Estimated Value The analyte was detected on both columns, but the resultswere not within a factor of two of each other and the lowerof the results reported was associated with a low OPRstandard recovery.
Applied to one ethalfluralin result in the Year 1 data set;eight methoxychlor and one endosulfan sulfate result inthe Year 2 data set; fifteen ethalfluralin results in theYear 3 data set; and one ethalfluralin results in the Year 4data set.
LOPR,RNF2,RPDX
Estimated Value The analyte was detected on both columns, but the resultswere not within a factor of two of each other; the lower ofthe results reported was associated with a low OPRstandard recovery; and the RPD between the associated MSand MSD exceeded criteria.
Applied to five 4,4'-DDT results in the Year 2 data set.
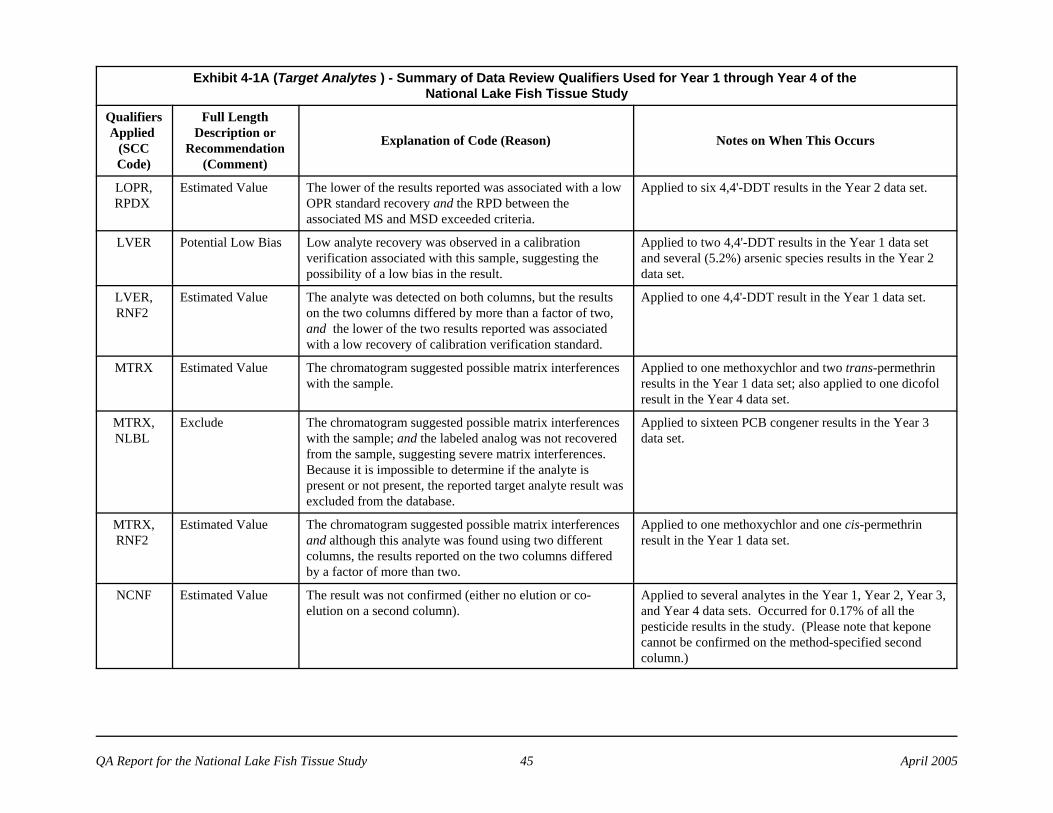
Exhibit 4-1A (Target Analytes ) - Summary of Data Review Qualifiers Used for Year 1 through Year 4 of the National Lake Fish Tissue Study
QualifiersApplied
(SCCCode)
Full LengthDescription or
Recommendation(Comment)
Explanation of Code (Reason) Notes on When This Occurs
QA Report for the National Lake Fish Tissue Study 45 April 2005
LOPR,RPDX
Estimated Value The lower of the results reported was associated with a lowOPR standard recovery and the RPD between theassociated MS and MSD exceeded criteria.
Applied to six 4,4'-DDT results in the Year 2 data set.
LVER Potential Low Bias Low analyte recovery was observed in a calibrationverification associated with this sample, suggesting thepossibility of a low bias in the result.
Applied to two 4,4'-DDT results in the Year 1 data setand several (5.2%) arsenic species results in the Year 2data set.
LVER,RNF2
Estimated Value The analyte was detected on both columns, but the resultson the two columns differed by more than a factor of two,and the lower of the two results reported was associatedwith a low recovery of calibration verification standard.
Applied to one 4,4'-DDT result in the Year 1 data set.
MTRX Estimated Value The chromatogram suggested possible matrix interferenceswith the sample.
Applied to one methoxychlor and two trans-permethrinresults in the Year 1 data set; also applied to one dicofolresult in the Year 4 data set.
MTRX,NLBL
Exclude The chromatogram suggested possible matrix interferenceswith the sample; and the labeled analog was not recoveredfrom the sample, suggesting severe matrix interferences. Because it is impossible to determine if the analyte ispresent or not present, the reported target analyte result wasexcluded from the database.
Applied to sixteen PCB congener results in the Year 3data set.
MTRX,RNF2
Estimated Value The chromatogram suggested possible matrix interferencesand although this analyte was found using two differentcolumns, the results reported on the two columns differedby a factor of more than two.
Applied to one methoxychlor and one cis-permethrinresult in the Year 1 data set.
NCNF Estimated Value The result was not confirmed (either no elution or co-elution on a second column).
Applied to several analytes in the Year 1, Year 2, Year 3,and Year 4 data sets. Occurred for 0.17% of all thepesticide results in the study. (Please note that keponecannot be confirmed on the method-specified secondcolumn.)
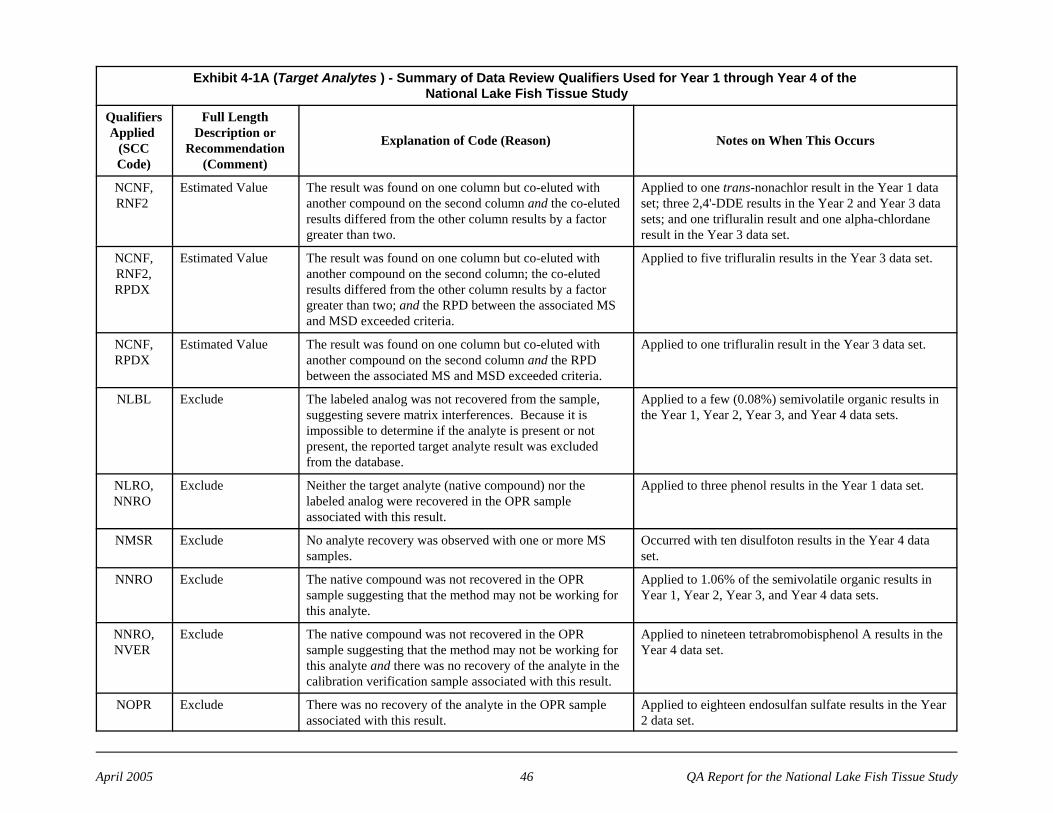
Exhibit 4-1A (Target Analytes ) - Summary of Data Review Qualifiers Used for Year 1 through Year 4 of the National Lake Fish Tissue Study
QualifiersApplied
(SCCCode)
Full LengthDescription or
Recommendation(Comment)
Explanation of Code (Reason) Notes on When This Occurs
April 2005 46 QA Report for the National Lake Fish Tissue Study
NCNF,RNF2
Estimated Value The result was found on one column but co-eluted withanother compound on the second column and the co-elutedresults differed from the other column results by a factorgreater than two.
Applied to one trans-nonachlor result in the Year 1 dataset; three 2,4'-DDE results in the Year 2 and Year 3 datasets; and one trifluralin result and one alpha-chlordaneresult in the Year 3 data set.
NCNF,RNF2,RPDX
Estimated Value The result was found on one column but co-eluted withanother compound on the second column; the co-elutedresults differed from the other column results by a factorgreater than two; and the RPD between the associated MSand MSD exceeded criteria.
Applied to five trifluralin results in the Year 3 data set.
NCNF,RPDX
Estimated Value The result was found on one column but co-eluted withanother compound on the second column and the RPDbetween the associated MS and MSD exceeded criteria.
Applied to one trifluralin result in the Year 3 data set.
NLBL Exclude The labeled analog was not recovered from the sample,suggesting severe matrix interferences. Because it isimpossible to determine if the analyte is present or notpresent, the reported target analyte result was excludedfrom the database.
Applied to a few (0.08%) semivolatile organic results inthe Year 1, Year 2, Year 3, and Year 4 data sets.
NLRO,NNRO
Exclude Neither the target analyte (native compound) nor thelabeled analog were recovered in the OPR sampleassociated with this result.
Applied to three phenol results in the Year 1 data set.
NMSR Exclude No analyte recovery was observed with one or more MSsamples.
Occurred with ten disulfoton results in the Year 4 dataset.
NNRO Exclude The native compound was not recovered in the OPRsample suggesting that the method may not be working forthis analyte.
Applied to 1.06% of the semivolatile organic results inYear 1, Year 2, Year 3, and Year 4 data sets.
NNRO,NVER
Exclude The native compound was not recovered in the OPRsample suggesting that the method may not be working forthis analyte and there was no recovery of the analyte in thecalibration verification sample associated with this result.
Applied to nineteen tetrabromobisphenol A results in theYear 4 data set.
NOPR Exclude There was no recovery of the analyte in the OPR sampleassociated with this result.
Applied to eighteen endosulfan sulfate results in the Year2 data set.
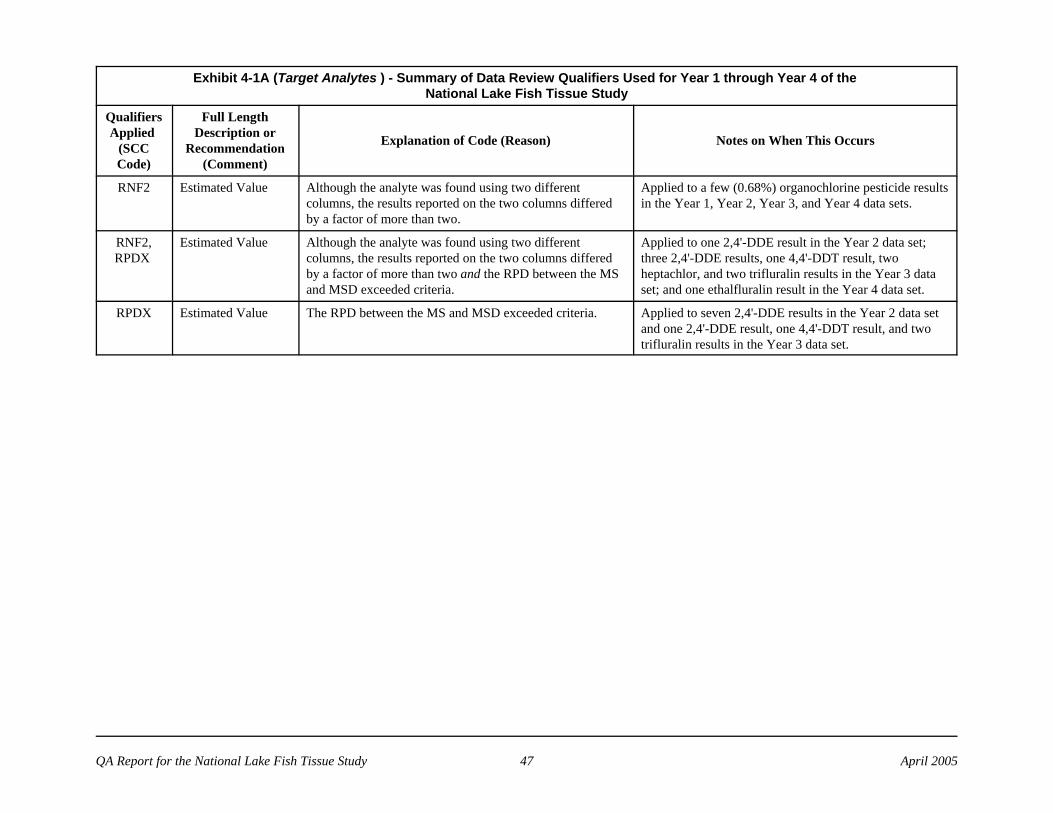
Exhibit 4-1A (Target Analytes ) - Summary of Data Review Qualifiers Used for Year 1 through Year 4 of the National Lake Fish Tissue Study
QualifiersApplied
(SCCCode)
Full LengthDescription or
Recommendation(Comment)
Explanation of Code (Reason) Notes on When This Occurs
QA Report for the National Lake Fish Tissue Study 47 April 2005
RNF2 Estimated Value Although the analyte was found using two differentcolumns, the results reported on the two columns differedby a factor of more than two.
Applied to a few (0.68%) organochlorine pesticide resultsin the Year 1, Year 2, Year 3, and Year 4 data sets.
RNF2,RPDX
Estimated Value Although the analyte was found using two differentcolumns, the results reported on the two columns differedby a factor of more than two and the RPD between the MSand MSD exceeded criteria.
Applied to one 2,4'-DDE result in the Year 2 data set;three 2,4'-DDE results, one 4,4'-DDT result, twoheptachlor, and two trifluralin results in the Year 3 dataset; and one ethalfluralin result in the Year 4 data set.
RPDX Estimated Value The RPD between the MS and MSD exceeded criteria. Applied to seven 2,4'-DDE results in the Year 2 data setand one 2,4'-DDE result, one 4,4'-DDT result, and twotrifluralin results in the Year 3 data set.
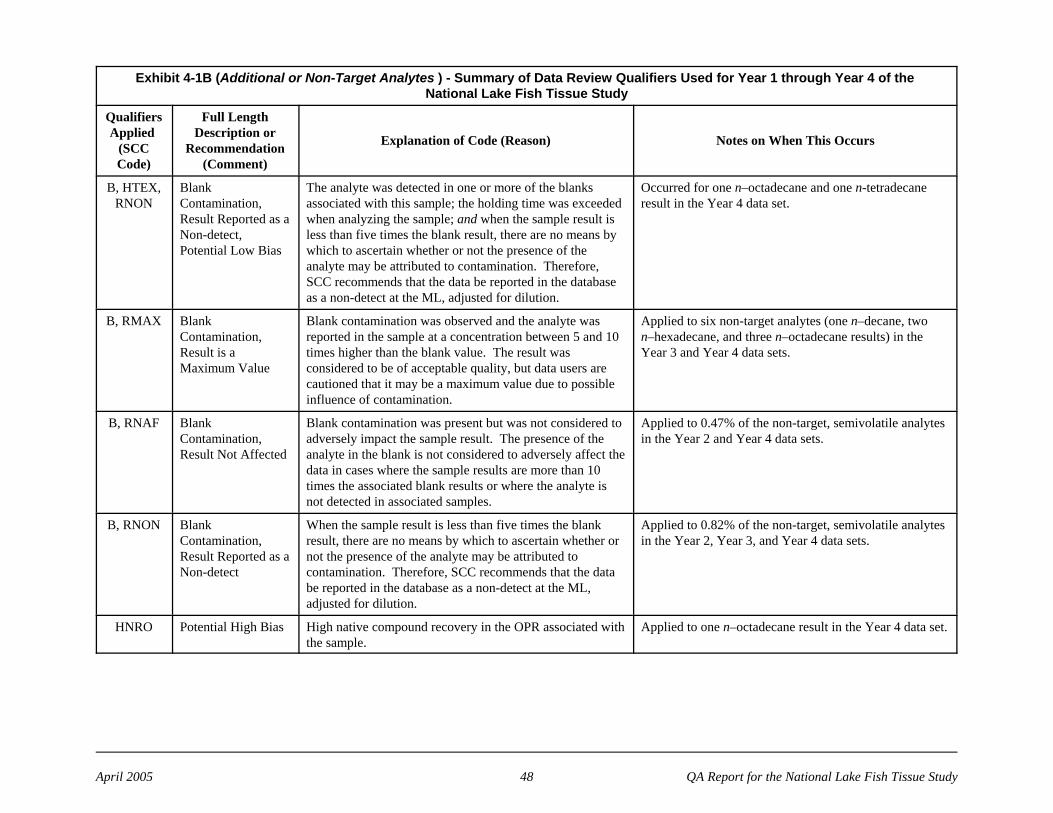
April 2005 48 QA Report for the National Lake Fish Tissue Study
Exhibit 4-1B (Additional or Non-Target Analytes ) - Summary of Data Review Qualifiers Used for Year 1 through Year 4 of the National Lake Fish Tissue Study
QualifiersApplied
(SCCCode)
Full LengthDescription or
Recommendation(Comment)
Explanation of Code (Reason) Notes on When This Occurs
B, HTEX,RNON
BlankContamination,Result Reported as aNon-detect,Potential Low Bias
The analyte was detected in one or more of the blanksassociated with this sample; the holding time was exceededwhen analyzing the sample; and when the sample result isless than five times the blank result, there are no means bywhich to ascertain whether or not the presence of theanalyte may be attributed to contamination. Therefore,SCC recommends that the data be reported in the databaseas a non-detect at the ML, adjusted for dilution.
Occurred for one n–octadecane and one n-tetradecaneresult in the Year 4 data set.
B, RMAX BlankContamination,Result is aMaximum Value
Blank contamination was observed and the analyte wasreported in the sample at a concentration between 5 and 10times higher than the blank value. The result wasconsidered to be of acceptable quality, but data users arecautioned that it may be a maximum value due to possibleinfluence of contamination.
Applied to six non-target analytes (one n–decane, twon–hexadecane, and three n–octadecane results) in theYear 3 and Year 4 data sets.
B, RNAF BlankContamination,Result Not Affected
Blank contamination was present but was not considered toadversely impact the sample result. The presence of theanalyte in the blank is not considered to adversely affect thedata in cases where the sample results are more than 10times the associated blank results or where the analyte isnot detected in associated samples.
Applied to 0.47% of the non-target, semivolatile analytesin the Year 2 and Year 4 data sets.
B, RNON BlankContamination,Result Reported as aNon-detect
When the sample result is less than five times the blankresult, there are no means by which to ascertain whether ornot the presence of the analyte may be attributed tocontamination. Therefore, SCC recommends that the databe reported in the database as a non-detect at the ML,adjusted for dilution.
Applied to 0.82% of the non-target, semivolatile analytesin the Year 2, Year 3, and Year 4 data sets.
HNRO Potential High Bias High native compound recovery in the OPR associated withthe sample.
Applied to one n–octadecane result in the Year 4 data set.
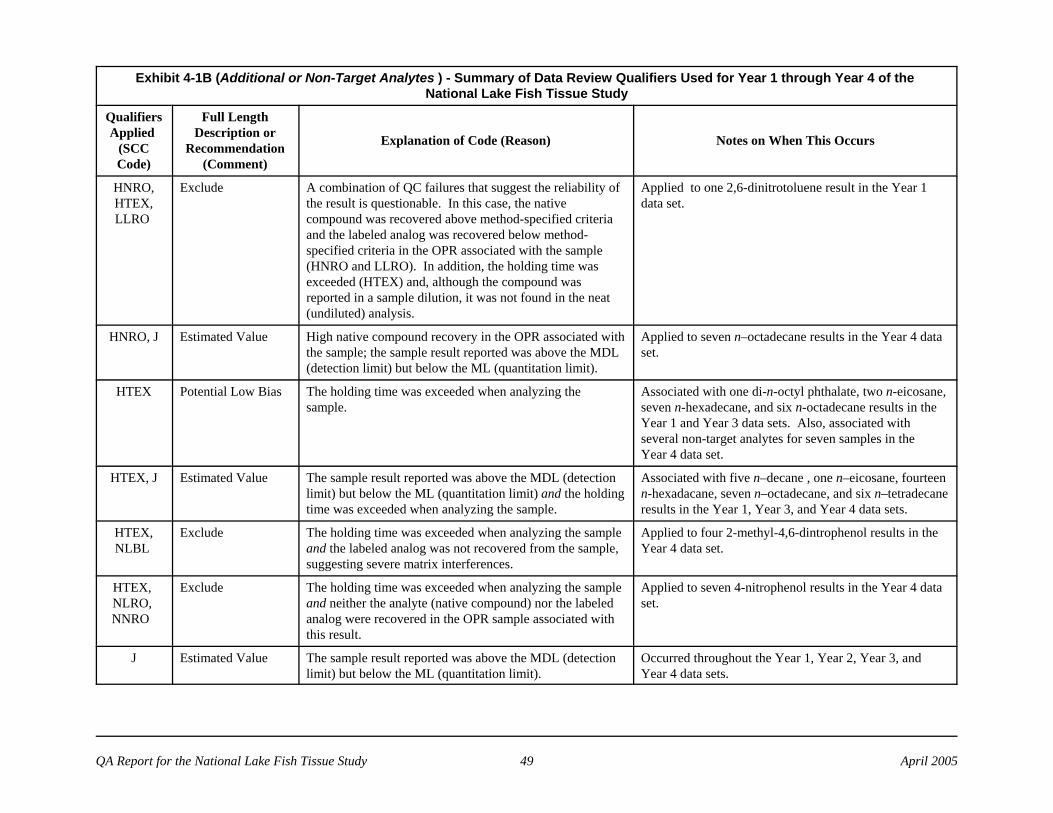
Exhibit 4-1B (Additional or Non-Target Analytes ) - Summary of Data Review Qualifiers Used for Year 1 through Year 4 of the National Lake Fish Tissue Study
QualifiersApplied
(SCCCode)
Full LengthDescription or
Recommendation(Comment)
Explanation of Code (Reason) Notes on When This Occurs
QA Report for the National Lake Fish Tissue Study 49 April 2005
HNRO,HTEX,LLRO
Exclude A combination of QC failures that suggest the reliability ofthe result is questionable. In this case, the nativecompound was recovered above method-specified criteriaand the labeled analog was recovered below method-specified criteria in the OPR associated with the sample(HNRO and LLRO). In addition, the holding time wasexceeded (HTEX) and, although the compound wasreported in a sample dilution, it was not found in the neat(undiluted) analysis.
Applied to one 2,6-dinitrotoluene result in the Year 1data set.
HNRO, J Estimated Value High native compound recovery in the OPR associated withthe sample; the sample result reported was above the MDL(detection limit) but below the ML (quantitation limit).
Applied to seven n–octadecane results in the Year 4 dataset.
HTEX Potential Low Bias The holding time was exceeded when analyzing thesample.
Associated with one di-n-octyl phthalate, two n-eicosane,seven n-hexadecane, and six n-octadecane results in theYear 1 and Year 3 data sets. Also, associated withseveral non-target analytes for seven samples in the Year 4 data set.
HTEX, J Estimated Value The sample result reported was above the MDL (detectionlimit) but below the ML (quantitation limit) and the holdingtime was exceeded when analyzing the sample.
Associated with five n–decane , one n–eicosane, fourteenn-hexadacane, seven n–octadecane, and six n–tetradecaneresults in the Year 1, Year 3, and Year 4 data sets.
HTEX,NLBL
Exclude The holding time was exceeded when analyzing the sampleand the labeled analog was not recovered from the sample,suggesting severe matrix interferences.
Applied to four 2-methyl-4,6-dintrophenol results in theYear 4 data set.
HTEX, NLRO, NNRO
Exclude The holding time was exceeded when analyzing the sampleand neither the analyte (native compound) nor the labeledanalog were recovered in the OPR sample associated withthis result.
Applied to seven 4-nitrophenol results in the Year 4 dataset.
J Estimated Value The sample result reported was above the MDL (detectionlimit) but below the ML (quantitation limit).
Occurred throughout the Year 1, Year 2, Year 3, andYear 4 data sets.
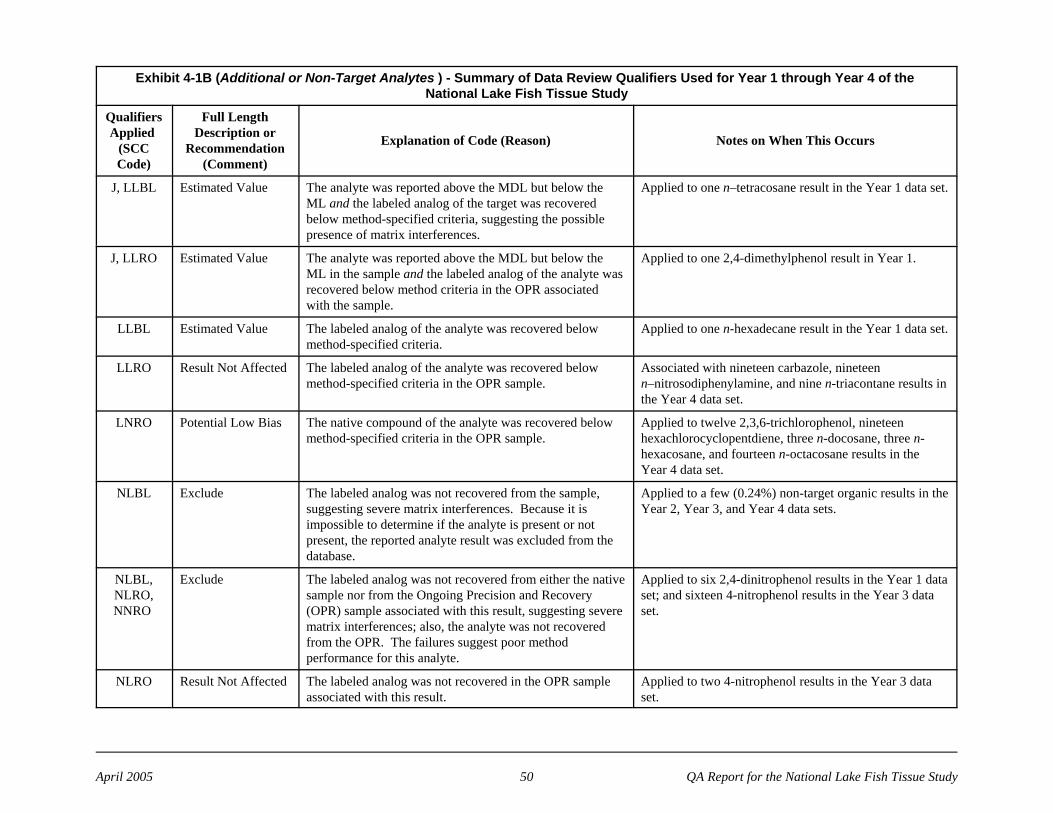
Exhibit 4-1B (Additional or Non-Target Analytes ) - Summary of Data Review Qualifiers Used for Year 1 through Year 4 of the National Lake Fish Tissue Study
QualifiersApplied
(SCCCode)
Full LengthDescription or
Recommendation(Comment)
Explanation of Code (Reason) Notes on When This Occurs
April 2005 50 QA Report for the National Lake Fish Tissue Study
J, LLBL Estimated Value The analyte was reported above the MDL but below theML and the labeled analog of the target was recoveredbelow method-specified criteria, suggesting the possiblepresence of matrix interferences.
Applied to one n–tetracosane result in the Year 1 data set.
J, LLRO Estimated Value The analyte was reported above the MDL but below theML in the sample and the labeled analog of the analyte wasrecovered below method criteria in the OPR associatedwith the sample.
Applied to one 2,4-dimethylphenol result in Year 1.
LLBL Estimated Value The labeled analog of the analyte was recovered belowmethod-specified criteria.
Applied to one n-hexadecane result in the Year 1 data set.
LLRO Result Not Affected The labeled analog of the analyte was recovered belowmethod-specified criteria in the OPR sample.
Associated with nineteen carbazole, nineteenn–nitrosodiphenylamine, and nine n-triacontane results inthe Year 4 data set.
LNRO Potential Low Bias The native compound of the analyte was recovered belowmethod-specified criteria in the OPR sample.
Applied to twelve 2,3,6-trichlorophenol, nineteenhexachlorocyclopentdiene, three n-docosane, three n-hexacosane, and fourteen n-octacosane results in theYear 4 data set.
NLBL Exclude The labeled analog was not recovered from the sample,suggesting severe matrix interferences. Because it isimpossible to determine if the analyte is present or notpresent, the reported analyte result was excluded from thedatabase.
Applied to a few (0.24%) non-target organic results in theYear 2, Year 3, and Year 4 data sets.
NLBL,NLRO,NNRO
Exclude The labeled analog was not recovered from either the nativesample nor from the Ongoing Precision and Recovery(OPR) sample associated with this result, suggesting severematrix interferences; also, the analyte was not recoveredfrom the OPR. The failures suggest poor methodperformance for this analyte.
Applied to six 2,4-dinitrophenol results in the Year 1 dataset; and sixteen 4-nitrophenol results in the Year 3 dataset.
NLRO Result Not Affected The labeled analog was not recovered in the OPR sampleassociated with this result.
Applied to two 4-nitrophenol results in the Year 3 dataset.
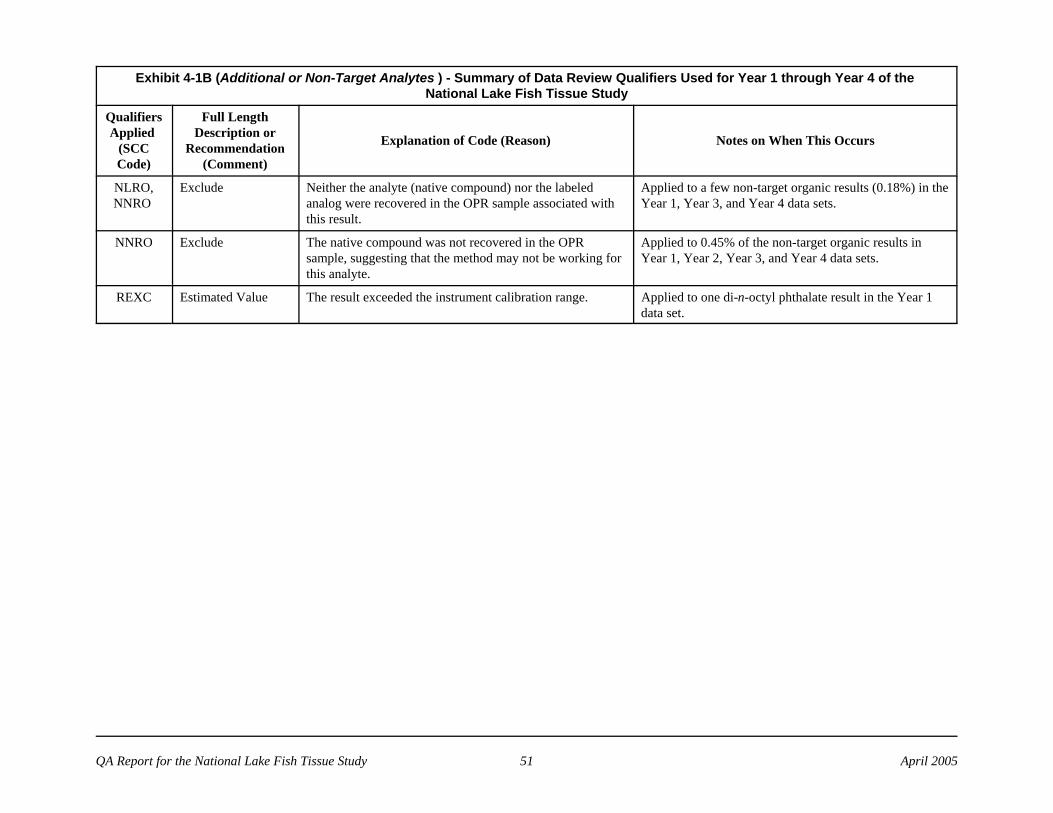
Exhibit 4-1B (Additional or Non-Target Analytes ) - Summary of Data Review Qualifiers Used for Year 1 through Year 4 of the National Lake Fish Tissue Study
QualifiersApplied
(SCCCode)
Full LengthDescription or
Recommendation(Comment)
Explanation of Code (Reason) Notes on When This Occurs
QA Report for the National Lake Fish Tissue Study 51 April 2005
NLRO,NNRO
Exclude Neither the analyte (native compound) nor the labeledanalog were recovered in the OPR sample associated withthis result.
Applied to a few non-target organic results (0.18%) in theYear 1, Year 3, and Year 4 data sets.
NNRO Exclude The native compound was not recovered in the OPRsample, suggesting that the method may not be working forthis analyte.
Applied to 0.45% of the non-target organic results inYear 1, Year 2, Year 3, and Year 4 data sets.
REXC Estimated Value The result exceeded the instrument calibration range. Applied to one di-n-octyl phthalate result in the Year 1data set.