Embed Size (px)
Citation preview
Quality Assurance Project Plan Chemical Sampling at Area IV, Santa Susana Field Laboratory
Ventura County, California
Prepared for:
Department of Energy Energy Technology and Engineering Center P.O. Box 10300 Canoga Park, California 91309
Prepared by:
CDM Federal Programs Corporation 555 17th Street, Suite 1200 Denver, Colorado 80202
Prepared under:
U.S. Department of Energy EM Consolidated Business Center Contract DE‐AM09‐05SR22404 CDM Smith Task Order DE‐AT30‐08CC60021/ET17
March 2012
Quality Assurance Project Plan Chemical Sampling at Area IV Santa Susana Field Laboratory Ventura County, California
Contract DEAM0905SR22404 CDM Smith Task Order DEAT3008CC60021/ET17 I certify that this document and all attachments were prepared under my direction or supervision in accordance with a system designed to assure that qualified personnel properly gather and evaluate the information submitted. Based on my inquiry of the person or persons who manage the system, or those persons directly responsible for gathering the information, the information
submitted is, to the best of my knowledge and belief, true, accurate, and complete. Approved by: _________________________________________ _____________________ John Wondolleck Date CDM Smith Project Manager Concurrence by: _________________________________________ _____________________ Jo Nell Mullins Date CDM Smith Quality Assurance Manager
i Chemical Data Gap Investigation QAPP
Table of Contents
Section 1 Project Description 1.1 Background............................................................................................................................................................1‐1 1.2 Purpose of the Quality Assurance Project Plan......................................................................................1‐2 1.3 Site Location and Description........................................................................................................................1‐2 1.4 Technical or Regulatory Standards .............................................................................................................1‐3 1.5 Project Objectives................................................................................................................................................1‐3
Section 2 Project Organization 2.1 Quality Assurance Responsibilities .............................................................................................................2‐1
2.1.1 Project Director ..................................................................................................................................2‐1 2.1.2 Project Manager .................................................................................................................................2‐1 2.1.3 Field Team Leader.............................................................................................................................2‐1 2.1.4 Site Safety and Health Officer.......................................................................................................2‐1 2.1.5 Quality Assurance Manager ..........................................................................................................2‐2 2.1.6 Quality Assurance Coordinator ...................................................................................................2‐2 2.1.7 Laboratory Coordinator..................................................................................................................2‐2 2.1.8 Data Validation Coordinator.........................................................................................................2‐2
2.2 Field Quality Assurance Responsibilities..................................................................................................2‐2 2.3 Driller Sub‐Contractor Quality Assurance................................................................................................2‐3 2.4 Laboratory Quality Assurance.......................................................................................................................2‐3
2.4.1 Laboratory Project Manager.........................................................................................................2‐3 2.4.2 Laboratory Quality Assurance Officer ......................................................................................2‐3 2.4.3 Sample Custodian ..............................................................................................................................2‐4
2.5 Data Validation Quality Assurance ..............................................................................................................2‐4 2.6 Field Measurements Quality Assurance....................................................................................................2‐4
Section 3 Quality Assurance Objectives for Measurement 3.1 Precision..................................................................................................................................................................3‐1 3.2 Accuracy ..................................................................................................................................................................3‐2 3.3 Representativeness ............................................................................................................................................3‐2 3.4 Completeness ........................................................................................................................................................3‐3 3.5 Comparability .......................................................................................................................................................3‐3 3.6 Sensitivity ...............................................................................................................................................................3‐3
Section 4 Data Quality Objectives 4.1 Field Measurements...........................................................................................................................................4‐1 4.2 Laboratory Analyses ..........................................................................................................................................4‐1
Section 5 Sampling Procedures
Section 6 Sample Custody
Section 7 Schedule 7.1 Schedule Reporting and Updates .................................................................................................................7‐1
Contents
ii Chemical Data Gap Investigation QAPP
Section 8 Analytical Procedures and Quality Control 8.1 Analytical Methods and Method Reporting Limits .............................................................................. 8‐1 8.2 Site‐Specific Analytical Method Modifications....................................................................................... 8‐9 8.3 Quality Control ..................................................................................................................................................... 8‐9
8.3.1 Field Instrument Calibration Procedures and Frequency .............................................. 8‐9 8.3.2 Quality Control for Field Measurements...............................................................................8‐10 8.3.3 Field Quality Control Samples and Frequencies................................................................8‐10
8.3.3.1 Field Duplicate............................................................................................................8‐10 8.3.3.2 Equipment Rinsate Blank......................................................................................8‐10 8.3.3.3 Trip Blank.....................................................................................................................8‐10 8.3.3.4 Source Blank................................................................................................................8‐20 8.3.3.5 Temperature Blank ..................................................................................................8‐20
8.3.4 Laboratory Quality Control Samples and Frequencies...................................................8‐20
Section 9 Data Reduction, Validation, and Reporting 9.1 Laboratory Data Reports ................................................................................................................................. 9‐1 9.2 Data Management............................................................................................................................................... 9‐1 9.3 Data Validation..................................................................................................................................................... 9‐2 9.4 Data Reports.......................................................................................................................................................... 9‐3
Section 10 Internal Quality Control 10.1 Document and Records Control .................................................................................................................10‐1 10.2 Technical Document Review........................................................................................................................10‐2 10.3 QA Review ............................................................................................................................................................10‐2 10.4 Data Quality Control ........................................................................................................................................10‐2
Section 11 Performance and Systems Audits 11.1 Field Audits..........................................................................................................................................................11‐1 11.2 Office Audit ..........................................................................................................................................................11‐1 11.3 Laboratory Assessments................................................................................................................................11‐1
Section 12 Preventive Maintenance
Section 13 Data Assessment Procedures 13.1 Field Record Verification...............................................................................................................................13‐1 13.2 Laboratory Data Validation ..........................................................................................................................13‐1 13.3 Data Usability Assessment............................................................................................................................13‐1
Section 14 Corrective Actions
Section 15 Quality Assurance Reports
Section 16 References
Contents
iii Chemical Data Gap Investigation QAPP
Tables 8‐1 Interim Screening Levels, Analytical Method Reporting Limits ............................ 8‐1 8‐2 Analytical, Sample Preparation and Cleanup Methods............................................... 8‐8 8‐3 Quality Control Objectives for Analytical Methods....................................................8‐11 13‐1 Verification Process................................................................................................................13‐2
Figures
1‐1 SSFL Location 1‐2 Santa Susana Field Laboratory Layout 1‐3 Subarea Designation, Santa Susana Field Laboratory 2‐1 Organizational Chart 14‐1 Corrective Action Request Form
Attachments
A‐ CDM SSFL Quality Implementation Plan
B‐ Technical Quality Assurance Review Process Steps for Santa Susana Field Laboratory (SSFL) EQuIS
Database
Contents
iv Chemical Data Gap Investigation QAPP
Acronyms and Abbreviations
ADR Automated Data Review AOC Administrative Order on Consent ASTM American Standards for Testing and Measurement BFB Bromofluorobenzene BS/LCS blank spike/laboratory control sample Boeing The Boeing Company CAR corrective action request CDM Smith CDM Federal Programs Corporation CoC chain‐of‐custody D&D decontamination and decommissioning DL detection limit DOE Department of Energy DQO data quality objective DRO diesel range organics DTSC Department of Toxic Substances Control DUAR data usability assessment report EDD electronic data deliverable EFH extractable fuel hydrocarbon EPA United States Environmental Protection Agency ETEC Energy Technology Engineering Center FSP Field Sampling Plan FTL field team leader GRO gasoline range organics HASPs health and safety plans ISL interim screening level kg kilogram L liter LCS laboratory control sample LCSD laboratory control sample duplicate LLI Lancaster Laboratories, Inc. Master FSP Master Field Sampling Plan MDL method detection limit mg/kg milligrams per kilogram mg/L milligrams per liter mL milliliter MRL method reporting limit MS matrix spike MSD matrix spike duplicate NASA National Aeronautics and Space Administration NBZ Northern Buffer Zone ng nanogram ng/kg nanograms per kilogram ng/L nanograms per liter NOAA National Oceanic and Atmospheric Association PAH polycyclic aromatic hydrocarbon PARCCS precision, accuracy, representativeness, completeness, comparability, and
sensitivity
Contents
v Chemical Data Gap Investigation QAPP
PCB polychlorinated biphenyl PCT polychlorinated triphenyl PD project director PE performance evaluation pg/L picogram per liter PID photoionization detector PM project manager QA quality assurance QAO QA Officer QAPP quality assurance project plan QA/QC quality assurance quality control QC quality control QIP Quality Implementation Plan QP Quality Procedure %R percent recovery RCRA Resource Conservation and Recovery Act RFI RCRA Facility Investigation RPD relative percent difference SIM selective ion monitoring SOP standard operating procedure SSFL Santa Susana Field Laboratory SSHO Site Safety Health Officer SVOC semi‐volatile organic compound TIC tentatively identified compound TPH total petroleum hydrocarbon µg/L microgram per liter VOC volatile organic compound WP/FSAP Work Plan/Field Sampling and Analysis Plan WSHP Worker Safety and Health Program
1‐1 Chemical Data Gap Investigation QAPP
Section 1 Project Description
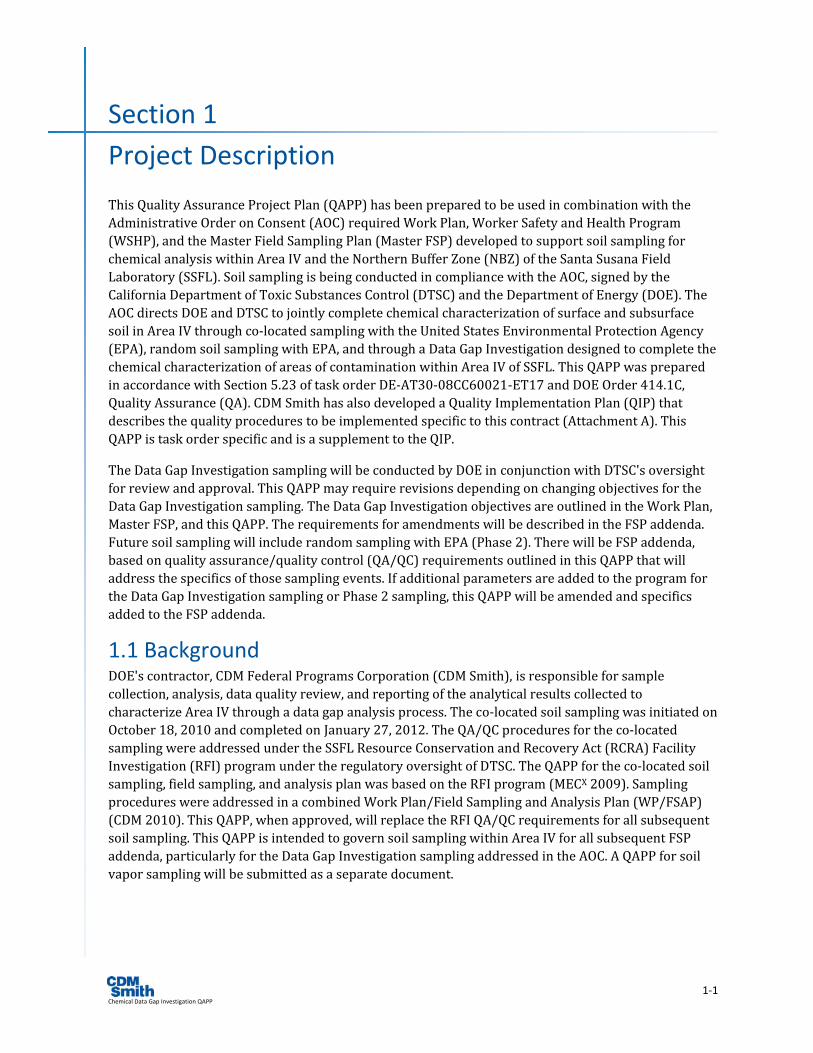
This Quality Assurance Project Plan (QAPP) has been prepared to be used in combination with the Administrative Order on Consent (AOC) required Work Plan, Worker Safety and Health Program (WSHP), and the Master Field Sampling Plan (Master FSP) developed to support soil sampling for chemical analysis within Area IV and the Northern Buffer Zone (NBZ) of the Santa Susana Field Laboratory (SSFL). Soil sampling is being conducted in compliance with the AOC, signed by the California Department of Toxic Substances Control (DTSC) and the Department of Energy (DOE). The AOC directs DOE and DTSC to jointly complete chemical characterization of surface and subsurface soil in Area IV through co‐located sampling with the United States Environmental Protection Agency (EPA), random soil sampling with EPA, and through a Data Gap Investigation designed to complete the chemical characterization of areas of contamination within Area IV of SSFL. This QAPP was prepared in accordance with Section 5.23 of task order DE‐AT30‐08CC60021‐ET17 and DOE Order 414.1C, Quality Assurance (QA). CDM Smith has also developed a Quality Implementation Plan (QIP) that describes the quality procedures to be implemented specific to this contract (Attachment A). This QAPP is task order specific and is a supplement to the QIP.
The Data Gap Investigation sampling will be conducted by DOE in conjunction with DTSC's oversight for review and approval. This QAPP may require revisions depending on changing objectives for the Data Gap Investigation sampling. The Data Gap Investigation objectives are outlined in the Work Plan, Master FSP, and this QAPP. The requirements for amendments will be described in the FSP addenda. Future soil sampling will include random sampling with EPA (Phase 2). There will be FSP addenda, based on quality assurance/quality control (QA/QC) requirements outlined in this QAPP that will address the specifics of those sampling events. If additional parameters are added to the program for the Data Gap Investigation sampling or Phase 2 sampling, this QAPP will be amended and specifics added to the FSP addenda.
1.1 Background DOE's contractor, CDM Federal Programs Corporation (CDM Smith), is responsible for sample collection, analysis, data quality review, and reporting of the analytical results collected to characterize Area IV through a data gap analysis process. The co‐located soil sampling was initiated on October 18, 2010 and completed on January 27, 2012. The QA/QC procedures for the co‐located sampling were addressed under the SSFL Resource Conservation and Recovery Act (RCRA) Facility Investigation (RFI) program under the regulatory oversight of DTSC. The QAPP for the co‐located soil sampling, field sampling, and analysis plan was based on the RFI program (MECX 2009). Sampling procedures were addressed in a combined Work Plan/Field Sampling and Analysis Plan (WP/FSAP) (CDM 2010). This QAPP, when approved, will replace the RFI QA/QC requirements for all subsequent soil sampling. This QAPP is intended to govern soil sampling within Area IV for all subsequent FSP addenda, particularly for the Data Gap Investigation sampling addressed in the AOC. A QAPP for soil vapor sampling will be submitted as a separate document.
Section 1 • Introduction
1‐2 Chemical Data Gap Investigation QAPP
1.2 Purpose of the Quality Assurance Project Plan The soil samples collected for chemical analysis will be used to more accurately define the nature and extent of soil contaminated by organic and inorganic chemicals (i.e., non‐radiological elements) within Area IV of the SSFL and the NBZ, collectively termed the Area IV study area This QAPP provides QA/QC guidance for all procedures and methods, and all associated analytes related to the collection of soil samples for chemical characterization. This QAPP has been prepared to prescribe sampling rationale, sample custody, analytical procedures, data reduction, validation, and reporting, as well as personnel requirements to ensure that the data are of sufficient quality and quantity to support cleanup decisions.
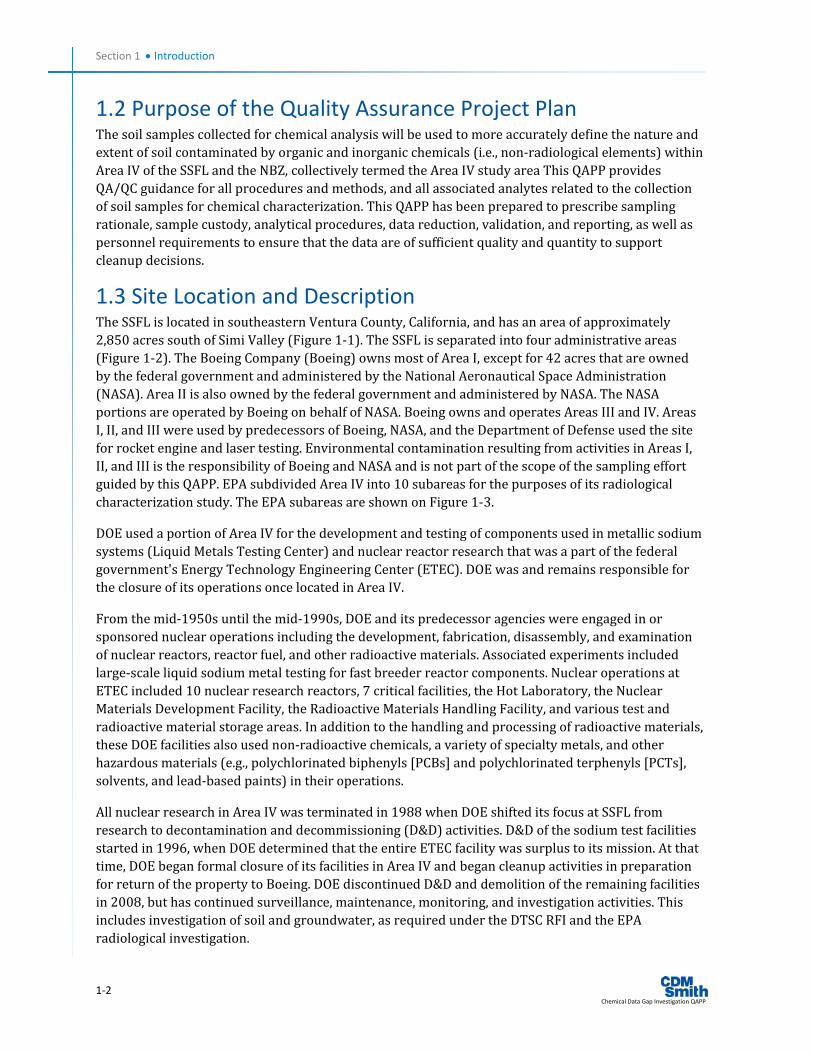
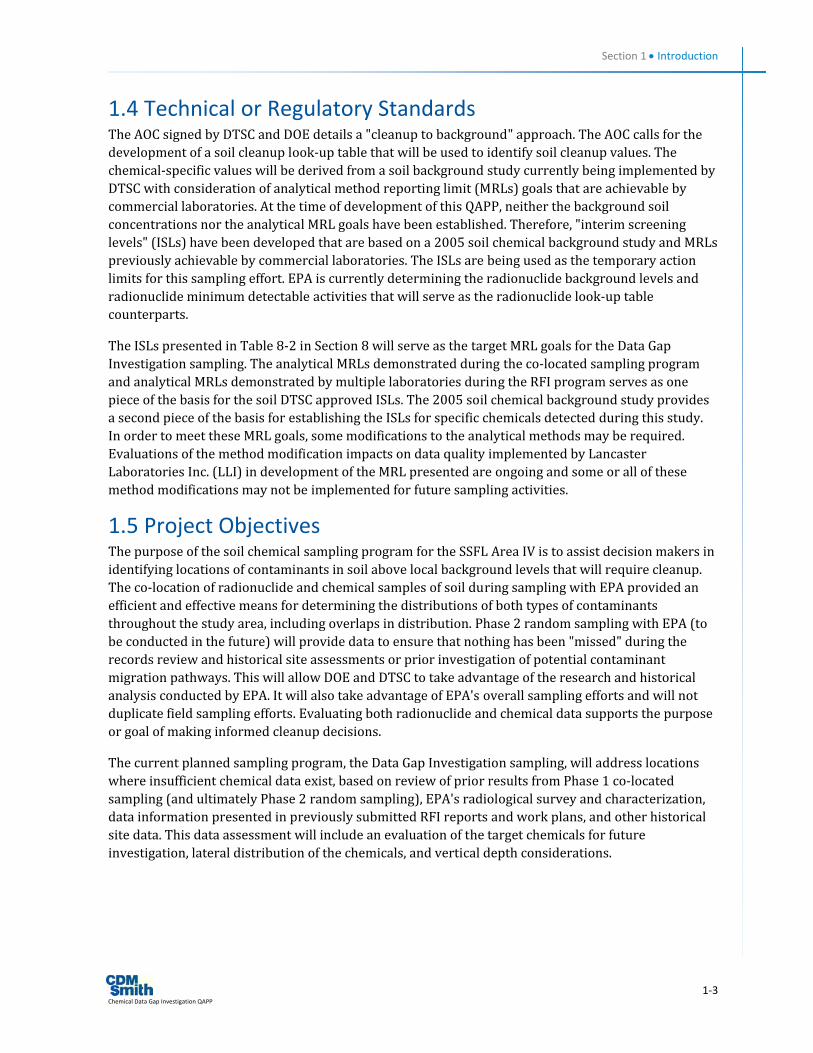
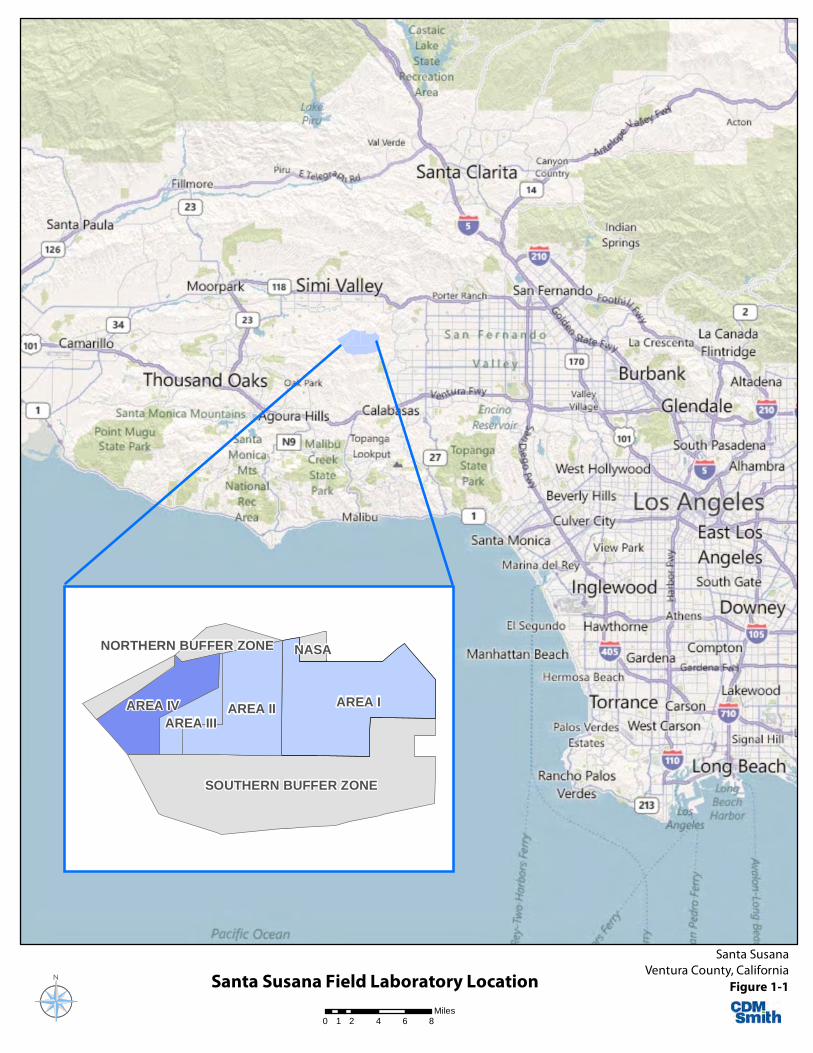
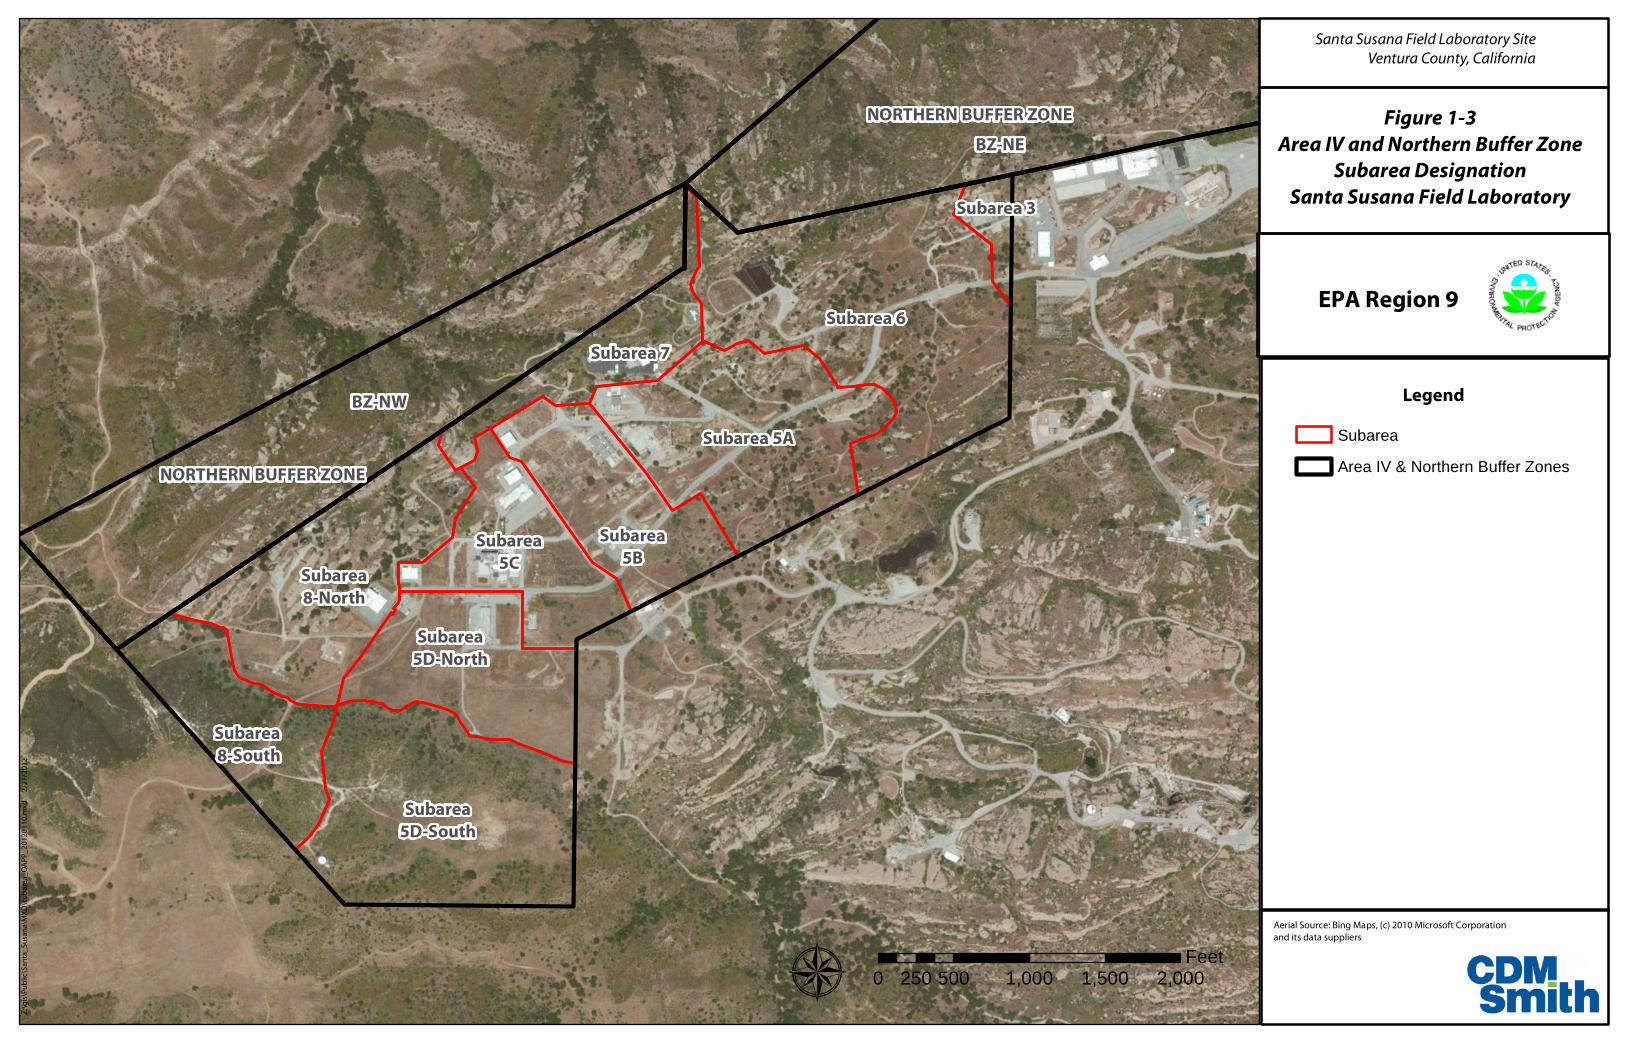
1.3 Site Location and Description The SSFL is located in southeastern Ventura County, California, and has an area of approximately 2,850 acres south of Simi Valley (Figure 1‐1). The SSFL is separated into four administrative areas (Figure 1‐2). The Boeing Company (Boeing) owns most of Area I, except for 42 acres that are owned by the federal government and administered by the National Aeronautical Space Administration (NASA). Area II is also owned by the federal government and administered by NASA. The NASA portions are operated by Boeing on behalf of NASA. Boeing owns and operates Areas III and IV. Areas I, II, and III were used by predecessors of Boeing, NASA, and the Department of Defense used the site for rocket engine and laser testing. Environmental contamination resulting from activities in Areas I, II, and III is the responsibility of Boeing and NASA and is not part of the scope of the sampling effort guided by this QAPP. EPA subdivided Area IV into 10 subareas for the purposes of its radiological characterization study. The EPA subareas are shown on Figure 1‐3.
DOE used a portion of Area IV for the development and testing of components used in metallic sodium systems (Liquid Metals Testing Center) and nuclear reactor research that was a part of the federal government's Energy Technology Engineering Center (ETEC). DOE was and remains responsible for the closure of its operations once located in Area IV.
From the mid‐1950s until the mid‐1990s, DOE and its predecessor agencies were engaged in or sponsored nuclear operations including the development, fabrication, disassembly, and examination of nuclear reactors, reactor fuel, and other radioactive materials. Associated experiments included large‐scale liquid sodium metal testing for fast breeder reactor components. Nuclear operations at ETEC included 10 nuclear research reactors, 7 critical facilities, the Hot Laboratory, the Nuclear Materials Development Facility, the Radioactive Materials Handling Facility, and various test and radioactive material storage areas. In addition to the handling and processing of radioactive materials, these DOE facilities also used non‐radioactive chemicals, a variety of specialty metals, and other hazardous materials (e.g., polychlorinated biphenyls [PCBs] and polychlorinated terphenyls [PCTs], solvents, and lead‐based paints) in their operations.
All nuclear research in Area IV was terminated in 1988 when DOE shifted its focus at SSFL from research to decontamination and decommissioning (D&D) activities. D&D of the sodium test facilities started in 1996, when DOE determined that the entire ETEC facility was surplus to its mission. At that time, DOE began formal closure of its facilities in Area IV and began cleanup activities in preparation for return of the property to Boeing. DOE discontinued D&D and demolition of the remaining facilities in 2008, but has continued surveillance, maintenance, monitoring, and investigation activities. This includes investigation of soil and groundwater, as required under the DTSC RFI and the EPA radiological investigation.
Section 1 • Introduction
1‐3 Chemical Data Gap Investigation QAPP
1.4 Technical or Regulatory Standards The AOC signed by DTSC and DOE details a "cleanup to background" approach. The AOC calls for the development of a soil cleanup look‐up table that will be used to identify soil cleanup values. The chemical‐specific values will be derived from a soil background study currently being implemented by DTSC with consideration of analytical method reporting limit (MRLs) goals that are achievable by commercial laboratories. At the time of development of this QAPP, neither the background soil concentrations nor the analytical MRL goals have been established. Therefore, "interim screening levels" (ISLs) have been developed that are based on a 2005 soil chemical background study and MRLs previously achievable by commercial laboratories. The ISLs are being used as the temporary action limits for this sampling effort. EPA is currently determining the radionuclide background levels and radionuclide minimum detectable activities that will serve as the radionuclide look‐up table counterparts.
The ISLs presented in Table 8‐2 in Section 8 will serve as the target MRL goals for the Data Gap Investigation sampling. The analytical MRLs demonstrated during the co‐located sampling program and analytical MRLs demonstrated by multiple laboratories during the RFI program serves as one piece of the basis for the soil DTSC approved ISLs. The 2005 soil chemical background study provides a second piece of the basis for establishing the ISLs for specific chemicals detected during this study. In order to meet these MRL goals, some modifications to the analytical methods may be required. Evaluations of the method modification impacts on data quality implemented by Lancaster Laboratories Inc. (LLI) in development of the MRL presented are ongoing and some or all of these method modifications may not be implemented for future sampling activities.
1.5 Project Objectives The purpose of the soil chemical sampling program for the SSFL Area IV is to assist decision makers in identifying locations of contaminants in soil above local background levels that will require cleanup. The co‐location of radionuclide and chemical samples of soil during sampling with EPA provided an efficient and effective means for determining the distributions of both types of contaminants throughout the study area, including overlaps in distribution. Phase 2 random sampling with EPA (to be conducted in the future) will provide data to ensure that nothing has been "missed" during the records review and historical site assessments or prior investigation of potential contaminant migration pathways. This will allow DOE and DTSC to take advantage of the research and historical analysis conducted by EPA. It will also take advantage of EPA's overall sampling efforts and will not duplicate field sampling efforts. Evaluating both radionuclide and chemical data supports the purpose or goal of making informed cleanup decisions.
The current planned sampling program, the Data Gap Investigation sampling, will address locations where insufficient chemical data exist, based on review of prior results from Phase 1 co‐located sampling (and ultimately Phase 2 random sampling), EPA's radiological survey and characterization, data information presented in previously submitted RFI reports and work plans, and other historical site data. This data assessment will include an evaluation of the target chemicals for future investigation, lateral distribution of the chemicals, and vertical depth considerations.
Santa Susana Field Laboratory Location
Santa SusanaVentura County, California
Figure 1-1
0 2 4 6 81Miles
AREA IAREA II
SOUTHERN BUFFER ZONE
AREA IVAREA III
NASANORTHERN BUFFER ZONE
SOUTHERN BUFFER ZONE
AREA IAREA II
AREA IV
AREA III
NORTHERN BUFFER ZONE
NORTHERN BUFFER ZONE
NASA
Bell 1
A1
North 1
Bell 1.8
Bell 1.1
Bell 1.14.5Happy Valley 4
Bell 1.12
Bell 1.5
Area IV 6
Bell 1.14
North 1.5 - OB
Happy Valley 5
North 1.14
Bell 1.10
Bell 1.7
Bell 1.11
B6A
North
1.8
North 1.12
Happy Valley 7
Bell 1.1.2B19A
Bell 1
.13
Area IV 1 Be
ll 1.4
North 1.14.3
Bell 2
North
1.9
Bell 1.1.3
Bell 1.6
North 1.15 - OB
Area IV 5
Bell 1.
14.1
Bell 1.14.2
Bell 1.14.5.3
Happy Valley 4 - OB
Bell 1.14.5.4
North
1 - O
B
Area IV 8
Happy Valley 9
Bell 1.14.5.2Happy Valley 5 - OB
Bell 1.1.1
Happy Valley 4.3
Area IV
2
North
1.6 -
OB
Bell 1.14.4
Happy Valley 5.2
Happy Valley 5 .3Bell 1 - CC
Bell - C
C
Bell 1.12.
1
Happy Valley 8
Happy Valley 4.2Bell 1
.10.3
North
1.10
Bell 1
.8.1
Happ
y Vall
ey 1
Bell 1
.5.1
Bell 1.4.2Bell 1 Trib
Area IV 4
Area IV 3
Bell 1.14.6
Bell 1.8.2
Bell 1.2
Area IV 7
North
1.3
Happy V
alley 2
Happy Valley 4.4
Bell 1.4.3
Bell 1.14.5.5
North 1.7
Bell 1.10.5
CP Pond - CC
FSDF
Drain
age
A1.2
Bell 1.10.1
North 1.2 - OB
North
1.13
B009
Drainage
Happy Valley 3
Happy Valley 5.5
North 1.14.1
Happy Valley 5.6
North 1.5.1 - OB
Happy Valley 4.1
Bell 1
.14.5.
6
North
1.11
Drain
age 8
Happy Valley 5.4
Happy Valley 1.2 - OB
B3A
Silvernail 2
North
1.4
Bell 1
.9
Bell 1.14.3
Pond 46
.5
Bell 1.4.1
Bell 1
Bell 1
A1
Area IV 6
Bell 1Bell 1 - CC
North 1.14
Bell - CC
North
1 - OB
Area IV 8
Bell 1
Happy Valley 5
CP Po
nd - C
C
Bell 1
North 1
Bell 1.1.2
Bell 1.1
Loveca Z:\gis\Public\Santa_Susana\MXD\SSFL_Layout.mxd 3/25/2012
LegendStreams
Unlined ChannelLined ChannelDrainageDivide
RoadsDirt RoadPaved Road
Site AreaChemical Use AreaBuilding - Existing as of May 2011Removed Building
Santa SusanaVentura County, California
Figure 1-20 1,200 2,400600
FeetSanta Susana Field Laboratory Layout
Note: GIS Layers provided by Boeing.
NORTHERN BUFFER ZONE
NORTHERN BUFFER ZONE
Subarea8-North
Subarea5D-South
Subarea 5A
Subarea 6
Subarea 3
Subarea5C
Subarea5B
Subarea 7
Subarea 8-South
Subarea5D-North
BZ-NW
BZ-NE
Z:\
gis
\Pu
blic
\San
ta_
Susa
na\
MX
D\s
ub
are
a_Q
AP
P_
20
120
11
0.m
xd
2/2
1/2
012
Legend
SubareaArea IV & Northern Buffer Zones
Santa Susana Field Laboratory SiteVentura County, California
Figure 1-3
Area IV and Northern Buffer ZoneSubarea Designation
Santa Susana Field Laboratory
Aerial Source: Bing Maps, (c) 2010 Microsoft Corporation and its data suppliers
EPA Region 9
¾ 0 500 1,000 1,500 2,000250Feet
2‐1 Chemical Data Gap Investigation QAPP
Section 2 Project Organization
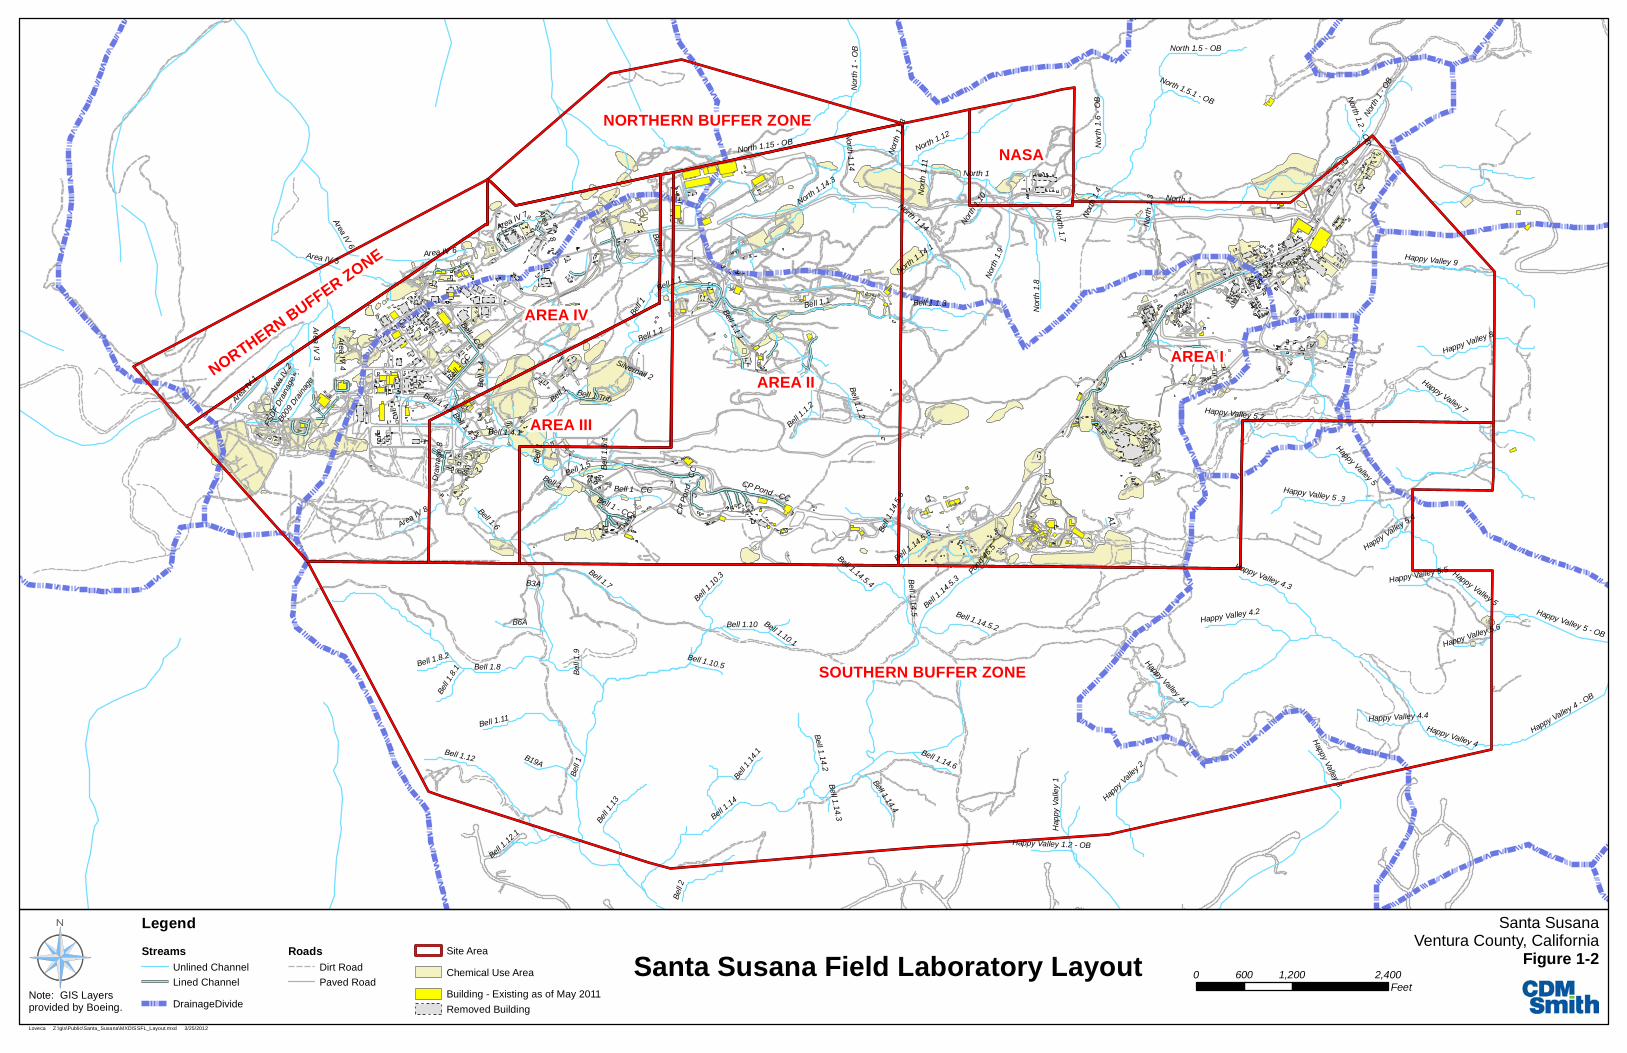
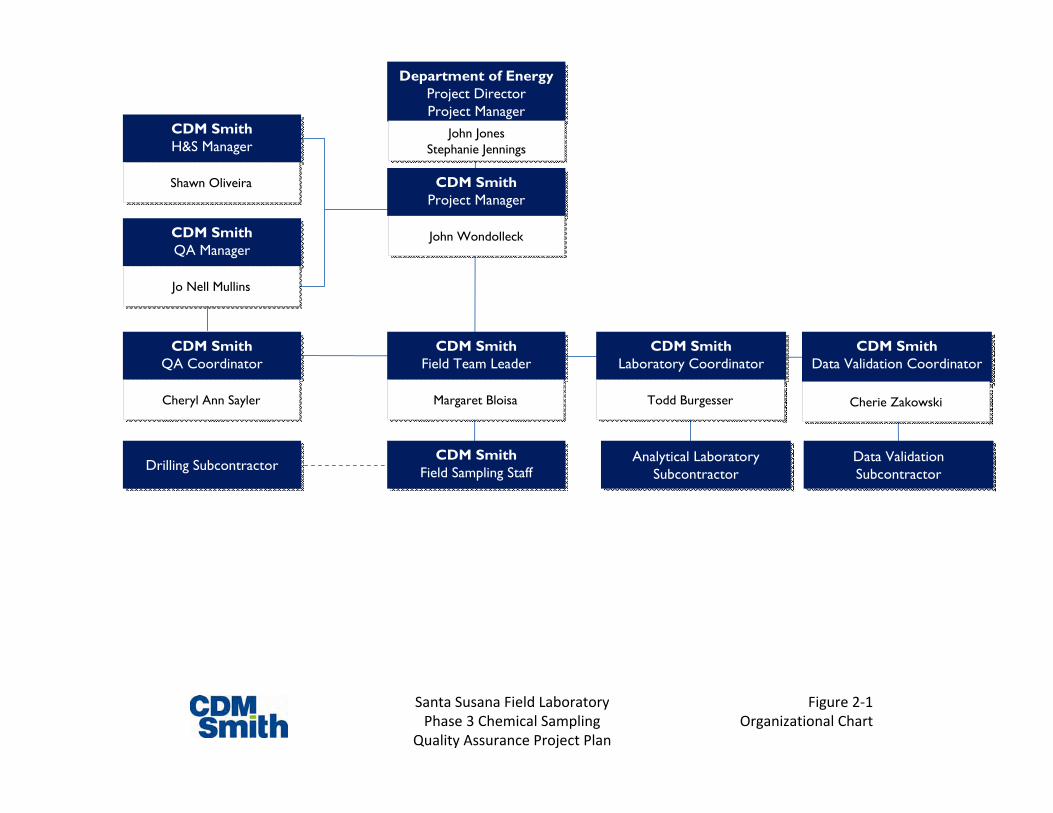
2.1 Quality Assurance Responsibilities The CDM Smith project team consists of a Project Manager (PM), Field Team Leader (FTL), QA Manager, QA Coordinator, Site Safety and Health Officer, Laboratory Coordinator, Data Validation Coordinator and data validation staff, and various task leaders and field personnel. CDM Smith’s PM works in conjunction with the DOE Project Director (PD) in order to ensure project execution and quality. Their relationships are illustrated in Figure 2‐1.
Personnel responsibilities specifically related to QA activities are as follows:
2.1.1 Project Director The PD role is performed by DOE. The PD will be responsible for administration of the actions required by the AOC. The PD is responsible for project implementation and has the authority to commit the resources necessary to meet project objectives and requirements. The PD's primary function is to ensure that technical, financial, and scheduling objectives are achieved successfully. The PD will provide the major point of contact and control matters concerning the project and will work directly with the CDM Smith PM. The PD will also establish project policy and procedures to address the specific needs of the project as a whole.
2.1.2 Project Manager The PM for both DOE and CDM Smith are responsible for project implementation and has the authority to commit the resources necessary to meet project objectives and requirements. The PM's primary function is to ensure that technical quality, financial, and scheduling objectives are achieved successfully. The PMs will serve as the primary point of contact for all aspects of the project, and will establish project policy and procedures to address specific needs of the project as a whole.
2.1.3 Field Team Leader The FTL will assist the PM in day‐to‐day project management from the field. The FTL will be responsible for coordinating all field activities and aid in the procurement of project subcontractors. Additional responsibilities include monitoring the progress and quality of investigative collection, preparation and reviewing interim monitoring reports, and providing technical support of project activities. The FTL is responsible for communicating the contents of the QAPP to the field staff.
2.1.4 Site Safety and Health Officer The health and safety program is implemented by CDM Smith's Site Safety and Health Officer (SSHO). The SSHO assists project staff and subcontractors to develop and implement site safety programs along with preparation and/or review of site‐specific health and safety plans (HASPs). The SSHO operates under the CDM Smith Health and Safety Manager, who oversees the medical surveillance and health and safety training programs.
Section 2 • Project Organization
2‐2 Chemical Data Gap Investigation QAPP
2.1.5 Quality Assurance Manager The QA program is implemented by CDM Smith's QA manager, who is independent of the technical staff and reports directly to the President of CDM Smith on QA matters. The QA manager has the authority to objectively review projects and identify problems, and the authority to use corporate resources, as necessary, to resolve any project quality‐related problems.
2.1.6 Quality Assurance Coordinator The CDM Smith Contract QA Coordinator for this project reports to CDM Smith's QA manager on QA matters. Under the QA manager's oversight, the Contract QA Coordinator is responsible for the following:
Reviewing and approving project‐specific plans
Maintaining QA oversight of the project in accordance with Contract‐specific QA plans
Reviewing QA sections in project reports applicable to this project
Reviewing QA/QC procedures applicable to this project
Performing self‐assessments, as necessary, for selected activities of this project performed by CDM Smith and subcontractors
Initiating, reviewing, and following‐up on response actions, as necessary
Maintaining awareness of project activities and their QA/QC needs
2.1.7 Laboratory Coordinator The Project Laboratory Coordinator is a chemist responsible for coordination of subcontractor laboratory services, managing samples and chain‐of‐custody (CoC), and communication with the laboratory concerning all QC issues.
2.1.8 Data Validation Coordinator The data validation coordinator is responsible for determining compliance with methods, procedures, and contracts for sampling and analysis as well as comparing analytical and other data with measurement performance criteria and data validation guidance. The data validation coordinator is responsible for coordination of subcontractor validation services and managing communications with the validation contractor. All data validation will be conducted in accordance with Section 9.3 of this QAPP.
2.2 Field Quality Assurance Responsibilities The FTL (a professional geologist registered within the State of California) or designee, under his/her direct oversight, is responsible for ensuring QA/QC activities are implemented in the field in accordance with this QAPP and applicable standard operating procedures (SOPs) provided in Appendix D of the Master FSP. Personnel with appropriate experience will be assigned to each sampling or field investigation team. They will work with the SSHO to conduct all operations in compliance with the WSHP. The FTL will facilitate communication and coordinating efforts between the PM, field team, and subcontractors.
Section 2 • Project Organization
2‐3 Chemical Data Gap Investigation QAPP
The field team personnel involved with sample collection, handling, and shipping, as well as other investigation activities, are responsible for:
Reviewing and becoming familiar with the requirements of the Work Plan, Master FSP, FSP addenda, site‐specific HASP, and this QAPP relevant to the work they will be performing.
Conducting all operations in accordance with relevant, approved SOPs provided in Appendix D, the Master FSP, the Work Plan, FSP addenda (including updates and revisions), site‐specific HASP, and in compliance with the data quality objectives (DQOs) identified in this QAPP.
Taking all reasonable precautions to prevent injuries to themselves and to other employees, or employees of other companies or agencies onsite during field activities.
Reporting any accidents and unsafe conditions to the SSHO and FTL.
2.3 Driller Subcontractor Quality Assurance CDM Smith has subcontracted a drilling company to advance borings and retrieve soil cores to specific depths. All subcontracted drillers will have acceptable health and safety plans. The driller's responsibilities include documentation of depth of borings, recovery of soil from each core, and to ensure appropriate and thorough decontamination of all equipment and materials.
2.4 Laboratory Quality Assurance CDM Smith has subcontracted three analytical laboratories to analyze soil samples collected within the study area to date. These are LLI of Lancaster, Pennsylvania, Columbia Analytical of Seattle, Washington, and E‐Max of Torrance, California. In addition to the three laboratories identified above, additional laboratories have been pre‐qualified and will be considered candidate laboratories for analytical services for the Data Gap Investigation laboratory procurement. All pre‐qualified and subcontracted laboratories have acceptable QA Management Plans and are accredited by the State of California Department of Health Services under the National Environmental Laboratory Accreditation Program. The labs are also certified pursuant to the State of California Health and Safety Code Section 25198. All contracted laboratories will assign a PM to report directly to the CDM Smith Laboratory Coordinator. The specific responsibilities of laboratory personnel involved in the project are described below.
2.4.1 Laboratory Project Manager The Laboratory PM will report directly to the CDM Smith Laboratory Coordinator and will be responsible for ensuring all resources of the laboratory are available on an as‐required basis. The Laboratory PM will also sign all final data reports provided from the analysis of the project samples and will provide case narrative descriptions of any data quality issues encountered during the analysis conducted by the laboratory.
2.4.2 Laboratory Quality Assurance Officer The Laboratory QA Officer (QAO) is responsible for the quality of the analytical data produced by the analytical chemistry laboratory. The laboratory QAO will monitor the QA processes to ensure the generation of data of known quality and must perform and document audits and data reviews to ensure quality. The laboratory QAO and staff must maintain independence in the laboratory organization. The laboratory QAO is also responsible for the quality of any subcontracted analytical
Section 2 • Project Organization
2‐4 Chemical Data Gap Investigation QAPP
work. The laboratory QAO will provide written communications to the CDM Smith Laboratory Coordinator for any anomalies or corrective actions implemented that affect the reported results for the project samples.
2.4.3 Sample Custodian The sample custodian will receive and inspect the incoming sample containers, record the condition of the incoming sample containers, and sign CoC documentation. The custodian will notify the CDM Smith Laboratory Coordinator of any non‐conformance identified during sample receipt and inspection and assign a unique identification number to each sample. After log‐in, the sample custodian will initiate transfer of the samples to appropriate laboratory sections and monitor access/ storage of samples and extracts.
2.5 Data Validation Quality Assurance A professional data validation firm, independent of the laboratories and CDM Smith, will validate all data collected utilizing the Automated Data Review (ADR) software. The validation firm will be familiar with all analytical procedures. Additionally, the data validation firm will have expertise in the population of electronic data deliverables (EDDs) in formats decided upon by CDM Smith. The data validation coordinator and QAO will work with the data validation firm to monitor the activities and quality of the data generated by the contract laboratories to ensure that the DQOs for the project are met and the data are defensible.
CDM Smith will also review a limited set of the validation reports from the validation firm to identify any QC issues with the laboratory not identified by the validation firm or any discrepancies in validation procedures by the validation firm.
2.6 Field Measurements Quality Assurance Field measurements include screening measurement of volatile organic compounds (VOCs) in soil with a photoionization detector (PID), alpha and beta emissions using a radiation monitor (e.g., Dual Phosphor Alpha/Beta Scintillation Model 4389), and gamma emissions using a gamma radiation monitor (e.g., Micro R Meter Model 19). Field staff will operate, calibrate, and maintain the instruments per manufacturers' specifications and record those activities in accordance with this QAPP and respective FSP addenda. The FTL is responsible for ensuring that the calibration and maintenance of the screening instruments is performed on a daily basis and the documentation of these activities are recorded appropriately.
Department of EnergyProject DirectorProject Manager
Department of EnergyProject DirectorProject Manager
John JonesStephanie Jennings
John JonesStephanie Jennings
CDM SmithProject ManagerCDM Smith
Project Manager
John WondolleckJohn Wondolleck
CDM SmithField Team Leader
CDM SmithField Team Leader
Margaret BloisaMargaret Bloisa
CDM SmithH&S ManagerCDM SmithH&S Manager
Shawn OliveiraShawn Oliveira
CDM SmithQA Manager
CDM SmithQA Manager
Jo Nell MullinsJo Nell Mullins
CDM SmithQA CoordinatorCDM Smith
QA Coordinator
Cheryl Ann SaylerCheryl Ann Sayler
CDM SmithField Sampling Staff
CDM SmithField Sampling StaffDrilling SubcontractorDrilling Subcontractor
CDM SmithLaboratory Coordinator
CDM SmithLaboratory Coordinator
Todd BurgesserTodd Burgesser
CDM SmithData Validation Coordinator
CDM SmithData Validation Coordinator
Cherie ZakowskiCherie Zakowski
Analytical Laboratory Subcontractor
Analytical Laboratory Subcontractor
Data Validation Subcontractor
Data Validation Subcontractor
Figure 2‐1Organizational Chart
Santa Susana Field LaboratoryPhase 3 Chemical Sampling
Quality Assurance Project Plan
3‐1 Chemical Data Gap Investigation QAPP
Section 3 Quality Assurance Objectives for Measurement
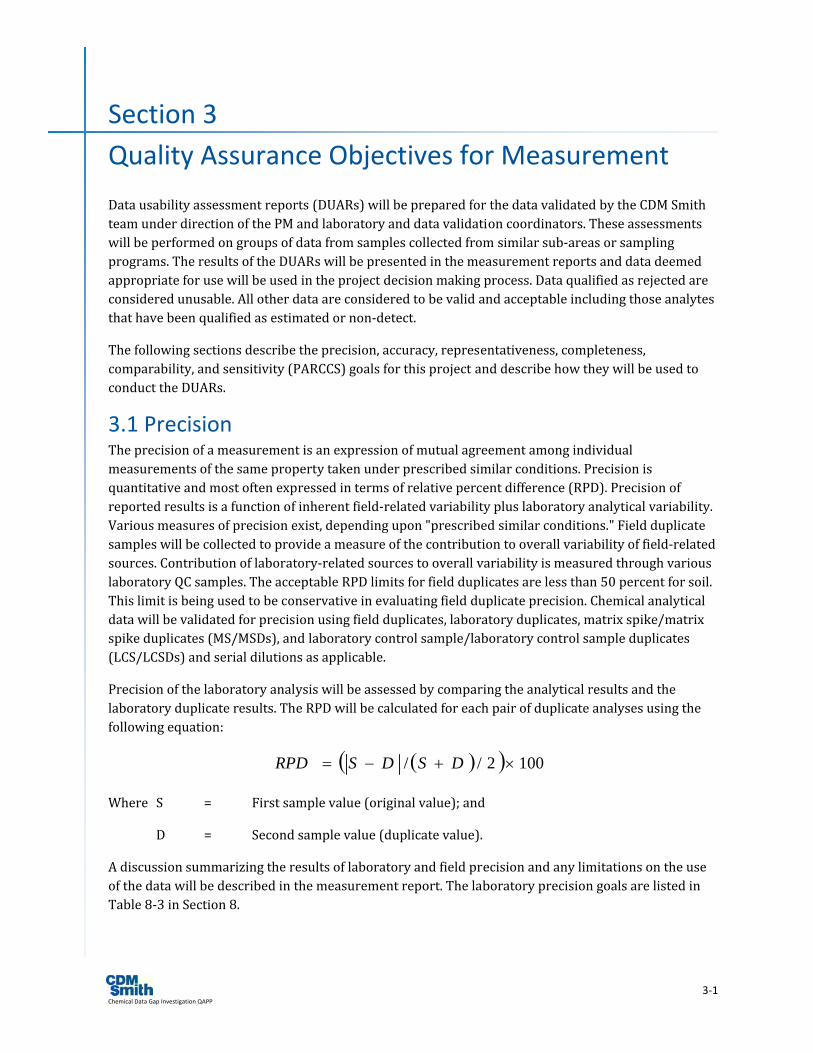
Data usability assessment reports (DUARs) will be prepared for the data validated by the CDM Smith team under direction of the PM and laboratory and data validation coordinators. These assessments will be performed on groups of data from samples collected from similar sub‐areas or sampling programs. The results of the DUARs will be presented in the measurement reports and data deemed appropriate for use will be used in the project decision making process. Data qualified as rejected are considered unusable. All other data are considered to be valid and acceptable including those analytes that have been qualified as estimated or non‐detect.
The following sections describe the precision, accuracy, representativeness, completeness, comparability, and sensitivity (PARCCS) goals for this project and describe how they will be used to conduct the DUARs.
3.1 Precision The precision of a measurement is an expression of mutual agreement among individual measurements of the same property taken under prescribed similar conditions. Precision is quantitative and most often expressed in terms of relative percent difference (RPD). Precision of reported results is a function of inherent field‐related variability plus laboratory analytical variability. Various measures of precision exist, depending upon "prescribed similar conditions." Field duplicate samples will be collected to provide a measure of the contribution to overall variability of field‐related sources. Contribution of laboratory‐related sources to overall variability is measured through various laboratory QC samples. The acceptable RPD limits for field duplicates are less than 50 percent for soil. This limit is being used to be conservative in evaluating field duplicate precision. Chemical analytical data will be validated for precision using field duplicates, laboratory duplicates, matrix spike/matrix spike duplicates (MS/MSDs), and laboratory control sample/laboratory control sample duplicates (LCS/LCSDs) and serial dilutions as applicable.
Precision of the laboratory analysis will be assessed by comparing the analytical results and the laboratory duplicate results. The RPD will be calculated for each pair of duplicate analyses using the following equation:
( )( ) 1002// ×+−= DSDSRPD
Where S = First sample value (original value); and
D = Second sample value (duplicate value).
A discussion summarizing the results of laboratory and field precision and any limitations on the use of the data will be described in the measurement report. The laboratory precision goals are listed in Table 8‐3 in Section 8.
Section 3 • Project Organization
3‐2 Chemical Data Gap Investigation QAPP
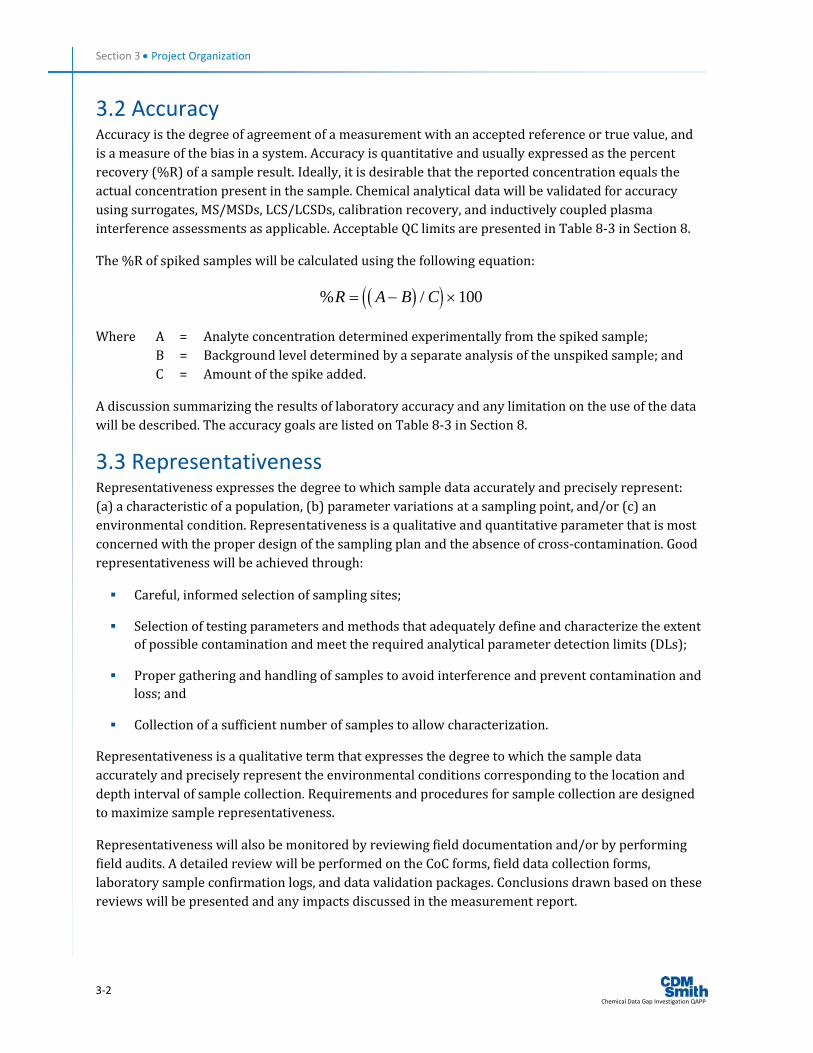
3.2 Accuracy Accuracy is the degree of agreement of a measurement with an accepted reference or true value, and is a measure of the bias in a system. Accuracy is quantitative and usually expressed as the percent recovery (%R) of a sample result. Ideally, it is desirable that the reported concentration equals the actual concentration present in the sample. Chemical analytical data will be validated for accuracy using surrogates, MS/MSDs, LCS/LCSDs, calibration recovery, and inductively coupled plasma interference assessments as applicable. Acceptable QC limits are presented in Table 8‐3 in Section 8.
The %R of spiked samples will be calculated using the following equation:
( )( )% /R A B C= − ×100
Where A = Analyte concentration determined experimentally from the spiked sample; B = Background level determined by a separate analysis of the unspiked sample; and C = Amount of the spike added.
A discussion summarizing the results of laboratory accuracy and any limitation on the use of the data will be described. The accuracy goals are listed on Table 8‐3 in Section 8.
3.3 Representativeness Representativeness expresses the degree to which sample data accurately and precisely represent: (a) a characteristic of a population, (b) parameter variations at a sampling point, and/or (c) an environmental condition. Representativeness is a qualitative and quantitative parameter that is most concerned with the proper design of the sampling plan and the absence of cross‐contamination. Good representativeness will be achieved through:
Careful, informed selection of sampling sites;
Selection of testing parameters and methods that adequately define and characterize the extent of possible contamination and meet the required analytical parameter detection limits (DLs);
Proper gathering and handling of samples to avoid interference and prevent contamination and loss; and
Collection of a sufficient number of samples to allow characterization.
Representativeness is a qualitative term that expresses the degree to which the sample data accurately and precisely represent the environmental conditions corresponding to the location and depth interval of sample collection. Requirements and procedures for sample collection are designed to maximize sample representativeness.
Representativeness will also be monitored by reviewing field documentation and/or by performing field audits. A detailed review will be performed on the CoC forms, field data collection forms, laboratory sample confirmation logs, and data validation packages. Conclusions drawn based on these reviews will be presented and any impacts discussed in the measurement report.
Section 3 • Area IV Subarea 5C Soil Sampling Results
3‐3 Chemical Data Gap Investigation QAPP
3.4 Completeness Completeness is a measure of the amount of usable data obtained from a measurement system compared to the amount that was expected to be obtained under normal conditions. Usability will be assessed by evaluating the PARCCS parameters. Those data that are validated and need no qualification, or are qualified as estimated data, are considered usable. Rejected data are not considered usable. Completeness will be calculated following data evaluation. For this work, a completeness goal of 90 percent is projected for each analytical test. If this goal is not met, additional sampling may be necessary to adequately achieve project objectives. An evaluation of the impact of missing information and any project limitations with respect to completeness will be discussed in the measurement report.
3.5 Comparability Consistency in the acquisition, handling, and analysis of samples is necessary for comparing results. Where appropriate, the results of analyses obtained will be compared with the results obtained in previous studies. Standard DTSC‐approved analytical methods and EPA analytical and QC methods will be used to ensure comparability of results with other analyses performed in a similar manner. Comparability is a qualitative parameter and cannot be assessed using QC samples. Any comparability limitations will be presented and discussed in the measurement report.
3.6 Sensitivity Sensitivity is the ability of the method or instrument to detect target analytes at the level of interest. Examples of QC measures for determining sensitivity include method detection limit (MDL) studies, and low initial calibration standards at the quantitation/DL. A review of initial calibration data (specifically low standards at the DL) will be completed to determine if project required sensitivities (DLs) were achieved. When or if method modifications are implemented, additional QC samples will be incorporated (RL‐LCS and RL‐MS [low level spikes]) to better evaluate the modifications effects on method sensitivity. The measurement report will discuss sensitivity and any impacts and limitations on the use of project data.
4‐1 Chemical Data Gap Investigation QAPP
Section 4 Data Quality Objectives
The DQO process is a series of seven planning steps (based on the scientific method) designed to specify the type, quantity, and quality of environmental data needed to support defensible decisions based on current conditions and proposed activities at an environmental site (EPA 2006). The EPA seven‐step DQO process was used as general guidance during the development of these DQOs.
DQOs are qualitative and quantitative statements derived from the outputs of each step of the DQO process that:
Clarify study objectives;
Define data needs (type, quality, etc.); and
Specify acceptable levels of decision errors that will be used as the basis for establishing the quantity and quality of data needed to support the decision.
The derived statements are then used to develop scientific, resource‐effective, and defensible sampling designs. The DQO summary table is provided in Table 4‐1 of the Master FSP. The QA objective for the Data Gap Investigation sampling program within Area IV of SSFL is that the resulting analytical data meet the PARCCS parameter criteria established in this QAPP. The QA objectives will be met by following the procedures included in the Master FSP and FSP addenda.
4.1 Field Measurements Field activities outlined in the Master FSP include screening measurement of VOCs in soil with a PID, alpha and beta emissions using a radiation monitor (e.g., Dual Phosphor Alpha/Beta Scintillation Model 4389), and gamma emissions using a gamma radiation monitor (e.g., Micro R Meter Model 19). SOPs for these activities are contained in Appendix D. These readings are used to determine sampling intervals. For the Data Gap Investigation and subsequent field programs, screening of soil will be conducted by CDM Smith. Field staff will operate, calibrate, and maintain the instruments per manufacturers' specifications and record those activities in accordance with this Section 5 and respective FSP addenda.
4.2 Laboratory Analyses Soil samples will be collected and submitted for offsite laboratory chemical analyses. The DQOs for data provided by the laboratory will be expressed in terms of PARCCS criteria presented in this QAPP. These DQOs will be achieved by comparison of DTSC and EPA method acceptance criteria and laboratory QC procedures. Laboratory analytical MRLs should meet the ISLs as presented in Table 8‐2 in Section 8.
5‐1 Chemical Data Gap Investigation QAPP
Section 5 Sampling Procedures
The soil sampling procedures used by CDM Smith for the chemical Data Gap Investigation, as well as the general rationale used for selecting soil samples for chemical analysis, are described in Sections 5.1 and 5.2 of the Master FSP and may be modified to address specific sampling requirements in subsequent FSP addenda. If any QAPP elements are affected by any possible modifications in subsequent FSP addenda, these elements will be addressed in the QAPP and the revised QAPP will be submitted with the FSP addenda. Sampling rationale will be tailored to the chemical data gap requirements for each sampling location. The chemical Data Gap Investigation sampling rationale and procedures are represented in the Master FSP and subsequent FSP addenda for each sampling event. Procedures pertaining to the selection and labeling of sample containers, handling, and preservation of samples, are also described Section 6 of the Master FSP. The number and type of containers needed for samples are presented in Table 6‐1of the Master FSP. Sample custody procedures are described in Section 6.
6‐1 Chemical Data Gap Investigation QAPP
Section 6 Sample Custody
CoC procedures will be followed to track samples. A CoC record will be completed for all samples. When transferring the possession of samples, the individuals relinquishing and receiving will sign, date, and note the time on the record. This record documents sample custody transfer from the sampler, often through another person, to the sample custodian in the appropriate laboratory. The date/time will be the same for both signatures when custody is transferred directly to another person. When samples are shipped via common carrier (e.g., Federal Express), the date and time of the signatures will not be the same. Common carriers are not required to sign the CoC record. In all cases, it must be readily apparent that the person who received custody is the same person who relinquished custody to the next custodian. If samples are left unattended or a person refuses to sign, then this must be documented and explained on the record. If a field sample coordinator has been designated, that person may initiate the CoC record, sign, and date as the relinquisher. The individual sampler(s) must sign in the appropriate block, but does (do) not need to sign and date as a relinquisher.
A signed copy of the CoC record will accompany the shipment. Freight bills will also be retained in the project record as part of the permanent documentation. The shipping number from the freight bill shall be recorded on the applicable CoC record and in the field logbook.
Detailed procedures for documenting sample custody can be found in Standard Operating Procedure 10 in Appendix D.
7‐1 Chemical Data Gap Investigation QAPP
Section 7 Schedule
7.1 Schedule Reporting and Updates CDM Smith will use Microsoft Project to develop a project schedule that includes a critical path and progress tracking for the Investigation. A detailed schedule for the Investigation is presented in Table 7‐1 of the Work Plan. The schedule will be updated and revised as needed.
8‐1 Chemical Data Gap Investigation QAPP
Section 8 Analytical Procedures and Quality Control
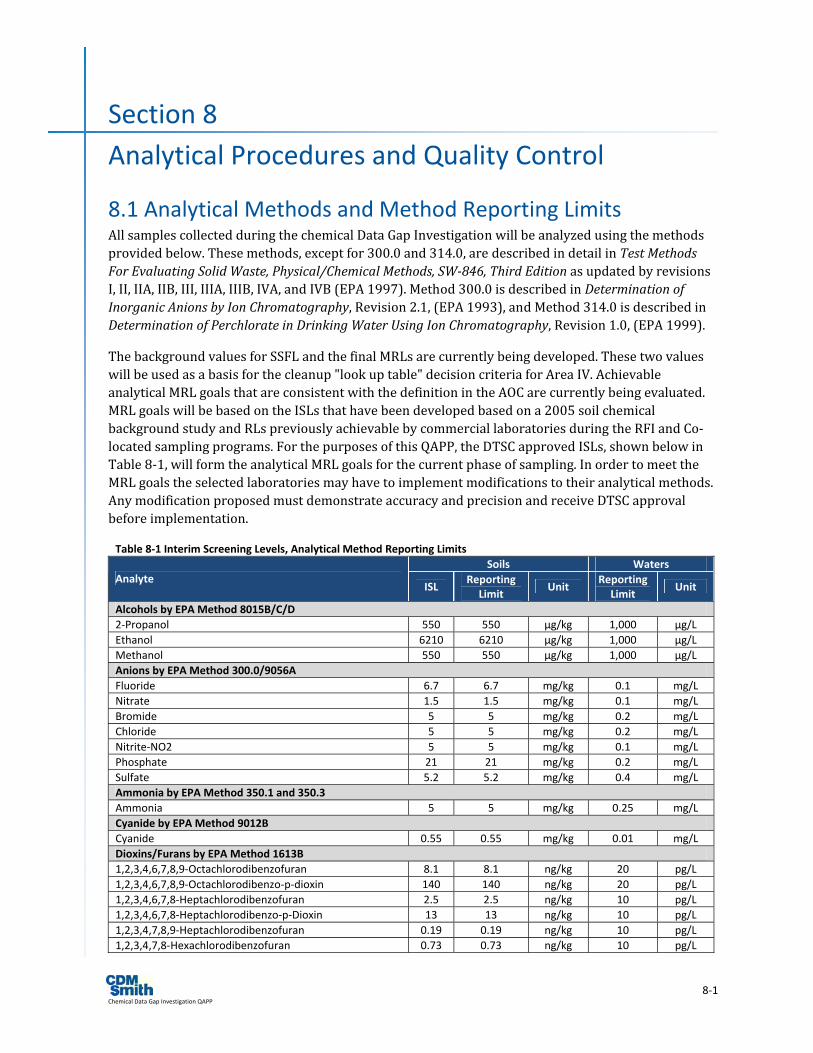
8.1 Analytical Methods and Method Reporting Limits All samples collected during the chemical Data Gap Investigation will be analyzed using the methods provided below. These methods, except for 300.0 and 314.0, are described in detail in Test Methods For Evaluating Solid Waste, Physical/Chemical Methods, SW846, Third Edition as updated by revisions I, II, IIA, IIB, III, IIIA, IIIB, IVA, and IVB (EPA 1997). Method 300.0 is described in Determination of Inorganic Anions by Ion Chromatography, Revision 2.1, (EPA 1993), and Method 314.0 is described in Determination of Perchlorate in Drinking Water Using Ion Chromatography, Revision 1.0, (EPA 1999).
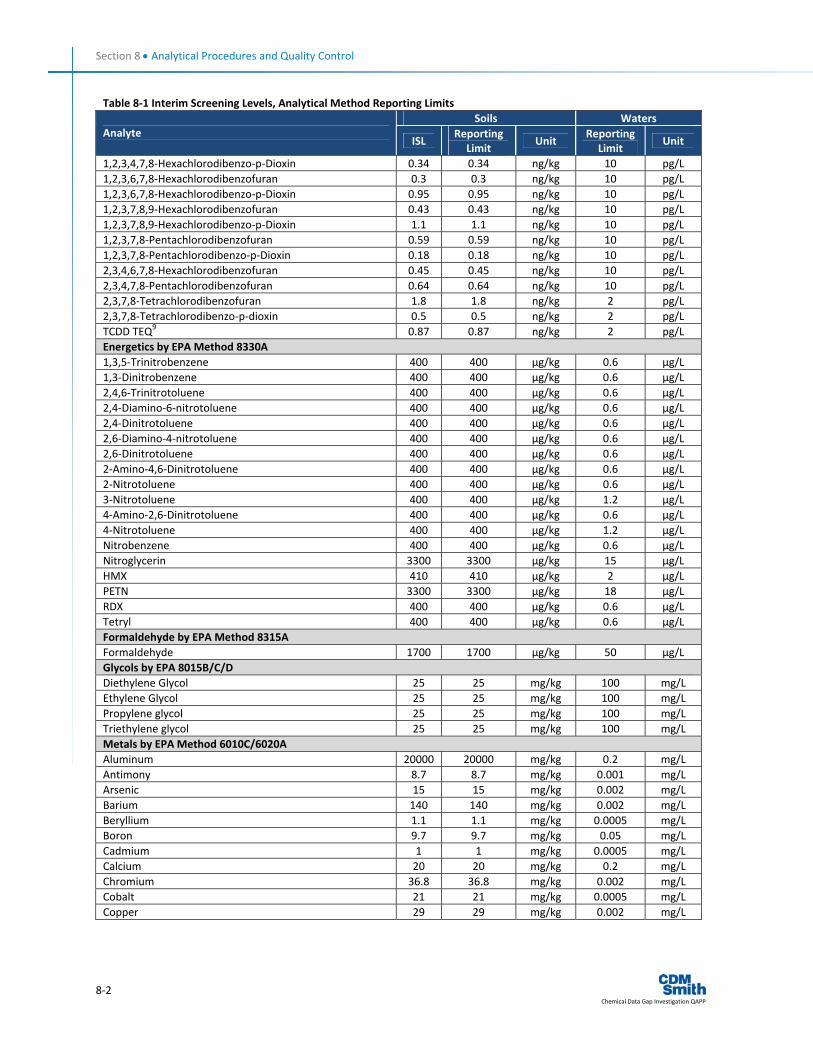
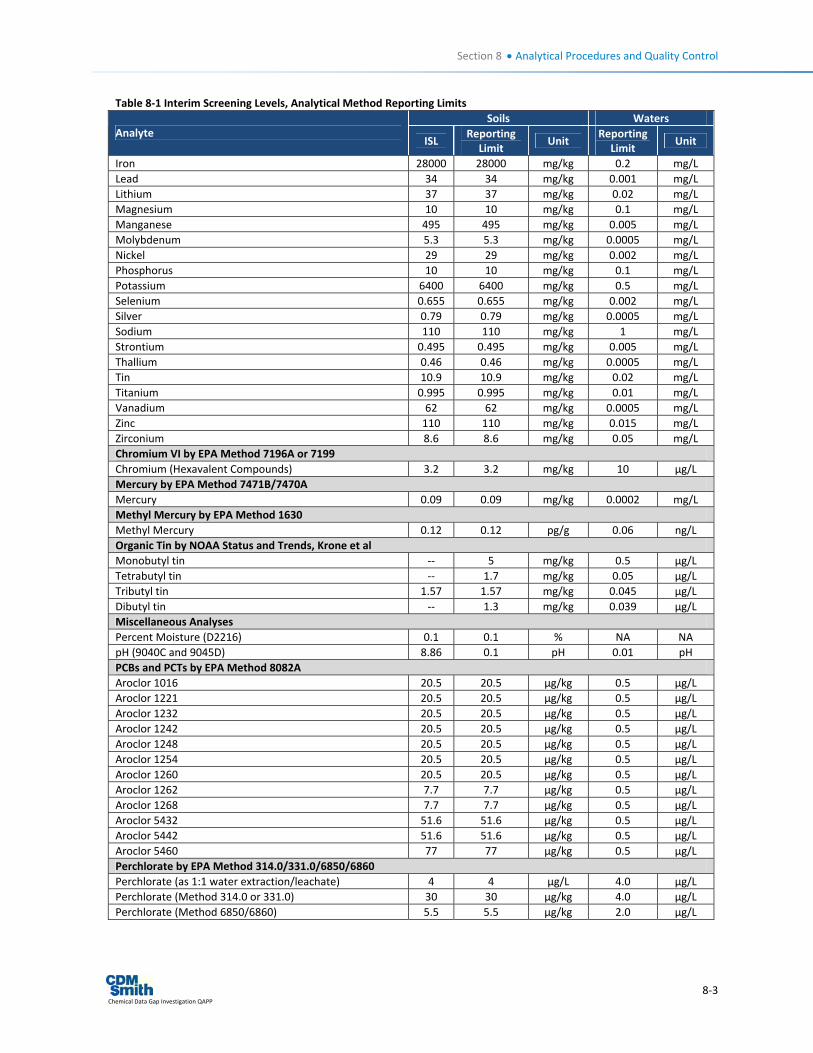
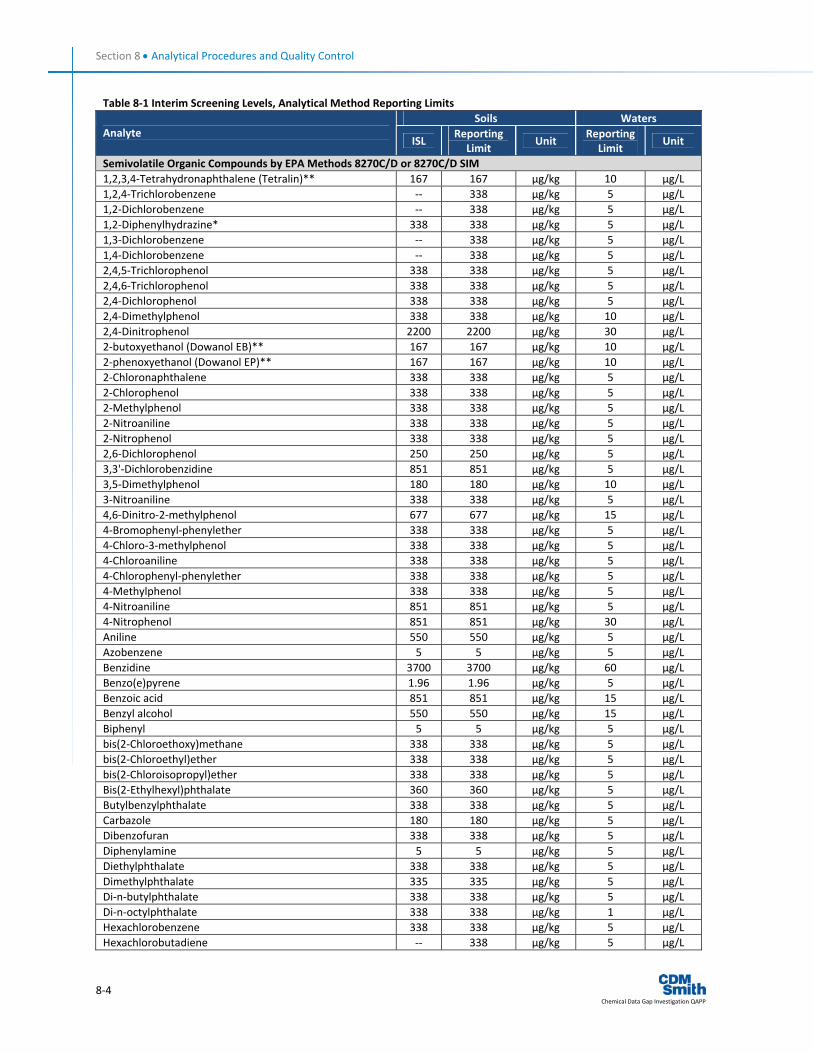
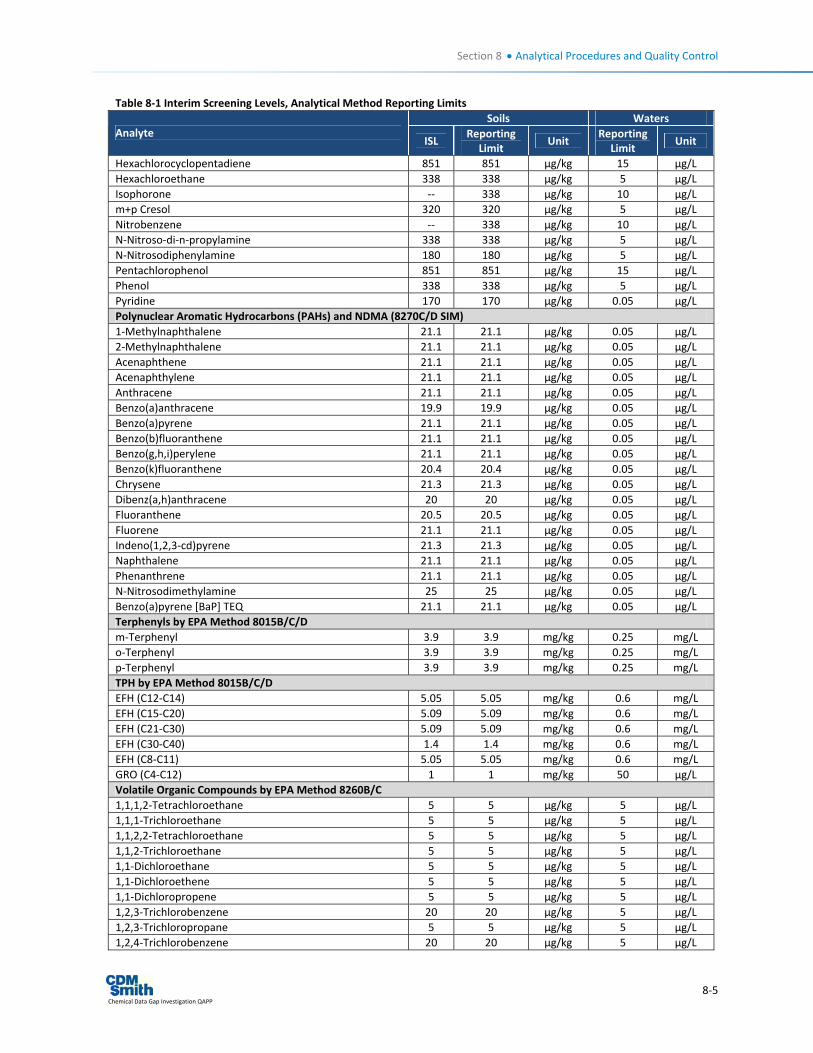
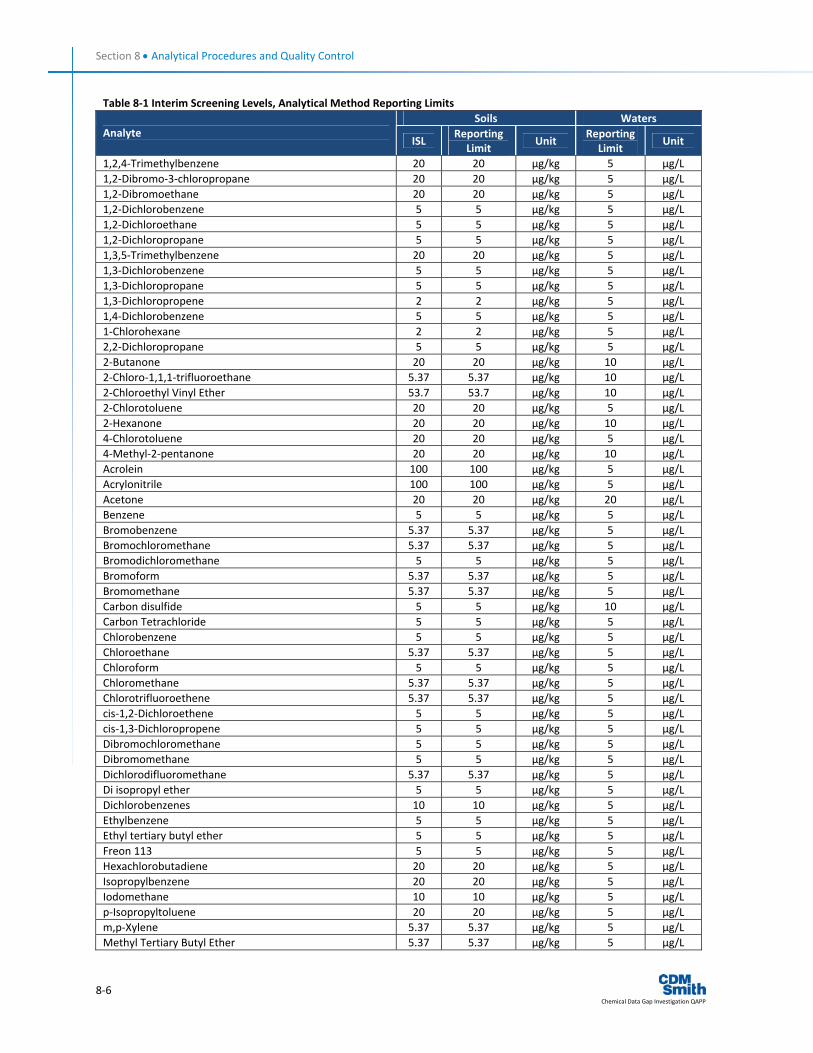
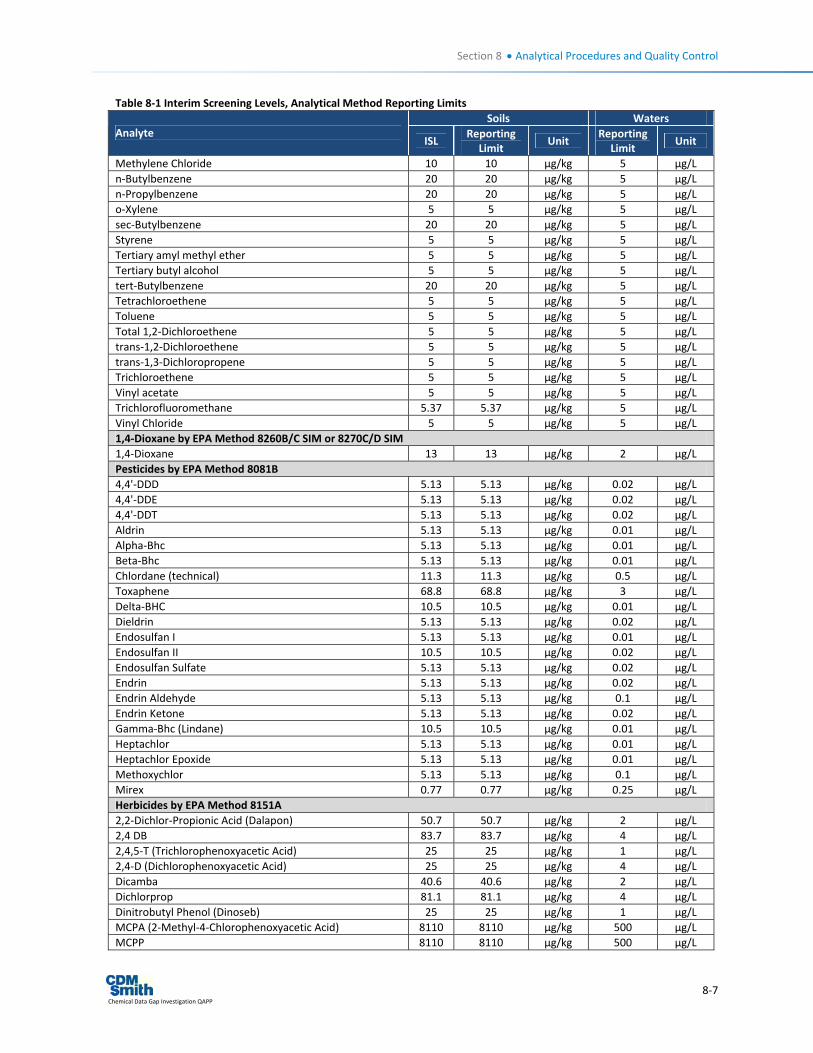
The background values for SSFL and the final MRLs are currently being developed. These two values will be used as a basis for the cleanup "look up table" decision criteria for Area IV. Achievable analytical MRL goals that are consistent with the definition in the AOC are currently being evaluated. MRL goals will be based on the ISLs that have been developed based on a 2005 soil chemical background study and RLs previously achievable by commercial laboratories during the RFI and Co‐located sampling programs. For the purposes of this QAPP, the DTSC approved ISLs, shown below in Table 8‐1, will form the analytical MRL goals for the current phase of sampling. In order to meet the MRL goals the selected laboratories may have to implement modifications to their analytical methods. Any modification proposed must demonstrate accuracy and precision and receive DTSC approval before implementation.
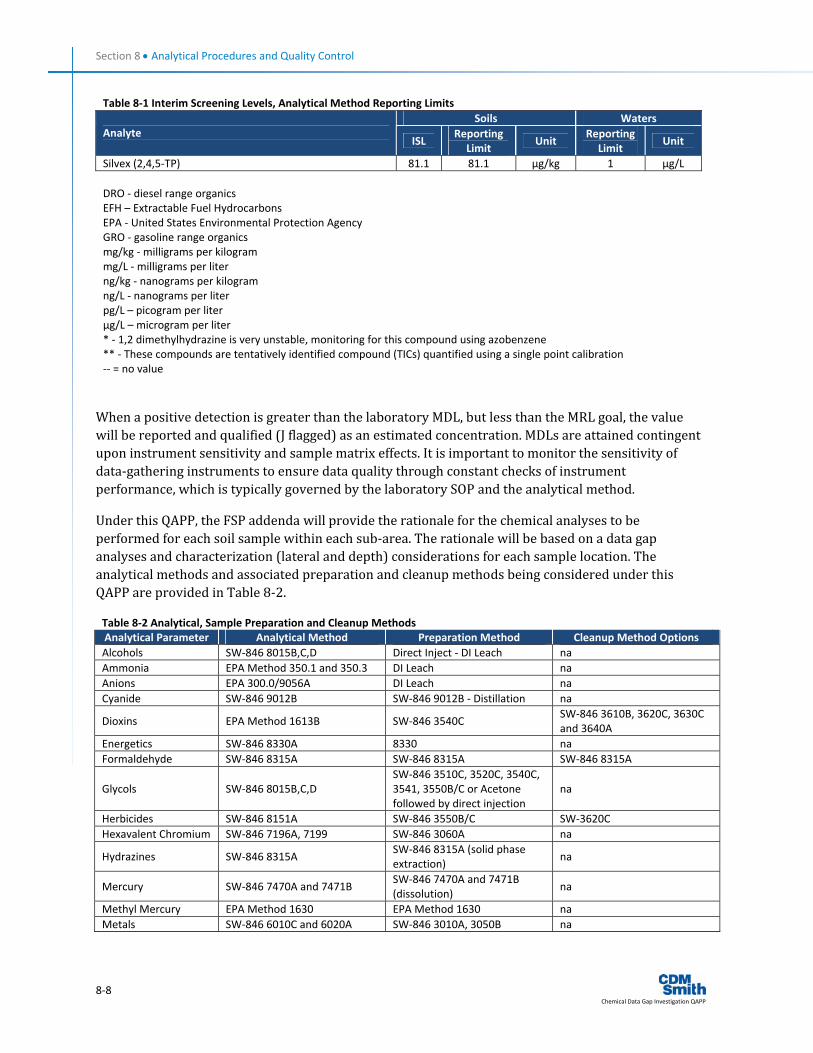
Table 8‐1 Interim Screening Levels, Analytical Method Reporting Limits Soils Waters
Analyte ISL
Reporting Limit
Unit Reporting Limit
Unit
Alcohols by EPA Method 8015B/C/D 2‐Propanol 550 550 µg/kg 1,000 µg/L Ethanol 6210 6210 µg/kg 1,000 µg/L Methanol 550 550 µg/kg 1,000 µg/L Anions by EPA Method 300.0/9056A Fluoride 6.7 6.7 mg/kg 0.1 mg/L Nitrate 1.5 1.5 mg/kg 0.1 mg/L Bromide 5 5 mg/kg 0.2 mg/L Chloride 5 5 mg/kg 0.2 mg/L Nitrite‐NO2 5 5 mg/kg 0.1 mg/L Phosphate 21 21 mg/kg 0.2 mg/L Sulfate 5.2 5.2 mg/kg 0.4 mg/L Ammonia by EPA Method 350.1 and 350.3 Ammonia 5 5 mg/kg 0.25 mg/L Cyanide by EPA Method 9012B Cyanide 0.55 0.55 mg/kg 0.01 mg/L Dioxins/Furans by EPA Method 1613B 1,2,3,4,6,7,8,9‐Octachlorodibenzofuran 8.1 8.1 ng/kg 20 pg/L 1,2,3,4,6,7,8,9‐Octachlorodibenzo‐p‐dioxin 140 140 ng/kg 20 pg/L 1,2,3,4,6,7,8‐Heptachlorodibenzofuran 2.5 2.5 ng/kg 10 pg/L 1,2,3,4,6,7,8‐Heptachlorodibenzo‐p‐Dioxin 13 13 ng/kg 10 pg/L 1,2,3,4,7,8,9‐Heptachlorodibenzofuran 0.19 0.19 ng/kg 10 pg/L 1,2,3,4,7,8‐Hexachlorodibenzofuran 0.73 0.73 ng/kg 10 pg/L
Section 8 • Analytical Procedures and Quality Control
8‐2 Chemical Data Gap Investigation QAPP
Table 8‐1 Interim Screening Levels, Analytical Method Reporting Limits Soils Waters
Analyte ISL
Reporting Limit
Unit Reporting Limit
Unit
1,2,3,4,7,8‐Hexachlorodibenzo‐p‐Dioxin 0.34 0.34 ng/kg 10 pg/L 1,2,3,6,7,8‐Hexachlorodibenzofuran 0.3 0.3 ng/kg 10 pg/L 1,2,3,6,7,8‐Hexachlorodibenzo‐p‐Dioxin 0.95 0.95 ng/kg 10 pg/L 1,2,3,7,8,9‐Hexachlorodibenzofuran 0.43 0.43 ng/kg 10 pg/L 1,2,3,7,8,9‐Hexachlorodibenzo‐p‐Dioxin 1.1 1.1 ng/kg 10 pg/L 1,2,3,7,8‐Pentachlorodibenzofuran 0.59 0.59 ng/kg 10 pg/L 1,2,3,7,8‐Pentachlorodibenzo‐p‐Dioxin 0.18 0.18 ng/kg 10 pg/L 2,3,4,6,7,8‐Hexachlorodibenzofuran 0.45 0.45 ng/kg 10 pg/L 2,3,4,7,8‐Pentachlorodibenzofuran 0.64 0.64 ng/kg 10 pg/L 2,3,7,8‐Tetrachlorodibenzofuran 1.8 1.8 ng/kg 2 pg/L 2,3,7,8‐Tetrachlorodibenzo‐p‐dioxin 0.5 0.5 ng/kg 2 pg/L TCDD TEQ9 0.87 0.87 ng/kg 2 pg/L Energetics by EPA Method 8330A 1,3,5‐Trinitrobenzene 400 400 µg/kg 0.6 µg/L 1,3‐Dinitrobenzene 400 400 µg/kg 0.6 µg/L 2,4,6‐Trinitrotoluene 400 400 µg/kg 0.6 µg/L 2,4‐Diamino‐6‐nitrotoluene 400 400 µg/kg 0.6 µg/L 2,4‐Dinitrotoluene 400 400 µg/kg 0.6 µg/L 2,6‐Diamino‐4‐nitrotoluene 400 400 µg/kg 0.6 µg/L 2,6‐Dinitrotoluene 400 400 µg/kg 0.6 µg/L 2‐Amino‐4,6‐Dinitrotoluene 400 400 µg/kg 0.6 µg/L 2‐Nitrotoluene 400 400 µg/kg 0.6 µg/L 3‐Nitrotoluene 400 400 µg/kg 1.2 µg/L 4‐Amino‐2,6‐Dinitrotoluene 400 400 µg/kg 0.6 µg/L 4‐Nitrotoluene 400 400 µg/kg 1.2 µg/L Nitrobenzene 400 400 µg/kg 0.6 µg/L Nitroglycerin 3300 3300 µg/kg 15 µg/L HMX 410 410 µg/kg 2 µg/L PETN 3300 3300 µg/kg 18 µg/L RDX 400 400 µg/kg 0.6 µg/L Tetryl 400 400 µg/kg 0.6 µg/L Formaldehyde by EPA Method 8315A Formaldehyde 1700 1700 µg/kg 50 µg/L Glycols by EPA 8015B/C/D Diethylene Glycol 25 25 mg/kg 100 mg/L Ethylene Glycol 25 25 mg/kg 100 mg/L Propylene glycol 25 25 mg/kg 100 mg/L Triethylene glycol 25 25 mg/kg 100 mg/L Metals by EPA Method 6010C/6020A Aluminum 20000 20000 mg/kg 0.2 mg/L Antimony 8.7 8.7 mg/kg 0.001 mg/L Arsenic 15 15 mg/kg 0.002 mg/L Barium 140 140 mg/kg 0.002 mg/L Beryllium 1.1 1.1 mg/kg 0.0005 mg/L Boron 9.7 9.7 mg/kg 0.05 mg/L Cadmium 1 1 mg/kg 0.0005 mg/L Calcium 20 20 mg/kg 0.2 mg/L Chromium 36.8 36.8 mg/kg 0.002 mg/L Cobalt 21 21 mg/kg 0.0005 mg/L Copper 29 29 mg/kg 0.002 mg/L
Section 8 • Analytical Procedures and Quality Control
8‐3 Chemical Data Gap Investigation QAPP
Table 8‐1 Interim Screening Levels, Analytical Method Reporting Limits Soils Waters
Analyte ISL
Reporting Limit
Unit Reporting Limit
Unit
Iron 28000 28000 mg/kg 0.2 mg/L Lead 34 34 mg/kg 0.001 mg/L Lithium 37 37 mg/kg 0.02 mg/L Magnesium 10 10 mg/kg 0.1 mg/L Manganese 495 495 mg/kg 0.005 mg/L Molybdenum 5.3 5.3 mg/kg 0.0005 mg/L Nickel 29 29 mg/kg 0.002 mg/L Phosphorus 10 10 mg/kg 0.1 mg/L Potassium 6400 6400 mg/kg 0.5 mg/L Selenium 0.655 0.655 mg/kg 0.002 mg/L Silver 0.79 0.79 mg/kg 0.0005 mg/L Sodium 110 110 mg/kg 1 mg/L Strontium 0.495 0.495 mg/kg 0.005 mg/L Thallium 0.46 0.46 mg/kg 0.0005 mg/L Tin 10.9 10.9 mg/kg 0.02 mg/L Titanium 0.995 0.995 mg/kg 0.01 mg/L Vanadium 62 62 mg/kg 0.0005 mg/L Zinc 110 110 mg/kg 0.015 mg/L Zirconium 8.6 8.6 mg/kg 0.05 mg/L Chromium VI by EPA Method 7196A or 7199 Chromium (Hexavalent Compounds) 3.2 3.2 mg/kg 10 µg/L Mercury by EPA Method 7471B/7470A Mercury 0.09 0.09 mg/kg 0.0002 mg/L Methyl Mercury by EPA Method 1630 Methyl Mercury 0.12 0.12 pg/g 0.06 ng/L Organic Tin by NOAA Status and Trends, Krone et al Monobutyl tin ‐‐ 5 mg/kg 0.5 µg/L Tetrabutyl tin ‐‐ 1.7 mg/kg 0.05 µg/L Tributyl tin 1.57 1.57 mg/kg 0.045 µg/L Dibutyl tin ‐‐ 1.3 mg/kg 0.039 µg/L Miscellaneous Analyses Percent Moisture (D2216) 0.1 0.1 % NA NA pH (9040C and 9045D) 8.86 0.1 pH 0.01 pH PCBs and PCTs by EPA Method 8082A Aroclor 1016 20.5 20.5 µg/kg 0.5 µg/L Aroclor 1221 20.5 20.5 µg/kg 0.5 µg/L Aroclor 1232 20.5 20.5 µg/kg 0.5 µg/L Aroclor 1242 20.5 20.5 µg/kg 0.5 µg/L Aroclor 1248 20.5 20.5 µg/kg 0.5 µg/L Aroclor 1254 20.5 20.5 µg/kg 0.5 µg/L Aroclor 1260 20.5 20.5 µg/kg 0.5 µg/L Aroclor 1262 7.7 7.7 µg/kg 0.5 µg/L Aroclor 1268 7.7 7.7 µg/kg 0.5 µg/L Aroclor 5432 51.6 51.6 µg/kg 0.5 µg/L Aroclor 5442 51.6 51.6 µg/kg 0.5 µg/L Aroclor 5460 77 77 µg/kg 0.5 µg/L Perchlorate by EPA Method 314.0/331.0/6850/6860 Perchlorate (as 1:1 water extraction/leachate) 4 4 µg/L 4.0 µg/L Perchlorate (Method 314.0 or 331.0) 30 30 µg/kg 4.0 µg/L Perchlorate (Method 6850/6860) 5.5 5.5 µg/kg 2.0 µg/L
Section 8 • Analytical Procedures and Quality Control
8‐4 Chemical Data Gap Investigation QAPP
Table 8‐1 Interim Screening Levels, Analytical Method Reporting Limits Soils Waters
Analyte ISL
Reporting Limit
Unit Reporting Limit
Unit
Semivolatile Organic Compounds by EPA Methods 8270C/D or 8270C/D SIM 1,2,3,4‐Tetrahydronaphthalene (Tetralin)** 167 167 µg/kg 10 µg/L 1,2,4‐Trichlorobenzene ‐‐ 338 µg/kg 5 µg/L 1,2‐Dichlorobenzene ‐‐ 338 µg/kg 5 µg/L 1,2‐Diphenylhydrazine* 338 338 µg/kg 5 µg/L 1,3‐Dichlorobenzene ‐‐ 338 µg/kg 5 µg/L 1,4‐Dichlorobenzene ‐‐ 338 µg/kg 5 µg/L 2,4,5‐Trichlorophenol 338 338 µg/kg 5 µg/L 2,4,6‐Trichlorophenol 338 338 µg/kg 5 µg/L 2,4‐Dichlorophenol 338 338 µg/kg 5 µg/L 2,4‐Dimethylphenol 338 338 µg/kg 10 µg/L 2,4‐Dinitrophenol 2200 2200 µg/kg 30 µg/L 2‐butoxyethanol (Dowanol EB)** 167 167 µg/kg 10 µg/L 2‐phenoxyethanol (Dowanol EP)** 167 167 µg/kg 10 µg/L 2‐Chloronaphthalene 338 338 µg/kg 5 µg/L 2‐Chlorophenol 338 338 µg/kg 5 µg/L 2‐Methylphenol 338 338 µg/kg 5 µg/L 2‐Nitroaniline 338 338 µg/kg 5 µg/L 2‐Nitrophenol 338 338 µg/kg 5 µg/L 2,6‐Dichlorophenol 250 250 µg/kg 5 µg/L 3,3'‐Dichlorobenzidine 851 851 µg/kg 5 µg/L 3,5‐Dimethylphenol 180 180 µg/kg 10 µg/L 3‐Nitroaniline 338 338 µg/kg 5 µg/L 4,6‐Dinitro‐2‐methylphenol 677 677 µg/kg 15 µg/L 4‐Bromophenyl‐phenylether 338 338 µg/kg 5 µg/L 4‐Chloro‐3‐methylphenol 338 338 µg/kg 5 µg/L 4‐Chloroaniline 338 338 µg/kg 5 µg/L 4‐Chlorophenyl‐phenylether 338 338 µg/kg 5 µg/L 4‐Methylphenol 338 338 µg/kg 5 µg/L 4‐Nitroaniline 851 851 µg/kg 5 µg/L 4‐Nitrophenol 851 851 µg/kg 30 µg/L Aniline 550 550 µg/kg 5 µg/L Azobenzene 5 5 µg/kg 5 µg/L Benzidine 3700 3700 µg/kg 60 µg/L Benzo(e)pyrene 1.96 1.96 µg/kg 5 µg/L Benzoic acid 851 851 µg/kg 15 µg/L Benzyl alcohol 550 550 µg/kg 15 µg/L Biphenyl 5 5 µg/kg 5 µg/L bis(2‐Chloroethoxy)methane 338 338 µg/kg 5 µg/L bis(2‐Chloroethyl)ether 338 338 µg/kg 5 µg/L bis(2‐Chloroisopropyl)ether 338 338 µg/kg 5 µg/L Bis(2‐Ethylhexyl)phthalate 360 360 µg/kg 5 µg/L Butylbenzylphthalate 338 338 µg/kg 5 µg/L Carbazole 180 180 µg/kg 5 µg/L Dibenzofuran 338 338 µg/kg 5 µg/L Diphenylamine 5 5 µg/kg 5 µg/L Diethylphthalate 338 338 µg/kg 5 µg/L Dimethylphthalate 335 335 µg/kg 5 µg/L Di‐n‐butylphthalate 338 338 µg/kg 5 µg/L Di‐n‐octylphthalate 338 338 µg/kg 1 µg/L Hexachlorobenzene 338 338 µg/kg 5 µg/L Hexachlorobutadiene ‐‐ 338 µg/kg 5 µg/L
Section 8 • Analytical Procedures and Quality Control
8‐5 Chemical Data Gap Investigation QAPP
Table 8‐1 Interim Screening Levels, Analytical Method Reporting Limits Soils Waters
Analyte ISL
Reporting Limit
Unit Reporting Limit
Unit
Hexachlorocyclopentadiene 851 851 µg/kg 15 µg/L Hexachloroethane 338 338 µg/kg 5 µg/L Isophorone ‐‐ 338 µg/kg 10 µg/L m+p Cresol 320 320 µg/kg 5 µg/L Nitrobenzene ‐‐ 338 µg/kg 10 µg/L N‐Nitroso‐di‐n‐propylamine 338 338 µg/kg 5 µg/L N‐Nitrosodiphenylamine 180 180 µg/kg 5 µg/L Pentachlorophenol 851 851 µg/kg 15 µg/L Phenol 338 338 µg/kg 5 µg/L Pyridine 170 170 µg/kg 0.05 µg/L Polynuclear Aromatic Hydrocarbons (PAHs) and NDMA (8270C/D SIM) 1‐Methylnaphthalene 21.1 21.1 µg/kg 0.05 µg/L 2‐Methylnaphthalene 21.1 21.1 µg/kg 0.05 µg/L Acenaphthene 21.1 21.1 µg/kg 0.05 µg/L Acenaphthylene 21.1 21.1 µg/kg 0.05 µg/L Anthracene 21.1 21.1 µg/kg 0.05 µg/L Benzo(a)anthracene 19.9 19.9 µg/kg 0.05 µg/L Benzo(a)pyrene 21.1 21.1 µg/kg 0.05 µg/L Benzo(b)fluoranthene 21.1 21.1 µg/kg 0.05 µg/L Benzo(g,h,i)perylene 21.1 21.1 µg/kg 0.05 µg/L Benzo(k)fluoranthene 20.4 20.4 µg/kg 0.05 µg/L Chrysene 21.3 21.3 µg/kg 0.05 µg/L Dibenz(a,h)anthracene 20 20 µg/kg 0.05 µg/L Fluoranthene 20.5 20.5 µg/kg 0.05 µg/L Fluorene 21.1 21.1 µg/kg 0.05 µg/L Indeno(1,2,3‐cd)pyrene 21.3 21.3 µg/kg 0.05 µg/L Naphthalene 21.1 21.1 µg/kg 0.05 µg/L Phenanthrene 21.1 21.1 µg/kg 0.05 µg/L N‐Nitrosodimethylamine 25 25 µg/kg 0.05 µg/L Benzo(a)pyrene [BaP] TEQ 21.1 21.1 µg/kg 0.05 µg/L Terphenyls by EPA Method 8015B/C/D m‐Terphenyl 3.9 3.9 mg/kg 0.25 mg/L o‐Terphenyl 3.9 3.9 mg/kg 0.25 mg/L p‐Terphenyl 3.9 3.9 mg/kg 0.25 mg/L TPH by EPA Method 8015B/C/D EFH (C12‐C14) 5.05 5.05 mg/kg 0.6 mg/L EFH (C15‐C20) 5.09 5.09 mg/kg 0.6 mg/L EFH (C21‐C30) 5.09 5.09 mg/kg 0.6 mg/L EFH (C30‐C40) 1.4 1.4 mg/kg 0.6 mg/L EFH (C8‐C11) 5.05 5.05 mg/kg 0.6 mg/L GRO (C4‐C12) 1 1 mg/kg 50 µg/L Volatile Organic Compounds by EPA Method 8260B/C 1,1,1,2‐Tetrachloroethane 5 5 µg/kg 5 µg/L 1,1,1‐Trichloroethane 5 5 µg/kg 5 µg/L 1,1,2,2‐Tetrachloroethane 5 5 µg/kg 5 µg/L 1,1,2‐Trichloroethane 5 5 µg/kg 5 µg/L 1,1‐Dichloroethane 5 5 µg/kg 5 µg/L 1,1‐Dichloroethene 5 5 µg/kg 5 µg/L 1,1‐Dichloropropene 5 5 µg/kg 5 µg/L 1,2,3‐Trichlorobenzene 20 20 µg/kg 5 µg/L 1,2,3‐Trichloropropane 5 5 µg/kg 5 µg/L 1,2,4‐Trichlorobenzene 20 20 µg/kg 5 µg/L
Section 8 • Analytical Procedures and Quality Control
8‐6 Chemical Data Gap Investigation QAPP
Table 8‐1 Interim Screening Levels, Analytical Method Reporting Limits Soils Waters
Analyte ISL
Reporting Limit
Unit Reporting Limit
Unit
1,2,4‐Trimethylbenzene 20 20 µg/kg 5 µg/L 1,2‐Dibromo‐3‐chloropropane 20 20 µg/kg 5 µg/L 1,2‐Dibromoethane 20 20 µg/kg 5 µg/L 1,2‐Dichlorobenzene 5 5 µg/kg 5 µg/L 1,2‐Dichloroethane 5 5 µg/kg 5 µg/L 1,2‐Dichloropropane 5 5 µg/kg 5 µg/L 1,3,5‐Trimethylbenzene 20 20 µg/kg 5 µg/L 1,3‐Dichlorobenzene 5 5 µg/kg 5 µg/L 1,3‐Dichloropropane 5 5 µg/kg 5 µg/L 1,3‐Dichloropropene 2 2 µg/kg 5 µg/L 1,4‐Dichlorobenzene 5 5 µg/kg 5 µg/L 1‐Chlorohexane 2 2 µg/kg 5 µg/L 2,2‐Dichloropropane 5 5 µg/kg 5 µg/L 2‐Butanone 20 20 µg/kg 10 µg/L 2‐Chloro‐1,1,1‐trifluoroethane 5.37 5.37 µg/kg 10 µg/L 2‐Chloroethyl Vinyl Ether 53.7 53.7 µg/kg 10 µg/L 2‐Chlorotoluene 20 20 µg/kg 5 µg/L 2‐Hexanone 20 20 µg/kg 10 µg/L 4‐Chlorotoluene 20 20 µg/kg 5 µg/L 4‐Methyl‐2‐pentanone 20 20 µg/kg 10 µg/L Acrolein 100 100 µg/kg 5 µg/L Acrylonitrile 100 100 µg/kg 5 µg/L Acetone 20 20 µg/kg 20 µg/L Benzene 5 5 µg/kg 5 µg/L Bromobenzene 5.37 5.37 µg/kg 5 µg/L Bromochloromethane 5.37 5.37 µg/kg 5 µg/L Bromodichloromethane 5 5 µg/kg 5 µg/L Bromoform 5.37 5.37 µg/kg 5 µg/L Bromomethane 5.37 5.37 µg/kg 5 µg/L Carbon disulfide 5 5 µg/kg 10 µg/L Carbon Tetrachloride 5 5 µg/kg 5 µg/L Chlorobenzene 5 5 µg/kg 5 µg/L Chloroethane 5.37 5.37 µg/kg 5 µg/L Chloroform 5 5 µg/kg 5 µg/L Chloromethane 5.37 5.37 µg/kg 5 µg/L Chlorotrifluoroethene 5.37 5.37 µg/kg 5 µg/L cis‐1,2‐Dichloroethene 5 5 µg/kg 5 µg/L cis‐1,3‐Dichloropropene 5 5 µg/kg 5 µg/L Dibromochloromethane 5 5 µg/kg 5 µg/L Dibromomethane 5 5 µg/kg 5 µg/L Dichlorodifluoromethane 5.37 5.37 µg/kg 5 µg/L Di isopropyl ether 5 5 µg/kg 5 µg/L Dichlorobenzenes 10 10 µg/kg 5 µg/L Ethylbenzene 5 5 µg/kg 5 µg/L Ethyl tertiary butyl ether 5 5 µg/kg 5 µg/L Freon 113 5 5 µg/kg 5 µg/L Hexachlorobutadiene 20 20 µg/kg 5 µg/L Isopropylbenzene 20 20 µg/kg 5 µg/L Iodomethane 10 10 µg/kg 5 µg/L p‐Isopropyltoluene 20 20 µg/kg 5 µg/L m,p‐Xylene 5.37 5.37 µg/kg 5 µg/L Methyl Tertiary Butyl Ether 5.37 5.37 µg/kg 5 µg/L
Section 8 • Analytical Procedures and Quality Control
8‐7 Chemical Data Gap Investigation QAPP
Table 8‐1 Interim Screening Levels, Analytical Method Reporting Limits Soils Waters
Analyte ISL
Reporting Limit
Unit Reporting Limit
Unit
Methylene Chloride 10 10 µg/kg 5 µg/L n‐Butylbenzene 20 20 µg/kg 5 µg/L n‐Propylbenzene 20 20 µg/kg 5 µg/L o‐Xylene 5 5 µg/kg 5 µg/L sec‐Butylbenzene 20 20 µg/kg 5 µg/L Styrene 5 5 µg/kg 5 µg/L Tertiary amyl methyl ether 5 5 µg/kg 5 µg/L Tertiary butyl alcohol 5 5 µg/kg 5 µg/L tert‐Butylbenzene 20 20 µg/kg 5 µg/L Tetrachloroethene 5 5 µg/kg 5 µg/L Toluene 5 5 µg/kg 5 µg/L Total 1,2‐Dichloroethene 5 5 µg/kg 5 µg/L trans‐1,2‐Dichloroethene 5 5 µg/kg 5 µg/L trans‐1,3‐Dichloropropene 5 5 µg/kg 5 µg/L Trichloroethene 5 5 µg/kg 5 µg/L Vinyl acetate 5 5 µg/kg 5 µg/L Trichlorofluoromethane 5.37 5.37 µg/kg 5 µg/L Vinyl Chloride 5 5 µg/kg 5 µg/L 1,4‐Dioxane by EPA Method 8260B/C SIM or 8270C/D SIM 1,4‐Dioxane 13 13 µg/kg 2 µg/L Pesticides by EPA Method 8081B 4,4'‐DDD 5.13 5.13 µg/kg 0.02 µg/L 4,4'‐DDE 5.13 5.13 µg/kg 0.02 µg/L 4,4'‐DDT 5.13 5.13 µg/kg 0.02 µg/L Aldrin 5.13 5.13 µg/kg 0.01 µg/L Alpha‐Bhc 5.13 5.13 µg/kg 0.01 µg/L Beta‐Bhc 5.13 5.13 µg/kg 0.01 µg/L Chlordane (technical) 11.3 11.3 µg/kg 0.5 µg/L Toxaphene 68.8 68.8 µg/kg 3 µg/L Delta‐BHC 10.5 10.5 µg/kg 0.01 µg/L Dieldrin 5.13 5.13 µg/kg 0.02 µg/L Endosulfan I 5.13 5.13 µg/kg 0.01 µg/L Endosulfan II 10.5 10.5 µg/kg 0.02 µg/L Endosulfan Sulfate 5.13 5.13 µg/kg 0.02 µg/L Endrin 5.13 5.13 µg/kg 0.02 µg/L Endrin Aldehyde 5.13 5.13 µg/kg 0.1 µg/L Endrin Ketone 5.13 5.13 µg/kg 0.02 µg/L Gamma‐Bhc (Lindane) 10.5 10.5 µg/kg 0.01 µg/L Heptachlor 5.13 5.13 µg/kg 0.01 µg/L Heptachlor Epoxide 5.13 5.13 µg/kg 0.01 µg/L Methoxychlor 5.13 5.13 µg/kg 0.1 µg/L Mirex 0.77 0.77 µg/kg 0.25 µg/L Herbicides by EPA Method 8151A 2,2‐Dichlor‐Propionic Acid (Dalapon) 50.7 50.7 µg/kg 2 µg/L 2,4 DB 83.7 83.7 µg/kg 4 µg/L 2,4,5‐T (Trichlorophenoxyacetic Acid) 25 25 µg/kg 1 µg/L 2,4‐D (Dichlorophenoxyacetic Acid) 25 25 µg/kg 4 µg/L Dicamba 40.6 40.6 µg/kg 2 µg/L Dichlorprop 81.1 81.1 µg/kg 4 µg/L Dinitrobutyl Phenol (Dinoseb) 25 25 µg/kg 1 µg/L MCPA (2‐Methyl‐4‐Chlorophenoxyacetic Acid) 8110 8110 µg/kg 500 µg/L MCPP 8110 8110 µg/kg 500 µg/L
Section 8 • Analytical Procedures and Quality Control
8‐8 Chemical Data Gap Investigation QAPP
Table 8‐1 Interim Screening Levels, Analytical Method Reporting Limits Soils Waters
Analyte ISL
Reporting Limit
Unit Reporting Limit
Unit
Silvex (2,4,5‐TP) 81.1 81.1 µg/kg 1 µg/L DRO ‐ diesel range organics EFH – Extractable Fuel Hydrocarbons EPA ‐ United States Environmental Protection Agency GRO ‐ gasoline range organics mg/kg ‐ milligrams per kilogram mg/L ‐ milligrams per liter ng/kg ‐ nanograms per kilogram ng/L ‐ nanograms per liter pg/L – picogram per liter µg/L – microgram per liter * ‐ 1,2 dimethylhydrazine is very unstable, monitoring for this compound using azobenzene ** ‐ These compounds are tentatively identified compound (TICs) quantified using a single point calibration ‐‐ = no value
When a positive detection is greater than the laboratory MDL, but less than the MRL goal, the value will be reported and qualified (J flagged) as an estimated concentration. MDLs are attained contingent upon instrument sensitivity and sample matrix effects. It is important to monitor the sensitivity of data‐gathering instruments to ensure data quality through constant checks of instrument performance, which is typically governed by the laboratory SOP and the analytical method.
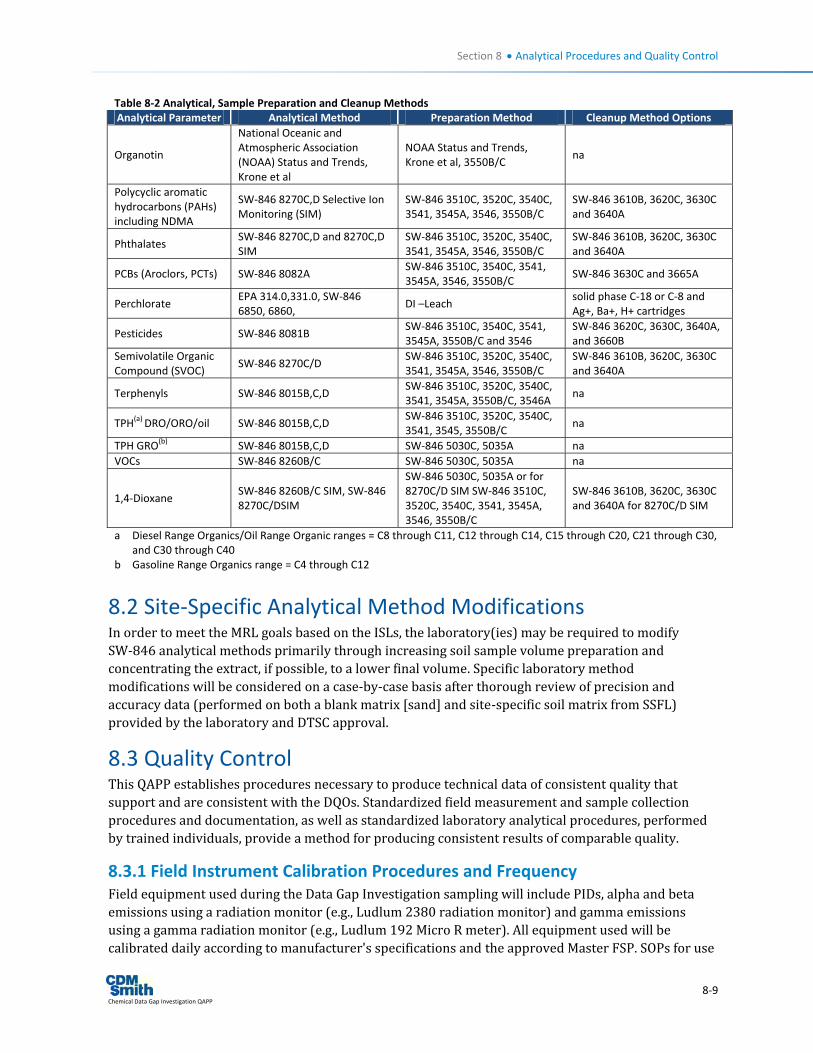
Under this QAPP, the FSP addenda will provide the rationale for the chemical analyses to be performed for each soil sample within each sub‐area. The rationale will be based on a data gap analyses and characterization (lateral and depth) considerations for each sample location. The analytical methods and associated preparation and cleanup methods being considered under this QAPP are provided in Table 8‐2.
Table 8‐2 Analytical, Sample Preparation and Cleanup Methods Analytical Parameter Analytical Method Preparation Method Cleanup Method Options Alcohols SW‐846 8015B,C,D Direct Inject ‐ DI Leach na Ammonia EPA Method 350.1 and 350.3 DI Leach na Anions EPA 300.0/9056A DI Leach na Cyanide SW‐846 9012B SW‐846 9012B ‐ Distillation na
Dioxins EPA Method 1613B SW‐846 3540C SW‐846 3610B, 3620C, 3630C and 3640A
Energetics SW‐846 8330A 8330 na Formaldehyde SW‐846 8315A SW‐846 8315A SW‐846 8315A
Glycols SW‐846 8015B,C,D SW‐846 3510C, 3520C, 3540C, 3541, 3550B/C or Acetone followed by direct injection
na
Herbicides SW‐846 8151A SW‐846 3550B/C SW‐3620C Hexavalent Chromium SW‐846 7196A, 7199 SW‐846 3060A na
Hydrazines SW‐846 8315A SW‐846 8315A (solid phase extraction)
na
Mercury SW‐846 7470A and 7471B SW‐846 7470A and 7471B (dissolution)
na
Methyl Mercury EPA Method 1630 EPA Method 1630 na Metals SW‐846 6010C and 6020A SW‐846 3010A, 3050B na
Section 8 • Analytical Procedures and Quality Control
8‐9 Chemical Data Gap Investigation QAPP
Table 8‐2 Analytical, Sample Preparation and Cleanup Methods Analytical Parameter Analytical Method Preparation Method Cleanup Method Options
Organotin
National Oceanic and Atmospheric Association (NOAA) Status and Trends, Krone et al
NOAA Status and Trends, Krone et al, 3550B/C
na
Polycyclic aromatic hydrocarbons (PAHs) including NDMA
SW‐846 8270C,D Selective Ion Monitoring (SIM)
SW‐846 3510C, 3520C, 3540C, 3541, 3545A, 3546, 3550B/C
SW‐846 3610B, 3620C, 3630C and 3640A
Phthalates SW‐846 8270C,D and 8270C,D SIM
SW‐846 3510C, 3520C, 3540C, 3541, 3545A, 3546, 3550B/C
SW‐846 3610B, 3620C, 3630C and 3640A
PCBs (Aroclors, PCTs) SW‐846 8082A SW‐846 3510C, 3540C, 3541, 3545A, 3546, 3550B/C
SW‐846 3630C and 3665A
Perchlorate EPA 314.0,331.0, SW‐846 6850, 6860,
DI –Leach solid phase C‐18 or C‐8 and Ag+, Ba+, H+ cartridges
Pesticides SW‐846 8081B SW‐846 3510C, 3540C, 3541, 3545A, 3550B/C and 3546
SW‐846 3620C, 3630C, 3640A, and 3660B
Semivolatile Organic Compound (SVOC)
SW‐846 8270C/D SW‐846 3510C, 3520C, 3540C, 3541, 3545A, 3546, 3550B/C
SW‐846 3610B, 3620C, 3630C and 3640A
Terphenyls SW‐846 8015B,C,D SW‐846 3510C, 3520C, 3540C, 3541, 3545A, 3550B/C, 3546A
na
TPH(a) DRO/ORO/oil SW‐846 8015B,C,D SW‐846 3510C, 3520C, 3540C, 3541, 3545, 3550B/C
na
TPH GRO(b) SW‐846 8015B,C,D SW‐846 5030C, 5035A na VOCs SW‐846 8260B/C SW‐846 5030C, 5035A na
1,4‐Dioxane SW‐846 8260B/C SIM, SW‐846 8270C/DSIM
SW‐846 5030C, 5035A or for 8270C/D SIM SW‐846 3510C, 3520C, 3540C, 3541, 3545A, 3546, 3550B/C
SW‐846 3610B, 3620C, 3630C and 3640A for 8270C/D SIM
a Diesel Range Organics/Oil Range Organic ranges = C8 through C11, C12 through C14, C15 through C20, C21 through C30, and C30 through C40
b Gasoline Range Organics range = C4 through C12
8.2 Site‐Specific Analytical Method Modifications In order to meet the MRL goals based on the ISLs, the laboratory(ies) may be required to modify SW‐846 analytical methods primarily through increasing soil sample volume preparation and concentrating the extract, if possible, to a lower final volume. Specific laboratory method modifications will be considered on a case‐by‐case basis after thorough review of precision and accuracy data (performed on both a blank matrix [sand] and site‐specific soil matrix from SSFL) provided by the laboratory and DTSC approval.
8.3 Quality Control This QAPP establishes procedures necessary to produce technical data of consistent quality that support and are consistent with the DQOs. Standardized field measurement and sample collection procedures and documentation, as well as standardized laboratory analytical procedures, performed by trained individuals, provide a method for producing consistent results of comparable quality.
8.3.1 Field Instrument Calibration Procedures and Frequency Field equipment used during the Data Gap Investigation sampling will include PIDs, alpha and beta emissions using a radiation monitor (e.g., Ludlum 2380 radiation monitor) and gamma emissions using a gamma radiation monitor (e.g., Ludlum 192 Micro R meter). All equipment used will be calibrated daily according to manufacturer's specifications and the approved Master FSP. SOPs for use
Section 8 • Analytical Procedures and Quality Control
8‐10 Chemical Data Gap Investigation QAPP
and calibration of the instruments are provided in Appendix D of the Master FSP. All field equipment and instrumentation will receive routine maintenance and at a minimum will be inspected for usable condition and calibration status prior to each field use. SOPs for documentation of these activities are provided in the Master FSP Appendix D.
8.3.2 Quality Control for Field Measurements If an instrument (PID or alpha and beta emissions using a radiation monitor [e.g., Ludlum 2380 radiation monitor] and gamma emissions using a gamma radiation monitor [e.g., Ludlum 192 Micro R meter]) is found upon calibration to be outside of calibration criteria, the instrument will be immediately taken out of service and subject to corrective action in accordance to Section 14. When used for selection of sampling points, replicate measurements on site samples and continuing calibrations will be used to verify the accuracy of measurements. Ambient measurements will be taken daily to establish daily site background conditions.
8.3.3 Field Quality Control Samples and Frequencies The following types of field QC samples will be required during sampling. All QC samples will be analyzed for the same parameters as the primary samples except trip blanks, which will only be analyzed for VOCs, 1,4‐dioxane, and total petroleum hydrocarbon‐gasoline range organics (TPH‐GRO). Table 8‐3 presents the measurement performance criteria for the required field QC samples.
8.3.3.1 Field Duplicate Soil duplicates will be collected in separate containers, but from the same location and sample aliquot as the original primary samples. The duplicate samples will be analyzed as a separate sample from the primary samples. This type of field duplicate measures the total system variability (field and laboratory variance), including the variability component resulting from the inherent heterogeneity of the soil. Field duplicates will be collected at a frequency of 1 per 20 primary soil samples.
8.3.3.2 Equipment Rinsate Blank An equipment rinsate blank will be prepared and submitted for analysis at a minimum frequency of one per week per sampling technique and additionally whenever there are changes in the sample collection procedures, sampling decontamination procedures, or sampling equipment. The equipment rinsate blank will consist of American Society for Testing and Materials (ASTM) Type II water used to rinse sampling equipment as the last step in the decontamination process. The equipment rinsate blank will be analyzed for the same chemical parameters that the soil samples collected during that week of sampling area analyzed for. This QC sample serves as a check for effectiveness of the decontamination process.
8.3.3.3 Trip Blank A trip blank consists of sealed container, or containers of target analyte‐free water prepared by the laboratory and delivered to the site. The unopened trip blank is shipped with the soil samples collected at the site. This QC sample serves as a check for cross‐contamination of VOCs throughout transport. Trip blanks will be submitted to the laboratory at a frequency of one per cooler for those coolers containing samples to be analyzed for VOC, 1,4‐dioxane, and TPH‐GRO analyses only.
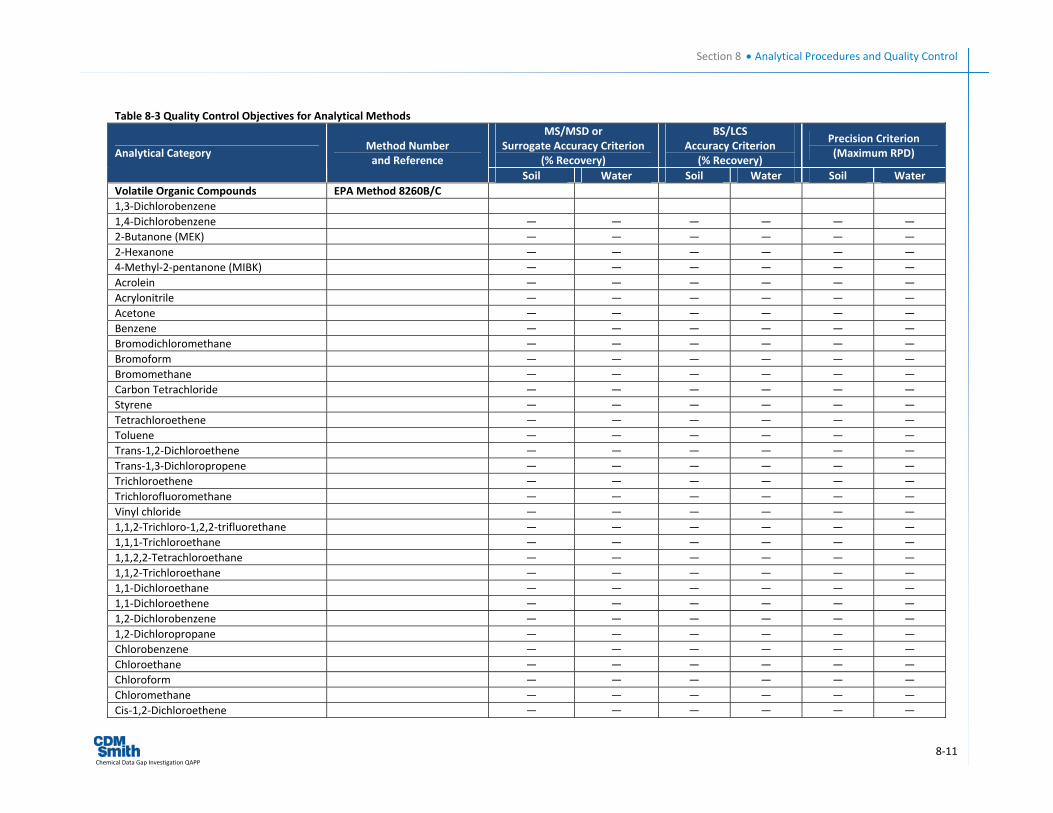
Section 8 • Analytical Procedures and Quality Control
8‐11 Chemical Data Gap Investigation QAPP
Table 8‐3 Quality Control Objectives for Analytical Methods MS/MSD or
Surrogate Accuracy Criterion (% Recovery)
BS/LCS Accuracy Criterion
(% Recovery)
Precision Criterion (Maximum RPD) Analytical Category
Method Number and Reference
Soil Water Soil Water Soil Water Volatile Organic Compounds EPA Method 8260B/C 1,3‐Dichlorobenzene 1,4‐Dichlorobenzene — — — — — — 2‐Butanone (MEK) — — — — — — 2‐Hexanone — — — — — — 4‐Methyl‐2‐pentanone (MIBK) — — — — — — Acrolein — — — — — — Acrylonitrile — — — — — — Acetone — — — — — — Benzene — — — — — — Bromodichloromethane — — — — — — Bromoform — — — — — — Bromomethane — — — — — — Carbon Tetrachloride — — — — — — Styrene — — — — — — Tetrachloroethene — — — — — — Toluene — — — — — — Trans‐1,2‐Dichloroethene — — — — — — Trans‐1,3‐Dichloropropene — — — — — — Trichloroethene — — — — — — Trichlorofluoromethane — — — — — — Vinyl chloride — — — — — — 1,1,2‐Trichloro‐1,2,2‐trifluorethane — — — — — — 1,1,1‐Trichloroethane — — — — — — 1,1,2,2‐Tetrachloroethane — — — — — — 1,1,2‐Trichloroethane — — — — — — 1,1‐Dichloroethane — — — — — — 1,1‐Dichloroethene — — — — — — 1,2‐Dichlorobenzene — — — — — — 1,2‐Dichloropropane — — — — — — Chlorobenzene — — — — — — Chloroethane — — — — — — Chloroform — — — — — — Chloromethane — — — — — — Cis‐1,2‐Dichloroethene — — — — — —
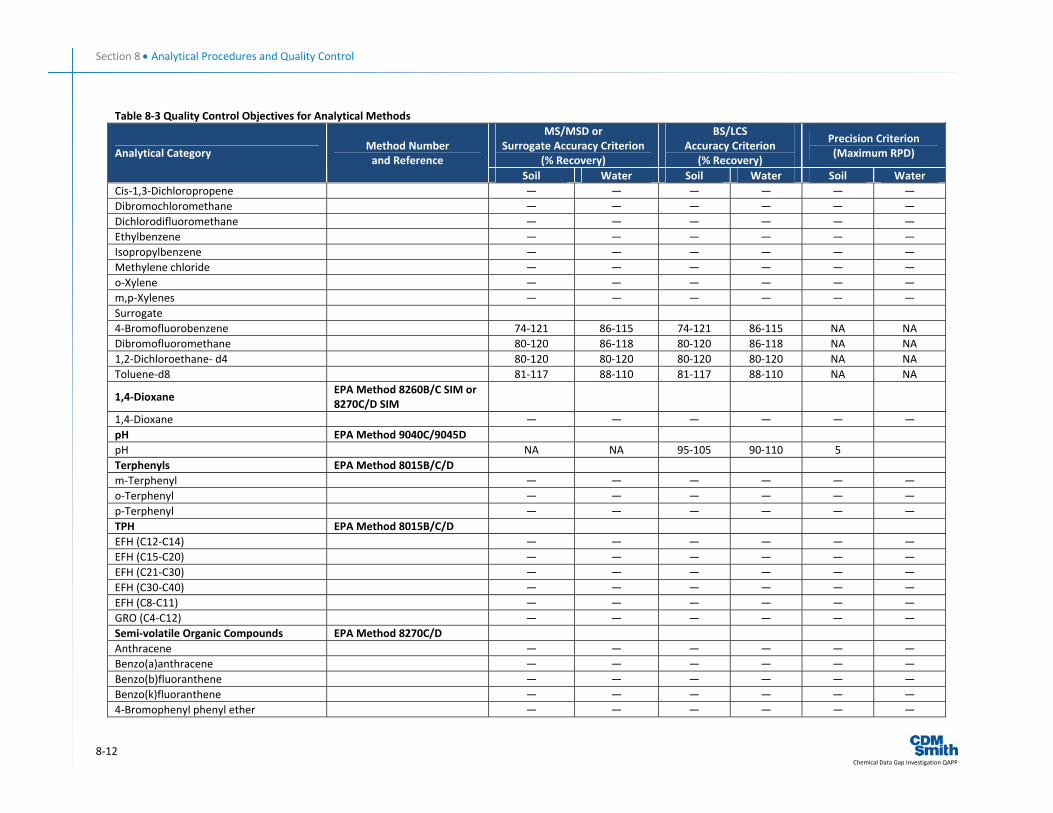
Section 8 • Analytical Procedures and Quality Control
8‐12 Chemical Data Gap Investigation QAPP
Table 8‐3 Quality Control Objectives for Analytical Methods MS/MSD or
Surrogate Accuracy Criterion (% Recovery)
BS/LCS Accuracy Criterion
(% Recovery)
Precision Criterion (Maximum RPD) Analytical Category
Method Number and Reference
Soil Water Soil Water Soil Water Cis‐1,3‐Dichloropropene — — — — — — Dibromochloromethane — — — — — — Dichlorodifluoromethane — — — — — — Ethylbenzene — — — — — — Isopropylbenzene — — — — — — Methylene chloride — — — — — — o‐Xylene — — — — — — m,p‐Xylenes — — — — — — Surrogate 4‐Bromofluorobenzene 74‐121 86‐115 74‐121 86‐115 NA NA Dibromofluoromethane 80‐120 86‐118 80‐120 86‐118 NA NA 1,2‐Dichloroethane‐ d4 80‐120 80‐120 80‐120 80‐120 NA NA Toluene‐d8 81‐117 88‐110 81‐117 88‐110 NA NA
1,4‐Dioxane EPA Method 8260B/C SIM or 8270C/D SIM
1,4‐Dioxane — — — — — — pH EPA Method 9040C/9045D pH NA NA 95‐105 90‐110 5 Terphenyls EPA Method 8015B/C/D m‐Terphenyl — — — — — — o‐Terphenyl — — — — — — p‐Terphenyl — — — — — — TPH EPA Method 8015B/C/D EFH (C12‐C14) — — — — — — EFH (C15‐C20) — — — — — — EFH (C21‐C30) — — — — — — EFH (C30‐C40) — — — — — — EFH (C8‐C11) — — — — — — GRO (C4‐C12) — — — — — — Semi‐volatile Organic Compounds EPA Method 8270C/D Anthracene — — — — — — Benzo(a)anthracene — — — — — — Benzo(b)fluoranthene — — — — — — Benzo(k)fluoranthene — — — — — — 4‐Bromophenyl phenyl ether — — — — — —
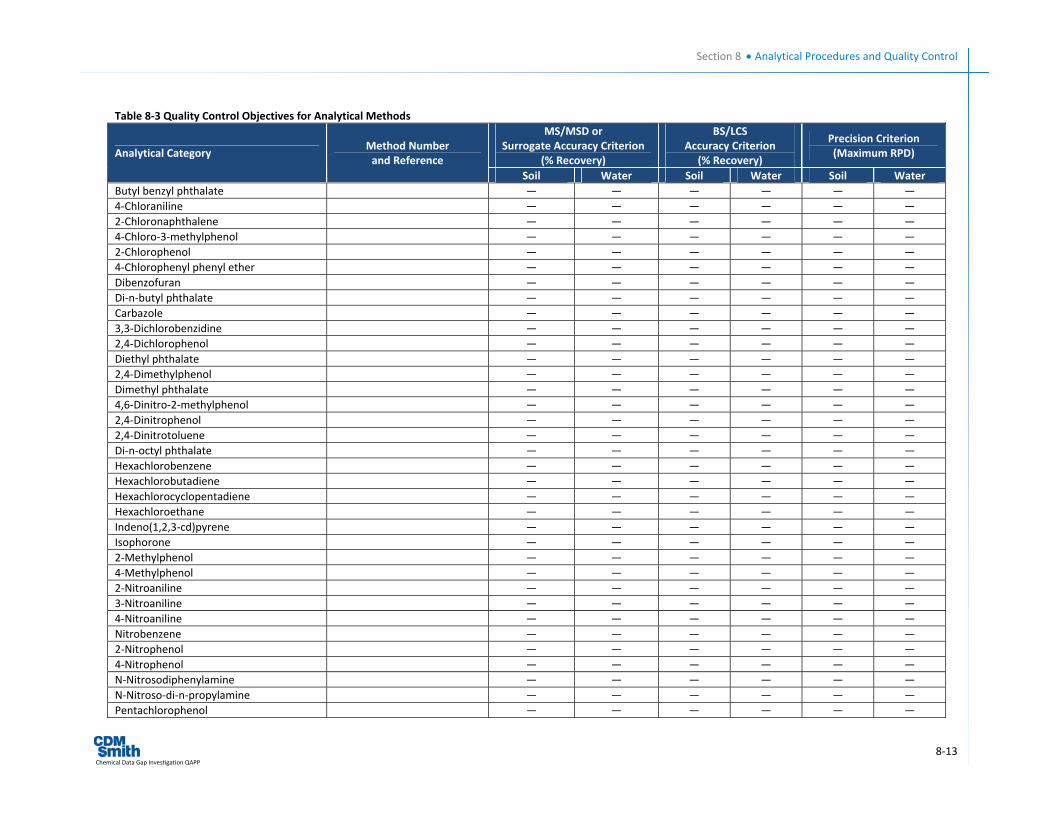
Section 8 • Analytical Procedures and Quality Control
8‐13 Chemical Data Gap Investigation QAPP
Table 8‐3 Quality Control Objectives for Analytical Methods MS/MSD or
Surrogate Accuracy Criterion (% Recovery)
BS/LCS Accuracy Criterion
(% Recovery)
Precision Criterion (Maximum RPD) Analytical Category
Method Number and Reference
Soil Water Soil Water Soil Water Butyl benzyl phthalate — — — — — — 4‐Chloraniline — — — — — — 2‐Chloronaphthalene — — — — — — 4‐Chloro‐3‐methylphenol — — — — — — 2‐Chlorophenol — — — — — — 4‐Chlorophenyl phenyl ether — — — — — — Dibenzofuran — — — — — — Di‐n‐butyl phthalate — — — — — — Carbazole — — — — — — 3,3‐Dichlorobenzidine — — — — — — 2,4‐Dichlorophenol — — — — — — Diethyl phthalate — — — — — — 2,4‐Dimethylphenol — — — — — — Dimethyl phthalate — — — — — — 4,6‐Dinitro‐2‐methylphenol — — — — — — 2,4‐Dinitrophenol — — — — — — 2,4‐Dinitrotoluene — — — — — — Di‐n‐octyl phthalate — — — — — — Hexachlorobenzene — — — — — — Hexachlorobutadiene — — — — — — Hexachlorocyclopentadiene — — — — — — Hexachloroethane — — — — — — Indeno(1,2,3‐cd)pyrene — — — — — — Isophorone — — — — — — 2‐Methylphenol — — — — — — 4‐Methylphenol — — — — — — 2‐Nitroaniline — — — — — — 3‐Nitroaniline — — — — — — 4‐Nitroaniline — — — — — — Nitrobenzene — — — — — — 2‐Nitrophenol — — — — — — 4‐Nitrophenol — — — — — — N‐Nitrosodiphenylamine — — — — — — N‐Nitroso‐di‐n‐propylamine — — — — — — Pentachlorophenol — — — — — —
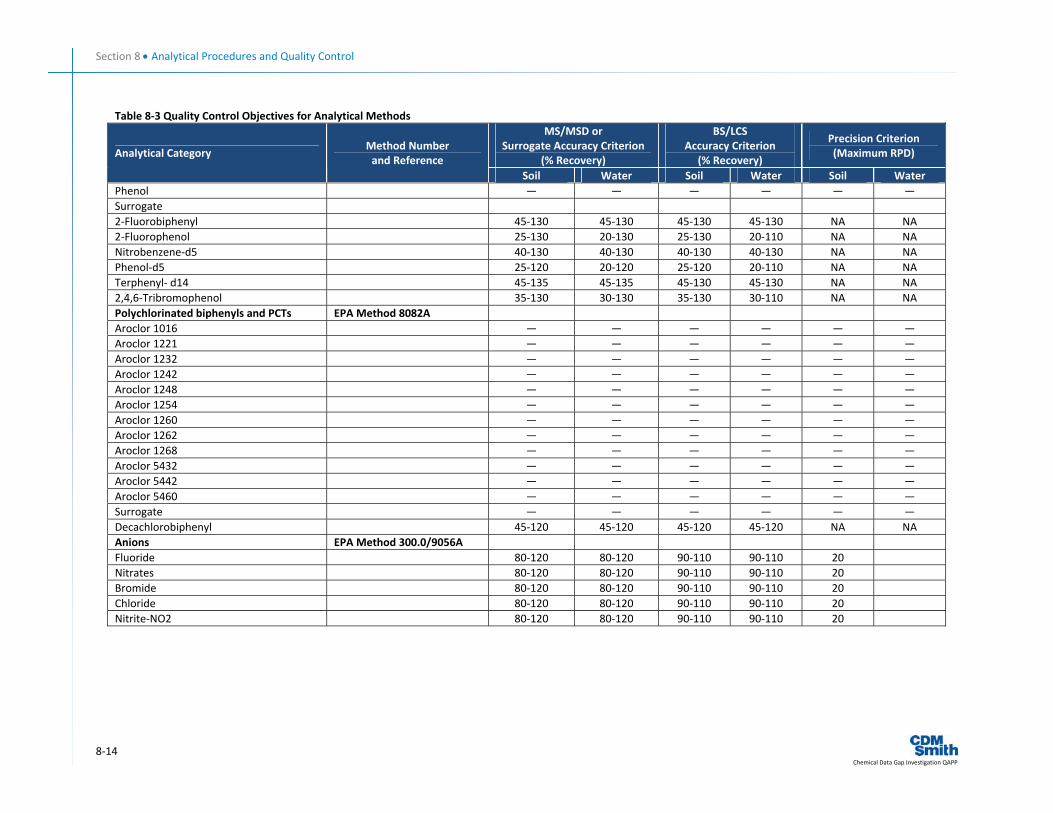
Section 8 • Analytical Procedures and Quality Control
8‐14 Chemical Data Gap Investigation QAPP
Table 8‐3 Quality Control Objectives for Analytical Methods MS/MSD or
Surrogate Accuracy Criterion (% Recovery)
BS/LCS Accuracy Criterion
(% Recovery)
Precision Criterion (Maximum RPD) Analytical Category
Method Number and Reference
Soil Water Soil Water Soil Water Phenol — — — — — — Surrogate 2‐Fluorobiphenyl 45‐130 45‐130 45‐130 45‐130 NA NA 2‐Fluorophenol 25‐130 20‐130 25‐130 20‐110 NA NA Nitrobenzene‐d5 40‐130 40‐130 40‐130 40‐130 NA NA Phenol‐d5 25‐120 20‐120 25‐120 20‐110 NA NA Terphenyl‐ d14 45‐135 45‐135 45‐130 45‐130 NA NA 2,4,6‐Tribromophenol 35‐130 30‐130 35‐130 30‐110 NA NA Polychlorinated biphenyls and PCTs EPA Method 8082A Aroclor 1016 — — — — — — Aroclor 1221 — — — — — — Aroclor 1232 — — — — — — Aroclor 1242 — — — — — — Aroclor 1248 — — — — — — Aroclor 1254 — — — — — — Aroclor 1260 — — — — — — Aroclor 1262 — — — — — — Aroclor 1268 — — — — — — Aroclor 5432 — — — — — — Aroclor 5442 — — — — — — Aroclor 5460 — — — — — — Surrogate — — — — — — Decachlorobiphenyl 45‐120 45‐120 45‐120 45‐120 NA NA Anions EPA Method 300.0/9056A Fluoride 80‐120 80‐120 90‐110 90‐110 20 Nitrates 80‐120 80‐120 90‐110 90‐110 20 Bromide 80‐120 80‐120 90‐110 90‐110 20 Chloride 80‐120 80‐120 90‐110 90‐110 20 Nitrite‐NO2 80‐120 80‐120 90‐110 90‐110 20
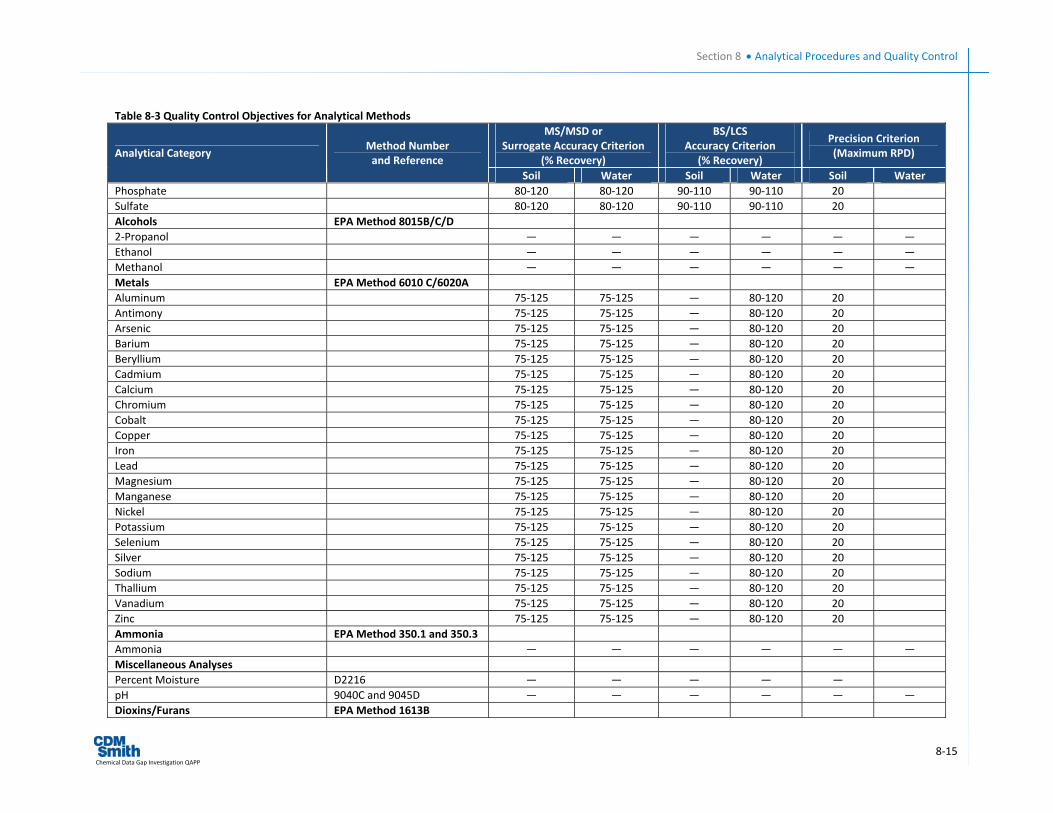
Section 8 • Analytical Procedures and Quality Control
8‐15 Chemical Data Gap Investigation QAPP
Table 8‐3 Quality Control Objectives for Analytical Methods MS/MSD or
Surrogate Accuracy Criterion (% Recovery)
BS/LCS Accuracy Criterion
(% Recovery)
Precision Criterion (Maximum RPD) Analytical Category
Method Number and Reference
Soil Water Soil Water Soil Water Phosphate 80‐120 80‐120 90‐110 90‐110 20 Sulfate 80‐120 80‐120 90‐110 90‐110 20 Alcohols EPA Method 8015B/C/D 2‐Propanol — — — — — — Ethanol — — — — — — Methanol — — — — — — Metals EPA Method 6010 C/6020A Aluminum 75‐125 75‐125 — 80‐120 20 Antimony 75‐125 75‐125 — 80‐120 20 Arsenic 75‐125 75‐125 — 80‐120 20 Barium 75‐125 75‐125 — 80‐120 20 Beryllium 75‐125 75‐125 — 80‐120 20 Cadmium 75‐125 75‐125 — 80‐120 20 Calcium 75‐125 75‐125 — 80‐120 20 Chromium 75‐125 75‐125 — 80‐120 20 Cobalt 75‐125 75‐125 — 80‐120 20 Copper 75‐125 75‐125 — 80‐120 20 Iron 75‐125 75‐125 — 80‐120 20 Lead 75‐125 75‐125 — 80‐120 20 Magnesium 75‐125 75‐125 — 80‐120 20 Manganese 75‐125 75‐125 — 80‐120 20 Nickel 75‐125 75‐125 — 80‐120 20 Potassium 75‐125 75‐125 — 80‐120 20 Selenium 75‐125 75‐125 — 80‐120 20 Silver 75‐125 75‐125 — 80‐120 20 Sodium 75‐125 75‐125 — 80‐120 20 Thallium 75‐125 75‐125 — 80‐120 20 Vanadium 75‐125 75‐125 — 80‐120 20 Zinc 75‐125 75‐125 — 80‐120 20 Ammonia EPA Method 350.1 and 350.3 Ammonia — — — — — — Miscellaneous Analyses Percent Moisture D2216 — — — — — pH 9040C and 9045D — — — — — — Dioxins/Furans EPA Method 1613B
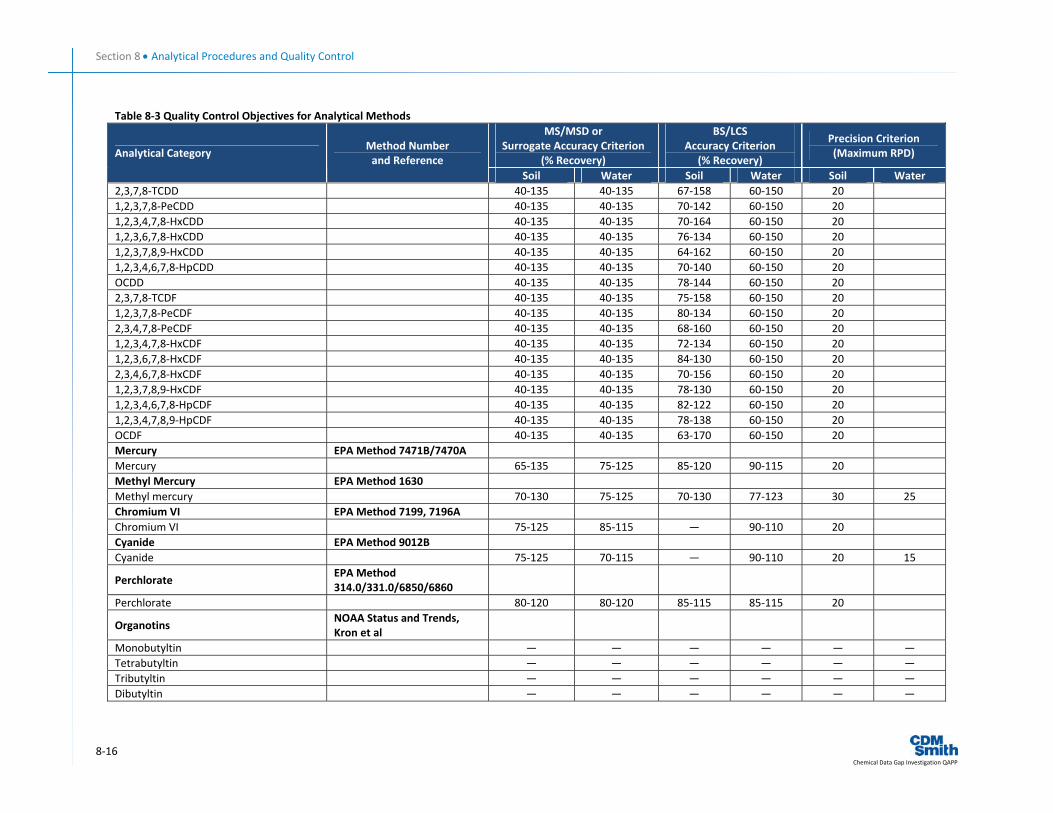
Section 8 • Analytical Procedures and Quality Control
8‐16 Chemical Data Gap Investigation QAPP
Table 8‐3 Quality Control Objectives for Analytical Methods MS/MSD or
Surrogate Accuracy Criterion (% Recovery)
BS/LCS Accuracy Criterion
(% Recovery)
Precision Criterion (Maximum RPD) Analytical Category
Method Number and Reference
Soil Water Soil Water Soil Water 2,3,7,8‐TCDD 40‐135 40‐135 67‐158 60‐150 20 1,2,3,7,8‐PeCDD 40‐135 40‐135 70‐142 60‐150 20 1,2,3,4,7,8‐HxCDD 40‐135 40‐135 70‐164 60‐150 20 1,2,3,6,7,8‐HxCDD 40‐135 40‐135 76‐134 60‐150 20 1,2,3,7,8,9‐HxCDD 40‐135 40‐135 64‐162 60‐150 20 1,2,3,4,6,7,8‐HpCDD 40‐135 40‐135 70‐140 60‐150 20 OCDD 40‐135 40‐135 78‐144 60‐150 20 2,3,7,8‐TCDF 40‐135 40‐135 75‐158 60‐150 20 1,2,3,7,8‐PeCDF 40‐135 40‐135 80‐134 60‐150 20 2,3,4,7,8‐PeCDF 40‐135 40‐135 68‐160 60‐150 20 1,2,3,4,7,8‐HxCDF 40‐135 40‐135 72‐134 60‐150 20 1,2,3,6,7,8‐HxCDF 40‐135 40‐135 84‐130 60‐150 20 2,3,4,6,7,8‐HxCDF 40‐135 40‐135 70‐156 60‐150 20 1,2,3,7,8,9‐HxCDF 40‐135 40‐135 78‐130 60‐150 20 1,2,3,4,6,7,8‐HpCDF 40‐135 40‐135 82‐122 60‐150 20 1,2,3,4,7,8,9‐HpCDF 40‐135 40‐135 78‐138 60‐150 20 OCDF 40‐135 40‐135 63‐170 60‐150 20 Mercury EPA Method 7471B/7470A Mercury 65‐135 75‐125 85‐120 90‐115 20 Methyl Mercury EPA Method 1630 Methyl mercury 70‐130 75‐125 70‐130 77‐123 30 25 Chromium VI EPA Method 7199, 7196A Chromium VI 75‐125 85‐115 — 90‐110 20 Cyanide EPA Method 9012B Cyanide 75‐125 70‐115 — 90‐110 20 15
Perchlorate EPA Method 314.0/331.0/6850/6860
Perchlorate 80‐120 80‐120 85‐115 85‐115 20
Organotins NOAA Status and Trends, Kron et al
Monobutyltin — — — — — — Tetrabutyltin — — — — — — Tributyltin — — — — — — Dibutyltin — — — — — —
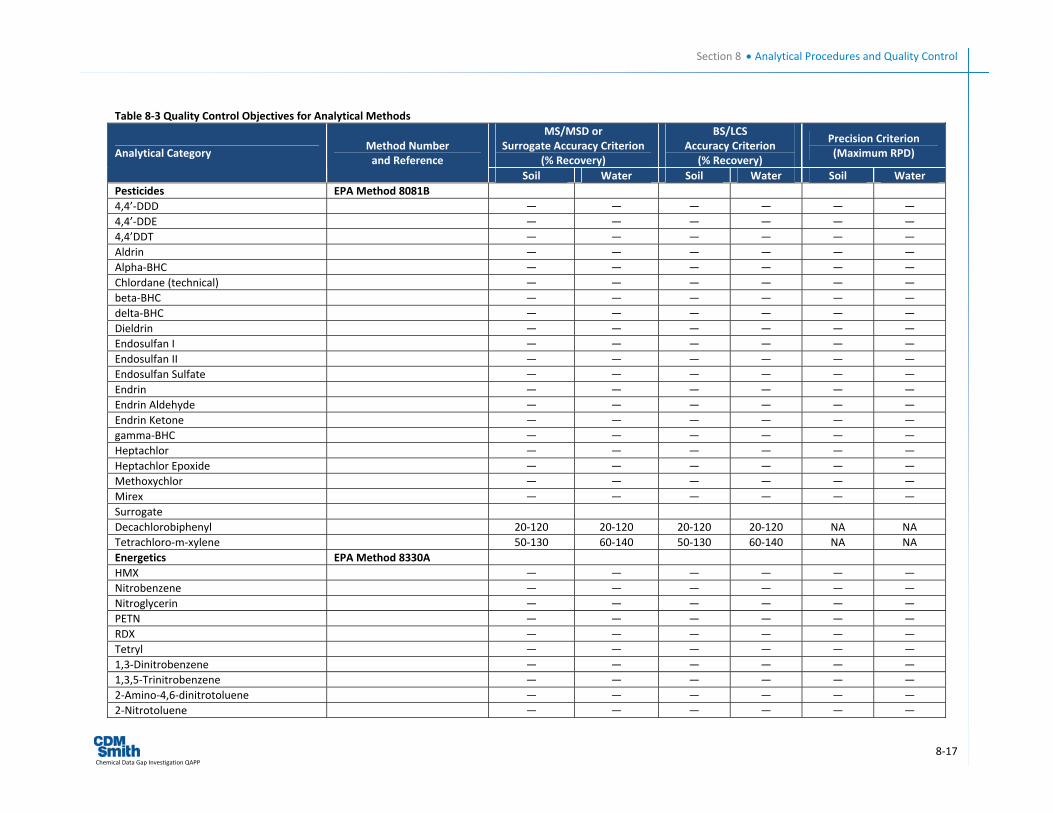
Section 8 • Analytical Procedures and Quality Control
8‐17 Chemical Data Gap Investigation QAPP
Table 8‐3 Quality Control Objectives for Analytical Methods MS/MSD or
Surrogate Accuracy Criterion (% Recovery)
BS/LCS Accuracy Criterion
(% Recovery)
Precision Criterion (Maximum RPD) Analytical Category
Method Number and Reference
Soil Water Soil Water Soil Water Pesticides EPA Method 8081B 4,4’‐DDD — — — — — — 4,4’‐DDE — — — — — — 4,4’DDT — — — — — — Aldrin — — — — — — Alpha‐BHC — — — — — — Chlordane (technical) — — — — — — beta‐BHC — — — — — — delta‐BHC — — — — — — Dieldrin — — — — — — Endosulfan I — — — — — — Endosulfan II — — — — — — Endosulfan Sulfate — — — — — — Endrin — — — — — — Endrin Aldehyde — — — — — — Endrin Ketone — — — — — — gamma‐BHC — — — — — — Heptachlor — — — — — — Heptachlor Epoxide — — — — — — Methoxychlor — — — — — — Mirex — — — — — — Surrogate Decachlorobiphenyl 20‐120 20‐120 20‐120 20‐120 NA NA Tetrachloro‐m‐xylene 50‐130 60‐140 50‐130 60‐140 NA NA Energetics EPA Method 8330A HMX — — — — — — Nitrobenzene — — — — — — Nitroglycerin — — — — — — PETN — — — — — — RDX — — — — — — Tetryl — — — — — — 1,3‐Dinitrobenzene — — — — — — 1,3,5‐Trinitrobenzene — — — — — — 2‐Amino‐4,6‐dinitrotoluene — — — — — — 2‐Nitrotoluene — — — — — —
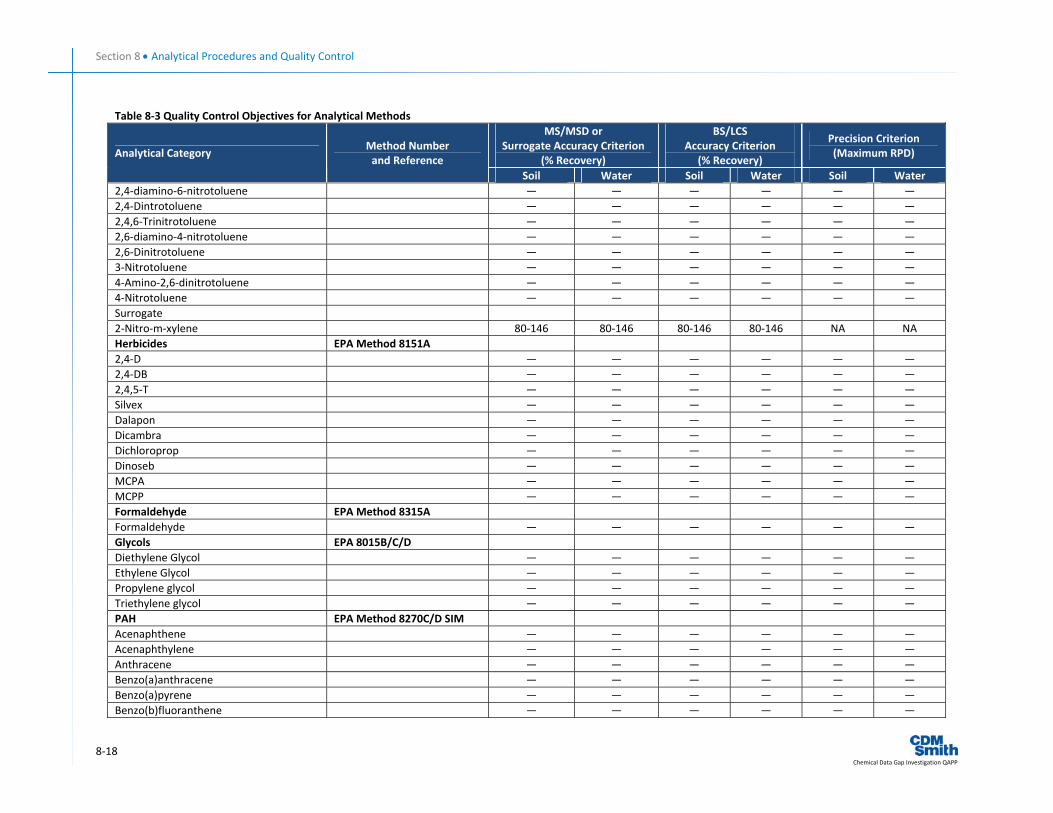
Section 8 • Analytical Procedures and Quality Control
8‐18 Chemical Data Gap Investigation QAPP
Table 8‐3 Quality Control Objectives for Analytical Methods MS/MSD or
Surrogate Accuracy Criterion (% Recovery)
BS/LCS Accuracy Criterion
(% Recovery)
Precision Criterion (Maximum RPD) Analytical Category
Method Number and Reference
Soil Water Soil Water Soil Water 2,4‐diamino‐6‐nitrotoluene — — — — — — 2,4‐Dintrotoluene — — — — — — 2,4,6‐Trinitrotoluene — — — — — — 2,6‐diamino‐4‐nitrotoluene — — — — — — 2,6‐Dinitrotoluene — — — — — — 3‐Nitrotoluene — — — — — — 4‐Amino‐2,6‐dinitrotoluene — — — — — — 4‐Nitrotoluene — — — — — — Surrogate 2‐Nitro‐m‐xylene 80‐146 80‐146 80‐146 80‐146 NA NA Herbicides EPA Method 8151A 2,4‐D — — — — — — 2,4‐DB — — — — — — 2,4,5‐T — — — — — — Silvex — — — — — — Dalapon — — — — — — Dicambra — — — — — — Dichloroprop — — — — — — Dinoseb — — — — — — MCPA — — — — — — MCPP — — — — — — Formaldehyde EPA Method 8315A Formaldehyde — — — — — — Glycols EPA 8015B/C/D Diethylene Glycol — — — — — — Ethylene Glycol — — — — — — Propylene glycol — — — — — — Triethylene glycol — — — — — — PAH EPA Method 8270C/D SIM Acenaphthene — — — — — — Acenaphthylene — — — — — — Anthracene — — — — — — Benzo(a)anthracene — — — — — — Benzo(a)pyrene — — — — — — Benzo(b)fluoranthene — — — — — —
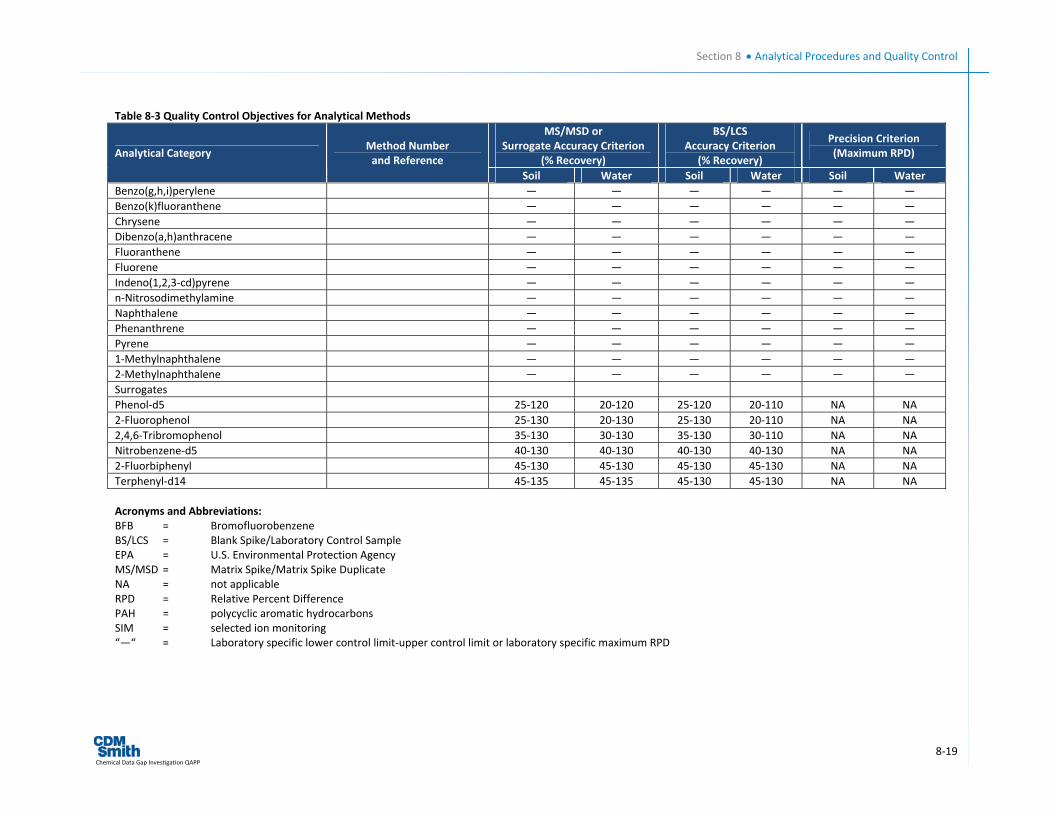
Section 8 • Analytical Procedures and Quality Control
8‐19 Chemical Data Gap Investigation QAPP
Table 8‐3 Quality Control Objectives for Analytical Methods MS/MSD or
Surrogate Accuracy Criterion (% Recovery)
BS/LCS Accuracy Criterion
(% Recovery)
Precision Criterion (Maximum RPD) Analytical Category
Method Number and Reference
Soil Water Soil Water Soil Water Benzo(g,h,i)perylene — — — — — — Benzo(k)fluoranthene — — — — — — Chrysene — — — — — — Dibenzo(a,h)anthracene — — — — — — Fluoranthene — — — — — — Fluorene — — — — — — Indeno(1,2,3‐cd)pyrene — — — — — — n‐Nitrosodimethylamine — — — — — — Naphthalene — — — — — — Phenanthrene — — — — — — Pyrene — — — — — — 1‐Methylnaphthalene — — — — — — 2‐Methylnaphthalene — — — — — — Surrogates Phenol‐d5 25‐120 20‐120 25‐120 20‐110 NA NA 2‐Fluorophenol 25‐130 20‐130 25‐130 20‐110 NA NA 2,4,6‐Tribromophenol 35‐130 30‐130 35‐130 30‐110 NA NA Nitrobenzene‐d5 40‐130 40‐130 40‐130 40‐130 NA NA 2‐Fluorbiphenyl 45‐130 45‐130 45‐130 45‐130 NA NA Terphenyl‐d14 45‐135 45‐135 45‐130 45‐130 NA NA Acronyms and Abbreviations: BFB = Bromofluorobenzene BS/LCS = Blank Spike/Laboratory Control Sample EPA = U.S. Environmental Protection Agency MS/MSD = Matrix Spike/Matrix Spike Duplicate NA = not applicable RPD = Relative Percent Difference PAH = polycyclic aromatic hydrocarbons SIM = selected ion monitoring “—“ = Laboratory specific lower control limit‐upper control limit or laboratory specific maximum RPD
Section 8 • Analytical Procedures and Quality Control
8‐20 Chemical Data Gap Investigation QAPP
8.3.3.4 Source Blank A source or field blank consists of the ASTM Type II water used by sampling personnel for equipment decontamination. This sample is used to determine chemical characteristics of the ASTM Type II water, which is placed into the sampling containers, preserved as shown on Table 5 1 of the Master FSP, and analyzed for all analytes that the soil samples may be analyzed for. This QC sample serves as a check on reagents (preservatives) and the cleanliness of the water used for decontamination. One source blank will be prepared and submitted for each lot number of ASTM Type II water used for decontamination during sampling events.
8.3.3.5 Temperature Blank A temperature blank will be used to notify the receiving laboratory if samples exceeded the acceptable temperature (0‐6 degrees centigrade) at the time of receipt. This QC measure serves as a check of adequate cooling of samples to be analyzed. Temperature blanks will be submitted to the laboratory at a frequency of one per cooler.
8.3.4 Laboratory Quality Control Samples and Frequencies Laboratory QC data are necessary to determine precision and accuracy and to demonstrate the absence of interference by and/or contamination of laboratory glassware and reagents. Table 8‐3 presents a summary of the laboratory QC samples for the chemical Data Gap Investigation and the measurement performance criteria for each type of QC sample identified. Laboratory QC results will be included in the final laboratory reports and data packages.
The types of QC spike samples the laboratory will use include, but is not limited to, LCSs (or method blank spikes), MS/MSDs, surrogate spikes, and method blanks. An LCS is a clean matrix sample (i.e., the same used for a method blank) spiked with known concentration(s) of target analyte(s). The LCS will be carried through the entire analytical procedure to assess the overall accuracy of the method. An MS is an aliquot of a parent soil sample spiked with target analyte(s) of known concentration(s) prior to sample preparation. The impact of the sample matrix on target analyte recovery (i.e., accuracy) and precision will be assessed by QC samples MS/MSDs. A surrogate is a non‐target analyte spiked at a known concentration prior to sample preparation. Surrogate analytes will be used to monitor method performance on a matrix‐specific/sample‐specific basis for samples analyzed for organic constituents only.
For the chemical Data Gap Investigation, acceptance limits for precision and accuracy for LCS/LCSDs, MS/MSDs and surrogate %Rs are presented in Table 8‐3. Each analytical preparation batch (defined as 20 field samples or less of the same matrix) must contain an LCS and MS/MSD pair and a method blank. Matrix QC samples will be analyzed with each batch of 20 samples or fewer analyzed by the laboratory. If modified methods as identified in Section 8.2 are utilized, addition laboratory QC samples are required on a per batch basis. The additional QC samples required consist of an LCS and MS sample that are spiked at the adjusted reporting limit. These QC samples are identified as RL‐LCS and RL‐MS. Because the purpose of the RL‐LCS and RL‐MS is to evaluate the effects of the modification on the accuracy and precision of the modified method, the acceptance limits for the RL‐LCS and RL‐MS will be based upon the standard laboratory control limits and considered advisory only until enough data points are established to develop method specific limits. Qualification of the sample data based on the results of the RL‐LCS and RL‐MS will be performed after a thorough review of raw data including chromatograms.
Section 8 • Analytical Procedures and Quality Control
8‐21 Chemical Data Gap Investigation QAPP
Instrument calibrations will be performed at the frequency specified in the applicable analytical methods. A calibration standard is prepared in the laboratory by dissolving a known amount of a pure compound in an appropriate matrix or dilution of commercially obtained solution. The final concentration calculated from the known quantities is the true value of the standard. Where applicable, reference standard solutions will be traceable to National Institute of Standards and Technology or another nationally recognized reference standard source. The analytical results obtained for these standards are used to prepare a standard curve and thereby quantify the compounds found in the environmental samples. The number of calibration standards and acceptance criteria is prescribed by each analytical method procedure.
In addition to the laboratory QC samples identified above, additional method prescribed QC samples including, but not limited to, internal standards (organics), recovery standards (dioxin/furans), labeling compounds (dioxins/furans), inductively coupled plasma interference check samples and serial dilutions (metals) and instrument tune standards (mass spectrometry methods) are required as prescribed in the individual analytical method procedures. The frequency and acceptance criteria are also identified in the individual methods.
9‐1 Chemical Data Gap Investigation QAPP
Section 9 Data Reduction, Validation, and Reporting
The processes for receiving, managing, validating and reporting data collected at SSFL are described below.
9.1 Laboratory Data Reports The laboratories will submit two analytical data reports to CDM Smith. The first data report (abbreviated data report) will contain a case narrative that briefly describes the numbers of samples, the analyses, and noteworthy analytical difficulties or QA/QC issues associated with the submitted samples. This abbreviated data report will include signed CoC forms, cooler receipt forms, analytical data, QC summaries including method blanks, LCS/LCSDs, MS/MSDs, lab duplicate results and other applicable QC results and an electronic copy of the data in a format compatible with the established SSFL data management system and accessible to downloading into DTSC's computer system. This abbreviated data report will also include all QC sample results and associated calculations (i.e., %R and RPD) for the previously mentioned QC parameters.
The second analytical data report (full data report), is also required to be submitted by the laboratories and must meet the EPA Level IV Quality Control reporting for raw data deliverables. The full data report shall meet the requirements of the EPA protocols identified in the EPA Contract Laboratory Program National Functional Guidelines for Inorganic Data Review (EPA 2004), EPA Contract Laboratory Program National Functional Guidelines for Superfund Organic Methods Data Review (EPA 2008), and EPA Contract Laboratory Program National Functional Guidelines for Chlorinated Dioxin/Furan Data Review (EPA 2005). Data required in this submittal that is not included in the abbreviated data reports includes but is not limited to initial and continuing calibration check standards, calibration blanks, inductively coupled plasma interference check standards, post digestion spikes, serial dilutions, recovery standards (dioxin/furans), internal standards, preparation and instrument logs, and any relevant instrument printouts.
Electronic copies of both the abbreviated and full data reports, on compact disks, will be archived by CDM Smith at an offsite storage site for a minimum of 5 years and will be made available to the regulatory agencies upon request by DOE. All project documents will be given to DOE for the Administrative Record at the end of the project. The analytical results and environmental data will be submitted to the established SSFL data management system in accordance with the semi‐colon delimited text file submittal requirements after all validated data has been verified and reviewed as complete.
9.2 Data Management In Phase 3, CDM Smith is responsible for managing field data including sample descriptions and sample coordinates. CDM Smith will use the EPA's Scribe database to manage field data and create CoCs. The field data will then be loaded into the CDM Smith's database. The laboratory will provide EDDs for use in the Automated Data Review process. After the data has been validated, the validation subcontractor will export an EDD containing validation qualifiers. The validated data will be integrated with the field data for reporting purposes and to verify all laboratory results have been received and loaded into the CDM Smith's database.
Section 9 • Data Reduction, Validation, and Reporting
9‐2 Chemical Data Gap Investigation QAPP
The laboratory will also produce a second EDD in a format directly compatible with CDM Smith's data management system. CDM Smith will load this data into the CDM Smith un‐validated database to support preliminary data evaluation. All data reported out of the un‐validated database will be identified as "Preliminary Data To Be Used With Caution" to distinguish it from the validated or final database.
CDM Smith uses an EQuIS 5.6 database to manage the SSFL data. The EQuIS database is password protected. Data is loaded by data managers and the database is maintained by a database administrator. The CDM Smith field staff, data validation coordinator, and data management team will review that data for quality and completeness using the data quality review checklist. Once the data has passed the quality review it will be available for analysis and transfer to Boeing project database. CDM Smith will be responsible for verifying that data loaded into the Boeing database is accurate and complete.
9.3 Data Validation The data validation process consists of two steps. The first step consists of determining compliance with methods, procedures, and contract requirements for sampling and analysis. The second step of the data validation process consists of comparing information collected with measurement performance criteria presented in the Master FSP and data validation guidances. Several validation inputs will be examined.
All data validation will be conducted in accordance with EPA Contract Laboratory Program National Functional Guidelines for Inorganic Data Review (EPA 2004), EPA Contract Laboratory Program National Functional Guidelines for Superfund Organic Methods Data Review (EPA 2008), and EPA Contract Laboratory Program National Functional Guidelines for Chlorinated Dioxin/Furan Data Review (EPA 2005). These documents have been used on this project for all past sampling activities and will continue to be used in order to have all data consistently validated for the life of the project.
Data validation of all samples collected during the field investigation will be performed by an independent professional data validation firm. Ninety percent of the data will be validated by ADR as a Level III validation (all QC parameters except calibrations and raw data) and 10 percent of the data will be validated as a Level IV validation (all QC parameters and raw data). The data validation firm will receive all Level IV data packages for all data in order to perform the Level IV validation and in case questions arise during the Level III validations and/or more Level IV validations are recommended due to data quality issues by the laboratories. In order to evaluate the quality of the laboratory and the validation firm, CDM Smith chemists will review 10 percent of the data per sampling area. The purpose of this review is to identify any quality issues with the laboratory, not identified by the validation firm, or any discrepancies in the validation procedures used by the validation firm. No additional qualifiers will be applied to the data based on this review. After validation is completed per area, a DUAR will be produced by CDM Smith that addresses any data quality issues and/or problems identified by the validation and the usability of the data. All EDDs will have appropriate qualifiers applied if necessary from the data validation. These qualified EDDs will be uploaded into the project database.
Section 9 • Data Reduction, Validation, and Reporting
9‐3 Chemical Data Gap Investigation QAPP
9.4 Data Reports Data reports include technical memos, letters, and full reports that transmit data and information. All data reports generated for DOE are managed in accordance with CDM Smith's Document Control procedures as described in the CDM Smith QA Manual (CDM 2007). The data reports will undergo both technical and QA reviews by reviewers who are independent of the data report and have the appropriate qualifications.
The PM is responsible for defining the reporting format, scheduling reviewers, and providing the appropriate background materials to the reviewers. The PM initiates the review by completing the top portion of the Technical/QA Review Form and submitting the draft document, the technical/QA review form, and background materials to the reviewers. Comment resolution and documentation of technical comments is performed in accordance with Quality Procedures 3.2 and 3.3 of the CDM Smith QA Manual (CDM 2007).
10‐1 Chemical Data Gap Investigation QAPP
Section 10 Internal Quality Control
CDM Smith's quality management system is designed to ensure that internal QC processes are used to foster quality work and enable checking at various points on the project. As previously mentioned, this QAPP is intended to provide QA/QC guidance for planning, executing, and checking data and field/laboratory QA during the Data Gap Investigation soil sampling efforts.
10.1 Document and Records Control The control of documents is accomplished through selective and graded implementation of the following measures:
Assignment of responsibility for preparation, review, approval, and issuance
Technical review of documents with technical content, and revisions to those documents, for adequacy, accuracy, and completeness before they are approved and issued
QA review of certain documents to ensure that QA/QC requirements are adequately addressed
Approval of documents by appropriate management before distribution
Documentation of review and approval indicated by signature (handwritten or electronic) on the document or associated review form
Controlled distribution of documents, if required
Revision of documents in a controlled and timely manner
Marking and/or disposition of obsolete or superseded documents
CDM Smith's local administrative staff has the responsibility for maintenance of the document control system for the project. Project personnel will be responsible for project documents in their possession while working on a particular task. Electronic copies of project deliverables, including graphics, will be routinely backed up and archived. Final reports will be submitted to DOE on compact disks in PDF format, but Microsoft Word for text, Microsoft Excel for certain tables, and ARCGIS for figures are available upon request by DOE.
For the purpose of this project, a record is defined as a completed, validated document and/or other material that provides objective evidence pertaining to the quality of an item or process. A document that contains objective information can become a record once it is complete and identified as a record. Records that will be controlled on this project will include at a minimum the following:
Work plans Field plans and addendums Project reports, including letter reports CoC records Audit and surveillance reports
Section 10 • Internal Quality Control
10‐2 Chemical Data Gap Investigation QAPP
Completed technical review forms and QA review forms Laboratory/data reports Comment resolutions Training records Field notebooks Change requests
On behalf of DOE, CDM Smith shall retain, as indicated by the AOC, all data, records, and documents that relate to this project for a minimum of 10 years. DOE/CDM Smith shall notify DTSC in writing 90 days prior to the destruction of any such records, and shall provide DTSC with the opportunity to take possession of any such records. Such written notification shall reference the effective date, caption, and AOC and sent to the DTSC PD.
10.2 Technical Document Review Technical document review is an independent review of a CDM Smith document with technical content by an appropriate technical staff member. The following items are a summary of the key elements of technical review:
Technical review checks on accuracy and clarity of data, calculations, interpretation, conclusions, and recommendations and ensure that the project objectives are clearly stated
Technical review comments are addressed
Technical review process is documented
10.3 QA Review QA review is an independent review of a CDM Smith document by a member of the QA staff. Typical documents requiring a QA review include technical SOPs, work plans, field plans, measurement reports, quality procedures, and documents procuring technical services. A summary of the key elements of a QA review includes:
QA reviewer must be appropriately authorized
QA review checks that an appropriate reviewer conducted the technical review
QA review checks on specific QC and QA requirements, such as a technical comment resolution and the QA section (e.g., proposed versus actual procedures)
QA review comments are addressed
QA review is documented
10.4 Data Quality Control CDM Smith is developing and maintaining a complete and accurate environmental database for the SSFL Project. This is achieved by utilizing a well documented EQuIS database structure that utilizes an Electronic Data Processor for checking data files as they are loaded and extracts data using standardized reports for consistency. The objectives of the EQuIS database QC review are:
Confirm all unvalidated data from the laboratory have been loaded
Section 10 • Internal Quality Control
10‐3 Chemical Data Gap Investigation QAPP
Confirm all validated data from the laboratory have been loaded
Confirm the number of samples collected and analyses performed for each sample in each area have all been loaded into the database
Confirm data contained on laboratory Form I results (from hard copy – limited number checked) match sample results in the database
Confirm validated sample results (from hard copy – limited number checked) match validated sample results in the database
Review the database to ensure that it meets the requirements for accurate reporting
Confirm that the data can be readily transferred for inclusion in Boeing dataset and confirm the accuracy of the transfer to Boeing
The QC processes take place at various phases of the data management work flow: field sample planning, field sample collection, data validation, database loading, database review, and reporting. The QC procedures used at each phase are detailed in the technical memorandum titled Technical and Quality Assurance Review Process Steps for Santa Susana Field Laboratory EQuIS Database. This memorandum is Attachment B of this QAPP.
11‐1 Chemical Data Gap Investigation QAPP
Section 11 Performance and Systems Audits
System assessments are qualitative reviews of different aspects of project work (e.g., field audits and office audits) to check on the use of appropriate QC measures and the functioning of the QA system. Determinations for project assessments will be performed under the direction of the CDM Smith QA manager who reports directly to the CDM Smith president. Quality Procedure 6.2, as defined in the CDM Smith QA Manual, Part Two (CDM 2007), defines CDM Smith's corporate assessments procedures and requirements.
11.1 Field Audits At least one field audit will be conducted to assess if methods and QC measures specified in the Master FSP and this QAPP are followed in the field. The auditor shall be aware of the exact fieldwork to be observed and note the specific document sections of the Work Plan including the Master FSP, FSP addenda, and QAPP that describe operating and QC procedures. Several Quality Procedures (QPs) pertain to fieldwork. If such a QP is identified in the QIP as applicable to contract work, the auditor shall evaluate the implementation (as required) of the QP for the field activities.
Auditors for field activities and laboratory operations require technical expertise specific to the activity audited and must be authorized by the CDM Smith QA manager. The PM and/or FTL are responsible for responding to and correcting any identified field audit findings. The QA coordinator is responsible for monitoring the effectiveness of the implemented corrective action. The responsibilities and procedures for planning, conducting, and closing out audits are further specified in CDM Smith's QA Manual (CDM 2007).
DOE and EPA staff will have the opportunity to review site activities and verify that the procedures described in planning documents such as this QAPP and Master FSP are followed.
11.2 Office Audit At least one office audit will be conducted at the office where the project files reside. The audit will include checking on the use of quality measures specified in the QIP, QAPP plan, and parts of the Master FSP. The office audit will involve an examination of the project documents and records.
The audit will be conducted in accordance with QP 4.5 of CDM Smith's QA Manual (CDM 2007) by a qualified auditor selected by the QA manager. The PM will be responsible for responding to and correcting any identified office audit findings. The QA coordinator is responsible for monitoring the effectiveness of the corrective action.
11.3 Laboratory Assessments Performance assessments are quantitative checks on the quality of a measurement system (e.g., proficiency testing) and will be scheduled for this project. Performance evaluation (PE) samples will be submitted to each contracted laboratory at project startup and then quarterly after receiving samples.
Section 11 • Performance and System Audits
11‐2 Chemical Data Gap Investigation QAPP
CDM Smith chemists will perform a continuous review of laboratory activities, sample logging, recording, handling, preparation, and analysis procedures to verify that the procedures described in planning documents such as the QAPP, Master FSP and FSP addenda are being followed. If the CDM Smith chemist(s) observe deviations from the planning documents, a formal performance assessment will be performed within one week.
12‐1 Chemical Data Gap Investigation QAPP—
Section 12 Preventive Maintenance
CDM Smith will maintain all field instruments and equipment based on manufacturer's recommendations. Those recommendations will be included into revisions of the Master FSP and FSP addenda, as appropriate.
13‐1 Chemical Data Gap Investigation QAPP
Section 13 Data Assessment Procedures
The data assessment process includes three distinctive steps to evaluate and ensure that project data quality will meet the project needs and requirements. The data assessment process is comprised of verification, validation, and usability assessments. Each of these is conducted to ensure that project data are of known and documented quality. The following sections provide details associated with each step in the data review process.
13.1 Field Record Verification Data verification consists of a completeness review that is performed in order to ensure that required information is available. This step provides examination of objective evidence to ensure that sampling and analytical requirements have been completed. Several inputs will be examined. Table 13‐1 provides a summary of the verification steps for this project. Field record verification is a daily activity performed by the field team leader.
13.2 Laboratory Data Validation Laboratory data validation will be conducted as described in Section 9.3.
13.3 Data Usability Assessment The DUARs will be performed on the validated data by a team of personnel at CDM Smith under the responsibility of the PM. The results of the DUAR will be presented in the measurement report and data deemed appropriate for use will be used in the project decision making process. Data qualified as rejected are considered unusable. All other data are considered to be valid and acceptable including those analytes that have been qualified as estimated or non‐detect.
The data will be reviewed with respect to the goals for the PARCCS parameters (discussed in Section 3). The measurement report will discuss:
The results of laboratory and field precision and any limitations on the use of the data
The implementation of any analytical modifications required to meet project required MRL goals
Laboratory accuracy and any limitation on the use of the data
Conclusions drawn based on the reviews of representativeness and any impacts discussed in the measurement report.
An evaluation of the impact of missing information and any project limitations with respect to completeness will be discussed in the measurement report
Any comparability limitations that are identified
The measurement report will discuss sensitivity and any impacts and limitations on the use of project data
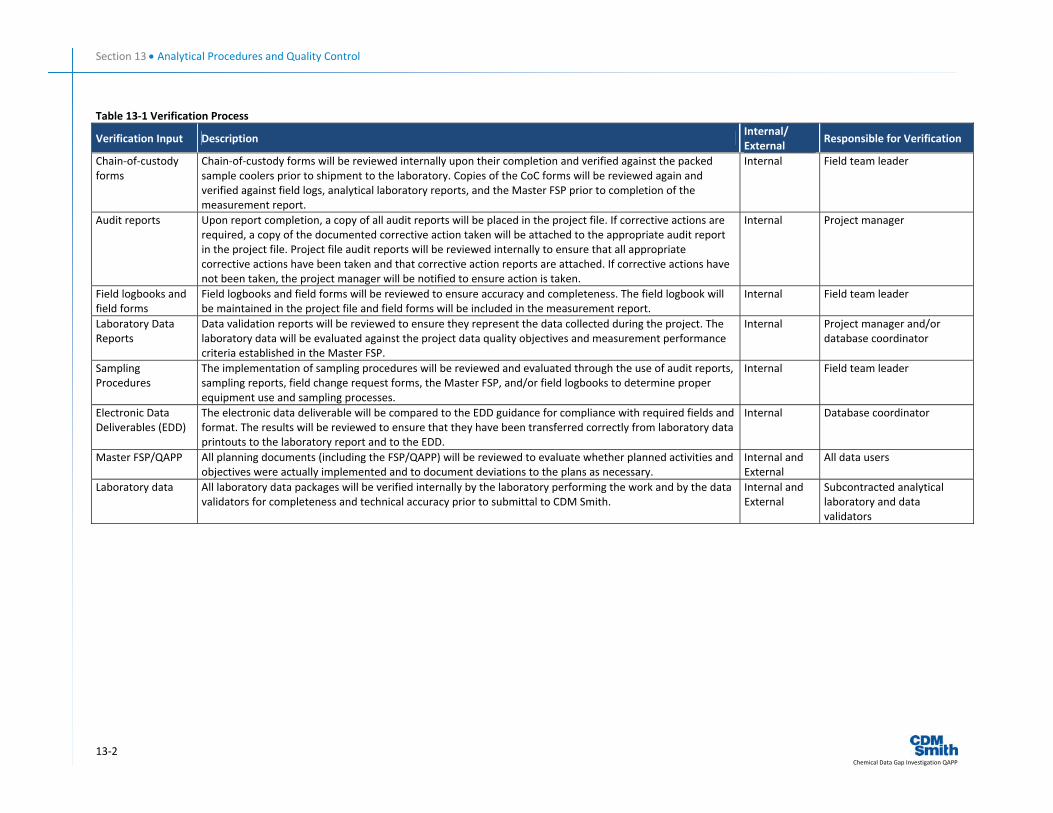
Section 13 • Analytical Procedures and Quality Control
13‐2 Chemical Data Gap Investigation QAPP
Table 13‐1 Verification Process
Verification Input Description Internal/ External
Responsible for Verification
Chain‐of‐custody forms
Chain‐of‐custody forms will be reviewed internally upon their completion and verified against the packed sample coolers prior to shipment to the laboratory. Copies of the CoC forms will be reviewed again and verified against field logs, analytical laboratory reports, and the Master FSP prior to completion of the measurement report.
Internal Field team leader
Audit reports Upon report completion, a copy of all audit reports will be placed in the project file. If corrective actions are required, a copy of the documented corrective action taken will be attached to the appropriate audit report in the project file. Project file audit reports will be reviewed internally to ensure that all appropriate corrective actions have been taken and that corrective action reports are attached. If corrective actions have not been taken, the project manager will be notified to ensure action is taken.
Internal Project manager
Field logbooks and field forms
Field logbooks and field forms will be reviewed to ensure accuracy and completeness. The field logbook will be maintained in the project file and field forms will be included in the measurement report.
Internal Field team leader
Laboratory Data Reports
Data validation reports will be reviewed to ensure they represent the data collected during the project. The laboratory data will be evaluated against the project data quality objectives and measurement performance criteria established in the Master FSP.
Internal Project manager and/or database coordinator
Sampling Procedures
The implementation of sampling procedures will be reviewed and evaluated through the use of audit reports, sampling reports, field change request forms, the Master FSP, and/or field logbooks to determine proper equipment use and sampling processes.
Internal Field team leader
Electronic Data Deliverables (EDD)
The electronic data deliverable will be compared to the EDD guidance for compliance with required fields and format. The results will be reviewed to ensure that they have been transferred correctly from laboratory data printouts to the laboratory report and to the EDD.
Internal Database coordinator
Master FSP/QAPP All planning documents (including the FSP/QAPP) will be reviewed to evaluate whether planned activities and objectives were actually implemented and to document deviations to the plans as necessary.
Internal and External
All data users
Laboratory data All laboratory data packages will be verified internally by the laboratory performing the work and by the data validators for completeness and technical accuracy prior to submittal to CDM Smith.
Internal and External
Subcontracted analytical laboratory and data validators
14‐1 Chemical Data Gap Investigation QAPP
Section 14 Corrective Actions
Quality problems or deficiencies will be identified and addressed in accordance with CDM Smith QP 8.1, Corrective and Preventive Action, of CDM Smith's Quality Procedures Manual (CDM 2007). Any conditions or problems identified during routine activities or through assessments that may impair the quality of work will be addressed through either rapid corrective response actions or formal corrective action processes. All response actions will be implemented on a case by case basis to correct quality problems.
Field audit findings are provided by the auditor to the PM and/or FTL on the day of the audit through a post‐audit debrief. Field audits are further documented via an audit report. Within 15 working days of the audit, the auditor will prepare a draft audit report for review by the QA manager. The QA manager will approve and distribute the audit report within 30 working days of the audit. If there are any unresolved deficiencies, the auditor, through a corrective action request (CAR) (Figure 14‐1), will request the audited party to take corrective action. Specific procedures for issuing and following up on corrective actions are presented in CDM Smith's QA Manual (CDM 2007). The timeframe for response to the CAR is typically 15 to 30 days from the date of the corrective action notice. The QA manager is responsible for receiving and approving the corrective action response.
Minor rapid response actions taken in the field immediately (within 24 hours) to correct a quality problem will be documented in the field logbook and verbally reported to the CDM Smith PM.
Major rapid response actions taken in the field will require notification (within 24 hours) and approval by the DOE PM, EPA PM, CDM Smith QA coordinator, and CDM Smith PM prior to implementation. Such actions may include revising procedures in the field or retesting.
Minor or major quality problems that cannot be corrected quickly through rapid routine procedures require implementation of a CAR form (see Figure 14 1).
The CAR will be initiated by the person identifying the problem and forwarded to the CDM Smith QA coordinator within 48 hours of identifying the problem. In consultation with the CDM Smith QA manager, the CDM Smith QA coordinator will be responsible for investigating and following up on the quality problem; the timeframe for response will be determined by the CDM Smith QA coordinator based on the specific quality problem.
Laboratory non‐conformance may be noted during routine data assessments and inspections and through routine planned communication calls with the contracted laboratories. In such instances, the laboratory QA manager and appropriate technical specialists will discuss the situation, and a corrective action will be initiated by CDM Smith. If necessary, an audit of the laboratory will be performed to confirm that appropriate corrective actions have been implemented.
The DOE PM will approve any major response actions in writing.
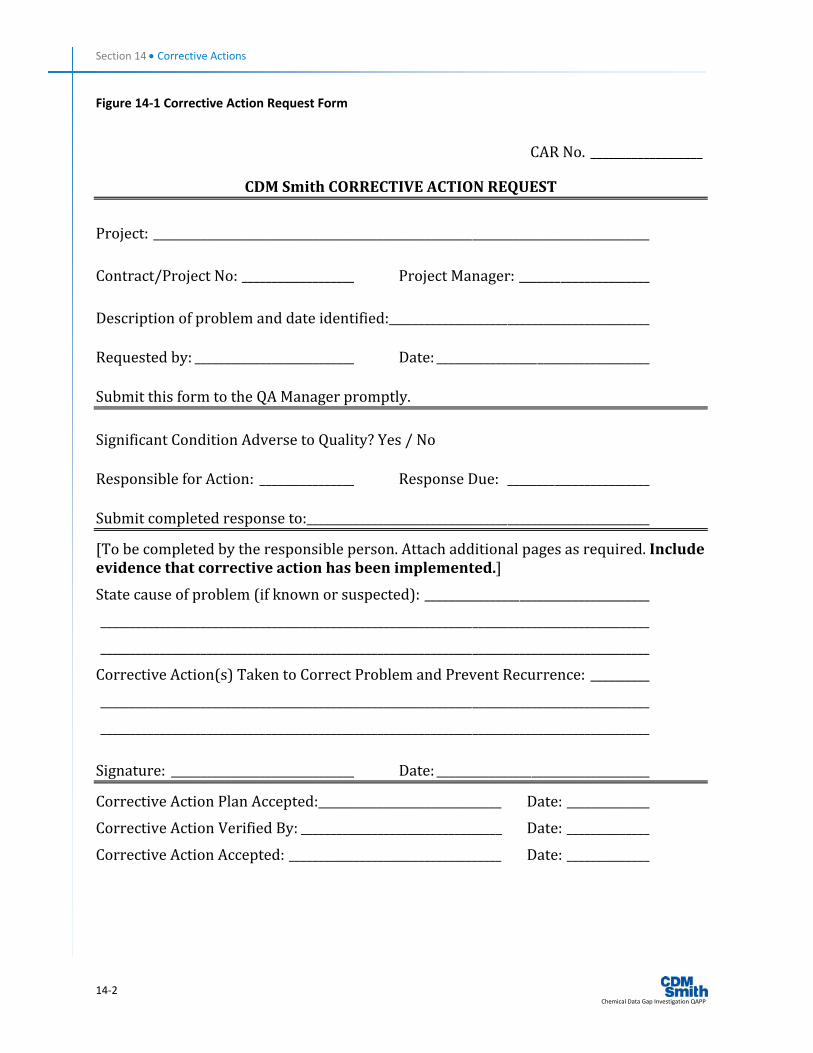
Section 14 • Corrective Actions
14‐2 Chemical Data Gap Investigation QAPP
Figure 14‐1 Corrective Action Request Form
CAR No. ___________________
CDM Smith CORRECTIVE ACTION REQUEST
Project: ____________________________________________________________________________________
Contract/Project No: ___________________ Project Manager: ______________________
Description of problem and date identified:____________________________________________
Requested by: ___________________________ Date: ____________________________________
Submit this form to the QA Manager promptly.
Significant Condition Adverse to Quality? Yes / No
Responsible for Action: ________________ Response Due: ________________________
Submit completed response to:__________________________________________________________
[To be completed by the responsible person. Attach additional pages as required. Include evidence that corrective action has been implemented.] State cause of problem (if known or suspected): ______________________________________ _____________________________________________________________________________________________ _____________________________________________________________________________________________ Corrective Action(s) Taken to Correct Problem and Prevent Recurrence: __________ _____________________________________________________________________________________________ _____________________________________________________________________________________________
Signature: _______________________________ Date: ____________________________________
Corrective Action Plan Accepted:_______________________________ Date: ______________ Corrective Action Verified By: __________________________________ Date: ______________ Corrective Action Accepted: ____________________________________ Date: ______________
15‐1 Chemical Data Gap Investigation QAPP
Section 15 Quality Assurance Reports
DOE schedules monthly interagency meetings with the DTSC and EPA PMs, of which the CDM Smith PM is a participant, to provide a verbal status report identifying activities performed, significant conversations, planned activities, and an updated schedule.
The CDM Smith PM will inform the CDM Smith QA coordinator upon encountering quality issues that cannot be immediately corrected. Monthly QA reports will be submitted to CDM Smith's QA Manager by the CDM Smith QA coordinator. These reports will be provided upon request of the DOE PM.
The measurement report (to be prepared by CDM Smith) will contain a QA section that will discuss adherence to governing documents, extent to which DQOs were met, deviations from the Master FSP and FSP addenda, data precision and accuracy goals met, and changes, if any, to the governing documents. It will also provide a summary of QA activities performed as well as a description of quality problems encountered and corrective actions implemented. QA reports and CARs will be included in the measurement report as appropriate.
16‐1 Chemical Data Gap Investigation QAPP
Section 16 References
CDM Federal Programs Corporation (CDM Smith). 2007. Quality Assurance Manual, Revision 11. March.
________. 2010. Master Work Plan/Field Sampling and Analysis Plan for Co‐Located Soil Sampling, Area IV of the Santa Susana Field Laboratory.
MECX. 2009. Quality Assurance Project Plan, Santa Susana Field Laboratory, RCRA Facility Investigation, Surficial Media Operable Unit. March.
United States Environmental Protection Agency (EPA). 2008. EPA Contract Laboratory Program National Functional Guidelines for Superfund Organic Methods Data Review.EPA‐540‐R‐08‐01. June.
________. 1993. Environmental Monitoring Systems Laboratory Office of Research and Development U.S. EPA, Cincinnati, Ohio
________. 1999. National Exposure Research Laboratory, Office of Research and Development, U.S. EPA, Cincinnati, Ohio. November
________. 2006. Guidance for the Data Quality Objectives Process, EPA QA/G‐4. Final. EPA/600/R‐96/055. August
________. 2005. EPA Contract Laboratory Program National Functional Guidelines for Chlorinated Dioxin/Furan Data Review. EPA‐540‐R‐05‐001. September.
________. 2004. EPA Contract Laboratory Program National Functional Guidelines for Inorganic Data Review. EPA 540‐R‐04‐004. October.
________. 1997. Test Methods for Evaluating Solid Waste, Physical/Chemical Methods, SW‐846, Third Edition (as updated by revisions I, II, IIA, IIB, III, IIIA, IIIB, IVA, and IVB). July.

Attachment A Appendix B
CDM Smith SSFL Quality Implementation Plan
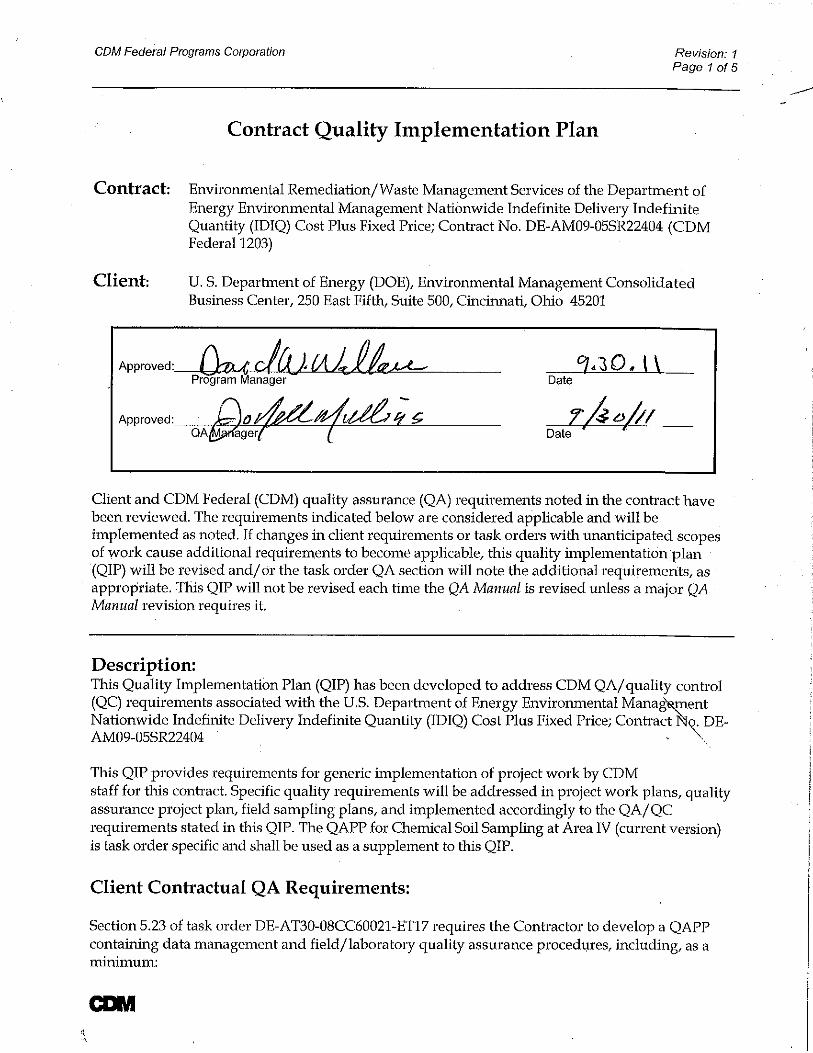
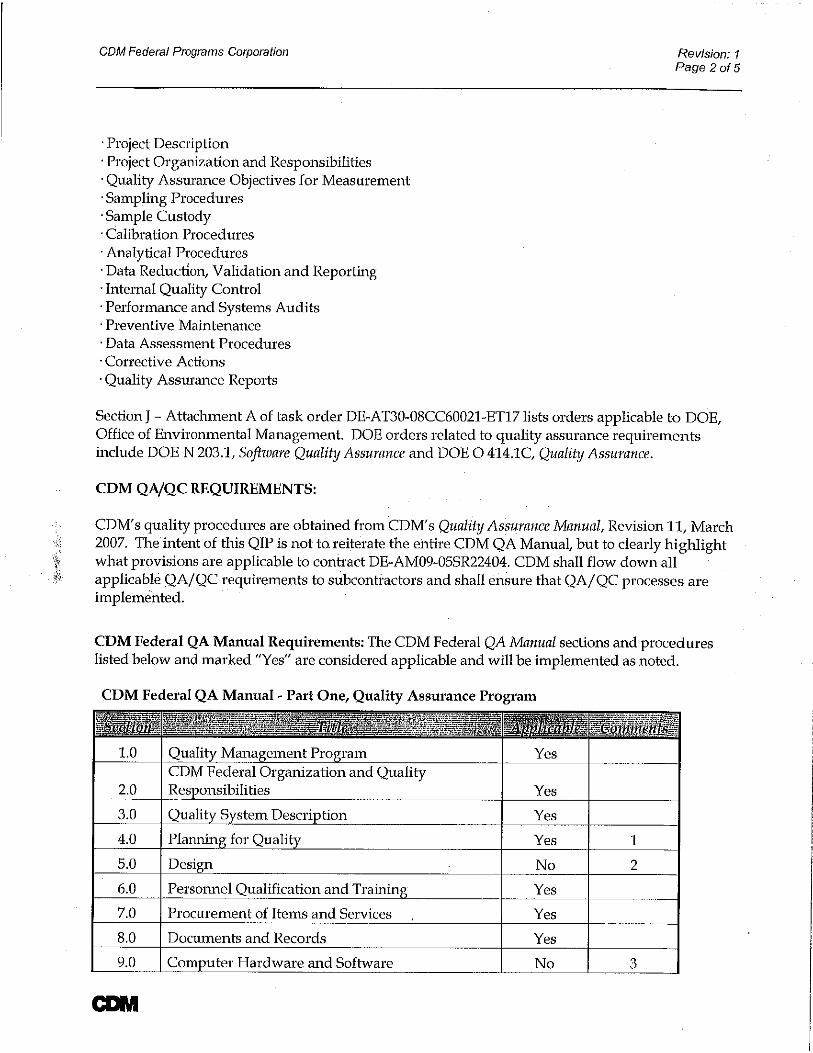
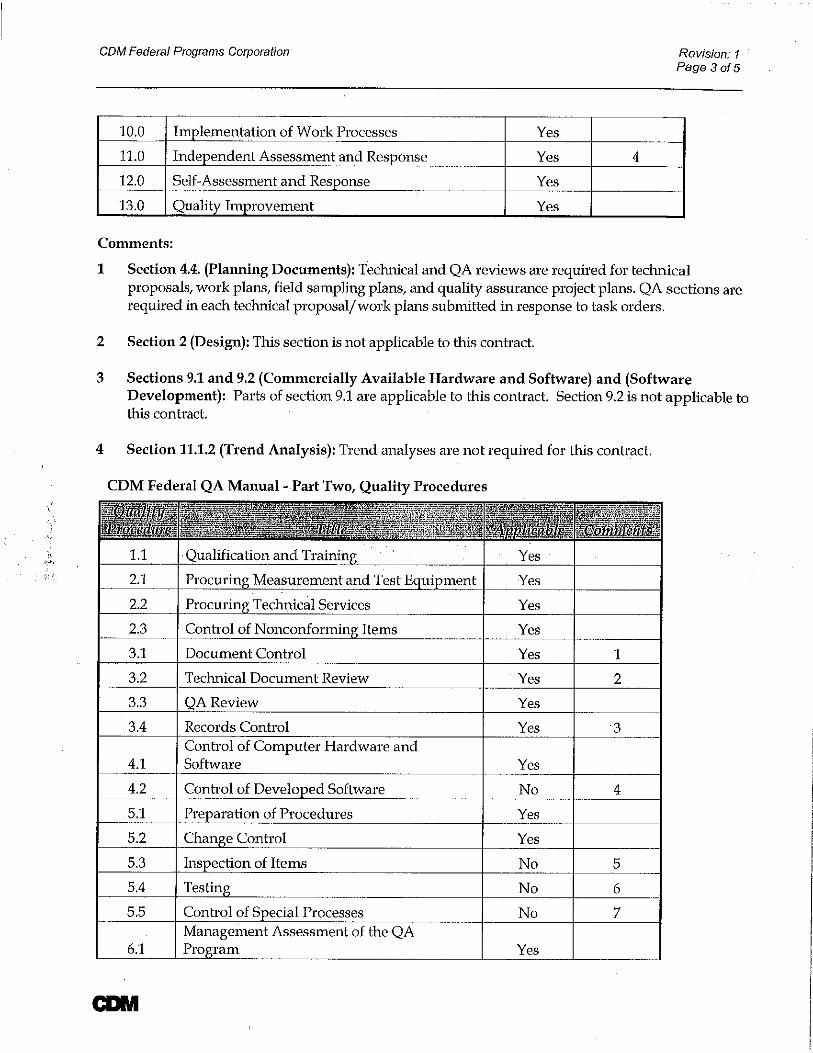
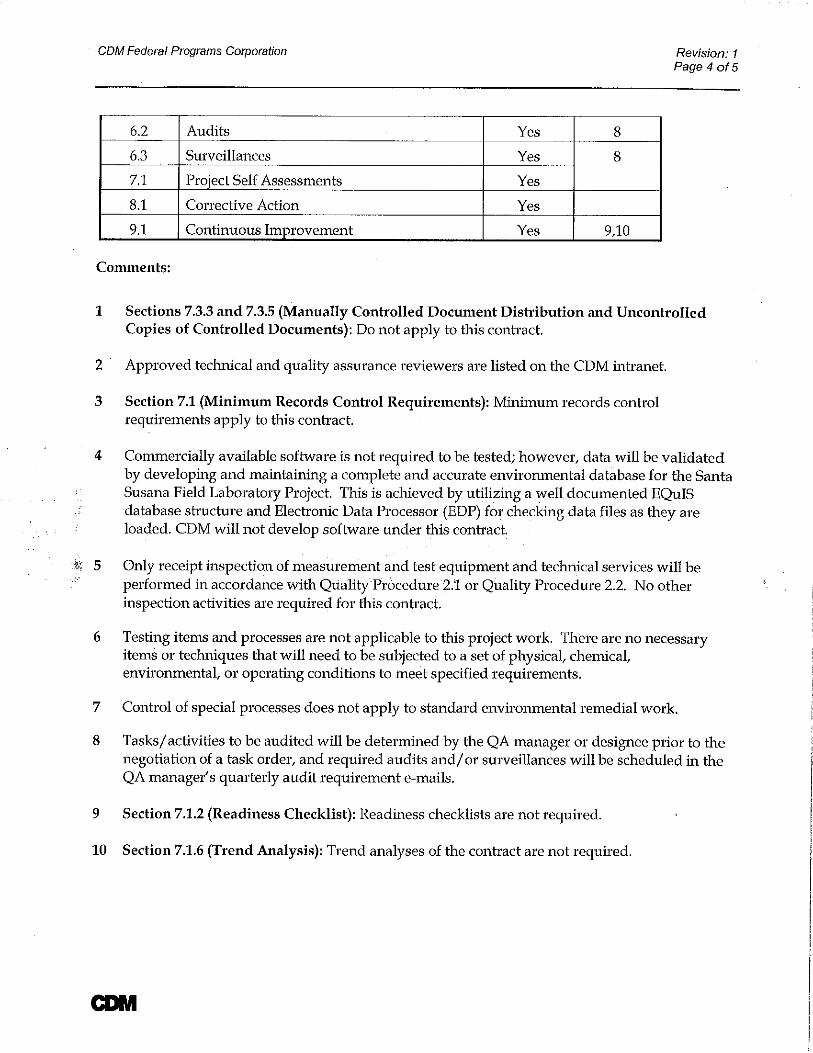
Attachment B Appendix B
Technical and Quality Assurance Review Process Steps for Santa Susana Field Laboratory (SSFL)
EQuIS Database
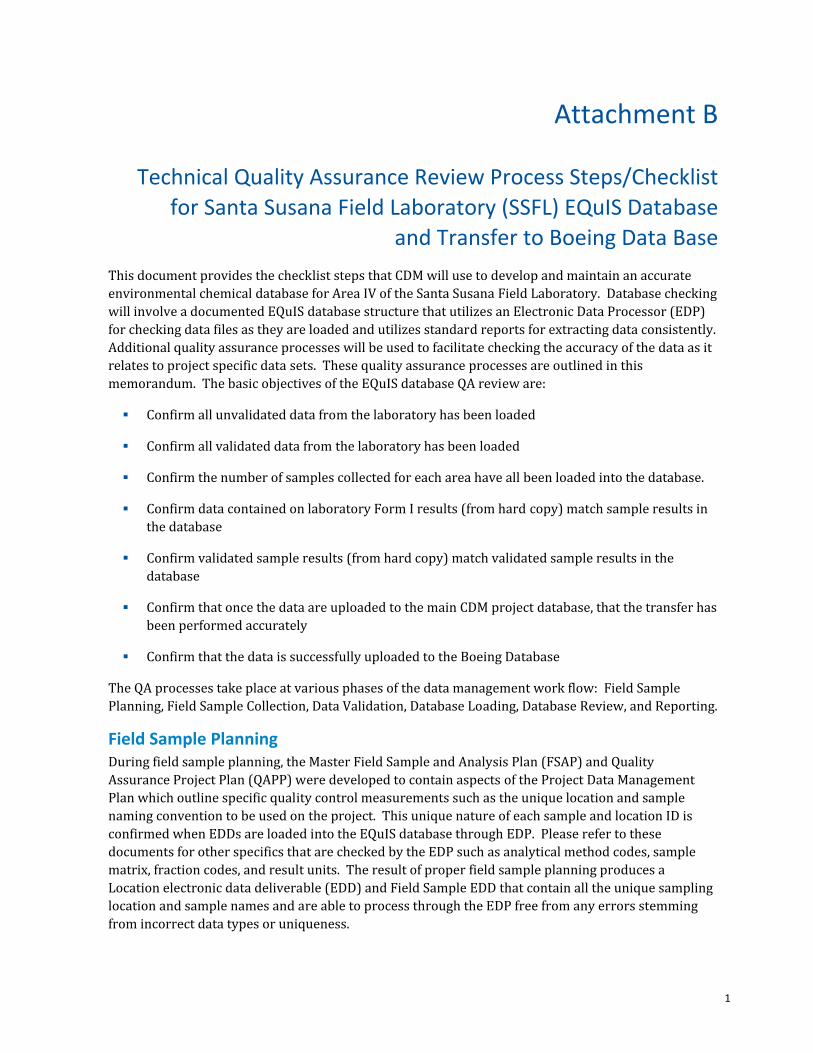
1
Attachment B
Technical Quality Assurance Review Process Steps/Checklist for Santa Susana Field Laboratory (SSFL) EQuIS Database
and Transfer to Boeing Data Base
This document provides the checklist steps that CDM will use to develop and maintain an accurate environmental chemical database for Area IV of the Santa Susana Field Laboratory. Database checking will involve a documented EQuIS database structure that utilizes an Electronic Data Processor (EDP) for checking data files as they are loaded and utilizes standard reports for extracting data consistently. Additional quality assurance processes will be used to facilitate checking the accuracy of the data as it relates to project specific data sets. These quality assurance processes are outlined in this memorandum. The basic objectives of the EQuIS database QA review are:
Confirm all unvalidated data from the laboratory has been loaded
Confirm all validated data from the laboratory has been loaded
Confirm the number of samples collected for each area have all been loaded into the database.
Confirm data contained on laboratory Form I results (from hard copy) match sample results in the database
Confirm validated sample results (from hard copy) match validated sample results in the database
Confirm that once the data are uploaded to the main CDM project database, that the transfer has been performed accurately
Confirm that the data is successfully uploaded to the Boeing Database
The QA processes take place at various phases of the data management work flow: Field Sample Planning, Field Sample Collection, Data Validation, Database Loading, Database Review, and Reporting.
Field Sample Planning During field sample planning, the Master Field Sample and Analysis Plan (FSAP) and Quality Assurance Project Plan (QAPP) were developed to contain aspects of the Project Data Management Plan which outline specific quality control measurements such as the unique location and sample naming convention to be used on the project. This unique nature of each sample and location ID is confirmed when EDDs are loaded into the EQuIS database through EDP. Please refer to these documents for other specifics that are checked by the EDP such as analytical method codes, sample matrix, fraction codes, and result units. The result of proper field sample planning produces a Location electronic data deliverable (EDD) and Field Sample EDD that contain all the unique sampling location and sample names and are able to process through the EDP free from any errors stemming from incorrect data types or uniqueness.
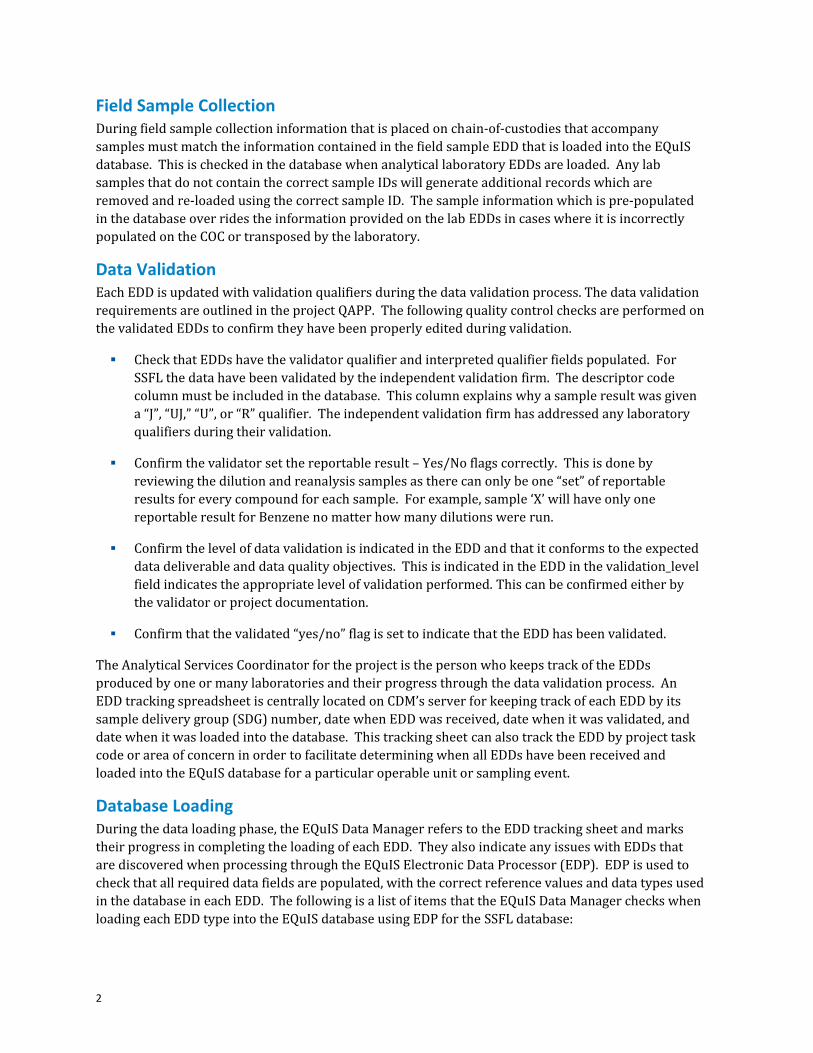
2
Field Sample Collection During field sample collection information that is placed on chain‐of‐custodies that accompany samples must match the information contained in the field sample EDD that is loaded into the EQuIS database. This is checked in the database when analytical laboratory EDDs are loaded. Any lab samples that do not contain the correct sample IDs will generate additional records which are removed and re‐loaded using the correct sample ID. The sample information which is pre‐populated in the database over rides the information provided on the lab EDDs in cases where it is incorrectly populated on the COC or transposed by the laboratory.
Data Validation Each EDD is updated with validation qualifiers during the data validation process. The data validation requirements are outlined in the project QAPP. The following quality control checks are performed on the validated EDDs to confirm they have been properly edited during validation.
Check that EDDs have the validator qualifier and interpreted qualifier fields populated. For SSFL the data have been validated by the independent validation firm. The descriptor code column must be included in the database. This column explains why a sample result was given a “J”, “UJ,” “U”, or “R” qualifier. The independent validation firm has addressed any laboratory qualifiers during their validation.
Confirm the validator set the reportable result – Yes/No flags correctly. This is done by reviewing the dilution and reanalysis samples as there can only be one “set” of reportable results for every compound for each sample. For example, sample ‘X’ will have only one reportable result for Benzene no matter how many dilutions were run.
Confirm the level of data validation is indicated in the EDD and that it conforms to the expected data deliverable and data quality objectives. This is indicated in the EDD in the validation_level field indicates the appropriate level of validation performed. This can be confirmed either by the validator or project documentation.
Confirm that the validated “yes/no” flag is set to indicate that the EDD has been validated.
The Analytical Services Coordinator for the project is the person who keeps track of the EDDs produced by one or many laboratories and their progress through the data validation process. An EDD tracking spreadsheet is centrally located on CDM’s server for keeping track of each EDD by its sample delivery group (SDG) number, date when EDD was received, date when it was validated, and date when it was loaded into the database. This tracking sheet can also track the EDD by project task code or area of concern in order to facilitate determining when all EDDs have been received and loaded into the EQuIS database for a particular operable unit or sampling event.
Database Loading During the data loading phase, the EQuIS Data Manager refers to the EDD tracking sheet and marks their progress in completing the loading of each EDD. They also indicate any issues with EDDs that are discovered when processing through the EQuIS Electronic Data Processor (EDP). EDP is used to check that all required data fields are populated, with the correct reference values and data types used in the database in each EDD. The following is a list of items that the EQuIS Data Manager checks when loading each EDD type into the EQuIS database using EDP for the SSFL database:
3
Location EDD Check that all locations have coordinates and surface elevations, and that the coordinate system
is properly identified.
Confirm horizontal collection method code, horizontal accuracy value, horizontal accuracy unit, and horizontal datum codes are all populated correctly and consistently per valid values in the database.
When an EDD has been successfully committed to the database check the number of records on dt_location, dt_sample, or dt_result against the number of records in the EDD file by ebatch number.
If there are any error records that don’t commit to the database save them to Excel and examine search for these records in the database. Understand why these records have EDP errors and refused to load. It could be because the data was already loaded in the database. Once the reason for why these records were not loaded is identified; make the necessary repairs and load the data through EDP or enter the data directly in the database.
Field Sample EDD Check that all sample codes are consistent with sample identification nomenclature defined in
the project data management plan.
Confirm sample matrix codes are populated and if possible match those values approved by the project in the SAP and QAPP.
Confirm that sample type codes correspond to sample source. For example sample type of N, FD, RB, EB, and TB would have a sample source of “FIELD” and MS, MSD, LB, LCS etc would have a sample source of “LAB”
Confirm that all MS, MSD, and FD have a parent sample code
Confirm that there is a sample date associated with each sample
Check that all samples have a location (sys_loc_code) associated with them
For soil samples confirm that all start and end depths are populated including depth unit is accurately listed.
Confirm lab analytical method codes match valid values in SAP, QAPP, and COCs (If new analytical method codes are added to the analytical method table be sure to add a descriptive name for the analytical method code to the rt_analytic_method valid value table.)
When an EDD has been successfully committed to the database check the number of records on dt_location, dt_sample, or dt_result against the number of records in the EDD file by ebatch number.
If there are any error records that don’t commit to the database save them to Excel and examine search for these records in the database. Understand why these records have EDP errors and refused to load. It could be because the data was already loaded in the database. Once the reason for why
4
these records were not loaded is identified; make the necessary repairs and load the data through EDP or enter the data directly in the database.
Laboratory Analytical EDDs If loading sample information from analytical EDD review the items listed under Field Sample
EDDs above
Confirm the type of data entry (Unvalidated data and Validated data)
Check that all sample codes are consistent with sample identification nomenclature defined in the project data management plan.
Confirm lab analytical method codes match valid values in SAP, QAPP, and COCs (If new analytical method codes are added to the analytical method lookup table be sure to add a descriptive name for the analytical method code to the rt_analytic_method valid value table.)
Confirm that sample fraction (total or dissolved) is appropriately populated
Confirm lab SDG column is populated with laboratory SDG number
Confirm that the test type column is populated consistently. Look for values other than “INITIAL” such as reanalysis, reextract, dilution, etc.
Confirm that the basis is populated with either Wet or Dry
Confirm that dilution factors are present for samples reanalyzed or diluted
Confirm CAS numbers match values in the valid value list of rt_analyte and that chemical names are spelled correctly (When a cas number is added to the rt_analyte table make sure to copy the chemical name from the EDD into the chemical name in the rt_analyte table and use standard case capitalization.)
Confirm that the result value column is empty where detect flag is set to No.
Confirm that the result value column is not empty where the detect flag is set to Y. (There may be some exceptions to this rule especially for coeluting congeners. This can be confirmed by finding the coelution peak number qualifier in the lab qualifier column.)
Confirm that result type code is populated with TRG for target compounds, SUR for surrogate compounds, SC for spiked compounds, IS for internal standards, and TIC for tentatively identified compounds
Confirm that reportable result (Yes/No) column is populated consistently to identify which results should be reported when samples are reanalyzed or diluted.
Confirm the detect Yes/No flag is correctly set to N where the interpreted qualifier is a U, UJ, or some combination containing a U otherwise it should be set to Y and a value should be present in the result value column.
Confirm the organic yes/no field is populated correctly for organic and inorganic compounds
5
Confirm that lab qualifiers, validator, interpreted qualifiers, data quality management qualifiers, and data quality management remark columns are all populated consistently for validated EDDs
Confirm whether interpreted qualifiers “R” should be listed as reportable = Yes.
Confirm that reporting detection limit is consistently populated using correct reporting limits especially where detect flag is set to No. General rule of thumb is to not use the MDL as reporting detection limits. This should be caught early when loading data but if it is identified let the analytical services coordinator know.
Confirm the method detection limit and quantitation limit columns are populated as appropriate. (The reporting detection limit is the limit that gets used for reporting non detects. In some cases the reporting detection limit is changed to the result value if the data validator wants to indicate a compound as not detected (“U” qualified) up to the result value In this case the detect yes/no flag is switched to no and the result value is removed and pasted into the reporting detection limit column.)
When an EDD has been successfully committed to the database check the number of records on dt_sample, or dt_result against the number of records in the EDD file by ebatch number.
If there are any error records that don’t commit to the database save them to Excel and examine search for these records in the database. Understand why these records have EDP errors and refused to load. It could be because the data was already loaded in the database. Once the reason for why these records were not loaded is identified; make the necessary repairs and load the data through EDP or enter the data directly in the database.
Database Review Prior to using data in the database for reports, figures, and analysis, a review of the database and the most recent data sets loaded must be completed. This database review will be conducted by someone who didn’t directly load the data and understands the importance of certain database fields that are required for the standard and customized reports to work correctly. The database review involves many of the same or similar checks the EQuIS Data Manager implements when loading data. These checks are completed again in the database to confirm correct data loading for each of the following database tables in their entirety:
Location Table, Sample Table, Test Table, Results Table Confirm facility ID column is populated with 5142 (SSFL)
Confirm facility code column is populated with SSFL validated or SSFL unvalidated
Confirm system location code column is populated with proper SSFL sample locations
Confirm location report is populated with correct report number
Confirm system sample code column is populated with proper SSFL sample names
Confirm matrix code is populated with SO or WQ
Check locations all have coordinates and coordinate system is properly identified. This review is completed by reviewing locations in GIS.
6
GIS sample information for sample location is provided in electronic format by HGL. Once plotted perform a visual check of each location to confirm the GIS has plotted it correctly.
Confirm sample matrix codes match those values approved by the project in the SAP and QAPP.
Confirm that sample type codes correspond to sample source. For example sample type of N, FD, RB, EB, and TB would have a sample source of “FIELD” and MS, MSD, LB, LCS etc would have a sample source of “LAB”
Confirm that all MS, MSD, and FD have a parent sample code
For soil samples confirm that all start and end depths are populated including depth unit is accurately listed.
Confirm lab analytical method codes match valid values in SAP, QAPP, and COCs (If new analytical method codes are added to the analytical method lookup table be sure they contain a descriptive name for the analytical method code added to the rt_analytic_method valid value table.)
Confirm that the test type column is populated consistently. Look for values other than “INITIAL” such as reanalysis, reextract, dilution, etc.
Confirm that the basis is populated with either Wet or Dry
Confirm that dilution factors are present for samples reanalyzed or diluted
Confirm CAS numbers match values in the valid value list of rt_analyte and that chemical names are spelled correctly (When a cas number is added to the rt_analyte table make sure to copy the chemical name from the EDD into the chemical name in the rt_analyte table and use standard case capitalization.)
Confirm that the result value column is only populated with values where detect flag is set to Yes (‘Y’).
Confirm that result type code is populated with TRG for target compounds, SUR for surrogate compounds, SC for spiked compounds, IS for industry standards, and TIC for tentatively identified compounds.
Confirm that the reportable result column is populated consistently for deciding which result type codes should be used in reporting.
Confirm that reportable result (Yes/No) column is populated consistently to identify which results should be reported when samples are reanalyzed or diluted.
Confirm the detect Yes/No flag is correctly set to N where the interpreted qualifier is a U, UJ, or some combination containing a U otherwise it should be set to Y and a value should be present in the result value column.
Confirm the reporting detection limit column is populated consistently, especially for all results where detect flag is equal to N.
Confirm the organic yes/no field is populated correctly for organic and inorganic compounds.
7
Confirm that lab qualifiers, validator, interpreted qualifiers, data quality management qualifiers, and data quality management remark columns are all populated consistently for validated EDDs.
Confirm the method detection limit and quantitation limit columns are populated as appropriate. (The reporting detection limit is the limit that gets used for reporting non detects. In some cases the reporting detection limit is changed to the result value if the data validator wants to indicate a compound as not detected (“U” qualified) up to the result value In this case the detect yes/no flag is switched to no and the result value is removed and pasted into the reporting detection limit column.)
Make sure the detect flag is set correctly for the various qualifier types: U, UJ, J etc. (You can check this by filtering dt_result on interpreted_qualifier = J to make sure detect flag = Y.)
Confirm whether interpreted qualifiers “R” should be listed as reportable = Yes.
Confirm that all analytical method groups have been created correctly and reviewed by an identified project team member: Metals, PCBs, VOCs, SVOCs etc.
- Confirm whether the analytical groups need to be unique per each analytical method, fraction, or matrix. If so these fields need to be populated in rt_group_member. Leaving these fields blank will allow the analytical groups to be used regardless of method, fraction and matrix.
- Use the report order and display order to order chemicals in any other fashion outside of alphabetical.
Confirm that location groups are created properly and identify whether they get set up by depth.
- Use the report order to order your sample locations in any other fashion outside of alphabetical.
- If grouping samples by depth you may need to create sample groups. If so confirm they are set up correctly and be prepared to utilize the analytical results with sample groups report.
Boeing Database Upload Review The chemical data uploaded to the Boeing master database will be checked for accuracy of data transfer. This check will involve:
Confirm that validated data only have be uploaded
Confirm transfer includes proper SSFL sample locations and coordinates
Confirm sample identifier matches proper SSFL sample names
Confirm sample matrix codes match those values approved by the project in the SAP and QAPP.
Confirm that sample type codes correspond to sample source. For example sample type of N, FD, RB, EB, and TB would have a sample source of “FIELD” and MS, MSD, LB, LCS etc would have a sample source of “LAB”
8
Confirm that all MS, MSD, and FD have a parent sample code
Confirm sample depth start and end values are correct.
Confirm lab analytical method codes are correct.
Confirm that the basis is populated with either Wet or Dry
Confirm that dilution factors are present for samples reanalyzed or diluted
Confirm CAS numbers match the analytical parameter.
Confirm that the analytical result matches the CDM database value.
Confirm the reporting detection limit column is populated correctly.
Confirm that lab qualifiers, validator, interpreted qualifiers, data quality management qualifiers, and data quality management remark columns are correct.
Confirm the method detection limit and quantitation limit columns are correct.
Reporting and Production of Client Deliverables Figures, tables, and maps that make use of data in the database are considered client database deliverables. Exports of data in an EDD format, for delivery to a client, subcontractor, or partner agency for upload into their database are also considered client database deliverables. When a request is made for a client database deliverable it is important that the following information be gathered and understood from the person making the request.
Confirm the type of deliverable (Table, EDD, Figure, Map or other‐list) Some examples of reports used in support of Santa Susana Field Laboratory project may include:
- Grid Report – An inventory of all samples and analyses currently loaded in the EQuIS database - Analytical Results Report – A comprehensive data table of all results, detects and non‐detects,
by sample and analyses. Run using analytical method groups, location groups and/or sample groups.
- Analytical Results Hits Report – Similar to the Analytical Results Report but only includes chemicals where there is at least one detected result.
- Action Level Exceedance Report – A report with the same structure as the Analytical Results Report but will compare result values against selected screening criteria.
- Basic Statistics Report – A report which calculates the Minimum Result Detected and Qualifier, Maximum Result Detected and Qualifier, Result Units, Location of Maximum Result Detected, Start Depth of Maximum Result Detected, End Depth of Maximum Result Detected, Number of Detections, Number of Samples, Minimum Method Detection Limit, Maximum Method Detection Limit, Minimum Reporting Limit, and Maximum Reporting Limit.
- Advanced Statistics Report – Similar to the Basic Statistics Report but draws comparison of results against screening criteria to indicate exceedances.
9
- Completeness tables which include a break out of data quality management remarks by remark.
- A usable database format to be delivered to Montgomery Watson. - Perform and confirm a successful upload of the data to the Boeing Database.
Confirm the types of samples such as normal environmental samples, field QC samples (Trip blanks, field duplicates, equipment blanks, rinse blanks), and lab QC samples (matrix spike, matrix spike duplicate, lab control samples) are needed in the deliverable.
Confirm the locations, area of concern, or other grouping of data such as task code.
Confirm the analytical methods required for the data deliverable.
Confirm the compound CAS#s used in the data deliverable.
Confirm the units being requested match the units in the database and deliverable. Units in the deliverable should be consistent.
Confirm that only target results are needed and not TICs, Surrogates, Internal Standards, other laboratory QC results or Calculated Values are needed.
Confirm that values used in Excel calculations are in number format and not text.
Review the logic and results of all initial data queries to a level that reflects the complexity of the query. For example step through each query variable individually and in relation to the other variables.
Confirm the number of significant figures to use in reports, maps, and figures.
Confirm that there are not any duplicate values in a cell. If there are investigate this in the database.
Check some of the values of the data set against the hard copy lab or data summary report.
Check historical concentration data on maps and tables in previous hard copy reports if available.
Confirm that the client ready tables or EDDs meet the expectations of the request, such as format and completeness.
10
The signoff for report technical and quality assurance review should include:
Date of deliverable _________________________
Requestor ____________________________
Preparer _____________________________
Reviewer _____________________________
Reviewer Qualification ____________________(Data manager, Chemist, GIS or other‐list)
The preparer of the deliverable will review all of these QC steps with the requestor prior to the data set to be used in the client database deliverable. The database task leader will also review these steps with the preparer to make sure the database deliverable is in compliance with these steps.