Embed Size (px)
Citation preview
Telecommunication Systems manuscript No.(will be inserted by the editor)
Quality Assessment and Usage Behavior of a MobileVoice-over-IP service.
Toon De Pessemier · Isabelle Stevens · Lieven De Marez · Luc
Martens · Wout Joseph
Received: date / Accepted: date
Abstract Voice-over-IP (VoIP) services offer users a
cheap alternative to the traditional mobile operators to
make voice calls. Due to the increased capabilities and
connectivity of mobile devices, these VoIP services are
becoming increasingly popular on the mobile platform.
Understanding the user’s usage behavior and quality
assessment of the VoIP service plays a key role in op-
timizing the Quality of Experience (QoE) and making
the service to succeed or to fail.
By analyzing the usage and quality assessments of
a commercial VoIP service, this paper identifies device
characteristics, context parameters, and user aspects
that influence the usage behavior and experience during
VoIP calls. Whereas multimedia services are tradition-
ally evaluated by monitoring usage and quality for a
limited number of test subjects and during a limited
evaluation period, this study analyzes the service usage
and quality assessments of more than thousand users
over a period of 120 days. This allows to analyze evolu-
tions in the usage behavior and perceived quality over
T. De Pessemier - L. Martens - W. JosephiMinds - Ghent University, Dept. of Information Technology,WiCaG. Crommenlaan 8 box 201, 9050 Ghent, BelgiumTel.: +32-09-33-14908Fax: +32-09-33-14899E-mail: [email protected]: [email protected]: [email protected]
I. Stevens - L. De MareziMinds - Ghent University, Dept. of Communication Sciences,MICTKorte Meer 7-9-11, 9000 Ghent, BelgiumTel.: +32-09-264 97 67E-mail: [email protected]: [email protected]
time, which has not been done up to now for a widely-
used, mobile, multimedia service. The results show a
significant evolution over time of the number of calls,
the call duration, and the quality assessment. The time
of the call, the used network, and handovers during the
call showed to have a significant influence on the users’
quality assessments.
Keywords usage behavior · user experience · voice-
over-ip · mobile · quality assessment
1 Introduction
Nowadays, a variety of Voice-over-IP (VoIP) services
offers users the possibility to make free or cheap voice
calls using the Internet. VoIP services such as Skype1,
ooVoo2, and Google Hangouts3 are becoming increas-
ingly popular due to the cost reduction benefit and its
flexibility (in contrast to landlines, VoIP is not tied to a
specific address) [5]. Most of these services also provide
a mobile application, enabling the users to make VoIP
calls with their tablet or smartphone. This provides
users an alternative for the traditional GSM (Global
System for Mobile Communications) standard, i.e., the
set of protocols for second generation (2G) digital cel-
lular networks used by mobile phones for telephony. In
recent years, cheap data plans of mobile operators and
an increased coverage of cellular data networks further
stimulated the growing popularity of VoIP applications
on mobile devices.
Quality and reliability are two dark spots on the
reputation of VoIP multimedia applications. Over the
1 http://www.skype.com2 http://www.oovoo.com3 http://www.google.com/hangouts
2 Toon De Pessemier et al.
years, there has been much improvement due to better
networks and audio codecs. But still, people are very de-
manding regarding voice quality in VoIP because they
are used for years to the impeccable quality of landline
phones [1].
As a result, end-to-end Quality of Service (QoS)
management is becoming a challenge [24] in order to
provide high quality and reliable communication over
a best-effort network. Unfortunately, the QoS param-
eters do not always reflect the perceived quality of a
service perfectly, since they only take into account net-
work related aspects and neglect device characteristics,
context parameters, and user aspects. In contrast, sub-
jective quality measurements with actual test subjects
can be performed to assess how a service is really per-
ceived by the user, or how the Quality of Experience
(QoE) is [10,11].
Although a subjective evaluation of the QoE could
be costly and time consuming, it gives more truthful
results than an objective evaluation, which is merely
based on QoS network performance parameters. QoE
considers how users perceive and experience a multime-
dia communication service as a whole [29]. Since QoE
relates to the user-perceived experience directly rather
than to the implied impact of QoS, it is considered as
a more important metric than QoS [30]. Tracking and
predicting of users’ satisfaction, service adaptation ac-
cording to users’ expectations, and maintain QoE at
a satisfactory level are crucial for multimedia services,
thereby leading to the development of reputation sys-
tems to manage subjective opinions in societies and
yield a general scoring of a particular behavior [8].
Both from a theoretical and empirical perspective,
the concept of QoE has been broadened over the last
years. As a result, different definitions of QoE exist,
but all have similar notion, referring to user satisfac-
tion [31]. The ITU-T defined QoE as “the overall ac-
ceptability of an application or service, as perceived by
the end-user”, which might be influenced by ‘user ex-
pectations’ and ‘context’ [16]. Identifying, understand-
ing, and quantifying the most determining aspects mak-
ing or breaking the QoE of individual (or communities
of) users and translating these rich insights into ser-
vice and application optimization recommendations, is
considered to be essential.
The objective of this paper is to identify device char-
acteristics (platform), context parameters (day of the
week, time of the day), and user aspects (familiarity
with the service) that influence the user’s usage behav-
ior and QoE during VoIP calls. For the first time, the
evolution of the user’s usage behavior and QoE was in-
vestigated by analyzing the service usage and quality
assessments of the VoIP service over a longer period of
time. In addition, this paper quantifies the influence of
the network and handovers during the call on the user’s
quality assessment. The results regarding the user’s us-
age behavior are important in view of predicting the
service usage and system load for mobile multimedia
services. The analysis of the quality assessments can
be used as a guidance to quantify (variations in) the
QoE of mobile (VoIP) services. The results regarding
the influence of the network and handovers can be used
to optimize mobile data networks from a user point of
view. The study of the evolution of the user’s usage
behavior and QoE over a longer period of time can be
seen as a case study for long-term quality assessment
of a service in a real environment.
2 Related Work
In many cases, the capabilities of VoIP technologies are
analyzed using a network simulator [17] or in a private
network [26], which enables the modification of the IP
infrastructure and may have other characteristics re-
garding traffic or topology than the public Internet.
Other experiments are performed in a predetermined
environment covering a limited area, such as a univer-
sity campus [6], thereby limiting the freedom of the
test subjects with the risk of obtaining results that are
not generally applicable. Moreover, the number of test
subjects participating in a (mobile) QoE experiment
is often limited to a few dozen due to time and bud-
get constraints [11]. In contrast, this paper investigates
the usage behavior and QoE during VoIP calls based
on data of a large number of test subjects (more than
thousand) making voice calls in their daily environment
without any location, time or usage constraint. These
test subjects are real customers of a commercial VoIP
application, namely VikingTalk4, developed and man-
aged by a Belgian mobile network operator, namely Mo-
bile Vikings5. This eliminates any possible bias that is
associated with the recruiting of test subjects who are
asked to use a service merely for the sake of evaluation
purposes.
To improve the quality in VoIP services, various ap-
proaches based on resource reservation have been pro-
posed. Different call scheduling policies can be used
when gateways with a limited capacity are used, thereby
managing access to the network resources so that they
are used in a fair manner [21]. The influence of QoS pa-
rameters, i.e., network related aspects, such as through-
put, packet delay, or packet loss, on the QoE during
VoIP calls has been studied extensively [7,14]. The de-
4 http://www.vikingtalk.com5 http://www.mobilevikings.com
Quality Assessment and Usage Behavior of a Mobile Voice-over-IP service. 3
gree of influence of QoS parameters on user perception
has been determined and enabled the development of
prediction models for multimedia services on mobile de-
vices [2]. For VoIP calls, packet losses and the pattern of
the packet losses, i.e., the distribution and duration of
packet loss runs, has a significant influence on the per-
ceptual quality of the conversation [3]. The wider the
inter-loss gap duration, the lower is the quality degra-
dation [18]. But also the jitter, i.e., the inter-packet de-
lay encountered as packets are transmitted through the
network from sender to receiver, has a significant influ-
ence on the quality of calls [4]. Especially for slower data
networks such as UMTS (Universal Mobile Telecom-
munications System) or EDGE (Enhanced Data Rates
for GSM Evolution) networks, these network related as-
pects have shown to be determining factors for the QoE
during VoIP calls.
The new generation of cellular data networks, such
as HSPA (High Speed Packet Access) and LTE (Long
Term Evolution) networks, and the traditional WiFi
networks offer a higher bandwidth satisfying the QoS
targets [22] and reduce the risk of network impairments,
such as packet loss and insufficient throughput, consid-
erably. Moreover, forward error correction mechanisms
using redundant data added to the voice stream can
help to recover from these network impairments thereby
sustaining audio quality [15]. As a result, QoS parame-
ters do not always match with the user’s QoE [6] during
VoIP calls. The reduced risk of network impairments
increases the relative impact of device characteristics,
such as the platform, context parameters, such as the
time, and user aspects, such as the familiarity with the
service, during the use of a multimedia service. How-
ever, the influence of these device characteristics, con-
text parameters, and user aspects on the user’s usage
behavior and QoE with a VoIP service has never been
investigated according to our knowledge.
Moreover, traditional user experiments evaluate the
QoE by taking a snapshot of the subjective experience
of the user at one moment in time during the complete
use process of the service [9]. The lack of any time-
related data in the analysis process implicitly denies
much of the dynamic nature of the user’s usage be-
havior [13] or experience with a service. Nevertheless,
the user’s behavior and experience continuously change
over time, and are influenced by his or her prior expec-
tations about the service [12]. Before people start using
a particular product or service, they tend to already
have some kind of preconception influencing their ex-
pectations [19]. After a user has adopted a product, and
is using it more or less regularly, the actual use process
evolves. As a user has more experience with the service,
familiarity of the user increases, and this has an impact
on how the service is being used. Karapanos et al. de-
scribe different phases a user goes through when using
a product or service going from “the initial experiences
with a service” over “giving the service a meaningful
place in life” to “integrating the service in the user’s
lifestyle” [19]. Therefore, it is important that the user’s
usage behavior and QoE is not evaluated at a single
point in time but rather over a continuous period during
the use process. The resulting data can be understood
as a time series of one feature, of which the clue for
evaluation is the detection of trends in several succes-
sive time points [25]. This paper is the first to monitor
trends in and analyze the evolution of the user’s usage
behavior and QoE with a VoIP service over a longer
period of time (four months).
3 VoIP Service
Nowadays, a large variety of VoIP services is available.
In this article, the user’s usage behavior and experience
with one of these services, namely VikingTalk, is inves-
tigated. VikingTalk offers users a multi-network VoIP
telephony service, similar to the well-known Skype, en-
abling to call or receive calls from other VoIP users or
people connected through the traditional fixed or mo-
bile PSTN (Public Switched Telephone Network).
In contrast to Skype, the VikingTalk application has
a transfer option that allows its customers to switch
from VoIP (using the data connection of the available
WiFi or cellular network) to the customer’s primary
mobile operator (using GSM to connect) during the
same call. The mobile operator automatically takes over
the VoIP call in case of a poor voice quality or loss ofcoverage on the data network, if users have enabled
this handover process in the configuration settings. By
a short beep sound during the voice call, users are in-
formed about the transfer of the voice call from VoIP
over the available data network to non-VoIP over the
GSM network of the mobile operator. If a voice call ini-
tiated using VoIP was transferred to the GSM network
of the mobile operator because of technical issues, it
is not transferred again to VoIP (not even if the data
connection is sufficiently recovered) in order to limit the
possible disruptions introduced by the switching during
the voice call.
In the configuration settings of the VikingTalk ap-
plication, users can enable the handover process to switch
automatically from a data network to the GSM network
of the mobile operator. In addition, users have the pos-
sibility to influence this handover process. They can
choose whether or not they want to use EDGE or 3G
(3rd Generation) networks for their voice calls in case a
WiFi connection is not available. For the VoIP service,
4 Toon De Pessemier et al.
a WiFi network is the first choice. If a WiFi network
is not available, two alternative solutions exists for the
voice call: either using the mobile data network (EDGE
or 3G) that is available through the user’s mobile data
plan (data credit) or using the GSM network of the
user’s mobile operator thereby charging the user as for
a traditional phone call (voice credit). If the user opts
not to use EDGE or 3G, the voice call is transferred
immediately to the GSM network of the mobile oper-
ator as soon as the user is out of range of the WiFi
network. If the user opts to use EDGE or 3G, this data
network is preferred above the GSM network of the mo-
bile operator. Then, the available EDGE or 3G network
is used by default in the absence of WiFi, and only in
exceptional cases when the throughput of the mobile
data network (EDGE or 3G) becomes insufficient, the
call is still switched to the GSM network of the mo-
bile operator. The use of EDGE or 3G can induce a
poorer voice quality compared to the GSM network of
the mobile operator, but on the other hand, the use of
3G or EDGE can reduce the cost charged by the mobile
operator for voice calls.
VoIP calls to another VoIP user are free for users of
the VikingTalk application. VoIP calls to the fixed or
mobile PSTN are charged based on the duration of the
call. For voice calls that use the GSM network of the
mobile operator (because of technical reasons), or voice
calls initiated using VoIP that are transferred to the
GSM network of the mobile operator, the rates offered
by the mobile operator apply for the duration of the
call over this GSM network. Charges for data traffic are
not included in the VikingTalk rates and are charged
separately.
For billing purposes and customer services, data about
the VikingTalk service usage are internally stored and
continuously monitored. Analysis of these data can pro-
vide insights into the parameters that influence the ser-
vice usage and user’s QoE. The analysis of this paper
was based on a data set containing the details of all
voice calls made by real customers of VikingTalk over a
period of nearly four months (120 days), from October
1, 2012 to January 28, 2013. Since these customers were
not aware of this study, they were not biased in any way.
The resulting data set provides on the one hand a rep-
resentative set of samples to investigate the influence
of different parameters and on the other hand it allows
to analyze trends in the user’s usage behavior and QoE
with the VoIP service over a longer period of time. The
data set consists of objective, technical parameters re-
garding the call as well as subjective evaluations of the
quality of the voice call.
The objective, technical parameters used to track
the usage behavior are: an identification of the user
who initiates the call and the user who receives the
call, timestamps indicating the start and end of the
call, the type of operating system of the user’s phone,
the duration of the voice call, the presence of handovers
from data to GSM network, and configuration settings
related to the handover process and the use of mobile
data networks. After each voice call, the user has the
opportunity to evaluate the quality of the VoIP service
using a 5-point scale rating mechanism, thereby yield-
ing a subjective evaluation of the user’s experience with
the VoIP service.
4 Number of Calls
The number of calls made by the users of the service is
a measure that characterizes the usage behavior and is
an indication of the popularity of the service.
4.1 Characteristics of the Number of Calls
The total number of calls, made by all users during the
120-day period, is 127826. So on average, 1065 calls are
made each day. The standard deviation of the number
of calls per day is 172.18, indicating that the number of
calls varies for subsequent days of the evaluation. Dur-
ing the evaluation period, 1050 subscribers of the VoIP
service were active, each making on average 121.74 voice
calls, or around 1 voice call per day. The users of the
VikingTalk service are all smartphone users. Many of
them are adolescents and students; but VikingTalk has
customers with all kinds of backgrounds. So the users of
VikingTalk are a representative set for the population
of customers of a mobile operator.
4.2 Differences in the Number of Calls per Platform
During the evaluation period, 82300 calls or 64.4% were
initiated on an Apple iPhone running iOS. The remain-
ing 45526 calls or 35.6% are made using a mobile phone
running the Android operating system. Also in terms of
subscribers of the service, corresponding results are ob-
tained. Of the 1050 subscribers who were active during
the evaluation period, 622 users or 59.2% are iPhone
users, and the remaining 428 users or 40.8% utilize an
Android device.
So although the popularity of (new) Android devices
at the end of 2012 and the beginning of 2013 [23], the
majority of the voice calls are made on iOS. During
the evaluation period, the VikingTalk application was
not (yet) available for other mobile platforms such as
Blackberry or Windows Mobile.
Quality Assessment and Usage Behavior of a Mobile Voice-over-IP service. 5
Day of the Week
SundaySaturdayFridayThursdayWednesdayTuesdayMonday
Nu
mb
er o
f C
alls
10000
9000
8000
7000
6000
5000
4000
3000
2000
1000
0
NightEveningAfternoonMorning
Time of the Day
Page 1
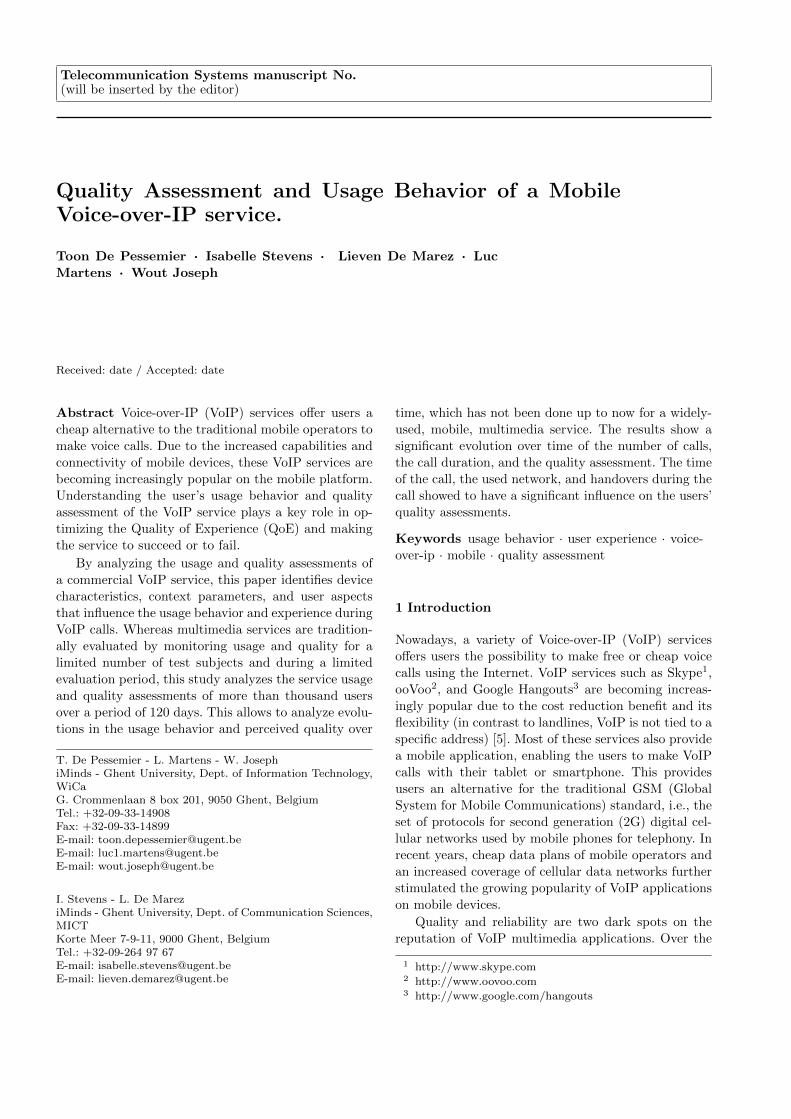
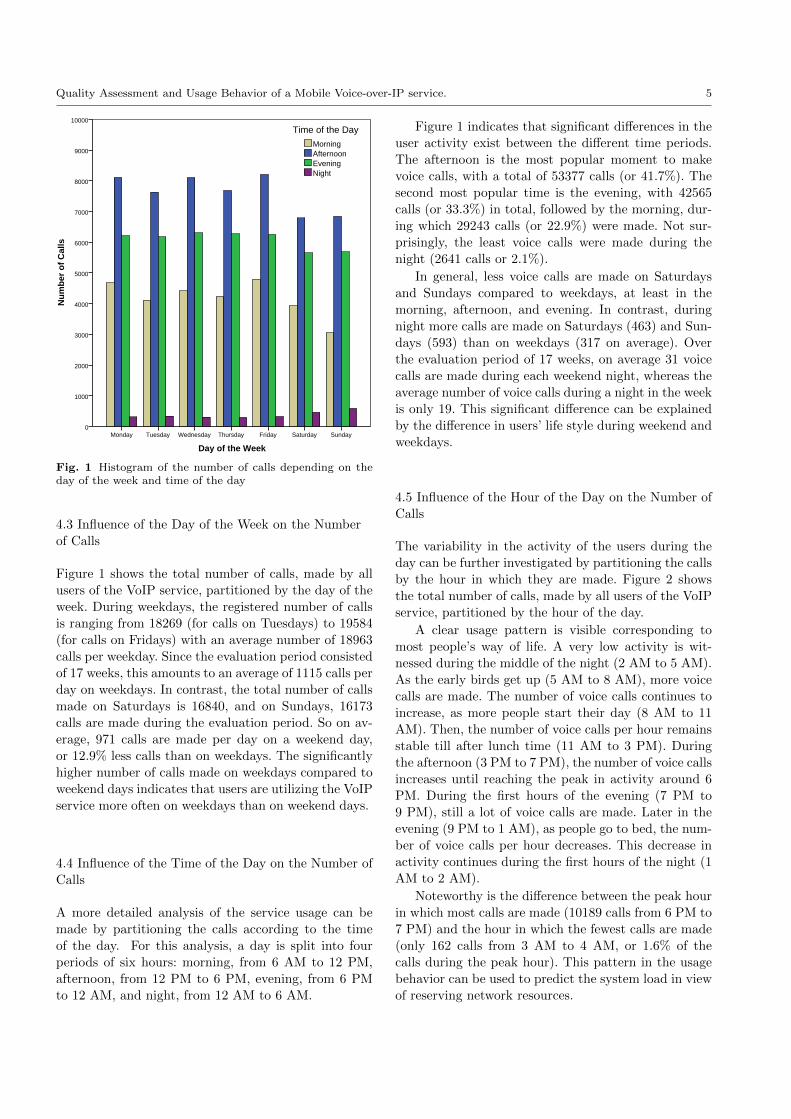
Fig. 1 Histogram of the number of calls depending on theday of the week and time of the day
4.3 Influence of the Day of the Week on the Number
of Calls
Figure 1 shows the total number of calls, made by all
users of the VoIP service, partitioned by the day of the
week. During weekdays, the registered number of calls
is ranging from 18269 (for calls on Tuesdays) to 19584
(for calls on Fridays) with an average number of 18963
calls per weekday. Since the evaluation period consisted
of 17 weeks, this amounts to an average of 1115 calls per
day on weekdays. In contrast, the total number of calls
made on Saturdays is 16840, and on Sundays, 16173
calls are made during the evaluation period. So on av-
erage, 971 calls are made per day on a weekend day,
or 12.9% less calls than on weekdays. The significantly
higher number of calls made on weekdays compared to
weekend days indicates that users are utilizing the VoIP
service more often on weekdays than on weekend days.
4.4 Influence of the Time of the Day on the Number of
Calls
A more detailed analysis of the service usage can be
made by partitioning the calls according to the time
of the day. For this analysis, a day is split into four
periods of six hours: morning, from 6 AM to 12 PM,
afternoon, from 12 PM to 6 PM, evening, from 6 PM
to 12 AM, and night, from 12 AM to 6 AM.
Figure 1 indicates that significant differences in the
user activity exist between the different time periods.
The afternoon is the most popular moment to make
voice calls, with a total of 53377 calls (or 41.7%). The
second most popular time is the evening, with 42565
calls (or 33.3%) in total, followed by the morning, dur-
ing which 29243 calls (or 22.9%) were made. Not sur-
prisingly, the least voice calls were made during the
night (2641 calls or 2.1%).
In general, less voice calls are made on Saturdays
and Sundays compared to weekdays, at least in the
morning, afternoon, and evening. In contrast, during
night more calls are made on Saturdays (463) and Sun-
days (593) than on weekdays (317 on average). Over
the evaluation period of 17 weeks, on average 31 voice
calls are made during each weekend night, whereas the
average number of voice calls during a night in the week
is only 19. This significant difference can be explained
by the difference in users’ life style during weekend and
weekdays.
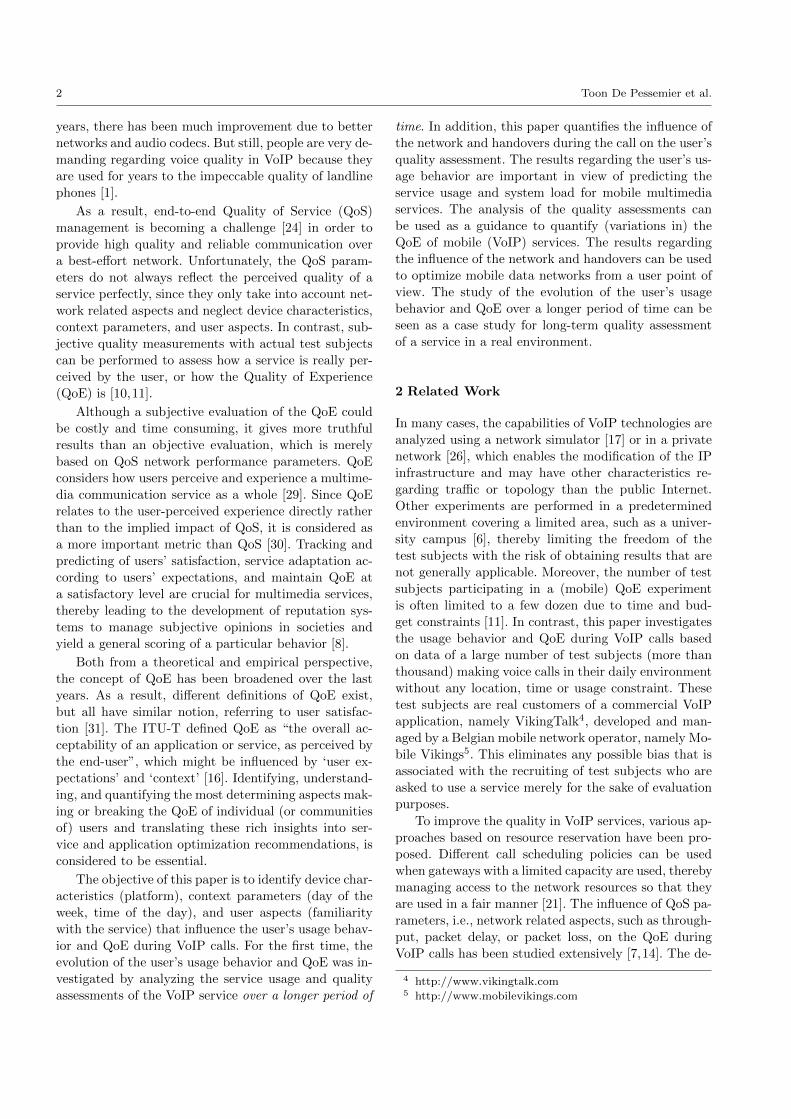
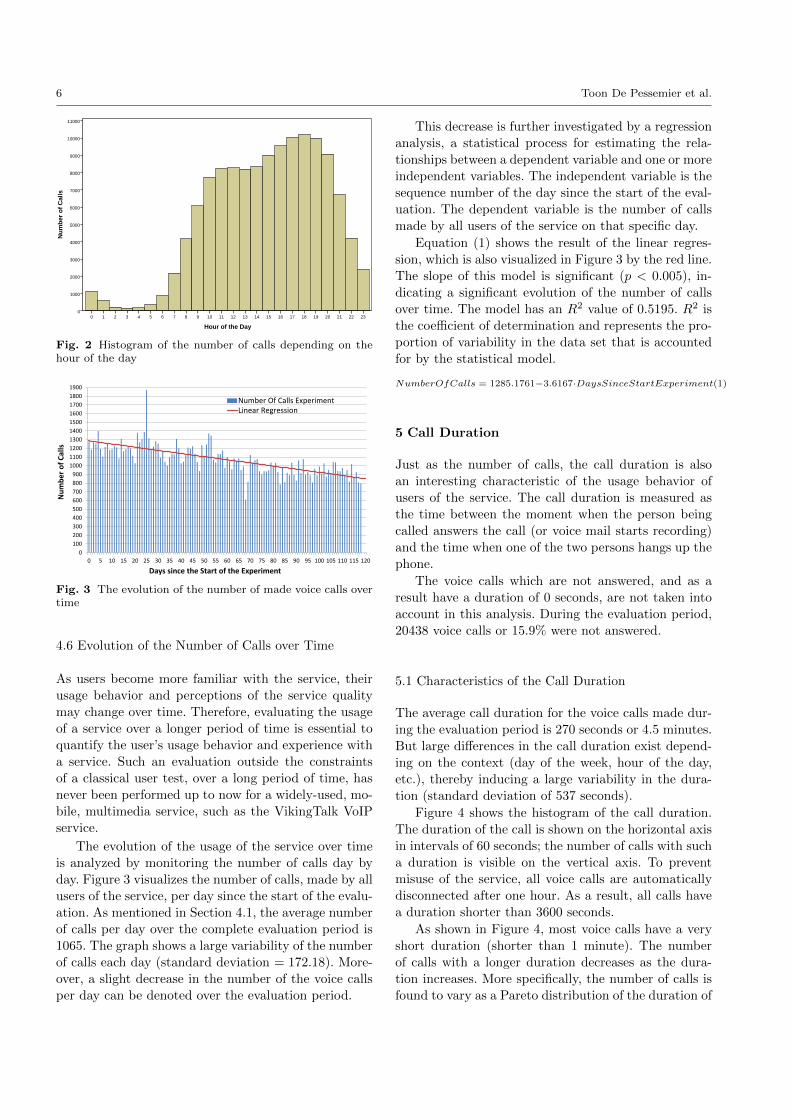
4.5 Influence of the Hour of the Day on the Number of
Calls
The variability in the activity of the users during the
day can be further investigated by partitioning the calls
by the hour in which they are made. Figure 2 shows
the total number of calls, made by all users of the VoIP
service, partitioned by the hour of the day.
A clear usage pattern is visible corresponding to
most people’s way of life. A very low activity is wit-
nessed during the middle of the night (2 AM to 5 AM).
As the early birds get up (5 AM to 8 AM), more voice
calls are made. The number of voice calls continues to
increase, as more people start their day (8 AM to 11
AM). Then, the number of voice calls per hour remains
stable till after lunch time (11 AM to 3 PM). During
the afternoon (3 PM to 7 PM), the number of voice calls
increases until reaching the peak in activity around 6
PM. During the first hours of the evening (7 PM to
9 PM), still a lot of voice calls are made. Later in the
evening (9 PM to 1 AM), as people go to bed, the num-
ber of voice calls per hour decreases. This decrease in
activity continues during the first hours of the night (1
AM to 2 AM).
Noteworthy is the difference between the peak hour
in which most calls are made (10189 calls from 6 PM to
7 PM) and the hour in which the fewest calls are made
(only 162 calls from 3 AM to 4 AM, or 1.6% of the
calls during the peak hour). This pattern in the usage
behavior can be used to predict the system load in view
of reserving network resources.
6 Toon De Pessemier et al.
Nu
mb
er o
f C
alls
11000
10000
9000
8000
7000
6000
5000
4000
3000
2000
1000
0
Hour of the Day
23222120191817161514131211109876543210
Mean = 14,9Std. Dev. = 4,586N = 127.826
Page 1
Fig. 2 Histogram of the number of calls depending on thehour of the day
0
100
200
300
400
500
600
700
800
900
1000
1100
1200
1300
1400
1500
1600
1700
1800
1900
0 5 10 15 20 25 30 35 40 45 50 55 60 65 70 75 80 85 90 95 100 105 110 115 120
Nu
mb
er
of
Cal
ls
Days since the Start of the Experiment
Number Of Calls ExperimentLinear Regression
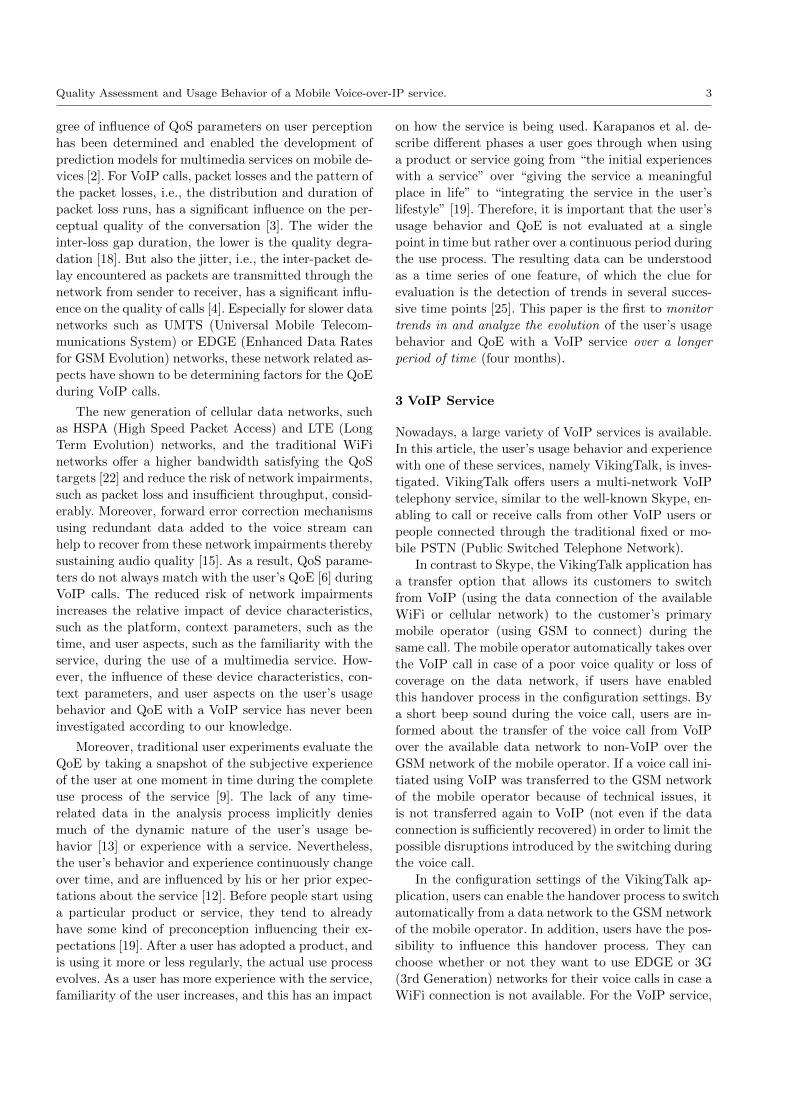
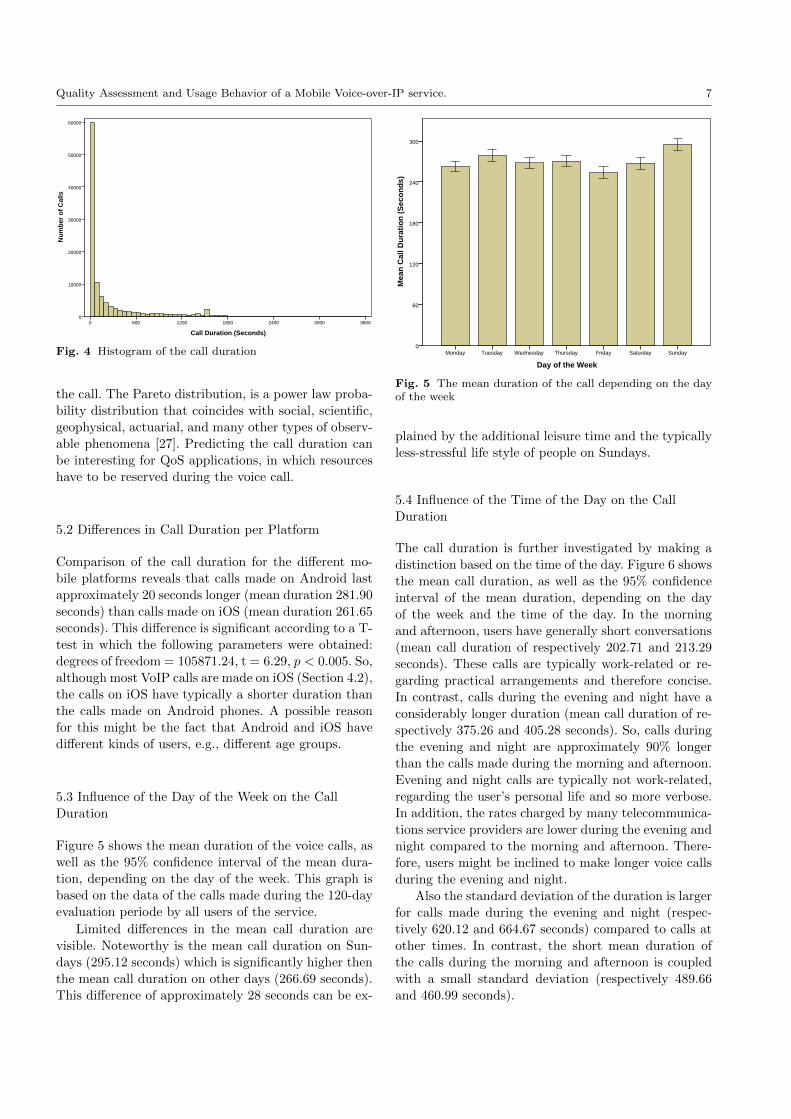
Fig. 3 The evolution of the number of made voice calls overtime
4.6 Evolution of the Number of Calls over Time
As users become more familiar with the service, their
usage behavior and perceptions of the service quality
may change over time. Therefore, evaluating the usage
of a service over a longer period of time is essential to
quantify the user’s usage behavior and experience with
a service. Such an evaluation outside the constraints
of a classical user test, over a long period of time, has
never been performed up to now for a widely-used, mo-
bile, multimedia service, such as the VikingTalk VoIP
service.
The evolution of the usage of the service over time
is analyzed by monitoring the number of calls day by
day. Figure 3 visualizes the number of calls, made by all
users of the service, per day since the start of the evalu-
ation. As mentioned in Section 4.1, the average number
of calls per day over the complete evaluation period is
1065. The graph shows a large variability of the number
of calls each day (standard deviation = 172.18). More-
over, a slight decrease in the number of the voice calls
per day can be denoted over the evaluation period.
This decrease is further investigated by a regression
analysis, a statistical process for estimating the rela-
tionships between a dependent variable and one or more
independent variables. The independent variable is the
sequence number of the day since the start of the eval-
uation. The dependent variable is the number of calls
made by all users of the service on that specific day.
Equation (1) shows the result of the linear regres-
sion, which is also visualized in Figure 3 by the red line.
The slope of this model is significant (p < 0.005), in-
dicating a significant evolution of the number of calls
over time. The model has an R2 value of 0.5195. R2 is
the coefficient of determination and represents the pro-
portion of variability in the data set that is accounted
for by the statistical model.
NumberOfCalls = 1285.1761−3.6167·DaysSinceStartExperiment(1)
5 Call Duration
Just as the number of calls, the call duration is also
an interesting characteristic of the usage behavior of
users of the service. The call duration is measured as
the time between the moment when the person being
called answers the call (or voice mail starts recording)
and the time when one of the two persons hangs up the
phone.
The voice calls which are not answered, and as a
result have a duration of 0 seconds, are not taken into
account in this analysis. During the evaluation period,
20438 voice calls or 15.9% were not answered.
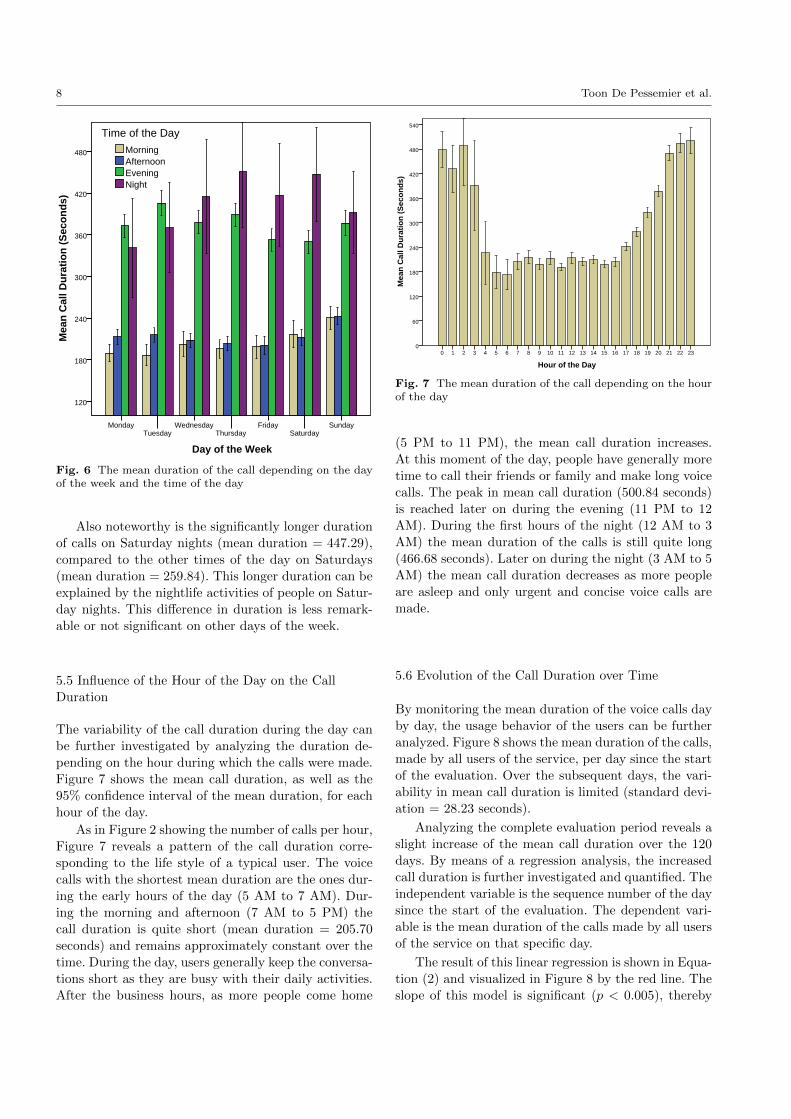
5.1 Characteristics of the Call Duration
The average call duration for the voice calls made dur-
ing the evaluation period is 270 seconds or 4.5 minutes.
But large differences in the call duration exist depend-
ing on the context (day of the week, hour of the day,
etc.), thereby inducing a large variability in the dura-
tion (standard deviation of 537 seconds).
Figure 4 shows the histogram of the call duration.
The duration of the call is shown on the horizontal axis
in intervals of 60 seconds; the number of calls with such
a duration is visible on the vertical axis. To prevent
misuse of the service, all voice calls are automatically
disconnected after one hour. As a result, all calls have
a duration shorter than 3600 seconds.
As shown in Figure 4, most voice calls have a very
short duration (shorter than 1 minute). The number
of calls with a longer duration decreases as the dura-
tion increases. More specifically, the number of calls is
found to vary as a Pareto distribution of the duration of
Quality Assessment and Usage Behavior of a Mobile Voice-over-IP service. 7
Call Duration (Seconds)
360030002400180012006000
Nu
mb
er o
f C
alls
60000
50000
40000
30000
20000
10000
0
Mean = 270,17Std. Dev. = 537,234N = 107.388
Page 1
Fig. 4 Histogram of the call duration
the call. The Pareto distribution, is a power law proba-
bility distribution that coincides with social, scientific,
geophysical, actuarial, and many other types of observ-
able phenomena [27]. Predicting the call duration can
be interesting for QoS applications, in which resources
have to be reserved during the voice call.
5.2 Differences in Call Duration per Platform
Comparison of the call duration for the different mo-
bile platforms reveals that calls made on Android last
approximately 20 seconds longer (mean duration 281.90
seconds) than calls made on iOS (mean duration 261.65
seconds). This difference is significant according to a T-
test in which the following parameters were obtained:
degrees of freedom = 105871.24, t = 6.29, p < 0.005. So,
although most VoIP calls are made on iOS (Section 4.2),
the calls on iOS have typically a shorter duration than
the calls made on Android phones. A possible reason
for this might be the fact that Android and iOS have
different kinds of users, e.g., different age groups.
5.3 Influence of the Day of the Week on the Call
Duration
Figure 5 shows the mean duration of the voice calls, as
well as the 95% confidence interval of the mean dura-
tion, depending on the day of the week. This graph is
based on the data of the calls made during the 120-day
evaluation periode by all users of the service.
Limited differences in the mean call duration are
visible. Noteworthy is the mean call duration on Sun-
days (295.12 seconds) which is significantly higher then
the mean call duration on other days (266.69 seconds).
This difference of approximately 28 seconds can be ex-
Day of the Week
SundaySaturdayFridayThursdayWednesdayTuesdayMonday
Mea
n C
all D
ura
tio
n (
Sec
on
ds)
300
240
180
120
60
0
Page 1
Fig. 5 The mean duration of the call depending on the dayof the week
plained by the additional leisure time and the typically
less-stressful life style of people on Sundays.
5.4 Influence of the Time of the Day on the Call
Duration
The call duration is further investigated by making a
distinction based on the time of the day. Figure 6 shows
the mean call duration, as well as the 95% confidence
interval of the mean duration, depending on the day
of the week and the time of the day. In the morning
and afternoon, users have generally short conversations
(mean call duration of respectively 202.71 and 213.29
seconds). These calls are typically work-related or re-
garding practical arrangements and therefore concise.
In contrast, calls during the evening and night have a
considerably longer duration (mean call duration of re-
spectively 375.26 and 405.28 seconds). So, calls during
the evening and night are approximately 90% longer
than the calls made during the morning and afternoon.
Evening and night calls are typically not work-related,
regarding the user’s personal life and so more verbose.
In addition, the rates charged by many telecommunica-
tions service providers are lower during the evening and
night compared to the morning and afternoon. There-
fore, users might be inclined to make longer voice calls
during the evening and night.
Also the standard deviation of the duration is larger
for calls made during the evening and night (respec-
tively 620.12 and 664.67 seconds) compared to calls at
other times. In contrast, the short mean duration of
the calls during the morning and afternoon is coupled
with a small standard deviation (respectively 489.66
and 460.99 seconds).
8 Toon De Pessemier et al.
Day of the Week
SundaySaturday
FridayThursday
WednesdayTuesday
Monday
Mea
n C
all D
ura
tio
n (
Sec
on
ds)
480
420
360
300
240
180
120
NightEveningAfternoonMorning
Time of the Day
Page 1
Fig. 6 The mean duration of the call depending on the dayof the week and the time of the day
Also noteworthy is the significantly longer duration
of calls on Saturday nights (mean duration = 447.29),
compared to the other times of the day on Saturdays
(mean duration = 259.84). This longer duration can be
explained by the nightlife activities of people on Satur-
day nights. This difference in duration is less remark-
able or not significant on other days of the week.
5.5 Influence of the Hour of the Day on the Call
Duration
The variability of the call duration during the day can
be further investigated by analyzing the duration de-
pending on the hour during which the calls were made.
Figure 7 shows the mean call duration, as well as the
95% confidence interval of the mean duration, for each
hour of the day.
As in Figure 2 showing the number of calls per hour,
Figure 7 reveals a pattern of the call duration corre-
sponding to the life style of a typical user. The voice
calls with the shortest mean duration are the ones dur-
ing the early hours of the day (5 AM to 7 AM). Dur-
ing the morning and afternoon (7 AM to 5 PM) the
call duration is quite short (mean duration = 205.70
seconds) and remains approximately constant over the
time. During the day, users generally keep the conversa-
tions short as they are busy with their daily activities.
After the business hours, as more people come home
Hour of the Day
23222120191817161514131211109876543210
Mea
n C
all D
ura
tio
n (
Sec
on
ds)
540
480
420
360
300
240
180
120
60
0
Page 1
Fig. 7 The mean duration of the call depending on the hourof the day
(5 PM to 11 PM), the mean call duration increases.
At this moment of the day, people have generally more
time to call their friends or family and make long voice
calls. The peak in mean call duration (500.84 seconds)
is reached later on during the evening (11 PM to 12
AM). During the first hours of the night (12 AM to 3
AM) the mean duration of the calls is still quite long
(466.68 seconds). Later on during the night (3 AM to 5
AM) the mean call duration decreases as more people
are asleep and only urgent and concise voice calls are
made.
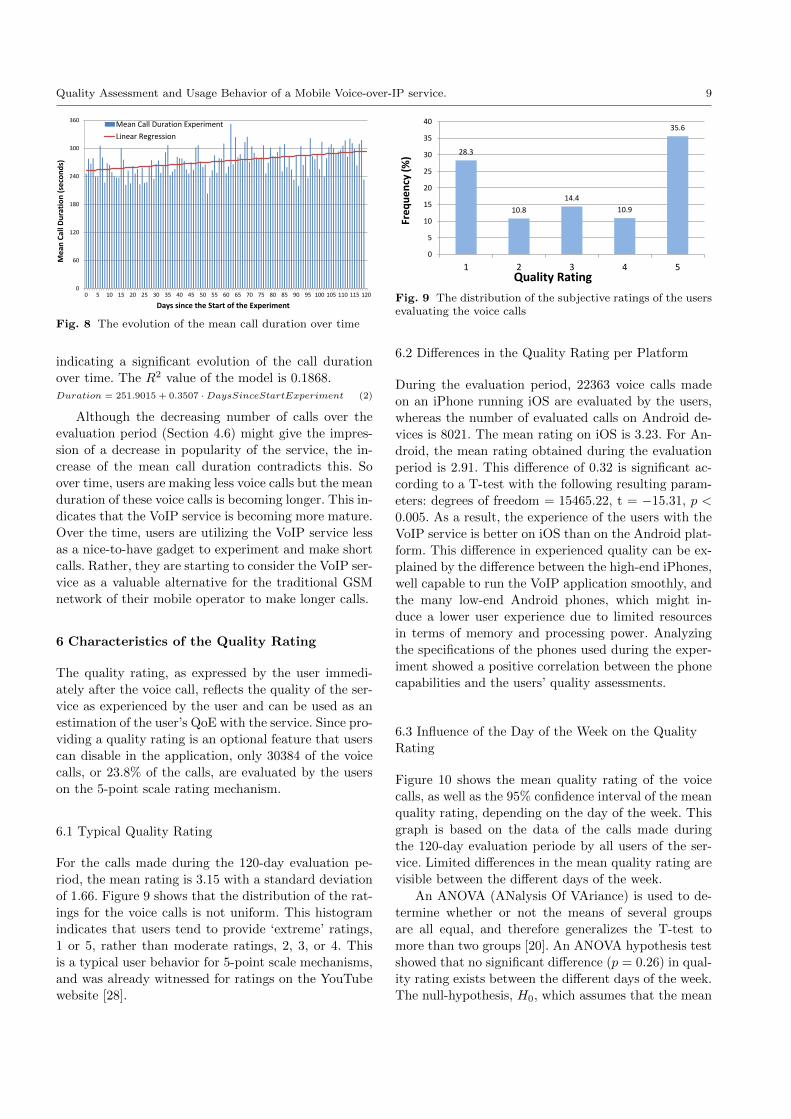
5.6 Evolution of the Call Duration over Time
By monitoring the mean duration of the voice calls day
by day, the usage behavior of the users can be further
analyzed. Figure 8 shows the mean duration of the calls,
made by all users of the service, per day since the start
of the evaluation. Over the subsequent days, the vari-
ability in mean call duration is limited (standard devi-
ation = 28.23 seconds).
Analyzing the complete evaluation period reveals a
slight increase of the mean call duration over the 120
days. By means of a regression analysis, the increased
call duration is further investigated and quantified. The
independent variable is the sequence number of the day
since the start of the evaluation. The dependent vari-
able is the mean duration of the calls made by all users
of the service on that specific day.
The result of this linear regression is shown in Equa-
tion (2) and visualized in Figure 8 by the red line. The
slope of this model is significant (p < 0.005), thereby
Quality Assessment and Usage Behavior of a Mobile Voice-over-IP service. 9
0
60
120
180
240
300
360
0 5 10 15 20 25 30 35 40 45 50 55 60 65 70 75 80 85 90 95 100 105 110 115 120
Me
an C
all D
ura
tio
n (
seco
nd
s)
Days since the Start of the Experiment
Mean Call Duration Experiment
Linear Regression
Fig. 8 The evolution of the mean call duration over time
indicating a significant evolution of the call duration
over time. The R2 value of the model is 0.1868.Duration = 251.9015 + 0.3507 · DaysSinceStartExperiment (2)
Although the decreasing number of calls over the
evaluation period (Section 4.6) might give the impres-
sion of a decrease in popularity of the service, the in-
crease of the mean call duration contradicts this. So
over time, users are making less voice calls but the mean
duration of these voice calls is becoming longer. This in-
dicates that the VoIP service is becoming more mature.
Over the time, users are utilizing the VoIP service less
as a nice-to-have gadget to experiment and make short
calls. Rather, they are starting to consider the VoIP ser-
vice as a valuable alternative for the traditional GSM
network of their mobile operator to make longer calls.
6 Characteristics of the Quality Rating
The quality rating, as expressed by the user immedi-ately after the voice call, reflects the quality of the ser-
vice as experienced by the user and can be used as an
estimation of the user’s QoE with the service. Since pro-
viding a quality rating is an optional feature that users
can disable in the application, only 30384 of the voice
calls, or 23.8% of the calls, are evaluated by the users
on the 5-point scale rating mechanism.
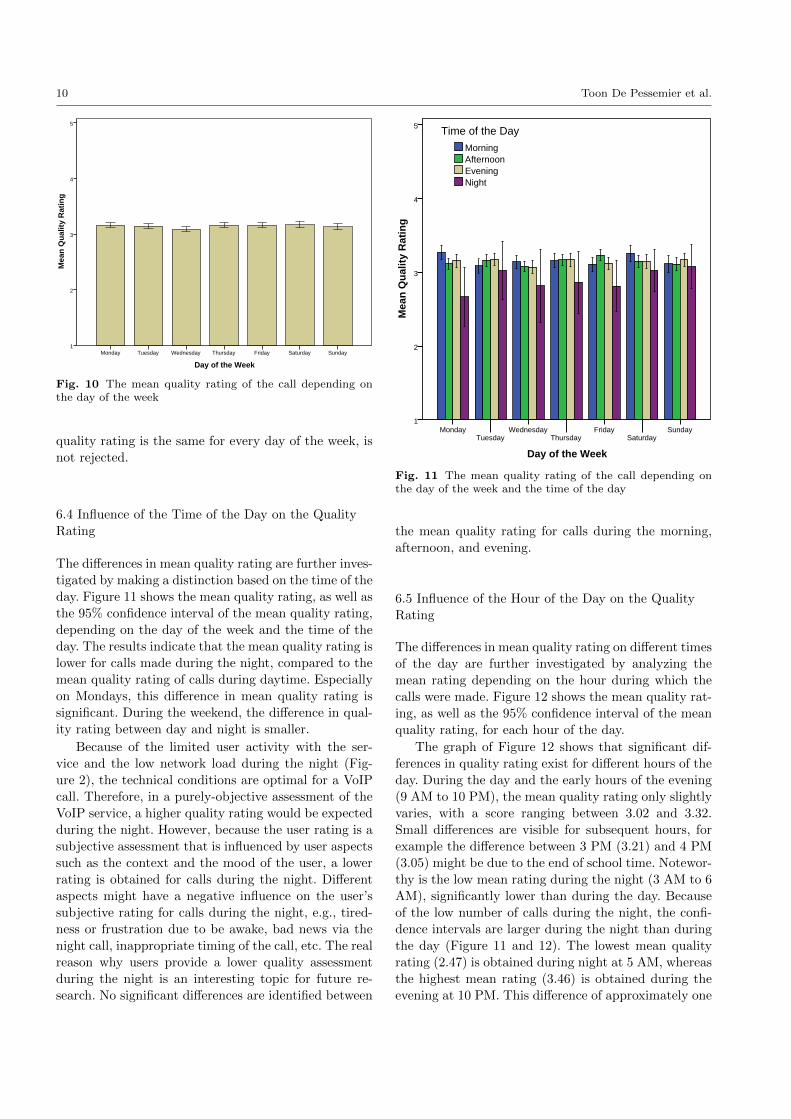
6.1 Typical Quality Rating
For the calls made during the 120-day evaluation pe-
riod, the mean rating is 3.15 with a standard deviation
of 1.66. Figure 9 shows that the distribution of the rat-
ings for the voice calls is not uniform. This histogram
indicates that users tend to provide ‘extreme’ ratings,
1 or 5, rather than moderate ratings, 2, 3, or 4. This
is a typical user behavior for 5-point scale mechanisms,
and was already witnessed for ratings on the YouTube
website [28].
28.3
10.8
14.4
10.9
35.6
0
5
10
15
20
25
30
35
40
1 2 3 4 5
Fre
qu
en
cy (
%)
Quality Rating
Fig. 9 The distribution of the subjective ratings of the usersevaluating the voice calls
6.2 Differences in the Quality Rating per Platform
During the evaluation period, 22363 voice calls made
on an iPhone running iOS are evaluated by the users,
whereas the number of evaluated calls on Android de-
vices is 8021. The mean rating on iOS is 3.23. For An-
droid, the mean rating obtained during the evaluation
period is 2.91. This difference of 0.32 is significant ac-
cording to a T-test with the following resulting param-
eters: degrees of freedom = 15465.22, t = −15.31, p <
0.005. As a result, the experience of the users with the
VoIP service is better on iOS than on the Android plat-
form. This difference in experienced quality can be ex-
plained by the difference between the high-end iPhones,
well capable to run the VoIP application smoothly, and
the many low-end Android phones, which might in-
duce a lower user experience due to limited resources
in terms of memory and processing power. Analyzing
the specifications of the phones used during the exper-
iment showed a positive correlation between the phone
capabilities and the users’ quality assessments.
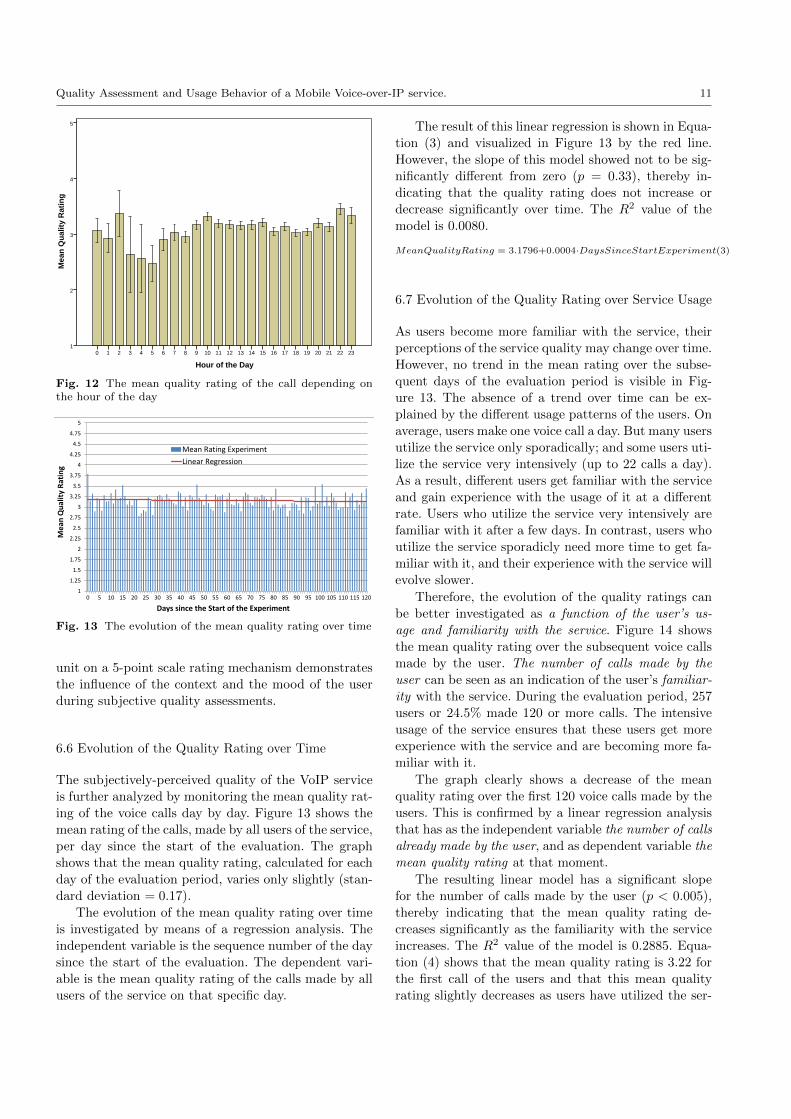
6.3 Influence of the Day of the Week on the Quality
Rating
Figure 10 shows the mean quality rating of the voice
calls, as well as the 95% confidence interval of the mean
quality rating, depending on the day of the week. This
graph is based on the data of the calls made during
the 120-day evaluation periode by all users of the ser-
vice. Limited differences in the mean quality rating are
visible between the different days of the week.
An ANOVA (ANalysis Of VAriance) is used to de-
termine whether or not the means of several groups
are all equal, and therefore generalizes the T-test to
more than two groups [20]. An ANOVA hypothesis test
showed that no significant difference (p = 0.26) in qual-
ity rating exists between the different days of the week.
The null-hypothesis, H0, which assumes that the mean
10 Toon De Pessemier et al.
Day of the Week
SundaySaturdayFridayThursdayWednesdayTuesdayMonday
Mea
n Q
ual
ity
Rat
ing
5
4
3
2
1
Page 1
Fig. 10 The mean quality rating of the call depending onthe day of the week
quality rating is the same for every day of the week, is
not rejected.
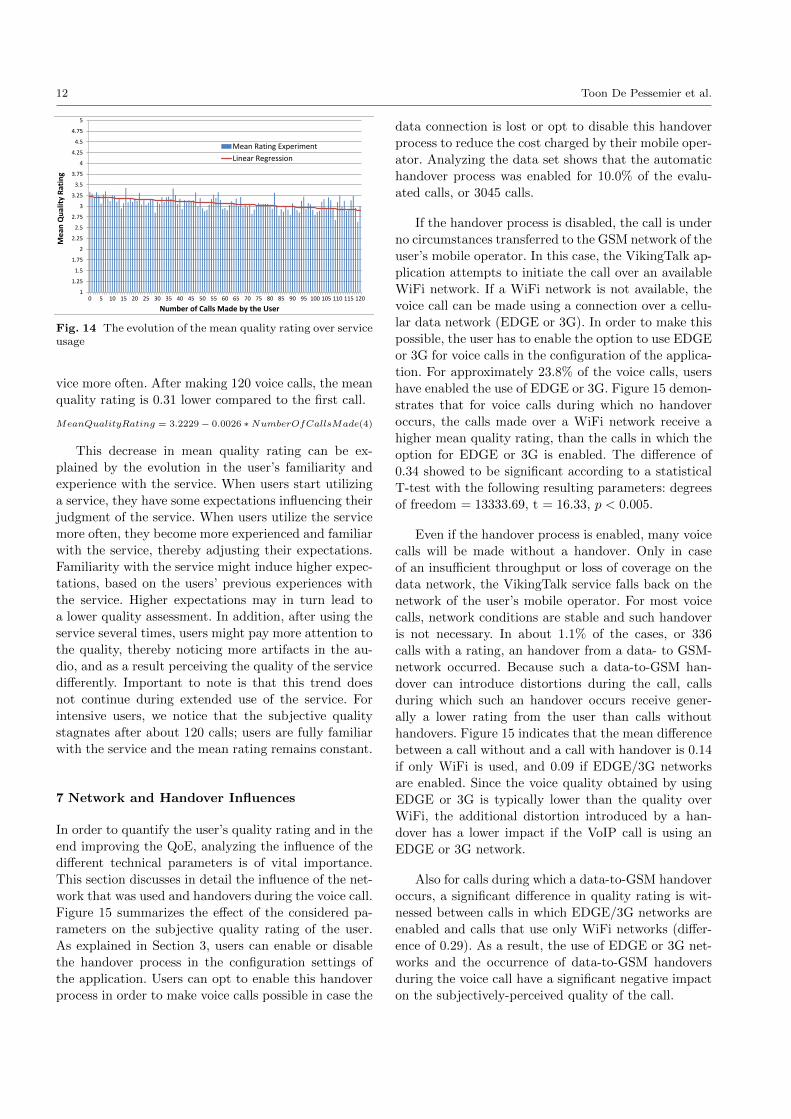
6.4 Influence of the Time of the Day on the Quality
Rating
The differences in mean quality rating are further inves-
tigated by making a distinction based on the time of the
day. Figure 11 shows the mean quality rating, as well as
the 95% confidence interval of the mean quality rating,
depending on the day of the week and the time of the
day. The results indicate that the mean quality rating is
lower for calls made during the night, compared to the
mean quality rating of calls during daytime. Especially
on Mondays, this difference in mean quality rating is
significant. During the weekend, the difference in qual-
ity rating between day and night is smaller.
Because of the limited user activity with the ser-
vice and the low network load during the night (Fig-
ure 2), the technical conditions are optimal for a VoIP
call. Therefore, in a purely-objective assessment of the
VoIP service, a higher quality rating would be expected
during the night. However, because the user rating is a
subjective assessment that is influenced by user aspects
such as the context and the mood of the user, a lower
rating is obtained for calls during the night. Different
aspects might have a negative influence on the user’s
subjective rating for calls during the night, e.g., tired-
ness or frustration due to be awake, bad news via the
night call, inappropriate timing of the call, etc. The real
reason why users provide a lower quality assessment
during the night is an interesting topic for future re-
search. No significant differences are identified between
Day of the Week
SundaySaturday
FridayThursday
WednesdayTuesday
Monday
Mea
n Q
ual
ity
Rat
ing
5
4
3
2
1
NightEveningAfternoonMorning
Time of the Day
Page 1
Fig. 11 The mean quality rating of the call depending onthe day of the week and the time of the day
the mean quality rating for calls during the morning,
afternoon, and evening.
6.5 Influence of the Hour of the Day on the Quality
Rating
The differences in mean quality rating on different times
of the day are further investigated by analyzing the
mean rating depending on the hour during which the
calls were made. Figure 12 shows the mean quality rat-
ing, as well as the 95% confidence interval of the mean
quality rating, for each hour of the day.
The graph of Figure 12 shows that significant dif-
ferences in quality rating exist for different hours of the
day. During the day and the early hours of the evening
(9 AM to 10 PM), the mean quality rating only slightly
varies, with a score ranging between 3.02 and 3.32.
Small differences are visible for subsequent hours, for
example the difference between 3 PM (3.21) and 4 PM
(3.05) might be due to the end of school time. Notewor-
thy is the low mean rating during the night (3 AM to 6
AM), significantly lower than during the day. Because
of the low number of calls during the night, the confi-
dence intervals are larger during the night than during
the day (Figure 11 and 12). The lowest mean quality
rating (2.47) is obtained during night at 5 AM, whereas
the highest mean rating (3.46) is obtained during the
evening at 10 PM. This difference of approximately one
Quality Assessment and Usage Behavior of a Mobile Voice-over-IP service. 11
Hour of the Day
23222120191817161514131211109876543210
Mea
n Q
ual
ity
Rat
ing
5
4
3
2
1
Page 1
Fig. 12 The mean quality rating of the call depending onthe hour of the day
1
1.25
1.5
1.75
2
2.25
2.5
2.75
3
3.25
3.5
3.75
4
4.25
4.5
4.75
5
0 5 10 15 20 25 30 35 40 45 50 55 60 65 70 75 80 85 90 95 100 105 110 115 120
Me
an Q
ual
ity
Rat
ing
Days since the Start of the Experiment
Mean Rating Experiment
Linear Regression
Fig. 13 The evolution of the mean quality rating over time
unit on a 5-point scale rating mechanism demonstrates
the influence of the context and the mood of the user
during subjective quality assessments.
6.6 Evolution of the Quality Rating over Time
The subjectively-perceived quality of the VoIP service
is further analyzed by monitoring the mean quality rat-
ing of the voice calls day by day. Figure 13 shows the
mean rating of the calls, made by all users of the service,
per day since the start of the evaluation. The graph
shows that the mean quality rating, calculated for each
day of the evaluation period, varies only slightly (stan-
dard deviation = 0.17).
The evolution of the mean quality rating over time
is investigated by means of a regression analysis. The
independent variable is the sequence number of the day
since the start of the evaluation. The dependent vari-
able is the mean quality rating of the calls made by all
users of the service on that specific day.
The result of this linear regression is shown in Equa-
tion (3) and visualized in Figure 13 by the red line.
However, the slope of this model showed not to be sig-
nificantly different from zero (p = 0.33), thereby in-
dicating that the quality rating does not increase or
decrease significantly over time. The R2 value of the
model is 0.0080.
MeanQualityRating = 3.1796+0.0004·DaysSinceStartExperiment(3)
6.7 Evolution of the Quality Rating over Service Usage
As users become more familiar with the service, their
perceptions of the service quality may change over time.
However, no trend in the mean rating over the subse-
quent days of the evaluation period is visible in Fig-
ure 13. The absence of a trend over time can be ex-
plained by the different usage patterns of the users. On
average, users make one voice call a day. But many users
utilize the service only sporadically; and some users uti-
lize the service very intensively (up to 22 calls a day).
As a result, different users get familiar with the service
and gain experience with the usage of it at a different
rate. Users who utilize the service very intensively are
familiar with it after a few days. In contrast, users who
utilize the service sporadicly need more time to get fa-
miliar with it, and their experience with the service will
evolve slower.
Therefore, the evolution of the quality ratings can
be better investigated as a function of the user’s us-
age and familiarity with the service. Figure 14 shows
the mean quality rating over the subsequent voice calls
made by the user. The number of calls made by the
user can be seen as an indication of the user’s familiar-
ity with the service. During the evaluation period, 257
users or 24.5% made 120 or more calls. The intensive
usage of the service ensures that these users get more
experience with the service and are becoming more fa-
miliar with it.
The graph clearly shows a decrease of the mean
quality rating over the first 120 voice calls made by the
users. This is confirmed by a linear regression analysis
that has as the independent variable the number of calls
already made by the user, and as dependent variable the
mean quality rating at that moment.
The resulting linear model has a significant slope
for the number of calls made by the user (p < 0.005),
thereby indicating that the mean quality rating de-
creases significantly as the familiarity with the service
increases. The R2 value of the model is 0.2885. Equa-
tion (4) shows that the mean quality rating is 3.22 for
the first call of the users and that this mean quality
rating slightly decreases as users have utilized the ser-
12 Toon De Pessemier et al.
1
1.25
1.5
1.75
2
2.25
2.5
2.75
3
3.25
3.5
3.75
4
4.25
4.5
4.75
5
0 5 10 15 20 25 30 35 40 45 50 55 60 65 70 75 80 85 90 95 100 105 110 115 120
Me
an Q
ual
ity
Rat
ing
Number of Calls Made by the User
Mean Rating Experiment
Linear Regression
Fig. 14 The evolution of the mean quality rating over serviceusage
vice more often. After making 120 voice calls, the mean
quality rating is 0.31 lower compared to the first call.
MeanQualityRating = 3.2229− 0.0026 ∗NumberOfCallsMade(4)
This decrease in mean quality rating can be ex-
plained by the evolution in the user’s familiarity and
experience with the service. When users start utilizing
a service, they have some expectations influencing their
judgment of the service. When users utilize the service
more often, they become more experienced and familiar
with the service, thereby adjusting their expectations.
Familiarity with the service might induce higher expec-
tations, based on the users’ previous experiences with
the service. Higher expectations may in turn lead to
a lower quality assessment. In addition, after using the
service several times, users might pay more attention to
the quality, thereby noticing more artifacts in the au-
dio, and as a result perceiving the quality of the service
differently. Important to note is that this trend does
not continue during extended use of the service. For
intensive users, we notice that the subjective quality
stagnates after about 120 calls; users are fully familiar
with the service and the mean rating remains constant.
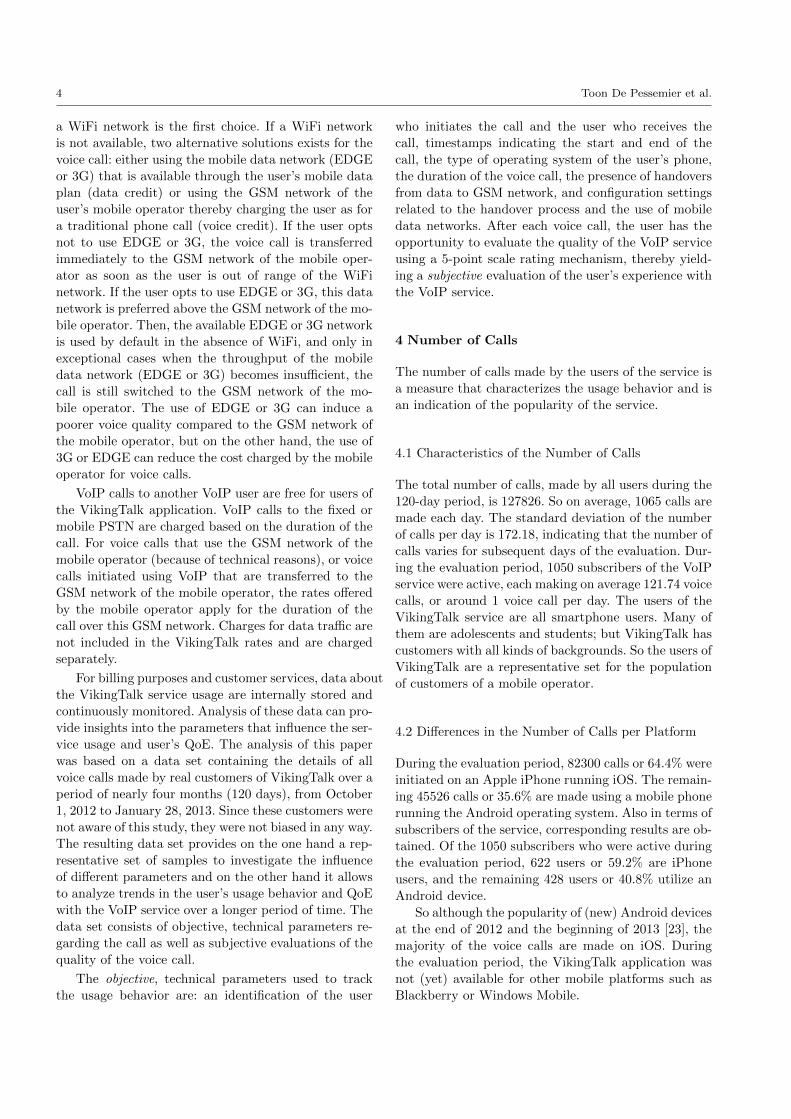
7 Network and Handover Influences
In order to quantify the user’s quality rating and in the
end improving the QoE, analyzing the influence of the
different technical parameters is of vital importance.
This section discusses in detail the influence of the net-
work that was used and handovers during the voice call.
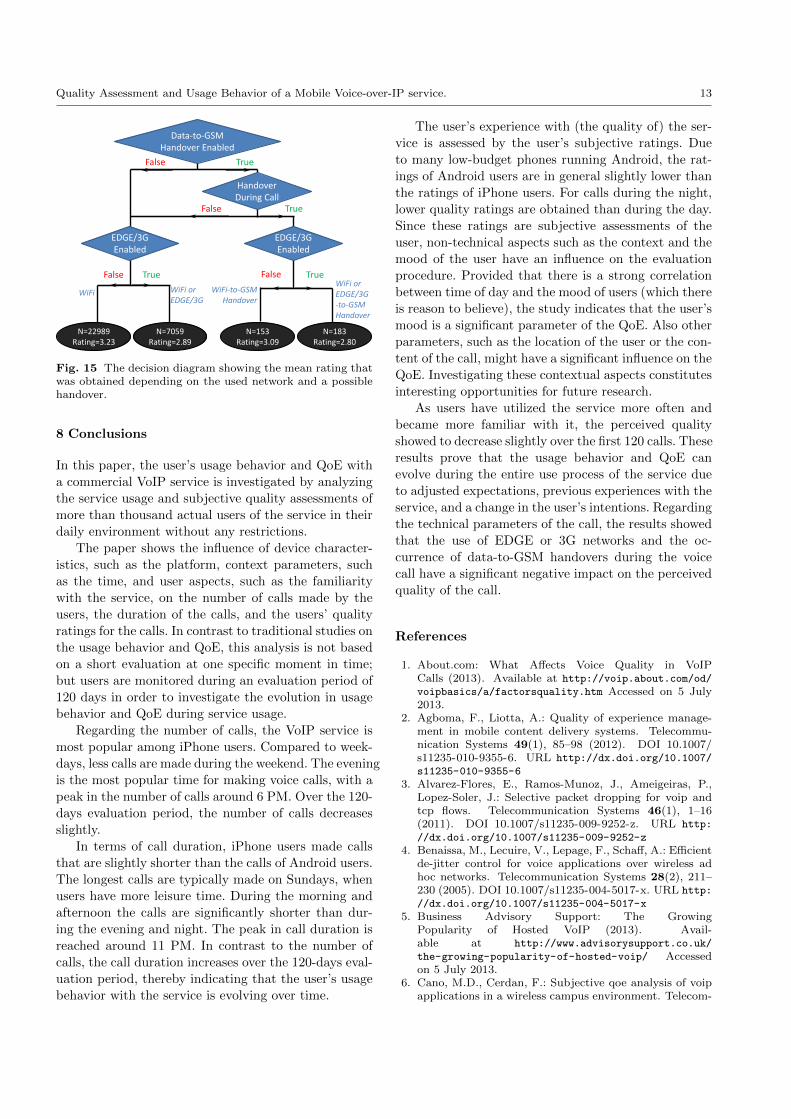
Figure 15 summarizes the effect of the considered pa-
rameters on the subjective quality rating of the user.
As explained in Section 3, users can enable or disable
the handover process in the configuration settings of
the application. Users can opt to enable this handover
process in order to make voice calls possible in case the
data connection is lost or opt to disable this handover
process to reduce the cost charged by their mobile oper-
ator. Analyzing the data set shows that the automatic
handover process was enabled for 10.0% of the evalu-
ated calls, or 3045 calls.
If the handover process is disabled, the call is under
no circumstances transferred to the GSM network of the
user’s mobile operator. In this case, the VikingTalk ap-
plication attempts to initiate the call over an available
WiFi network. If a WiFi network is not available, the
voice call can be made using a connection over a cellu-
lar data network (EDGE or 3G). In order to make this
possible, the user has to enable the option to use EDGE
or 3G for voice calls in the configuration of the applica-
tion. For approximately 23.8% of the voice calls, users
have enabled the use of EDGE or 3G. Figure 15 demon-
strates that for voice calls during which no handover
occurs, the calls made over a WiFi network receive a
higher mean quality rating, than the calls in which the
option for EDGE or 3G is enabled. The difference of
0.34 showed to be significant according to a statistical
T-test with the following resulting parameters: degrees
of freedom = 13333.69, t = 16.33, p < 0.005.
Even if the handover process is enabled, many voice
calls will be made without a handover. Only in case
of an insufficient throughput or loss of coverage on the
data network, the VikingTalk service falls back on the
network of the user’s mobile operator. For most voice
calls, network conditions are stable and such handover
is not necessary. In about 1.1% of the cases, or 336
calls with a rating, an handover from a data- to GSM-
network occurred. Because such a data-to-GSM han-
dover can introduce distortions during the call, calls
during which such an handover occurs receive gener-
ally a lower rating from the user than calls without
handovers. Figure 15 indicates that the mean difference
between a call without and a call with handover is 0.14
if only WiFi is used, and 0.09 if EDGE/3G networks
are enabled. Since the voice quality obtained by using
EDGE or 3G is typically lower than the quality over
WiFi, the additional distortion introduced by a han-
dover has a lower impact if the VoIP call is using an
EDGE or 3G network.
Also for calls during which a data-to-GSM handover
occurs, a significant difference in quality rating is wit-
nessed between calls in which EDGE/3G networks are
enabled and calls that use only WiFi networks (differ-
ence of 0.29). As a result, the use of EDGE or 3G net-
works and the occurrence of data-to-GSM handovers
during the voice call have a significant negative impact
on the subjectively-perceived quality of the call.
Quality Assessment and Usage Behavior of a Mobile Voice-over-IP service. 13
False True
False True
WiFi WiFi or EDGE/3G
True False
False True
WiFi-to-GSM Handover
WiFi or EDGE/3G -to-GSM Handover
N=183 Rating=2.80
Data-to-GSM Handover Enabled
EDGE/3G Enabled
EDGE/3G Enabled
Handover During Call
N=153 Rating=3.09
N=7059 Rating=2.89
N=22989 Rating=3.23
Fig. 15 The decision diagram showing the mean rating thatwas obtained depending on the used network and a possiblehandover.
8 Conclusions
In this paper, the user’s usage behavior and QoE with
a commercial VoIP service is investigated by analyzing
the service usage and subjective quality assessments of
more than thousand actual users of the service in their
daily environment without any restrictions.
The paper shows the influence of device character-
istics, such as the platform, context parameters, such
as the time, and user aspects, such as the familiarity
with the service, on the number of calls made by the
users, the duration of the calls, and the users’ quality
ratings for the calls. In contrast to traditional studies on
the usage behavior and QoE, this analysis is not based
on a short evaluation at one specific moment in time;
but users are monitored during an evaluation period of
120 days in order to investigate the evolution in usage
behavior and QoE during service usage.
Regarding the number of calls, the VoIP service is
most popular among iPhone users. Compared to week-
days, less calls are made during the weekend. The evening
is the most popular time for making voice calls, with a
peak in the number of calls around 6 PM. Over the 120-
days evaluation period, the number of calls decreases
slightly.
In terms of call duration, iPhone users made calls
that are slightly shorter than the calls of Android users.
The longest calls are typically made on Sundays, when
users have more leisure time. During the morning and
afternoon the calls are significantly shorter than dur-
ing the evening and night. The peak in call duration is
reached around 11 PM. In contrast to the number of
calls, the call duration increases over the 120-days eval-
uation period, thereby indicating that the user’s usage
behavior with the service is evolving over time.
The user’s experience with (the quality of) the ser-
vice is assessed by the user’s subjective ratings. Due
to many low-budget phones running Android, the rat-
ings of Android users are in general slightly lower than
the ratings of iPhone users. For calls during the night,
lower quality ratings are obtained than during the day.
Since these ratings are subjective assessments of the
user, non-technical aspects such as the context and the
mood of the user have an influence on the evaluation
procedure. Provided that there is a strong correlation
between time of day and the mood of users (which there
is reason to believe), the study indicates that the user’s
mood is a significant parameter of the QoE. Also other
parameters, such as the location of the user or the con-
tent of the call, might have a significant influence on the
QoE. Investigating these contextual aspects constitutes
interesting opportunities for future research.
As users have utilized the service more often and
became more familiar with it, the perceived quality
showed to decrease slightly over the first 120 calls. These
results prove that the usage behavior and QoE can
evolve during the entire use process of the service due
to adjusted expectations, previous experiences with the
service, and a change in the user’s intentions. Regarding
the technical parameters of the call, the results showed
that the use of EDGE or 3G networks and the oc-
currence of data-to-GSM handovers during the voice
call have a significant negative impact on the perceived
quality of the call.
References
1. About.com: What Affects Voice Quality in VoIPCalls (2013). Available at http://voip.about.com/od/
voipbasics/a/factorsquality.htm Accessed on 5 July2013.
2. Agboma, F., Liotta, A.: Quality of experience manage-ment in mobile content delivery systems. Telecommu-nication Systems 49(1), 85–98 (2012). DOI 10.1007/s11235-010-9355-6. URL http://dx.doi.org/10.1007/
s11235-010-9355-6
3. Alvarez-Flores, E., Ramos-Munoz, J., Ameigeiras, P.,Lopez-Soler, J.: Selective packet dropping for voip andtcp flows. Telecommunication Systems 46(1), 1–16(2011). DOI 10.1007/s11235-009-9252-z. URL http:
//dx.doi.org/10.1007/s11235-009-9252-z
4. Benaissa, M., Lecuire, V., Lepage, F., Schaff, A.: Efficientde-jitter control for voice applications over wireless adhoc networks. Telecommunication Systems 28(2), 211–230 (2005). DOI 10.1007/s11235-004-5017-x. URL http:
//dx.doi.org/10.1007/s11235-004-5017-x
5. Business Advisory Support: The GrowingPopularity of Hosted VoIP (2013). Avail-able at http://www.advisorysupport.co.uk/
the-growing-popularity-of-hosted-voip/ Accessedon 5 July 2013.
6. Cano, M.D., Cerdan, F.: Subjective qoe analysis of voipapplications in a wireless campus environment. Telecom-
14 Toon De Pessemier et al.
munication Systems 49(1), 5–15 (2012). DOI 10.1007/s11235-010-9348-5. URL http://dx.doi.org/10.1007/
s11235-010-9348-5
7. Cardeal, S., Neves, F., Soares, S., Tavares, F., Assuncao,P.: Arqos R©: System to monitor qos/qoe in voip. In:EUROCON - International Conference on Computer asa Tool (EUROCON), 2011 IEEE, pp. 1–2 (2011). DOI10.1109/EUROCON.2011.5929310
8. Ciszkowski, T., Mazurczyk, W., Kotulski, Z., Hofeld, T.,Fiedler, M., Collange, D.: Towards quality of experience-based reputation models for future web service provision-ing. Telecommunication Systems 51(4), 283–295 (2012).DOI 10.1007/s11235-011-9435-2. URL http://dx.doi.
org/10.1007/s11235-011-9435-2
9. De Pessemier, T., De Moor, K., Joseph, W., De Marez,L., Martens, L.: Quantifying subjective quality evalua-tions for mobile video watching in a semi-living lab con-text. Broadcasting, IEEE Transactions on 58(4), 580–589(2012). DOI 10.1109/TBC.2012.2199590
10. De Pessemier, T., De Moor, K., Joseph, W., De Marez,L., Martens, L.: Quantifying the influence of rebufferinginterruptions on the user’s quality of experience duringmobile video watching. Broadcasting, IEEE Transactionson 59(1), 47–61 (2013). DOI 10.1109/TBC.2012.2220231
11. De Pessemier, T., De Moor, K., Ketyko, I., Joseph,W., De Marez, L., Martens, L.: Investigating the influ-ence of qos on personal evaluation behaviour in a mo-bile context. Multimedia Tools and Applications 57(2),335–358 (2012). DOI 10.1007/s11042-010-0712-y. URLhttp://dx.doi.org/10.1007/s11042-010-0712-y
12. Geerts, D., De Moor, K., Ketyko, I., Jacobs, A., Van denBergh, J., Joseph, W., Martens, L., De Marez, L.: Linkingan integrated framework with appropriate methods formeasuring qoe. In: Quality of Multimedia Experience(QoMEX), 2010 Second International Workshop on, pp.158–163 (2010). DOI 10.1109/QOMEX.2010.5516292
13. Giannakidou, E., Koutsonikola, V., Vakali, A., Kompat-siaris, I.: In & out zooming on time-aware user/tag clus-ters. Journal of Intelligent Information Systems 38(3),685–708 (2012). DOI 10.1007/s10844-011-0173-4. URLhttp://dx.doi.org/10.1007/s10844-011-0173-4
14. Hoßfeld, T., Binzenhfer, A.: Analysis of skype voiptraffic in umts: End-to-end qos and qoe measure-ments. Computer Networks 52(3), 650 – 666(2008). DOI http://dx.doi.org/10.1016/j.comnet.2007.10.008. URL http://www.sciencedirect.com/science/
article/pii/S138912860700299X
15. Huang, T.Y., Huang, P., Chen, K.T., Wang, P.J.: Couldskype be more satisfying? a qoe-centric study of the fecmechanism in an internet-scale voip system. Network,IEEE 24(2), 42–48 (2010). DOI 10.1109/MNET.2010.5430143
16. International Telecommunication Union: Definition ofQuality of Experience (QoE). Liaison statement, ITU-T, International Telecommunication Union (2007). Ref.:TD 109 rev 2 (PLEN/12)
17. Jammeh, E., Mkwawa, I., Khan, A., Goudarzi, M., Sun,L., Ifeachor, E.: Quality of experience (qoe) driven adap-tation scheme for voice/video over ip. Telecommuni-cation Systems 49(1), 99–111 (2012). DOI 10.1007/s11235-010-9356-5. URL http://dx.doi.org/10.1007/
s11235-010-9356-5
18. Jelassi, S., Youssef, H., Hoene, C., Pujolle, G.: Single-ended parametric voicing-aware models for live assess-ment of packetized voip conversations. Telecommuni-cation Systems 49(1), 17–34 (2012). DOI 10.1007/
s11235-010-9350-y. URL http://dx.doi.org/10.1007/
s11235-010-9350-y
19. Karapanos, E., Zimmerman, J., Forlizzi, J., Martens,J.B.: User experience over time: an initial framework. In:Proceedings of the SIGCHI Conference on Human Fac-tors in Computing Systems, CHI ’09, pp. 729–738. ACM,New York, NY, USA (2009). DOI 10.1145/1518701.1518814. URL http://doi.acm.org/10.1145/1518701.
1518814
20. Kutner, M.H., Nachtsheim, C.J., Neter, J., Li, W.: Ap-plied Linear Statistical Models, fifth edn. McGraw-Hill(2005)
21. Lambrinos, L., Djouvas, C.: Improving quality of ex-perience in wireless voip through novel call scheduling.Telecommunication Systems 52(4), 1905–1916 (2013).DOI 10.1007/s11235-011-9473-9. URL http://dx.doi.
org/10.1007/s11235-011-9473-9
22. Li, X., Toseef, U., Dulas, D., Bigos, W., Grg, C., Timm-Giel, A., Klug, A.: Dimensioning of the lte access net-work. Telecommunication Systems 52(4), 2637–2654(2013). DOI 10.1007/s11235-011-9593-2. URL http:
//dx.doi.org/10.1007/s11235-011-9593-2
23. Llamas, R., Reith, R., Shirer, M.: Apple Cedes Mar-ket Share in Smartphone Operating System Market asAndroid Surges and Windows Phone Gains, Accord-ing to IDC. IDC - Press Release (2013). Avail-able at http://www.idc.com/getdoc.jsp?containerId=
prUS24257413 Accessed on 26 August 2013.24. Manousos, M., Apostolacos, S., Grammatikakis, I.,
Mexis, D., Kagklis, D., Sykas, E.: Voice-quality moni-toring and control for voip. Internet Computing, IEEE9(4), 35–42 (2005). DOI 10.1109/MIC.2005.92
25. Novkov, L., tepnkov, O.: Visualization of trends usingradviz. Journal of Intelligent Information Systems 37(3),355–369 (2011). DOI 10.1007/s10844-011-0157-4. URLhttp://dx.doi.org/10.1007/s10844-011-0157-4
26. Palmieri, F.: Large scale voice over ip experiences on highperformance intranets. In: S. Chaudhuri, S. Das, H. Paul,S. Tirthapura (eds.) Distributed Computing and Net-working, Lecture Notes in Computer Science, vol. 4308,pp. 355–366. Springer Berlin Heidelberg (2006)
27. Princeton University: Pareto distribution (2013). Avail-able at http://www.princeton.edu/~achaney/tmve/
wiki100k/docs/Pareto_distribution.html Accessed on27 August 2013
28. Rajaraman, S.: Five Stars Dominate Ratings.YouTube Official Blog (2009). Available athttp://youtube-global.blogspot.be/2009/09/
five-stars-dominate-ratings.html Accessed on15 July 2013.
29. Reiter, U.: Overall perceived audiovisual quality - whatpeople pay attention to. In: IEEE 15th InternationalSymposium on Consumer Electronics 2011 (ISCE), pp.513–517 (2011). DOI 10.1109/ISCE.2011.5973883
30. Rowe, L.A., Jain, R.: Acm sigmm retreat report on futuredirections in multimedia research. ACM Transactions onMultimedia Computing, Communications, and Applica-tions 1(1), 3–13 (2005). DOI 10.1145/1047936.1047938.URL http://doi.acm.org/10.1145/1047936.1047938
31. Soldani, D., Li, M., Cuny, R.: QoS and QoE Managementin UMTS Cellular Systems, pp. i–xxvii. John Wiley &Sons, Ltd (2006)