Embed Size (px)
Citation preview

4
Quality and Leniency in Online Collaborative Rating Systems
HADY W. LAUW, Nanyang Technological UniversityEE-PENG LIM, Singapore Management UniversityKE WANG, Simon Fraser University
The emerging trend of social information processing has resulted in Web users’ increased reliance on user-generated content contributed by others for information searching and decision making. Rating scores, aform of user-generated content contributed by reviewers in online rating systems, allow users to leverageothers’ opinions in the evaluation of objects. In this article, we focus on the problem of summarizing therating scores given to an object into an overall score that reflects the object’s quality. We observe thatthe existing approaches for summarizing scores largely ignores the effect of reviewers exercising differentstandards in assigning scores. Instead of treating all reviewers as equals, our approach models the leniencyof reviewers, which refers to the tendency of a reviewer to assign higher scores than other coreviewers. Ourapproach is underlined by two insights: (1) The leniency of a reviewer depends not only on how the reviewerrates objects, but also on how other reviewers rate those objects and (2) The leniency of a reviewer and thequality of rated objects are mutually dependent. We develop the leniency-aware quality, or LQ model, whichsolves leniency and quality simultaneously. We introduce both an exact and a ranked solution to the model.Experiments on real-life and synthetic datasets show that LQ is more effective than comparable approaches.LQ is also shown to perform consistently better under different parameter settings.
Categories and Subject Descriptors: H.4 [Information Systems Applications]:; J.4 [Social andBehavioral Sciences]:
General Terms: Algorithms, Experimentation, Human Factors
Additional Key Words and Phrases: Quality, leniency, rating, link analysis, social network mining
ACM Reference Format:Lauw, H. W., Lim, E.-P., and Wang, K. 2012. Quality and leniency in online collaborative rating systems.ACM Trans. Web 6, 1, Article 4 (March 2012), 27 pages.DOI = 10.1145/2109205.2109209 http://doi.acm.org/10.1145/2109205.2109209
1. INTRODUCTION
Web 2.0 sees the emergence of a more interactive Web. Users are no longer just perus-ing content, but are also contributing content through their interactions on social me-dia sites, such as blogs, wikis, content sharing (Flickr,1 YouTube,2) social bookmarking
1http://www.flickr.com2http://www.youtube.com
H. W. Lauw is currently affiliated with the Institute for Infocomm Research.Authors’ addresses: H. W. Lauw, Institute for Infocomm Research, 1 Fusionopolis Way #21-01 Connexis(South Tower), Singapore 138632; email: [email protected]; E.-P. Lim, School of Information Sys-tems, Singapore Management University, 80 Stamford Road, Singapore 178902; email: [email protected];K. Wang, Department of Computing Science, Simon Fraser University, 8888 University Drive, Burnaby,British Columbia, Canada V5A 1S6; email: [email protected] to make digital or hard copies of part or all of this work for personal or classroom use is grantedwithout fee provided that copies are not made or distributed for profit or commercial advantage and thatcopies show this notice on the first page or initial screen of a display along with the full citation. Copyrightsfor components of this work owned by others than ACM must be honored. Abstracting with credit is permit-ted. To copy otherwise, to republish, to post on servers, to redistribute to lists, or to use any component ofthis work in other works requires prior specific permission and/or a fee. Permissions may be requested fromthe Publications Dept., ACM, Inc., 2 Penn Plaza, Suite 701, New York, NY 10121-0701, USA, fax +1 (212)869-0481, or [email protected]© 2012 ACM 1559-1131/2012/03-ART4 $10.00
DOI 10.1145/2109205.2109209 http://doi.acm.org/10.1145/2109205.2109209
ACM Transactions on the Web, Vol. 6, No. 1, Article 4, Publication date: March 2012.

4:2 H. W. Lauw et al.
Fig. 1. Bipartite rating network.
(Del.icio.us3), product reviews (Epinions4), recommender systems (GroupLens5), etc.This active contribution and usage of user-generated content has motivated the studyof social information processing, whereby one exploits the knowledge and opinionsgenerated by users (“wisdom of the crowd”) of Web 2.0 applications, for informationsearching and decision making.
In this article, we focus on online collaborative rating systems, whereby a user mayact as a reviewer, by contributing opinions in the form of rating scores to objects (prod-ucts, content items, etc.), as well as a consumer, by using the rating scores to compareobjects and select the best ones. Such rating systems can be found in many social me-dia sites as just mentioned. Thus, collaborative rating allows users (as consumers) toleverage the knowledge and opinions of others (reviewers) in the evaluation of objects.
It is also worth noting that our target is the objective rating space [Traupman andWilensky 2004a], in which a rating score is primarily used to interpret the inherentquality of an object, and our main interest is in the quality of objects. As opposedto the subjective rating space, in which a rating score is primarily used to interpretthe preference of a reviewer, such as in recommender and collaborative-filteringsystems [Lemire 2005; Shen et al. 2006], in which the main interest is modeling userpreferences.
Besides online collaborative rating systems, rating objects is also a vital componentin many applications, including conference review [Dumais and Nielsen 1992; Gellerand Scherl 1997], grant proposal selection [Hettich and Pazzani 2006], etc. In eachcase, it is important to ensure that the rating has been conducted as fairly and objec-tively as possible. Unfair ratings may result in adverse outcomes. For instance, it wasreported in TIME magazine, on February 16, 2002, that a French referee at the 2002Winter Olympics figure-skating event confessed to being pressured into voting for theRussian team for the gold medal award. Later, the Canadian team was awarded asecond Gold Medal in an attempt to correct the unfair rating. The incident caused amajor controversy in the Olympic community and tainted the reputation for fairnessof this sporting event.
1.1. Problem
We represent a rating system as a bipartite network with reviewers and objects as thetwo distinct types of nodes, as shown in Figure 1. A reviewer ri may assign a ratingscore eij ∈ [0, 1] to an object o j, which is represented as an edge from ri to o j, weightedby eij. In this article, we focus on the score summarization problem, which concerns
3http://del.icio.us4http://www.epinions.com5http://www.grouplens.org
ACM Transactions on the Web, Vol. 6, No. 1, Article 4, Publication date: March 2012.

Quality and Leniency in Online Collaborative Rating Systems 4:3
Fig. 2. Rating data examples.
how to aggregate the eij scores assigned to an object o j in order to derive a measure q jthat best reflects the ground-truth quality of o j.
A straightforward approach to determining quality is to average the scores given toan object, as shown in Equation (1). This approach, which we term the Naive model,treats the scores by different reviewers equally, such that
q j = Avgi
eij. (1)
The Naive model would be adequate if all reviewers were to rate all (or many)objects, as supported by the law of large numbers [Grimmett and Stirzaker 1982].However, this is not a realistic and practical criterion supported by most social mediaapplications, in which users may either voluntarily find or be assigned objects to rate.Therefore, we consider rating scenarios in which many objects are rated by a fewreviewers (say, less than ten), which better represents most social media applicationswith long tail frequency distributions. When an object receives a small number ofrating scores, one or two reviewers could adversely skew its aggregate quality. Inparticular, reviewers are not necessarily on an equal ground when assigning theirscores, due to differences in background, perspective, standard, etc., which may affectthe fairness of rating.
1.2. Approach
In this article, we model the variance among reviewers in terms of leniency, or thetendency of a reviewer to assign a higher score to an object than the object deserves(as determined by the quality of the object). Ours is a data-centric approach that de-termines leniency from the rating scores alone. Once determined, the leniency infor-mation can be used to adjust the rating scores appropriately to arrive at q j values thatbetter reflect the quality of objects. There could be various reasons behind leniency.For one, different reviewers may subscribe to different sub-ranges within the ratingscale. However, we do not delve into the possible causes of leniency, and instead, focuson the impact of leniency on rating scores. Two insights about leniency underlie ourapproach.
Insight I. Networked Approach to Leniency. The leniency of a reviewer can only be deter-mined relative to her coreviewers. A reviewer who tends to give a higher rating scorethan a majority of coreviewers has a tendency of being lenient. Similarly, when consid-ering the quality of an object, we need to consider how other objects have been ratedby its reviewers. The following example illustrates this point.
Example 1.1. Figure 2(a) and 2(b) show two sets of rating data under the samereviewer/object assignment. The matrix elements are the eij scores. A ‘—’ denotes thatthe reviewer has not evaluated the object. In both datasets, o1 receives the same set ofscores (0.7 from r1, 0.4 from r2, and 0.4 from r3). Using the averaging approach (Naive
ACM Transactions on the Web, Vol. 6, No. 1, Article 4, Publication date: March 2012.

4:4 H. W. Lauw et al.
model), we arrive at the same overall score for o1 (q1 = 0.5) in both datasets. However,a more reasonable outcome is that o1 should receive a lower overall score in the firstdataset than in the second.
Consider Figure 2(a) first. The varying scores received by o1 suggest that either r1’sscore is too high, or r2 and r3’s scores are too low. If we consider the scores of otherobjects, we observe that r1 also assigns higher scores than her coreviewers on o2 ando3. In contrast, r2 and r3 tend to agree with their coreviewers on o4 and o5 respectively.The record suggests that it is more likely that r1 is lenient, and r2 and r3 are not. Thus,it makes sense to trust the scores by r2 and r3 more.
In Figure 2(b), it is r1 who tends to agree with her coreviewers on o2 and o3, whereasr2 and r3 show a record of assigning lower scores than the majority of their coreviewerson o4 and o5. In this case, it makes sense to trust r1’s score more, even though r1 is theminority.
Insight II. Mutual Dependency between Leniency and Quality. The two measures of interest,leniency and quality, are mutually dependent. One the one hand, to determine a re-viewer’s leniency, we need to know the quality of objects rated by the reviewer as abaseline to measure leniency. On the other hand, to determine the quality of an object,we need to know the leniency of its reviewers.
In this work, we assume that the rating scores represent a ground truth that canbe trusted for the study. We believe that in general successful social media sites sup-port a majority of reviewers who are honest, acting according to their best judgmentwhen assigning ratings. In some cases, where rating is voluntary, reviewers may bemotivated differently. For instance, some only assign ratings when they have negativeexperience. However, this does not present a major problem to our approach as long asthis phenomenon occurs generally, in which case, the relative standing among objectswill not be directly affected. The true signal really comes from the relative ratings(and not the absolute ratings) assigned by the same reviewer on two different objects.
1.3. Contributions
We make the following technical contributions in this article.
(1) We identify a new approach to the score-summarization problem, which concernshow to mine the leniency behavior of reviewers and use it to derive the quality ofobjects more equitably.
(2) We develop the Leniency-Aware Quality (LQ) model that solves leniency and qual-ity simultaneously, using the previously mentioned insights on the networked ap-proach to leniency and the mutual dependency between leniency and quality. Themodel features two possible modes of compensating for leniency: Relative mode,which models leniency in relative terms, and Absolute mode, which models leniencyin absolute terms.
(3) We show that two types of solution to the LQ model exists. The exact solution rep-resents leniency and quality as numeric measures, and the ranked solution repre-sents leniency and quality as ranked measures. We characterize the conditions forthe existence of each solution.
(4) We verify the efficacy of our approach through experiments on real-life and syn-thetic datasets, showing that the LQ model outperforms the baseline models, bothin producing more reasonable outcomes and in reconstructing the predeterminedground-truth more accurately.
This problem and the solution based on Relative mode (described in Section 3.1)were first explored in our earlier work [Lauw et al. 2007]. In this article, we sig-nificantly extend our treatment of this approach, by introducing the Absolute mode
ACM Transactions on the Web, Vol. 6, No. 1, Article 4, Publication date: March 2012.

Quality and Leniency in Online Collaborative Rating Systems 4:5
(described in Section 3.2). In addition, we now comprehensively evaluate the proposedapproaches on a much larger real-life dataset, in addition to a synthetic dataset withknown ground truth, against not only the Naive baseline, but also reputation-basedand distribution-based approaches.
1.4. Paper Organization
The rest of the paper is organized as follows. Section 2 reviews related work. Sec-tion 3 describes the proposed LQ model. Section 4 discusses the two types of solution(exact and ranked) to the LQ model. Sections 5 and 6 verify the effectiveness of our ap-proach through experiments on real-life and synthetic datasets respectively. Section 7concludes.
2. RELATED WORK
Our work is closely related to previous work on score summarization and score normal-ization, which we will discuss shortly. The key difference is that our work stands outin terms of modeling leniency (a micro-behavior of individual reviewers). Leniency isinherently different from other metrics (e.g., reputation, deviation, average) that havebeen previously studied. In particular, the leniency of one reviewer not only dependson her own score, but also on the score of coreviewers. So we have to extract leniencyby a mutual-reinforcement model.
Score Summarization. Score summarization is concerned with aggregating ratingscores into an overall quality for each object. Some previous work models the varyingability of reviewers in assessing the quality of an object (also referred to as “reputa-tion”). Instead of the simple mean (the Naive model), reputation-based approachesuse the weighted mean of rating scores, with more reputable reviewers given higherweights, as given in Equation (2). Riggs and Wilensky [2001] base the reputation wi ofa reviewer ri on consensus, that is, how closely ri’s rating scores are to the object aver-ages, as shown in Equation (3). Alternatively, the reputation of a reviewer may also bebased on the opinions of other reviewers [Chen and Singh 2001]. However, reputationdoes not equal to leniency, as even a reputable reviewer may still be lenient, that ismay use a higher range of scores compared to other reviewers.
q j =∑
i wi × eij∑i wi
. (2)
wi = 1 − Avgj
|eij − q j|, (3)
Score Normalization. Score normalization deals with converting rating scores of re-viewers to a normalized scale. Most works assume that scores by each reviewer canfit into a particular distribution, and that reviewers rate objects with comparable dis-tributions. Given that most reviewers tend to rate very few objects, it is unlikely thisassumption will hold. In contrast, our approach does not assume any distribution, butrather, is data-centric. We use a mutual-reinforcing model to compute the convergedvalues.
One popular choice is the normal distribution, in which each reviewer ri is associ-ated with a mean μi and standard deviation σi of ri’s scores on various objects. Resnicket al. [1994] employ z-score normalization [Walpole et al. 2002], in which a rating scoreeij by reviewer ri is converted into its z-score zij, according to Equation (4). Given thatreviewers may have different means and standard deviations, z-score normalizationaims to calibrate their scores to a more equitable standard [Arkes 2003]. Other varia-tions include simply subtracting the rating score by a reviewer’s average [Sarwar et al.
ACM Transactions on the Web, Vol. 6, No. 1, Article 4, Publication date: March 2012.

4:6 H. W. Lauw et al.
2000], subtraction followed by L p normalization [Lemire 2005] (in the case of L2 norm,it reduces to z-score), or by factor analysis [Traupman and Wilensky 2004b].
zij =eij − μi
σi. (4)
Probability-based approaches [Fernandez et al. 2006; Jin and Si 2004; Jin et al.2003] convert a rating score to a probability value. One of the objectives is to removethe impact of outlier ratings. However, to estimate the probability values well, thisapproach relies on the availability of many ratings per reviewer.
Score normalization is also used in metasearch [Arampatzis and Kamps 2009;Fernandez et al. 2006; Manmatha and Sever 2002], where the objective is to combinethe outputs of several search engines in response to a query. The basic approach insuch cases is to fit the relevance scores to a binary mixture model—normal distribu-tion for relevant pages and exponential distribution for irrelevant ones. The contextis very different from the problem we consider here. For one thing, a reviewer is notnormally associated with irrelevant objects.
Recommender Systems. According to [Adomavicius and Tuzhilin 2005; Herlockeret al. 2000, 2002], recommender systems would consider recommending relevant itemsto a target user, based on some sort of similarity between the target user and otherneighboring users. Content-based systems exploit certain profiles of items and usersto define this similarity, whereas collaborative filtering (CF) exploits the ratings onitems to define this similarity. The former assumes that profile information of itemsand users is available, whereas the latter assumes that a rating database is available.This is different from our problem of finding the “true” (aggregate) rating of each itemgiven a set of raw ratings collected from a set of users. We neither assume that profileinformation is given, nor that the rating data is the“ground truth”. Rather, our prob-lem assumes that the raw ratings may be biased in that some users are more generousthan others, and the “true” rating would correct this bias effect. Therefore, in order tofind the “true” rating, our problem also finds the generosity or leniency of each user.
Other than similarity between users, several works on recommender systems alsoconsider the notion of trust [Massa and Avesani 2005] or social relationships betweenusers [Ma et al. 2008, 2009]. In our problem, we are not given such social or trustnetworks, except for the raw user-item rating data. The data is ”raw” in the sense thatan individual rating may be biased, therefore, is not trusted. In the review problemconsidered here, it is not reasonable to assume that the trust and bias informationabout reviewers are known. No reviewer will admit that she or he is biased. Our workdetects the bias of reviewers by analyzing the collective behavior of reviewers, on theassumption that a majority of reviewers behaves normally.
Some recommender systems employ pre-processing techniques designed to “correct”some global effects such as the number of ratings or the average ratings from the ratingscores [Bell and Koren 2007], or to fill up missing rating values [Shen et al. 2006]. Ourproblem can be seen as correcting the leniency effect of reviewers to determine the“true” quality of objects. Hence, the methods presented in this paper may potentiallyhelp recommender systems to arrive at better rating predictions. Although it is not themain focus of our work here, we will conduct a preliminary investigation of the utilityof our work for rating prediction in Section 5.5.
Miscellaneous. Multi-criteria decision making (MCDM) [Figueira et al. 2005;Korhonen et al. 1992] deals with how to make an optimal decision, taking into accounttwo or more potentially conflicting criteria. The optimal decision may vary accordingto the subjective preferences of the decision maker. In our problem setting, the quality
ACM Transactions on the Web, Vol. 6, No. 1, Article 4, Publication date: March 2012.

Quality and Leniency in Online Collaborative Rating Systems 4:7
measure is objectively associated with an object and is determined from the score, datawithout using subjective parameters.
The rating behavior of reviewers may be influenced by certain biases. The studyof cognitive biases concerns people’s predisposed opinions that may come from spe-cific heuristics or mental shortcuts [Bazerman 1990; Busenitz and Lau 1996; Simonet al. 1999]. The main difference is that cognitive science is concerned with findingthe possible causes of biases, and therefore, hypothesizing on the possible causes iscentral to the study of cognitive biases [Blackburn and Hakel 2006]. Our approachis different, as we focus on detecting reviewer leniency and factoring it into overallscoring of object quality. Testing each possible hypothesis would require much moreadditional information on reviewers or objects than is available. Such studies are alsomore appropriately done within the cognitive sciences.
Several works have also identified types of frauds in rating systems and how todetect them in various contexts, such as product reviews [Jindal and Liu 2007], tradingcommunities [Bhattacharjee and Goel 2005; Dellarocas 2000; Zhang and Cohen 2006],and recommender systems [Lam and Riedl 2004; Mobasher et al. 2006]. Fraudulentratings may be different from ratings by reviewers with leniency. In our article, weassume all reviewers are doing their best when rating an object, so there is no fraud.Therefore, those methods may not apply.
Score summarization in Web-based social media can be studied as a problem in so-cial network mining. Social network involves the study of a network of associationsamong entities [Wasserman and Faust 1994]. It concerns analyzing a network to ad-dress such issues as node centrality [Faust 1997], trust [Golbeck and Hendler 2006;Guha et al. 2004], privacy [Backstrom et al. 2007], and community discovery [Borgattiand Everett 1997; Tantipathananandh et al. 2007; Yang et al. 2007; Zhou et al. 2006].Our work models a social behavior (leniency behavior) from network-structured data(rating network) that involves collaboration among reviewers. Ours is also the firstwork to address the issue of leniency in a network environment.
Finally, our work is also related to link analysis [Borodin et al. 2005; Haveliwala2003], which discovers important nodes (e.g., webpages) through intensive analysis oflink data (e.g., weblinks). The most well-known algorithms are PageRank [Page et al.1998] and HITS [Kleinberg 1999]. However, these works are mainly based on thenotion of popularity (e.g., link count), which is not congruent with leniency or quality.In general, the leniency of a reviewer or the quality of an object is not related to thecount of scores. Rather, it is the score value that matters.
3. LENIENCY-AWARE QUALITY (LQ) MODEL
Given a score data, we seek to determine the quality q j of each object o j. The keyprinciple in our approach is to model the leniency li of each reviewer ri, and use it toderive q j.
3.1. Model
Our LQ model consists of a pair of equations (Equations (5) and (6)) that determinethe leniency of reviewers and the quality of rated objects respectively. To measure howlenient a reviewer ri is, we need to know how ri’s rating scores compare to the qualityof rated objects. Suppose that q j is known, the extent to which the given score eij isinflated or deflated can be measured by eij−qj
eij. Note that the inflation (or deflation)
is measured relative to the base score eij.6 If ri regularly inflates her rating scores,we have even more evidence that ri is lenient. Hence, to determine li, we aggregate
6The case of eij = 0 should be avoided by replacing such eij with an appropriately small value.
ACM Transactions on the Web, Vol. 6, No. 1, Article 4, Publication date: March 2012.

4:8 H. W. Lauw et al.
eij−qj
eijover the set of objects that ri has rated, as shown in Equation (5). Here, we use
average as the aggregation function. Consequently, li > 0 denotes a lenient reviewer,li < 0 denotes a strict reviewer; and li = 0 denotes a neutral reviewer.
li = Avgj
(eij − q j
eij
)(5)
Note that q j in Equation (5) is not known beforehand. It is to be determined asan aggregation (here, we assume average) of rating scores assigned to o j. However,suppose that we know li of each ri who has rated o j, we can then compensate for eachri’s tendency to inflate or deflate rating scores. This compensation approach of derivingq j is shown in Equation (6). If li < 0, we revise the rating score eij upwards. If li > 0,we revise it downwards. The adjustment is proportional to the base score eij. α ∈[0, 1] is a user-determined compensation factor, which controls the extent to whichthe scores may be adjusted to compensate for leniency. Larger α would lead to largercompensation.
q j = Avgi
[eij · (1 − α · li)]. (6)
By compensating, Equation (6) estimates the score that would have been assignedby a lenient reviewer had she been neutral (l ≈ 0). That way, the quality scores of twoobjects rated by different sets of reviewers, who may use different ranges within therating scale, would be more comparable. Equation (6) can even return q j < mini(eij),if all or most of o j’s reviewers have li > 0, or q j > maxi(eij) if all or most reviewershave li < 0. This is possible as the LQ model does not look at each object in isola-tion, but instead considers the broader context (how its reviewers have rated otherobjects, how those other objects are rated by other reviewers, and so on). In contrast,the Naive model (Equation (1)) and the Weighted model (Equation (2)) confine q j to[mini(eij), maxi(eij)]. Thus, the LQ model is better positioned than these two modelsin salvaging an object from a very skewed assignment of reviewers (such as an objectwhose reviewers are all strict).
The two variables li and q j are mutually dependent and must be determined si-multaneously. This dependency extends to all reviewers and objects connected to oneanother within the rating network. This is because to know a given li requires us toknow the q j of all objects rated by ri. However, for each q j, we need to know the le-niency of ri, as well as those of ri’s coreviewers on o j. This dependency could only beresolved by considering the leniency of every reviewer and the quality of every objectsimultaneously.
Note that the Naive approach is a special case of this model. When α = 0, no adjust-ment for leniency is done, and Equation (6) is reduced into Naive’s Equation (1).
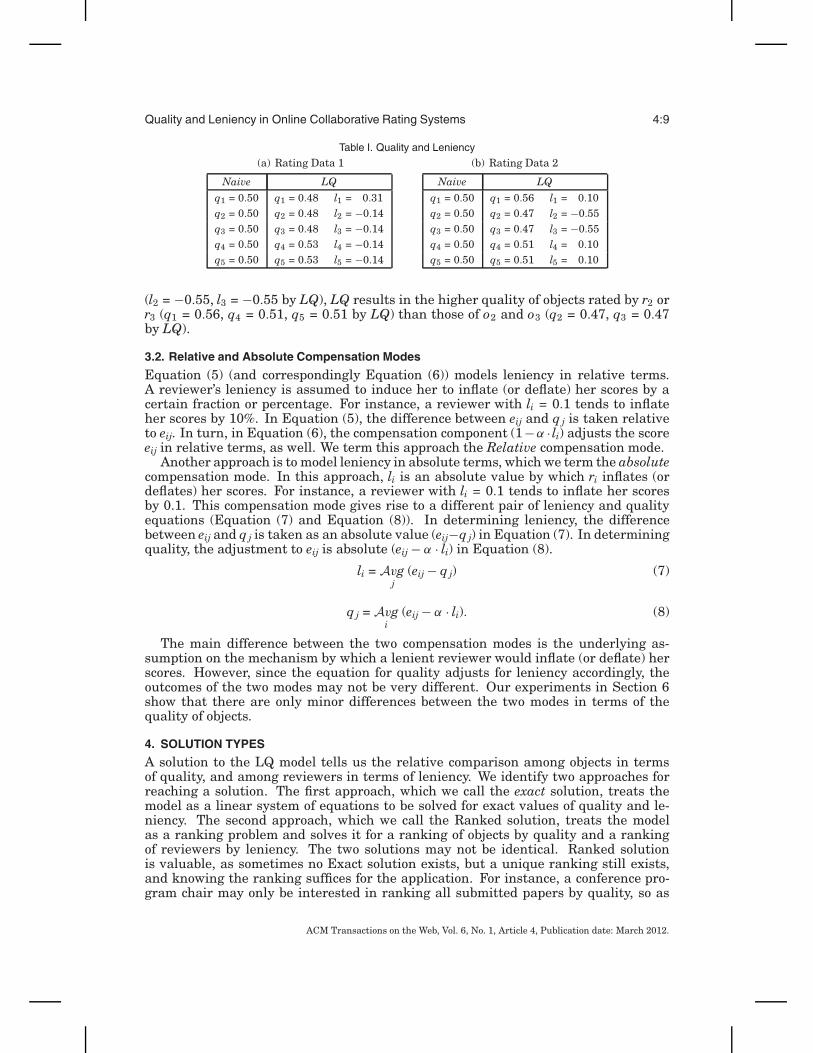
Example 3.1. Table I(a) and I(b) display the quality and leniency computed usingNaive and LQ models for Figure 2(a) and 2(b), respectively. For this example, LQuses the exact solution (to be introduced in Section 4) at α = 0.5. In both scenarios,Naive gives all objects the same quality of 0.50. We claim, however, that the differentrankings of objects by LQ are more intuitive.
Consider Table I(a) first. LQ considers objects rated by r1 (o1, o2, and o3) to be oflower quality than the other objects (o4 and o5). Note that r1 is considered lenient(l1 = 0.31 by LQ) due to r1’s tendency to give higher scores than her coreviewers on o1,o2, and o3. Adjusting for r1’s leniency, LQ arrives at the net lower quality of o1, o2, ando3 (0.48 by LQ), as compared to that of o4 and o5 (0.53 by LQ).
In Table I(b), LQ considers objects rated by r2 or r3 (o1, o4, and o5) to be of higherquality than the other objects (o2 and o3). Adjusting for the strict scoring by r2 and r3
ACM Transactions on the Web, Vol. 6, No. 1, Article 4, Publication date: March 2012.
Quality and Leniency in Online Collaborative Rating Systems 4:9
Table I. Quality and Leniency
(a) Rating Data 1
Naive LQ
q1 = 0.50 q1 = 0.48 l1 = 0.31q2 = 0.50 q2 = 0.48 l2 = −0.14q3 = 0.50 q3 = 0.48 l3 = −0.14q4 = 0.50 q4 = 0.53 l4 = −0.14q5 = 0.50 q5 = 0.53 l5 = −0.14
(b) Rating Data 2
Naive LQ
q1 = 0.50 q1 = 0.56 l1 = 0.10q2 = 0.50 q2 = 0.47 l2 = −0.55q3 = 0.50 q3 = 0.47 l3 = −0.55q4 = 0.50 q4 = 0.51 l4 = 0.10q5 = 0.50 q5 = 0.51 l5 = 0.10
(l2 = −0.55, l3 = −0.55 by LQ), LQ results in the higher quality of objects rated by r2 orr3 (q1 = 0.56, q4 = 0.51, q5 = 0.51 by LQ) than those of o2 and o3 (q2 = 0.47, q3 = 0.47by LQ).
3.2. Relative and Absolute Compensation Modes
Equation (5) (and correspondingly Equation (6)) models leniency in relative terms.A reviewer’s leniency is assumed to induce her to inflate (or deflate) her scores by acertain fraction or percentage. For instance, a reviewer with li = 0.1 tends to inflateher scores by 10%. In Equation (5), the difference between eij and q j is taken relativeto eij. In turn, in Equation (6), the compensation component (1−α · li) adjusts the scoreeij in relative terms, as well. We term this approach the Relative compensation mode.
Another approach is to model leniency in absolute terms, which we term the absolutecompensation mode. In this approach, li is an absolute value by which ri inflates (ordeflates) her scores. For instance, a reviewer with li = 0.1 tends to inflate her scoresby 0.1. This compensation mode gives rise to a different pair of leniency and qualityequations (Equation (7) and Equation (8)). In determining leniency, the differencebetween eij and q j is taken as an absolute value (eij−q j) in Equation (7). In determiningquality, the adjustment to eij is absolute (eij − α · li) in Equation (8).
li = Avgj
(eij − q j) (7)
q j = Avgi
(eij − α · li). (8)
The main difference between the two compensation modes is the underlying as-sumption on the mechanism by which a lenient reviewer would inflate (or deflate) herscores. However, since the equation for quality adjusts for leniency accordingly, theoutcomes of the two modes may not be very different. Our experiments in Section 6show that there are only minor differences between the two modes in terms of thequality of objects.
4. SOLUTION TYPES
A solution to the LQ model tells us the relative comparison among objects in termsof quality, and among reviewers in terms of leniency. We identify two approaches forreaching a solution. The first approach, which we call the exact solution, treats themodel as a linear system of equations to be solved for exact values of quality and le-niency. The second approach, which we call the Ranked solution, treats the modelas a ranking problem and solves it for a ranking of objects by quality and a rankingof reviewers by leniency. The two solutions may not be identical. Ranked solutionis valuable, as sometimes no Exact solution exists, but a unique ranking still exists,and knowing the ranking suffices for the application. For instance, a conference pro-gram chair may only be interested in ranking all submitted papers by quality, so as
ACM Transactions on the Web, Vol. 6, No. 1, Article 4, Publication date: March 2012.

4:10 H. W. Lauw et al.
to accept the best papers. Below, we characterize these two solutions for the Relativecompensation mode. Similar discussions apply to Absolute.
Before describing the solutions, we first rewrite Relative’s Equations (5) and (6) intoEquations (9) and (10), respectively, where cij ∈ {0, 1} is the connectivity flag. cij = 1when ri has evaluated o j, and 0 otherwise. We assume that every object is rated bysome reviewers, and that every reviewer evaluates some objects. Therefore, there willbe no division by zero.
q j =∑
i [cij · eij · (1 − α · li)]∑i cij
, (9)
li =
∑j [(cij/eij) · (eij − q j)]∑
j cij. (10)
The set of equations comprising Equation (9) for every o j and Equation (10) for everyri can be more compactly expressed as a pair of matrix equations, as in Equation (11)and Equation (12). For m reviewers and n objects, Q is n × 1 vector of q j’s, L is m × 1vector of li’s, and 1 is a vector of appropriate length containing all 1’s. U is m×n matrixwhose element uij = [(cij · eij)/
∑i cij]. V is m× n matrix whose element vij = (cij/
∑j cij).
W is m×n matrix whose element wij = [(cij/eij)/∑
j cij]. Q and L are variables, and therest are inputs.
Q = UT1 − αUT L, (11)
L = V1 − W Q. (12)
Substituting Equation (12) into Equation (11), we get a recursive equation in termsof Q, given in Equation (13). A simpler form is given in Equation (14), where X =(UT1 − αUTV1) and Y = (αUTW). Intuitively, any q j (in left-hand side Q) could beexpressed in terms of the quality of other objects (in right-hand side Q), as determinedby X and Y that govern how these objects are connected in the network. Thus, weneed to solve for Q (which can then be used to solve for L) yielding.
Q = UT1 − αUT V1 + αUTW Q, (13)
Q = X + Y Q. (14)
Subsequently, we distinguish between the Exact solution, which solves Equa-tion (14) as a linear system of equations, and the Ranked solution, which derives aunique ranking from an eigenvector equation modified from Equation (14).
4.1. Exact Solution
The Exact solution is the unique value of Q (and the corresponding (L)) satisfyingEquation (14). The matrix Equation (14) stands for a system of n linear equations interms of various q j’s. From linear algebra [Anton and Rorres 1987], we know that sucha system of linear equations may be in one of three situations.
Case 1. Consistent and Uniquely Determined. There is one unique solution, whichis the intersection point of the n linear equations.
Case 2. Consistent and Underdetermined. There are infinitely many solutions,which lie on the line or plane where the linear equations meet.
ACM Transactions on the Web, Vol. 6, No. 1, Article 4, Publication date: March 2012.

Quality and Leniency in Online Collaborative Rating Systems 4:11
Case 3. Inconsistent. There is no solution, as the linear equations do not meet.
Hence, Exact solution exists only under Case 1, which produces a unique Q. Thissolution is given in Equation (15). For the solution to be unique, (I − Y ) must beinvertible, which is true if and only if det(I − Y ) �= 0. Once Q is determined, L can bederived using Equation (12). Elements of Q and L are the exact values of quality andleniency that we are interested in. Equation (15) is
Q = (I − Y )−1X . (15)
Failing the test det(I − Y ) �= 0, Equation (14) falls under Case 2 or Case 3, forwhich an Exact solution does not exist. However, a Ranked solution may still exist forCase 2. We describe this solution which preserves the ordering among quality andleniency values in Section 4.2. In the ill-conditioned or rank-degenerate instances (e.g.,Case 3), one option is to fall back on the Naive model, which will always produce asolution. This is reasonable in that the ill-conditioned problem structure in this casedoes not allow a feasible solution. However, such cases are rare, thus, our approachesoften provide better solutions than the Naive model.
4.2. Ranked Solution
For the Ranked solution, we are only interested in the ranking by quality (and byleniency). We could derive such a ranking from Equation (16), which is modifiedfrom Equation (14) by adding a nonzero, real-valued scalar variable λ. Intuitively,Equation (16) says that any q j (in left-hand side Q) could be expressed in terms ofthe quality of other objects (in right-hand side Q), after rescaling by λ. In other words,the Q that satisfies Equation (16) would preserve the relative ratio among q j elements(and the ranking by quality),
λ Q = X + Y Q. (16)
Due to the λ variable, Ranked’s Equation (16) is fundamentally different fromExact’s Equation (14). Thus, the two solutions may not produce identical rankings.For Ranked, we are only interested that such a λ exists. The value or sign of λ is notimportant, as once λ is known, we could always rescale λ Q back to Q (normalization).Moreover, as we are solving Equation (16) as an eigenvector equation, the existence ofa Ranked solution is dependent on conditions different from the three cases mentionedin Section 4.1.
Since we are only interested in the direction of vector Q (Q or any scalingof Q is acceptable), we can reformulate Equation (16) as an eigenvector equation(Equation (17)). The n × n matrix X n is formed by replicating the n × 1 vector Xacross n columns. β is the inverse of the sum of elements of Q, that is, β = (
∑j q j)−1.
We see that Q is in fact an eigenvector of (βX n + Y ). In fact, what we want is thedominant eigenvector.
λ Q = (βX n + Y ) Q. (17)
As β and Q are mutually dependent, we could break this dependency by fixing thevalue of β in order to derive a unique dominant eigenvector Q. An intuitive choice forvalue β is the inverse of the sum of quality by the Naive model. This has the advantageof preserving the sum of quality before and after compensation, which would preventa general inflation or deflation of quality (for the quality of some objects to go up, those
ACM Transactions on the Web, Vol. 6, No. 1, Article 4, Publication date: March 2012.

4:12 H. W. Lauw et al.
of others must come down). For a fixed value of β, the eigenvector equation can bemore simply expressed as Equation (18), where Z = βX n + Y ,
λ Q = Z Q. (18)
Iterative methods [Anton and Rorres 1987] can be used to solve Equation (18) to getthe dominant eigenvector Q. The iterative form is Qk+1 = Z Qk. The only variable isQ, as λ is removed by normalizing Q after each iteration. Normalization in this casereturns Q to the state of
∑j q j = β−1, where β−1 is the sum of quality by Naive. Subject
to the assumption that Z is diagonalizable (it has linearly-independent eigenvectors)and has a uniquely largest eigenvalue [Golub and Van Loan 1996], as k increases, Qkwill converge to the dominant eigenvector of Z, almost independently of the initial Q0.
The notion of convergence to fixed points is defined by the relative ratio of quality(i.e., the ranking), instead of absolute quality. The ratios of 2:3, 4:6, 6:9, and so on, areall considered the same fixed point. The normalization or rescaling does not affect theexistence of a fixed point, and neither does it imply that there is a lack of a fixed pointin the iterations. The fixed point is reached when the ratio converges. Therefore, thefixed point, in this sense, refers to the relative ratio and is independent of scaling ab-solute values. A similar formulation and convergence have been previously attemptedin works on Web search ranking (HITS [Kleinberg 1999] and PageRank [Page et al.1998]). Once converged, the elements of Q (and the corresponding L) are used to rankobjects (and reviewers).
Ranked Solution vs. Exact Solution. In summary, we have introduced two independentsolution types derived from similar, but slightly different matrix equations. Exactsolution produces exact values of quality/leniency, which can also be used for ranking.Ranked solution produces only the rankings by quality/leniency. Although Rankedsolution is the weaker solution, since it only produces the ranking of objects, it isstill necessary because in some cases the ranking of objects by quality may still bedetermined even if no Exact solution exists. We provide one such example scenario(this is not the only such scenario, but it is chosen for expository purpose).
Consider the following scenario with three reviewers and three objects. r1 ratesobjects {o1, o2}; r2 rates {o1, o2, o3}; r3 rates {o2, o3}. All the rating scores areuniformly 0.5.
o1 o2 o3
r1
r2
r3
⎛⎜⎝
0.5 0.5 −0.5 0.5 0.5− 0.5 0.5
⎞⎟⎠
To obtain the Exact solution for the object quality, we need to solve the system ofEquations (7) and (8) for each reviewer and object, respectively (for Absolute compen-sation mode and α = 1). However, this scenario falls under Case 2 (consistent and un-derdetermined). Because of the symmetry of connectivity (the adjacency matrix wouldbe identical if we swap the objects and the reviewers), as well as the same rating av-erages for all reviewers and objects, the equations for leniency mirror the equationsfor quality. As a result, we effectively have only three equations to solve six variables{q1, q2, q3, l1, l2, l3}, resulting in an underdetermined case. The system of linear equa-tions reduce to the following three equalities: q1 = q2, q2 = q3, and q1 = q3. No exactsolution can be found.
However, the relative ranking of quality can be deduced from the above equalities,as well as from an inspection of the rating scenario. That is, all three objects should
ACM Transactions on the Web, Vol. 6, No. 1, Article 4, Publication date: March 2012.

Quality and Leniency in Online Collaborative Rating Systems 4:13
Table II. LQ Solutions
Solution TypeExact Ranked
Compensat- Relative R-Exact R-Rankedion Mode Absolute A-Exact A-Ranked
Table III. Data Size
Original After removing Keeping only thereviewers/objects first 7 ratingswith < 3 ratings per object
Reviewers 6,040 6,040 1,071
Objects 3,706 3,503 3,431Ratings 1,000,209 999,917 22,268
Ratings per object 1–3428 (median: 124) 3–3,428 (median: 140) 3–7 (median: 7)ratings per reviewer 20–2314 (median: 96) 19–2,290 (median: 96) 3–886 (median: 7)
be ranked similarly. In this case, the ranked solution exists and will produce an equalordering of the objects by quality.
5. EXPERIMENTS ON REAL-LIFE DATASETS
The objective of experiments on real-life datasets is to verify the efficacy of the pro-posed LQ model, primarily by comparing it against the Naive model (Equation (1)).First, we investigate whether and how the number of ratings that an object has affectsthe results. Next, we conduct overall comparison of ranked lists generated by differentmodels to reveal whether LQ results in a significant differentiation in rankings. Usingseveral case examples, we investigate whether extreme disagreements in quality rank-ings can be explained in favor of LQ. Finally, we conduct a preliminary investigationinto the potential application of the proposed model for the rating prediction task.
Table II shows LQ’s four possible solutions, owing to two compensation modes (Rel-ative and Absolute) and two solution types (Exact and Ranked). In these experiments,we set α = 0.5. For this α value, Exact and Ranked solutions exist for our dataset.Experiments on different α values will be covered by our experiments on syntheticdatasets (see Section 6). The four solutions (R-Exact, R-Ranked, A-Exact, and A-Ranked) are compared against one another as well as against Naive, Zscore, and Riggs.Zscore is a standard distribution-based score normalization method, while Riggs isbased on reviewers’ reputation. We have described both in Section 2.
5.1. Dataset
The dataset used in these experiments was collected from GroupLens.7 The “One Mil-lion MovieLens Dataset” contains ratings by users of the movie recommendation siteMovieLens.8 We chose this dataset as it was a large, public, and well-cited dataset. Asshown in Table III, there were 6,040 reviewers, 3,706 objects (movies) and 1,000,209scores. Each reviewer evaluated at least 20 objects. Each object may be evaluated byas few as 1 reviewer. Although this dataset better fits the notion of subjective rating,we find that we still get good results in this dataset. Morever, there is a lack of otherlarge-scale objective rating datasets.
7www.grouplens.org8www.movielens.org
ACM Transactions on the Web, Vol. 6, No. 1, Article 4, Publication date: March 2012.

4:14 H. W. Lauw et al.
The rating information was extracted and further processed as follows. We rescaledthe rating scores, originally on the scale of 1 to 5 stars, to a new range of 0.2 to 1.0by a simple division by 5. We also ensured that each object had at least three re-viewers and each reviewer had at least three objects, by iteratively removing objectswith less than three reviewers and reviewers with less than three objects, until therewere no more such objects/reviewers. This removed the occasional reviewers/objectsand lent greater support when inferring the behavior of reviewers/objects. As shownin Table III, the data size after filtering was still large, with 6,040 reviewers and 3,503objects. The reviewers and objects actively participated in the evaluation, as shown bythe high number of ratings per object (with median of 140) and ratings per reviewer(with median of 140). This filtered data will be used in Section 5.2.
5.2. Varying Rating Count
As mentioned in Section 1, we hypothesize that the proposed LQ solution will performbetter than Naive where there are relatively few ratings per object. According to thelaw of large numbers [Grimmett and Stirzaker 1982], when the number of ratings perobject is very high, the mean will be a sufficient approximation of the true quality.
To see if this hypothesis bears out in real-life data, we conduct an experiment byvarying the number of ratings per object, while measuring its impact on the similaritybetween LQ and Naive solutions. We extract a subset of the dataset for each ratingcount n, by retaining only the first n ratings (chronologically) of each object with morethan n ratings. We compare the resulting rankings of objects by quality of LQ andNaive, using the Kendall similarity measure [Dwork et al. 2001; Fagin et al. 2003].
Given two ranked lists X and Y , Kendall counts the number of pairs for which Xand Y agree on their relative ranks, as shown in Equation (19), where k is the sizeof X and Y . For an item t, its rank in X is rankX (t) and rankY (t) in Y . Kendall pe-nalizes each pair of items (t1, t2) where rankX (t1) > rankX (t2) but rankY (t1) < rankY (t2).The similarity value is in the range of [0%, 100%], with 100% indicating a completeagreement between LQ and Naive.
Kendall(X , Y ) =|{(t1, t2)|X and Y agree on order of (t1, t2)}|
12k(k − 1)
. (19)
Figure 3 shows the plot of Kendall similarity between A-Ranked and Naive’s qualityrankings for different values of n. Figure 3 shows the same for R-Ranked versus Naive.In both figures, two things are apparent. First, as n increases, LQ’s solutions areincreasingly similar to Naive. Second, there are more differences at the top ranks(e.g., Top 10%) than there are in lower ranks (e.g., Top 30% or All).
The first observation confirms the earlier hypothesis that when there are manyratings per object, the average rating (i.e., Naive) is sufficient, and LQ derives thesame outcome. Commonly, the purpose of quality ranking is to evaluate and identifythe top-ranked objects. Hence, the second observation further bolsters the value of LQsince it generates a more different outcome from Naive for the top-ranked objects. Wewill also take a deeper look at certain case examples in Section 5.4 to see if these rankdifferences imply a better ranking by LQ.
5.3. Comparison of Ranked Lists
Having studied the effects of rating counts in Section 5.2, we now focus on one rating-count setting. For this, we select the filtered dataset from the previous section in whicheach object has at most seven ratings (i.e., n = 7). The third column of Table III showsthat more than 90% of objects were still represented after this filtering step.
ACM Transactions on the Web, Vol. 6, No. 1, Article 4, Publication date: March 2012.

Quality and Leniency in Online Collaborative Rating Systems 4:15
Fig. 3. Varying rating count.
Fig. 4. Quality rank scatterplots: Naive vs. Ranked.
Here we conduct an overall comparison of the quality ranked lists generated by dif-ferent solutions to gain a sense of how different LQ solutions are, from one another, aswell as from Naive. For each solution, objects (or reviewers) were ranked in descend-ing order of quality (or leniency). The highest value was given rank 1. Same valuesshared the same rank. For example, if the next three highest values were the same,they would share rank 2. Since there are 3,431 objects in the dataset, rank values goesfrom 1 to 3,431.
For ease of analysis and comparison, we further normalize the rank values intopercentrank, which go from 1 to 100. Quality percentrank of an object reviewer o j isderived from its rank as follows; percentrank(o j) = �rank(o j) × 100 ÷ n�, where n is thetotal number of objects. For instance, a percentrank of 1 means an object’s rank placesit in the top 1% in terms of quality. Leniency percentrank of a reviewer is derived in asimilar manner.
Naive vs. Ranked. First, we compare the ranked lists produced by A-Ranked and R-Ranked to that by Naive. Figure 4(a) shows a scatterplot of quality percentranks
ACM Transactions on the Web, Vol. 6, No. 1, Article 4, Publication date: March 2012.

4:16 H. W. Lauw et al.
Fig. 5. Quality rank scatterplots: Exact vs. Ranked.
for A-Ranked vs. Naive. Each point represents an object. Values on the x- and y-axes represent quality percentranks computed by A-Ranked and Naive, respectively.Figure 4 is the corresponding scatterplot for R-Ranked vs. Naive.
As shown in Figure 4(a) and (b), there are significant variances around the diagonal,revealing that both A-Ranked and R-Ranked rank objects differently from Naive. Inparticular, there are 139 objects sharing percentrank 9 by Naive. The same objects aregiven percentranks ranging from 4 to 26 by A-Ranked (Figure 4(a)) and from 3 to 37by R-Ranked (Figure 4). Thus, the LQ solutions are more successful at differentiatingeven very competitive objects. This is useful in such situations as selecting the verybest papers at conferences or proposals for funding.
Exact vs. Ranked. Figure 5(a) and (b) are the scatterplots for A-Ranked vs. A-Exactand R-Exact vs. R-Ranked, respectively. The points line up along the diagonal, imply-ing that for this experiment, the Exact and Ranked solutions are practically identical.As leniency is mutually dependent on quality, the scatterplots for leniency are simi-lar to Figures 5(a) and (b). Due to the Exact/Ranked similarity, we use only Rankedsolutions to represent LQ, moving forward.
5.4. Case Examples
Here we showcase how the LQ model is more intuitively correct, by providing twoexamples of objects upon which LQ solutions disagree with Naive on their quality per-centranks and showing how the disagreement can be explained in favor of LQ. Theseare followed by two examples of reviewers with very different leniency percentranks,showing how the difference comes about due to their rating behaviors.
Object Examples. Table IV describes the profile of object-1880, showing its quality val-ues (and percentranks) computed by different solutions, its rating scores, and the le-niency values (and percentranks) of its reviewers. Results for A-Exact and R-Exact arenot shown, as they were practically identical to A-Ranked and R-Ranked, respectively.For object-1880, the quality percentranks assigned by A-Ranked (23) and R-Ranked(33) are much lower than those assigned by Naive (8), because object-1880’s reviewersare generally lenient (with li > 0). A-Ranked and R-Ranked recognize and compensatefor their tendency to inflate the rating scores, resulting in a lower-quality percentrankfor object-1880.
ACM Transactions on the Web, Vol. 6, No. 1, Article 4, Publication date: March 2012.

Quality and Leniency in Online Collaborative Rating Systems 4:17
Table IV. Profiles of Object object-1880
Object Quality (Rank)Naive A-Ranked R-Ranked
object-1880 0.85 (8) 0.77 (23) 0.72 (33)
Reviewers eij Leniency (Rank)A-Ranked R-Ranked
user-3067 1.0 0.20 (7) 0.23 (8)user-4682 0.8 0.21 (6) 0.25 (7)user-4277 0.8 0.16 (14) 0.19 (13)user-4937 0.8 0.10 (26) 0.12 (23)
Table V. Profiles of Object object-1236
Object Quality (Rank)Naive A-Ranked R-Ranked
object-1236 0.83 (9) 0.87 (6) 0.92 (3)
Reviewers eij Leniency (Rank)A-Ranked R-Ranked
user-5987 1.0 −0.08 (81) −0.42 (85)user-5530 1.0 −0.07 (80) −0.31 (79)user-5693 0.8 −0.16 (93) −0.56 (90)user-5754 0.8 −0.08 (81) −0.36 (82)user-6036 0.8 −0.05 (75) −0.17 (67)user-5755 0.8 −0.01 (62) −0.11 (60)user-5493 0.6 −0.13 (90) −0.42 (85)
The second object example object-1236, whose profile is shown in Table V, receiveshigher quality percentranks from A-Ranked (6) and R-Ranked (3) than from Naive (9),object-1236’s reviewers are mostly strict (with li < 0). These reviewers’ tendency todeflate their rating scores is taken into account by A-Ranked and R-Ranked, whichthen lift their quality percentranks correspondingly.
Reviewer Examples. A reviewer’s leniency is determined by her rating behavior—whether she consistently rates higher or lower than the derived quality. Table VIshows the profile of user-4556, a strict reviewer (li = −0.24 by A-Ranked, li = −0.94 byR-Ranked) with very low leniency ranks (98 by A-Ranked, 97 by R-Ranked. Note thatthe leniency values are in absolute and relative terms for A-Ranked and R-Ranked,respectively. Comparing user-4556’s rating score eij and the quality q j of each ratedobject, we observe that the rating scores are consistently lower across the five objects(0.6 < 0.67, 0.4 < 0.64, 0.4 < 0.59, 0.2 < 0.67, 0.2 < 0.43 for eij vs. q j by A-Ranked).
Table VII shows the profile of a lenient reviewer user-2635, with positive leniencyvalues and very high leniency percentranks (0.57 and 1 by A-Ranked, 0.58 and 1 byR-Ranked). User-2635’s rating scores on her four rated objects are consistently higherthan the respective quality values (1.0 > 0.50, 1.0 > 0.42, 1.0 > 0.41, 1.0 > 0.41 for eijvs. q j by A-Ranked).
ACM Transactions on the Web, Vol. 6, No. 1, Article 4, Publication date: March 2012.

4:18 H. W. Lauw et al.
Table VI. Profile of Reviewer user-4556
Reviewer Leniency (Rank)A-Ranked R-Ranked
user-4556 −0.24 (98) −0.94 (97)
Objects eij Quality (Rank)A-Ranked R-Ranked
object-3794 0.6 0.67 (46) 0.68 (43)object-3718 0.4 0.64 (55) 0.66 (49)object-3652 0.4 0.59 (67) 0.58 (69)object-3747 0.2 0.67 (46) 0.66 (48)object-2452 0.2 0.43 (92) 0.43 (92)
Table VII. Profile of Reviewer user-2635
Reviewer Leniency (Rank)A-Ranked R-Ranked
user-2635 0.57 (1) 0.58 (1)
Objects eij Quality (Rank)A-Ranked R-Ranked
object-3939 1.0 0.50 (83) 0.49 (85)object-3942 1.0 0.42 (92) 0.40 (93)object-3940 1.0 0.41 (93) 0.39 (94)object-3941 1.0 0.41 (93) 0.38 (95)
5.5. Rating Prediction
The previous sections seek to evaluate the comparative solutions through in-depthanalyses of the different outcomes. Another means of evaluation is whether the out-come could help improve the utility of an application. The objective of this experimentis to compare different score-summarization methods in terms of improving the taskof rating prediction. For this experiment, we compare the LQ solutions against Naive(Equation (1)), Riggs (Equations (2) and (3)), and Zscore. The last solution involvesfirst normalizing eij scores into z-scores, according to Equation (4), before derivingq j = Avgi zij in a similar way to Naive.
We employ a simple means of rating prediction as follows. At any one time, weremove one rating score eij from the dataset and attempt to produce a prediction e′
ijfor this score, based on the remaining data. For each solution, the predicted score isthe value that would best fit the q j or li values computed from the remaining data.Specifically, for A-Ranked, we have e′
ij = q j + α · li based on Equation (8). For R-Ranked,we have e′
ij = q j ÷ (1 − α · li) based on Equation (6). For Naive, the predicted score e′ij
is the q j value computed by Equation (1). For Riggs, while Equation (3) suggests thatthere could be two predicted values (i.e., e′
ij = q j ± (1 − wi)), we take the average ofthe two, resulting in the predicted score e′
ij = q j. For Zscore, the predicted score is thedenormalized rating score, that is, e′
ij = q j × σi + μi, based on Equation (4).This rating-prediction exercise is repeated over a sample of 1,000 “missing” scores
randomly selected from the dataset. To measure the performance, we take the meanabsolute error (MAE), or the average of the absolute difference between the predicted
ACM Transactions on the Web, Vol. 6, No. 1, Article 4, Publication date: March 2012.

Quality and Leniency in Online Collaborative Rating Systems 4:19
Table VIII. MAE Comparison
Solution First3 First5 First7
A-Ranked 0.181 0.174 0.163R-Ranked 0.181 0.176 0.165Naive 0.187 0.186 0.175Riggs 0.186 0.185 0.175Zscore 0.187 0.181 0.167
and the true scores. Equation (20) shows how MAE is computed, where k denotes aparticular missing score sample, such that
MA E =
∑1000k=1 |e′k
ij − ekij|
1000. (20)
We ran the rating-prediction experiments on three subsets of the data. In additionto the subset used in the previous sections, in which we keep only the first sevenratings per object (First7), we also created two other subsets in which we retain onlythe first 3 (First3) and 5 (First5) ratings per object, respectively.
The MAE values obtained by the different comparative solutions are shown inTable VIII. Note that a lower MAE value indicates better performance. In general,the fewer the number of ratings per object, the higher the MAE values. In addition,A-Ranked and R-Ranked have the best performance with the lowest MAE errors,followed by Zscore, and then Naive and Riggs. This result speaks in favor of ourproposed LQ solutions. It shows that LQ is better at modeling the rating behaviorsof reviewers. It also shows that LQ’s outcome is more consistent than the othercomparative solutions.
Table VIII also implies that the proposed methods are able to provide a meaningfulanswer with less data. It shows that A-Ranked and R-Ranked’s errors, when consid-ering only the first 3 ratings (First3) are similar to Naive’s, when considering first5 ratings (First5). Similarly, A-Ranked and R-Ranked’s First5 errors are similar toNaive’s First7 errors.
6. EXPERIMENTS ON SYNTHETIC DATASET
Most real-life datasets do not have ground-truth information on quality or leniency.Our experiments with synthetically generated datasets address the need to verify LQ’seffectiveness against a known ground truth and to study the effects of various param-eters on LQ’s ability to reconstruct the ground truth.
6.1. Dataset Generation
Synthetic data generation is a rather complex process, as the propagation effect withina network (such as a rating network) and the interaction between data-generationparameters cannot be very precisely controlled. Hence, we choose to keep the data-generation scheme simple, with a few well-chosen parameters that would still allowus to draw meaningful insights.
The synthetic data simulates the scenario in which there are three classes of re-viewers: strict (li < 0), neutral (li = 0), and lenient (li > 0) associated with differentrating behaviors. The quality of objects follows a uniform distribution in the range of[0.2, 1.0]. There are four parameters (k, m, and n), and α, as described in Table IX.
The data-generation scheme involves the following steps.
(1) Assign quality values. We assign to each object a quality q j, which is a randomvalue in the range of [0.2, 1.0].
ACM Transactions on the Web, Vol. 6, No. 1, Article 4, Publication date: March 2012.

4:20 H. W. Lauw et al.
Table IX. Data Generation Parameters
Parameter Description Default Value
k percentage of non-neutral reviewers 60%m percentage of lenient among non-neutral reviewers 50%
n number of reviewers assigned to each object 10α compensation factor 0.7
(2) Assign leniency values. Select k% of reviewers, label m% of them as lenient (li > 0),and label the other (100 − m)% as strict (li < 0). Label the remaining (100 − k)% ofreviewers as neutral (li = 0).
(3) Assign reviewers to objects. Randomly assign n reviewers to every object. On aver-age, there would be n objects per reviewer, but the actual number may vary amongreviewers.
(4) Generate rating scores. The rating score eij is generated as follows. If the revieweris lenient (or strict), we assign a random value higher (or lower) than q j to eij,while still in the range of [0.2, 1.0]. Otherwise, eij = q j. Note that there is nopresupposition of the value of α.
Metric. Given the generated rating scores (without the predetermined leniency andquality values), each comparative solution computes the quality values and attemptsto reconstruct the predetermined quality ranking. To measure the solution’s perfor-mance, as a metric, we measure the Kendall similarity between the solution’s rankedlist with the predetermined “true” ranked list. A similarity value of 100% indicates acomplete agreement with the ground truth (best performance).
In each of the subsequent experiments, we vary one parameter (n, k, m, α), and keepthe others fixed at the default values shown in Table IX. For each parameter setting,we average the Kendall similarity values over 25 independently generated syntheticdatasets. Each dataset has 1,000 reviewers and 1,000 objects. We have conductedseparate experiments with larger number of reviewers/objects with similar results.We only use datasets where each object has at least three reviewers and each reviewerhas at least three objects.
6.2. Varying Number of Reviewers per Object n
Here we study how the number of reviewers assigned to each object n affects theKendall similarity values.
Kendall Similarity. Figure 6(a) plots the Kendall similarity for quality at different val-ues of n. It shows that performance generally increases with n, and that A-Rankedand R-Ranked generally outperform Zscore, Riggs, and Naive. These observations canbe explained as follows.
The random assignment of reviewers to objects means that objects may have differ-ent compositions of reviewers, in terms of leniency.
— For small n, there is a higher probability for an object to be assigned mainly lenient(or strict) reviewers, which would highly distort its rating scores. However, LQsolutions take the leniency of each reviewer into account, better compensating forthe distortion, resulting in higher Kendall similarity. Zscore especially suffers atvery low values of n, as Zscore’s normalization may be incorrect for objects havingall or mostly lenient (or strict) reviewers.
— As n increases, statistically the assignment gets more even and more objects willshare a similar composition of reviewers, which is the underlying distribution ofreviewers in terms of leniency. As a result, the variance due to reviewers’ leniency
ACM Transactions on the Web, Vol. 6, No. 1, Article 4, Publication date: March 2012.

Quality and Leniency in Online Collaborative Rating Systems 4:21
Fig. 6. Vary n: Kendall similarity.
will become less important, as most objects are affected similarly. It becomes easierto separate the two classes of objects, and all solutions move toward higher Kendallsimilarity.
Figure 6 plots Kendall similarity for leniency for A-Ranked and R-Ranked, whichshows the same trend of increasing similarity with n. In general, this is expected,as leniency and quality are mutually dependent. Better leniency performance leadsto better quality performance (and vice versa). Hence, in most cases and as in thesubsequent experiments, showing only the Kendall similarity for quality is sufficient.
Distribution of Leniency Classes among an Object’s Reviewers. To show that as n increases,more objects will get a similar composition of reviewers, we look at how the distributionof leniency classes among an object’s reviewers changes with n.
Each object o j has a distribution vector d j = [d−, d0, and d+], where d j.d−, d j.d0, d j.d+are the percentages of o j’s reviewers who are strict, neutral, and lenient (according toground truth), respectively. Based on the input parameters in Table IX, the expecteddistribution vector is dJ = [30%, 40%, 30%]. However, due to the random assignmentof reviewers to objects, d j may deviate from dJ. The distribution error of an object o jis defined as the Euclidean distance from the actual distribution d j to the expecteddistribution dJ, (as shown in Equation (21)).
dist(d j, dJ) =√
(d j.d− − dJ.d−)2 + (d j.d0 − dJ.d0)2 + (d j.d+ − dJ.d+)2. (21)
Figure 7 plots the median and the standard deviation of the distribution errors(dist(d j, dJ) values) across all o j’s. As n increases, both median and standard deviationdecrease. All objects uniformly approach the expected distribution dJ.
6.3. Varying Proportion of Nonneutral Classes k
Here we study how the proportion of nonneutral reviewers k affects the Kendall simi-larity for quality. We expect that with more lenient or strict reviewers in the system,there will be greater distortion in rating scores, which results in more difficulties inseparating the two classes of objects.
Figure 8(a) plots Kendall similarity for quality for different values of k. It showsthat similarity decreases with k, and that A-Ranked and R-Ranked again generally
ACM Transactions on the Web, Vol. 6, No. 1, Article 4, Publication date: March 2012.

4:22 H. W. Lauw et al.
Fig. 7. Vary n: Leniency-class distribution error.
Fig. 8. Vary k: Kendall similarity for quality.
outperform Zscore, Riggs, and Naive. For R-Ranked, Figure 8(b) shows quality simi-larity curves at different values of n. The same trend of decreasing similarity appliesto other values of n, only with even lower similarity values for lower n.
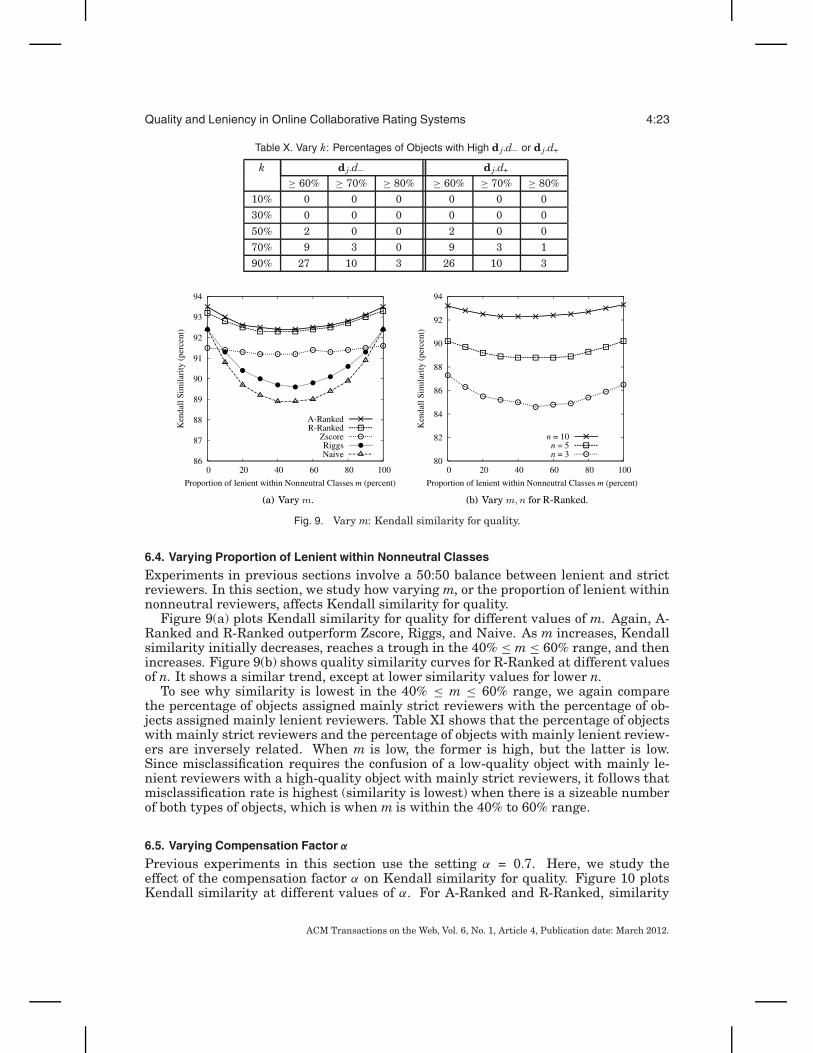
The reason for decreasing similarity with increasing k is the greater likelihoodfor an object to get an imbalanced distribution of reviewers. Table X shows, forvarying k, the percentage of objects assigned mainly strict reviewers (d j.d− ≥60%, 70%, or 80%) and the percentage of objects assigned mainly lenient review-ers (d j.d+ ≥ 60%, 70%, or 80%). It shows that the percentages of both types of ob-jects are higher when k is higher. At k = 10%, there is no object with d j.d− ≥ 60%or d j.d+ ≥ 60%. At k = 90%, 27% of objects have d j.d− ≥ 60% and 26% of objectshave d j.d+ ≥ 60%. Since a ranking mistake occurs when a lower-quality object withmainly lenient reviewers is confused with a higher-quality object with mainly strictreviewers, it follows that as the number of objects with imbalanced distribution of re-viewers rises, the rate of making ranking mistakes also increases (Kendall similaritydecreases).
ACM Transactions on the Web, Vol. 6, No. 1, Article 4, Publication date: March 2012.
Quality and Leniency in Online Collaborative Rating Systems 4:23
Table X. Vary k: Percentages of Objects with High d j.d− or d j.d+
k d j.d− d j.d+
≥ 60% ≥ 70% ≥ 80% ≥ 60% ≥ 70% ≥ 80%10% 0 0 0 0 0 030% 0 0 0 0 0 0
50% 2 0 0 2 0 070% 9 3 0 9 3 1
90% 27 10 3 26 10 3
Fig. 9. Vary m: Kendall similarity for quality.
6.4. Varying Proportion of Lenient within Nonneutral Classes
Experiments in previous sections involve a 50:50 balance between lenient and strictreviewers. In this section, we study how varying m, or the proportion of lenient withinnonneutral reviewers, affects Kendall similarity for quality.
Figure 9(a) plots Kendall similarity for quality for different values of m. Again, A-Ranked and R-Ranked outperform Zscore, Riggs, and Naive. As m increases, Kendallsimilarity initially decreases, reaches a trough in the 40% ≤ m ≤ 60% range, and thenincreases. Figure 9(b) shows quality similarity curves for R-Ranked at different valuesof n. It shows a similar trend, except at lower similarity values for lower n.
To see why similarity is lowest in the 40% ≤ m ≤ 60% range, we again comparethe percentage of objects assigned mainly strict reviewers with the percentage of ob-jects assigned mainly lenient reviewers. Table XI shows that the percentage of objectswith mainly strict reviewers and the percentage of objects with mainly lenient review-ers are inversely related. When m is low, the former is high, but the latter is low.Since misclassification requires the confusion of a low-quality object with mainly le-nient reviewers with a high-quality object with mainly strict reviewers, it follows thatmisclassification rate is highest (similarity is lowest) when there is a sizeable numberof both types of objects, which is when m is within the 40% to 60% range.
6.5. Varying Compensation Factor α
Previous experiments in this section use the setting α = 0.7. Here, we study theeffect of the compensation factor α on Kendall similarity for quality. Figure 10 plotsKendall similarity at different values of α. For A-Ranked and R-Ranked, similarity
ACM Transactions on the Web, Vol. 6, No. 1, Article 4, Publication date: March 2012.

4:24 H. W. Lauw et al.
Table XI. Vary m: Percentages of Objects with High d j.d− or d j.d+
m d j.d− d j.d+
≥ 60% ≥ 70% ≥ 80% ≥ 60% ≥ 70% ≥ 80%10% 48 25 9 0 0 030% 20 7 2 0 0 0
50% 4 1 0 5 1 070% 0 0 0 21 7 2
90% 0 0 0 48 24 9
Fig. 10. Vary α.
increases as α approaches 1. For α ≥ 0.4, A-Ranked and R-Ranked outperform allother comparative solutions.
In summary, our experiments on synthetic datasets show that the proposed LQmodel is more effective at reconstructing the ground truth and consistently outper-forms the comparative Zscore, Riggs, and Naive models. LQ is especially effectivewhen each object is assigned a small number of reviewers. One factor that contributesto its efficacy is its robustness in handling objects assigned predominantly lenient (orstrict) reviewers.
7. CONCLUSION
In this article, we address the score-summarization problem of how to aggregate therating scores given to an object to arrive at an overall score that reflects the object’squality. Our approach is premised on mining the leniency behavior of reviewers fromthe rating scores and using the leniency information to adjust the quality scores cor-respondingly. We propose the Leniency-aware Quality (LQ) model, which determinesleniency and quality simultaneously.
We further show that the LQ model is better than Naive which relies on simple av-eraging; Riggs, which weighs reviewer’s scores by reputation; and Zscore, which seeksto normalize the reviewers’ rating scales. Experiments on real-life datasets showsthat LQ results are different from the comparative methods and have less error inthe rating-prediction task than the comparative methods. Experiments on syntheticdatasets show that LQ consistently achieves a higher performance than the compara-tive methods.
ACM Transactions on the Web, Vol. 6, No. 1, Article 4, Publication date: March 2012.

Quality and Leniency in Online Collaborative Rating Systems 4:25
Several avenues exist for future work. The effectiveness of the LQ model can befurther verified by integrating it into various social media applications and allowingusers to evaluate the new quality ranking. The problem addressed here also touchesupon aspects beyond computer science. It would also be interesting to verify which ofthe two proposed compensation modes (Relative and Absolute) is more consistent withthe psychology of reviewers, as studied in behavioral sciences.
REFERENCESADOMAVICIUS, G. AND TUZHILIN, A. 2005. Toward the next generation of recommender systems: A survey
of the state-of-the-art and possible extensions. IEEE Transactions on Knowledge and Data Engineer-ing 17, 6, 734–749.
ANTON, H. AND RORRES, C. 1987. Elementary Linear Algebra with Applications. John Wiley & Sons, Hobo-ken, NJ.
ARAMPATZIS, A. AND KAMPS, J. 2009. A signal-to-noise approach to score normalization. In Proceeding ofthe 18th ACM Conference on Information and Knowledge Management. ACM, New York, NY, 797–806.
ARKES, H. R. 2003. The nonuse of psychological research at two federal agencies. Psychol. Science 14, 1,1–6.
BACKSTROM, L., DWORK, C., AND KLEINBERG, J. 2007. Wherefore art thou r3579x?: Anonymized so-cial networks, hidden patterns, and structural steganography. In Proceedings of the 16th InternationalWorld Wide Web Conference. ACM, New York, 181–190.
BAZERMAN, M. H. 1990. Judgment in Managerial Decision-Making 2nd Ed. Wiley, Hoboken, NJ.BELL, R. M. AND KOREN, Y. 2007. Scalable collaborative filtering with jointly derived neighborhood inter-
polation weights. In Proceedings of the 7th IEEE International Conference on Data Mining. 43–52.BHATTACHARJEE, R. AND GOEL, A. 2005. Avoiding ballot stuffing in Ebay-like reputation systems. In
Proceeding of the ACM SIGCOMM Workshop on Economics of Peer-to-Peer Systems. ACM, New York,133–137.
BLACKBURN, J. L. AND HAKEL, M. D. 2006. An examination of sources of peer-review bias. Psychol. Sci-ence 17, 5, 378–382.
BORGATTI, S. P. AND EVERETT, M. G. 1997. Network analysis of 2-mode data. Social Netw. 19, 3, 243–269.BORODIN, A., ROBERTS, G. O., ROSENTHAL, J. S., AND TSAPARAS, P. 2005. Link analysis ranking: Algo-
rithms, theory, and experiments. ACM Trans. Internet Technol. 5, 1, 231–297.BUSENITZ, L. AND LAU, C. 1996. A cross-cultural cognitive model of new venture creation. Entrepreneur-
ship: Theory Pract. 20, 4, 25–39.CHEN, M. AND SINGH, J. P. 2001. Computing and using reputations for internet ratings. In Proceedings of
the 3rd ACM Conference on Electronic Commerce. ACM, New York, 154–162.DELLAROCAS, C. 2000. Immunizing online reputation reporting systems against unfair ratings and discrim-
inatory behavior. In Proceedings of the 2nd ACM Conference on Electronic Commerce. ACM, New York,150–157.
DUMAIS, S. AND NIELSEN, J. 1992. Automating the assignment of submitted manuscripts to reviewers. InProceedings of the 15th International ACM SIGIR Conference on Research and Development in Informa-tion Retrieval. ACM, New York, 233–244.
DWORK, C., KUMAR, R., NAOR, M., AND SIVAKUMAR, D. 2001. Rank aggregation methods for the Web. InProceedings of the 10th International World Wide Web Conference. 613–622.
FAGIN, R., KUMAR, R., AND SIVAKUMAR, D. 2003. Comparing top k lists. SIAM J. Discrete Math. 17, 1,134–160.
FAUST, K. 1997. Centrality in affiliation networks. Social Netw. 19, 2, 157–191.FERNANDEZ, M., VALLET, D., AND CASTELLS, P. 2006. Probabilistic score normalization for rank aggrega-
tion. In Proceedings of the European Conference on Information Retrieval. 553–556.FIGUEIRA, J., GRECO, S., AND EHRGOTT, M., Eds. 2005. Multiple Criteria Decision Analysis: State of the
Art Surveys. Springer Science and Business Media, Inc.GELLER, J. AND SCHERL, R. 1997. Challenge: Technology for automated reviewer selection. In Proceedings
of the International Joint Conferences on Artificial Intelligence. 55–61.GOLBECK, J. AND HENDLER, J. 2006. Inferring binary trust relationships in Web-based social networks.
ACM Trans. Internet Technol. 6, 4, 497–529.GOLUB, G. H. AND VAN LOAN, C. F. 1996. Matrix Computations 3rd Ed. Johns Hopkins University Press.
ACM Transactions on the Web, Vol. 6, No. 1, Article 4, Publication date: March 2012.

4:26 H. W. Lauw et al.
GRIMMETT, G. R. AND STIRZAKER, D. R. 1982. Probability and Random Processes. Oxford University Press,Oxford, UK.
GUHA, R., KUMAR, R., RAGHAVAN, P., AND TOMKINS, A. 2004. Propagation of trust and distrust. In Pro-ceedings of the International World Wide Web Conference. ACM, New York.
HAVELIWALA, T. H. 2003. Topic-sensitive PageRank: A context-sensitive ranking algorithm for Web search.IEEE Trans. Knowl. Data Engin. 15, 4, 784–796.
HERLOCKER, J. L., KONSTAN, J. A., AND RIEDL, J. 2000. Explaining collaborative filtering recommenda-tions. In Proceedings of the ACM Conference on Computer Supported Cooperative Work. ACM, New York,NY, 241–250.
HERLOCKER, J., KONSTAN, J. A., AND RIEDL, J. 2002. An empirical analysis of design choices inneighborhood-based collaborative filtering algorithms. Information Retrieval 5, 287–310.
HETTICH, S. AND PAZZANI, M. J. 2006. Mining for proposal reviewers: Lessons learned at the nationalscience foundation. In Proceedings of the 12th ACM SIGKDD International Conference on KnowledgeDiscovery and Data Mining. ACM, New York, 862–871.
JIN, R. AND SI, L. 2004. A study of methods for normalizing user ratings in collaborative filtering. InProceedings of the 27th ACM SIGIR Conference on Research and Development in Information Retrieval.568–569.
JIN, R., SI, L., ZHAI, C.-X., AND CALLAN, J. 2003. Collaborative filtering with decoupled models for prefer-ences and ratings. In Proceedings of the International Conference on Information and Knowledge Man-agement. ACM, New York, NY, 309–316.
JINDAL, N. AND LIU, B. 2007. Analyzing and detecting review spam. In Proceedings of the IEEE Interna-tional Conference on Data Mining. IEEE Computer Society, Los, Alamitos, CA.
KLEINBERG, J. M. 1999. Authoritative sources in a hyperlinked environment. J. ACM 46, 5, 604–632.KORHONEN, P., MOSKOWITZ, H., AND WALLENIUS, J. 1992. Multiple criteria decision support—a review.
Euro. J. Operational Res. 63, 3, 361–375.LAM, S. K. AND RIEDL, J. 2004. Shilling recommender systems for fun and profit. In Proceedings of the 13th
International World Wide Web Conference. ACM, New York, 393–402.LAUW, H. W., LIM, E.-P., AND WANG, K. 2007. Summarizing review scores of “unequal” reviewers. In
Proceedings of the 2007 SIAM International Conference on Data Mining.LEMIRE, D. 2005. Scale and translation invariant collaborative filtering systems. Info. Retrieval 8, 1,
129–150.MA, H., YANG, H., LYU, M., AND KING, I. 2008. Sorec: social recommendation using probabilistic matrix
factorization. In CIKM. ACM, New York, NY, 931–940.MA, H., KING, I., AND LYU, M. R. 2009. Learning to recommend with social trust ensemble. In SIGIR.
ACM, New York, NY, 203–210.MANMATHA, R. AND SEVER, H. 2002. A formal approach to score normalization for meta-search. In Proceed-
ings of the 2nd International Conference on Human Language Technology Research. Morgan KaufmannPublishers Inc., San Francisco, CA, 98–103.
MASSA, P. AND AVESANI, P. 2005. Controversial users demand local trust metrics: An experimental studyon epinions.com community. In AAAI. AAAI Press, 121–126.
MOBASHER, B., BURKE, R., AND SANDVIG, J. 2006. Model-based collaborative filtering as a defense againstprofile injection attacks. In Proceedings of the National Conference on Artificial Intelligence.
PAGE, L., BRIN, S., MOTWANI, R., AND WINOGRAD, T. 1998. The PageRank citation ranking: Bringingorder to the Web. Stanford Digital Library Technologies Project.
RESNICK, P., IACOVOU, N., SUCHAK, M., BERGSTROM, P., AND RIEDL, J. 1994. Grouplens: An open ar-chitecture for collaborative filtering of netnews. In Proceedings of the ACM Conference on ComputerSupported Cooperative Work. 175–186.
RIGGS, T. AND WILENSKY, R. 2001. An algorithm for automated rating of reviewers. In Proceedings of the1st ACM/IEEE-CS Joint Conference on Digital Libraries. ACM, New York, 381–387.
SARWAR, B. M., KARYPIS, G., KONSTAN, J. A., AND RIEDL, J. 2000. Application of dimensionality reductionin recommender system – a case study. In Proceedings of the ACM WebKDD Web Mining for E-CommerceWorkshop.
SHEN, J., LIN, Y., XUE, G.-R., ZHU, F.-D., AND YAO, A.-G. 2006. IRFCF: Iterative rating filling collabora-tive filtering algorithm. In Proceedings of the 8th Asia-Pacific Web Conference. 862–867.
SIMON, M., HOUGHTON, S. M., AND AQUINO, K. 1999. Cognitive biases, risk perception, and venture for-mation: How individuals decide to start companies. J. Bus. Venturing 15, 113–134.
ACM Transactions on the Web, Vol. 6, No. 1, Article 4, Publication date: March 2012.

Quality and Leniency in Online Collaborative Rating Systems 4:27
TANTIPATHANANANDH, C., BERGER-WOLF, T., AND KEMPE, D. 2007. A framework for community identi-fication in dynamic social networks. In Proceedings of the 13th ACM SIGKDD International Conferenceon Knowledge Discovery and Data Mining. ACM, New York, 717–726.
TRAUPMAN, J. AND WILENSKY, R. 2004a. Collaborative quality filtering: Establishing consensus or recov-ering ground truth? In Proceedings of the KDD Workshop on Web Mining and Web Usage Analysis, inconjunction with the 10th ACM SIGKDD International Conference on Knowledge Discovery and DataMining.
TRAUPMAN, J. AND WILENSKY, R. 2004b. Collaborative quality filtering: Establishing consensus or recov-ering ground truth? In Proceedings of the KDD Workshop on Web Mining and Web Usage Analysis, inconjunction with the 10th ACM SIGKDD International Conference on Knowledge Discovery and DataMining. 73–86.
WALPOLE, R. E., MYERS, R. H., MYERS, S. L., AND YE, K. 2002. Probability & Statistics for Engineers &Scientists 7th Ed. Prentice Hall, NJ.
WASSERMAN, S. AND FAUST, K. 1994. Social Network Analysis: Methods and Applications. Cambridge Uni-versity Press, Cambridge, UK.
YANG, B., CHEUNG, W., AND LIU, J. 2007. Community mining from signed social networks. IEEE Trans.Knowl. Data Engin. 19, 10, 1333–1348.
ZHANG, J. AND COHEN, R. 2006. Trusting advice from other buyers in e-marketplaces: The problem ofunfair ratings. In Proceedings of the 8th International Conference on Electronic Commerce: The newe-Commerce: Innovations for Conquering Current Barriers, Obstacles and Limitations to ConductingSuccessful Business on the Internet. ACM, New York, 225–234.
ZHOU, D., MANAVOGLU, E., LI, J., GILES, C. L., AND ZHA, H. 2006. Probabilistic models for discoveringe-communities. In Proceedings of the 15th International World Wide Web Conference. ACM, New York,173–182.
Received March 2009; revised July 2009, July 2010, March 2011; accepted October 2011
ACM Transactions on the Web, Vol. 6, No. 1, Article 4, Publication date: March 2012.