Embed Size (px)
Citation preview

Qualitative Data Analysis
Judith Lane
Qualitative methods
Interviews Questionnaires Focus groups Observation
The nature of qualitative data
Possibly smaller sample sizes –
BUT probably larger amounts of data – one short interview can amount to 20-40 sides of printed text!!
Verbatim notes or audiotapes/ videos are transcribed to provide a record
Each hour of material can take 6-7 hours to transcribe
Qualitative Data analysis
Process of sorting, categorising and evaluating data
It is messy, ambiguous, time consuming, creative and fascinating.
Not linear Qualitative data analysis is a search for
general statements about relationships among categories of data
Timing of analysis Data analysis simultaneous with data
collection This means you can analyse deficiencies of
your or the researcher’s interview technique (e.g. to be more probing), leading to the refinement of questions, or inclusion of new or different questions in subsequent interviews
These may have ethical implications – so informed consent should be an ongoing process.
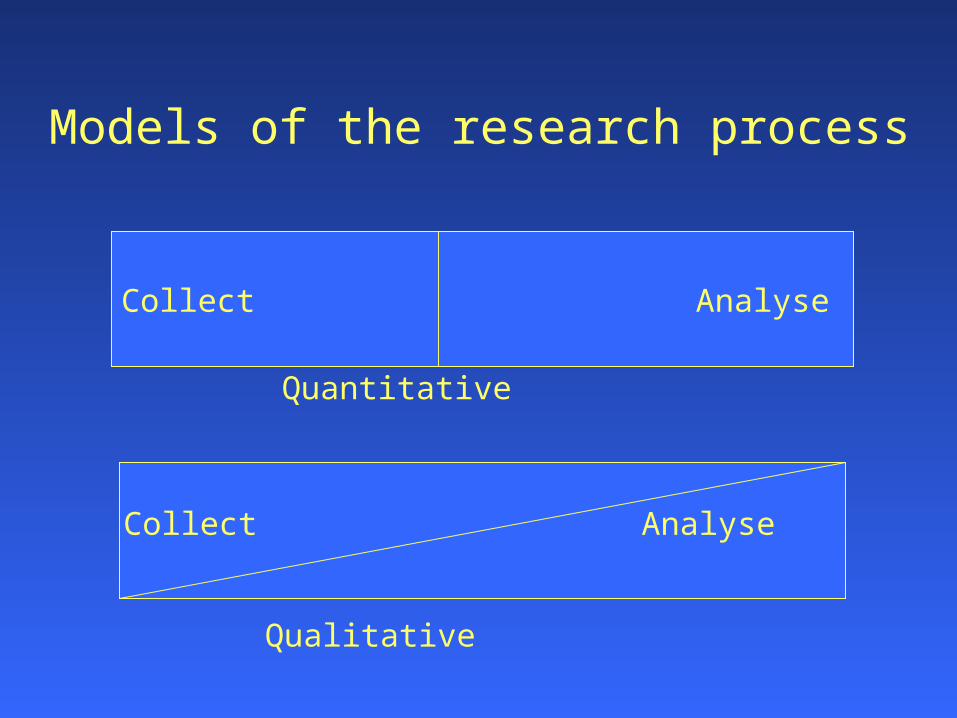
Collect Analyse
Collect Analyse
Quantitative
Qualitative
Models of the research process
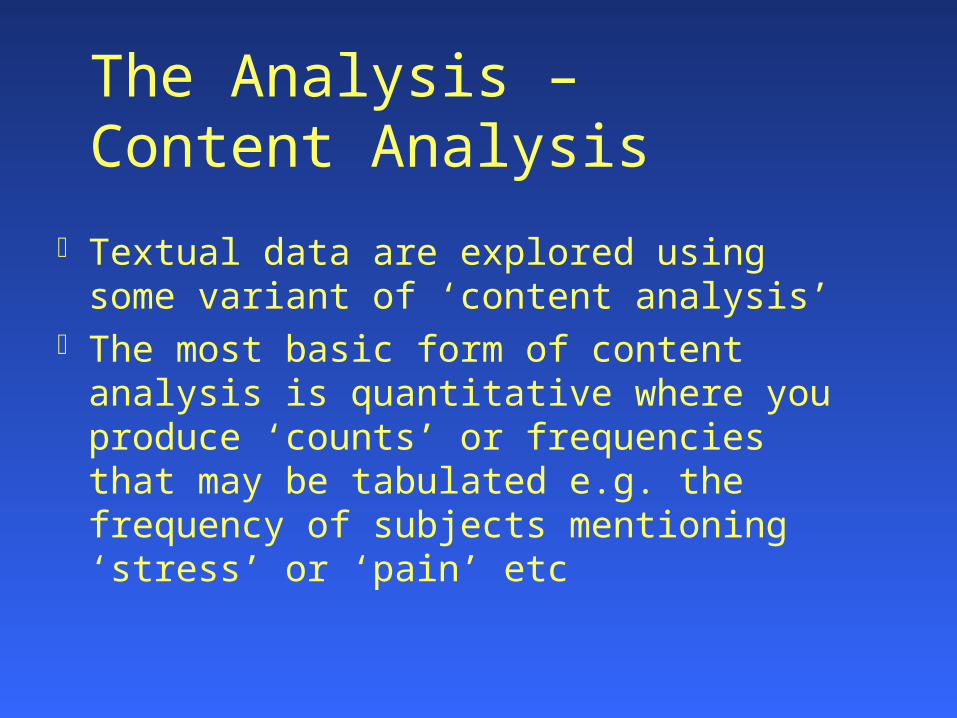
The Analysis – Content Analysis
Textual data are explored using some variant of ‘content analysis’
The most basic form of content analysis is quantitative where you produce ‘counts’ or frequencies that may be tabulated e.g. the frequency of subjects mentioning ‘stress’ or ‘pain’ etc
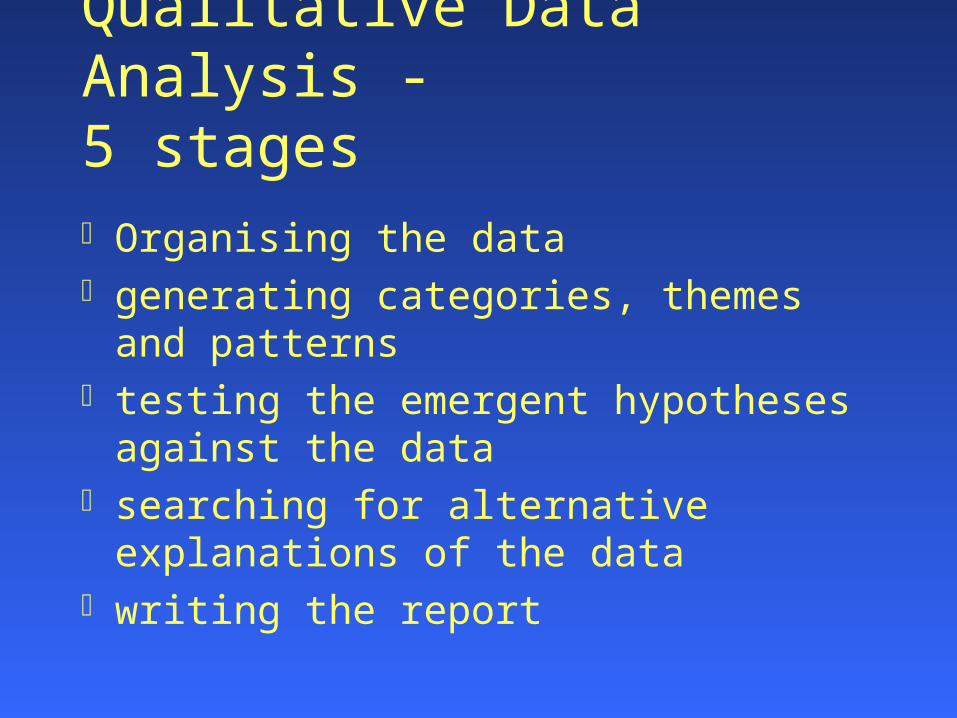
Qualitative Data Analysis -
5 stages Organising the data generating categories, themes and
patterns testing the emergent hypotheses
against the data searching for alternative
explanations of the data writing the report

1: Organising the data
Reading, reading and READING to familiarise yourself with the data
Identify what your research question is and discard any data not relating to the research question - this is what is called “identification of the unit of analysis”.
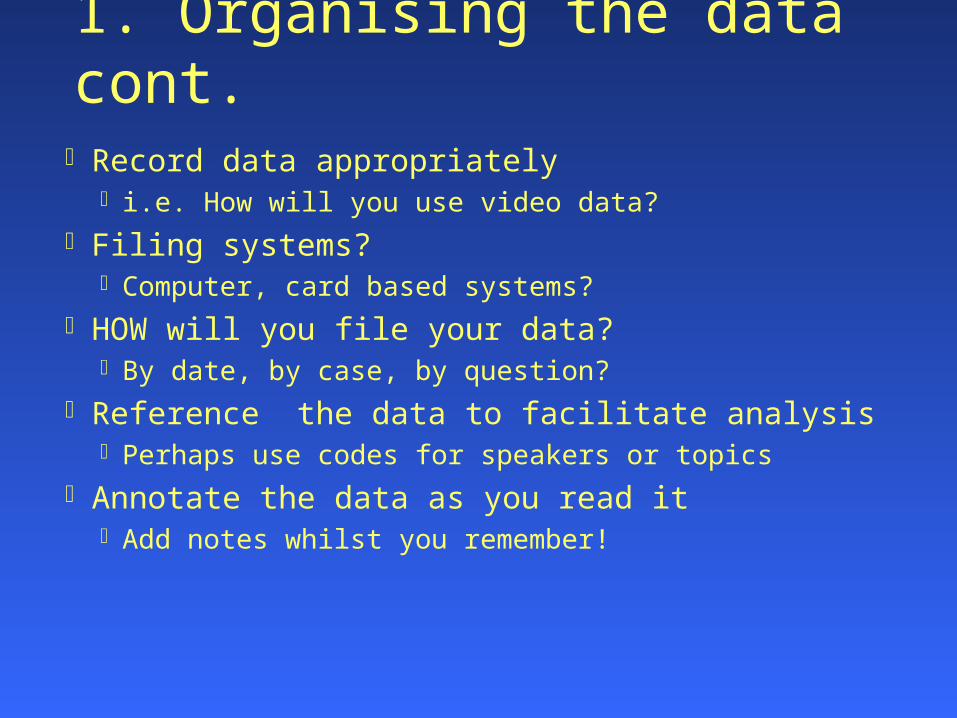
1. Organising the data cont. Record data appropriately
i.e. How will you use video data? Filing systems?
Computer, card based systems? HOW will you file your data?
By date, by case, by question? Reference the data to facilitate analysis
Perhaps use codes for speakers or topics Annotate the data as you read it
Add notes whilst you remember!

2: Generating Categories, Themes and Patterns Look for regularities, salient themes, patterns
of belief Annotate or mark up themes in the interview
transcripts – this can be known as coding but may involve you not just numbering but perhaps colour coding parts of the text relating to a particular category
As you can imagine this is tedious and time consuming - it involves reading and re-reading the text numerous occasions – but worth it as you must do it thoroughly!!
Categorising the data Most qualitative research uses analytic
categories to describe and explain These categories may be derived
inductively – i.e. obtained by observation of your data
This is known as ‘grounded theory’ – the inductive process of coding incidents in the data and identifying analytical categories as they ‘emerge from’ the data
Grounded Theory The process involves identifying a
theme and attempting to verify, confirm and quantify it by searching through the data
Once all the data that match that theme have been located, the researcher repeats the process to identify further themes or categories
Generation of categories contd
As categories of meaning emerge, you then search for those that have internal convergence or external divergence i.e. categories should be internally consistent but distinct from one another
Constant Comparison All data relevant to each category are identified
and examined Each item is checked and compared to establish
analytical categories – the nuances, the positive or negative ‘feel’
There may be overlap but crucially you want to select key themes or categories for further investigation
Grouping categories together typically entails a process of cutting and pasting of key points of the dialogue to illustrate these categories
Categories should be considered as provisional and may be subject to revision as the analysis proceeds
3/4 Testing Emergent Hypotheses / Search for alternatives
Evaluate whether these categories are robust and hold-up against the original data on scrutiny
Consider links and relationships between categories
Be critical and challenge your analysis - is there really a pattern there?
5: Writing up the report This is where many qualitative studies fall short
of the mark several models for writing up exist generally speaking the categories, and themes
are presented in a logical manner and often short textual examples of the original transcript are used to illustrate the point
sometimes descriptive statistics are used to illustrate the occurrence of key words or themes in the data thereby supporting the key points made in the qualitative analysis.
Deficiencies of the human analyst
Data overload - limitations on the amount of data that can be dealt with
First impressions - early input makes a large impression so that subsequent revision is resisted.
Information availability - information which is difficult to get hold of gets less attention than that which is easier to obtain.
Positive instances - there is a tendency to ignore information conflicting with hypotheses already held, and to emphasise information which confirms them (Rosenthal effect).
Contd. Internal consistency - there is a tendency to
discount the novel and the unusual. Uneven reliability - the fact that some sources
are more reliable than others tends to be ignored.
Missing information - something for which information is incomplete tends to be devalued.
Revision of hypotheses - there is a tendency either to over or to under react to new information.
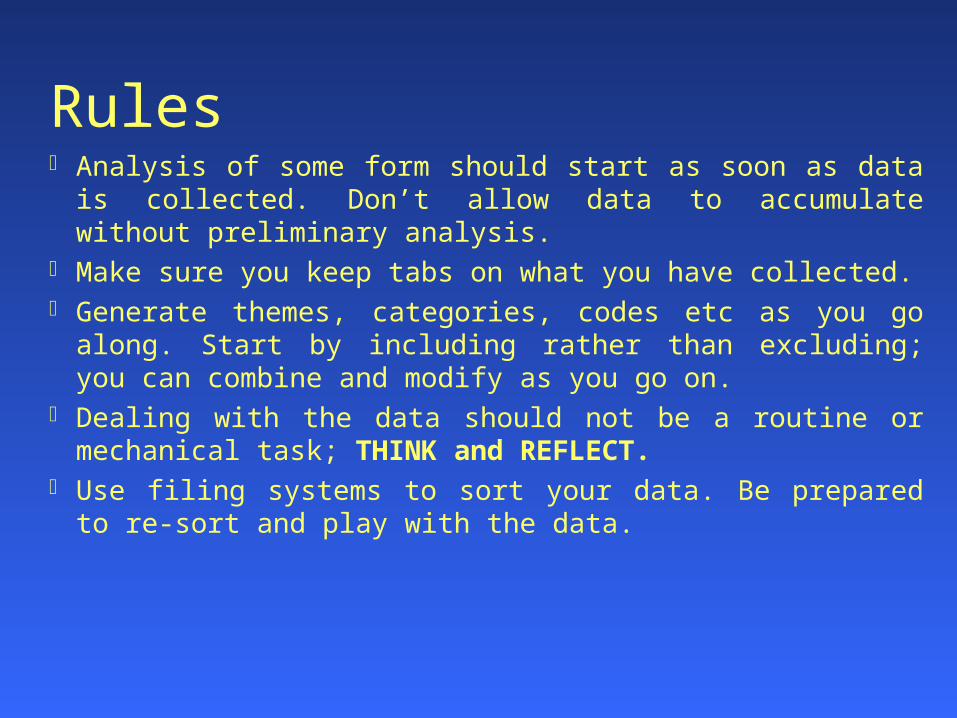
Rules Analysis of some form should start as soon as data is
collected. Don’t allow data to accumulate without preliminary analysis.
Make sure you keep tabs on what you have collected. Generate themes, categories, codes etc as you go
along. Start by including rather than excluding; you can combine and modify as you go on.
Dealing with the data should not be a routine or mechanical task; THINK and REFLECT.
Use filing systems to sort your data. Be prepared to re-sort and play with the data.
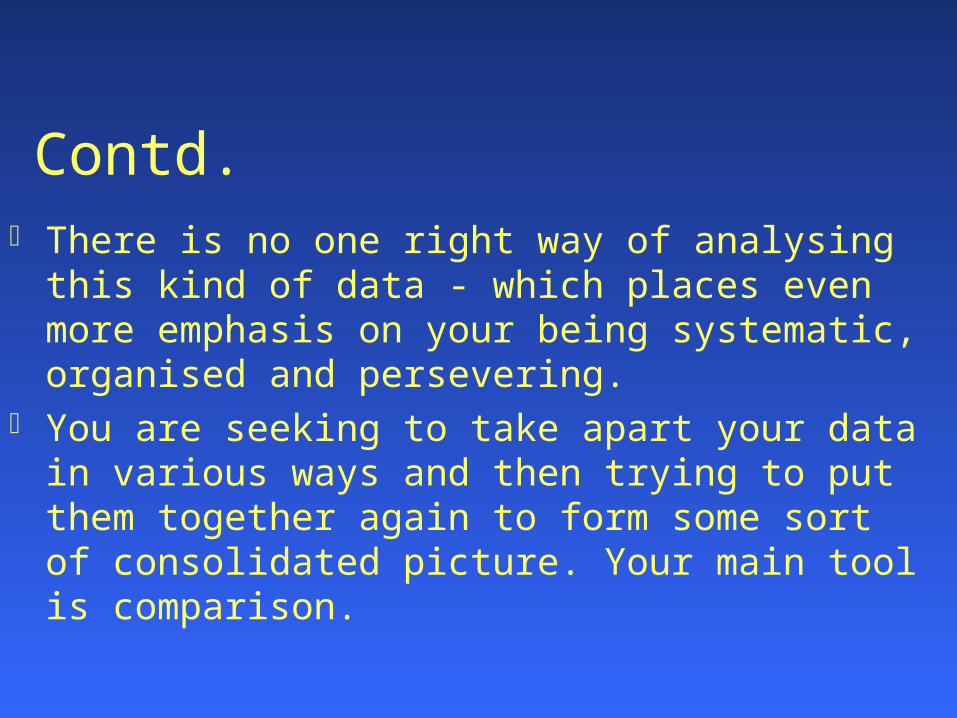
Contd. There is no one right way of analysing this
kind of data - which places even more emphasis on your being systematic, organised and persevering.
You are seeking to take apart your data in various ways and then trying to put them together again to form some sort of consolidated picture. Your main tool is comparison.
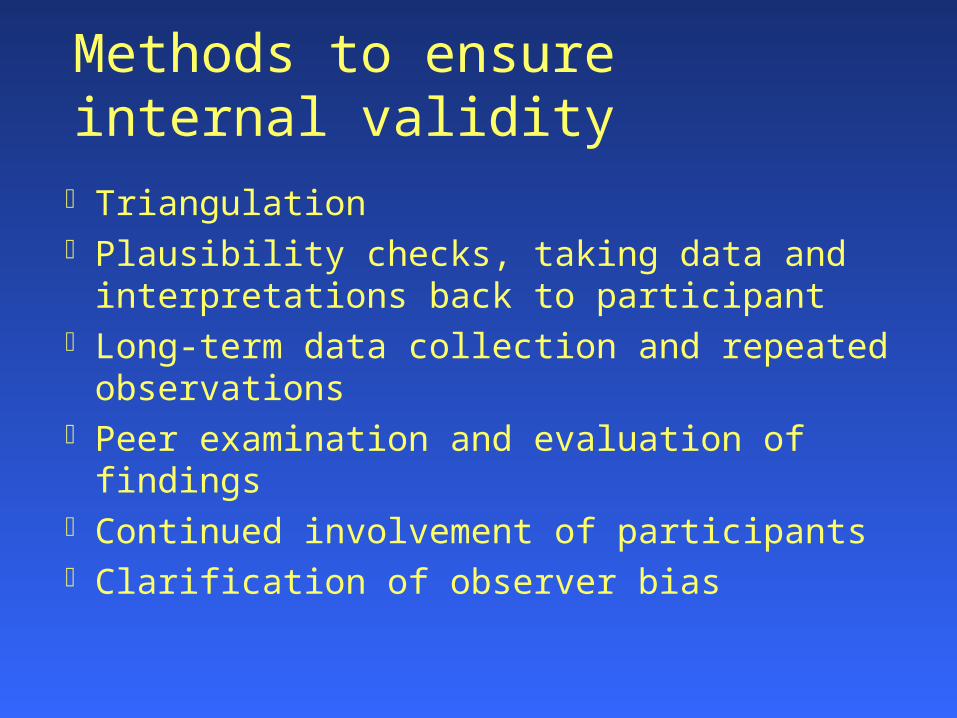
Methods to ensure internal validity Triangulation Plausibility checks, taking data and
interpretations back to participant Long-term data collection and repeated
observations Peer examination and evaluation of findings Continued involvement of participants Clarification of observer bias
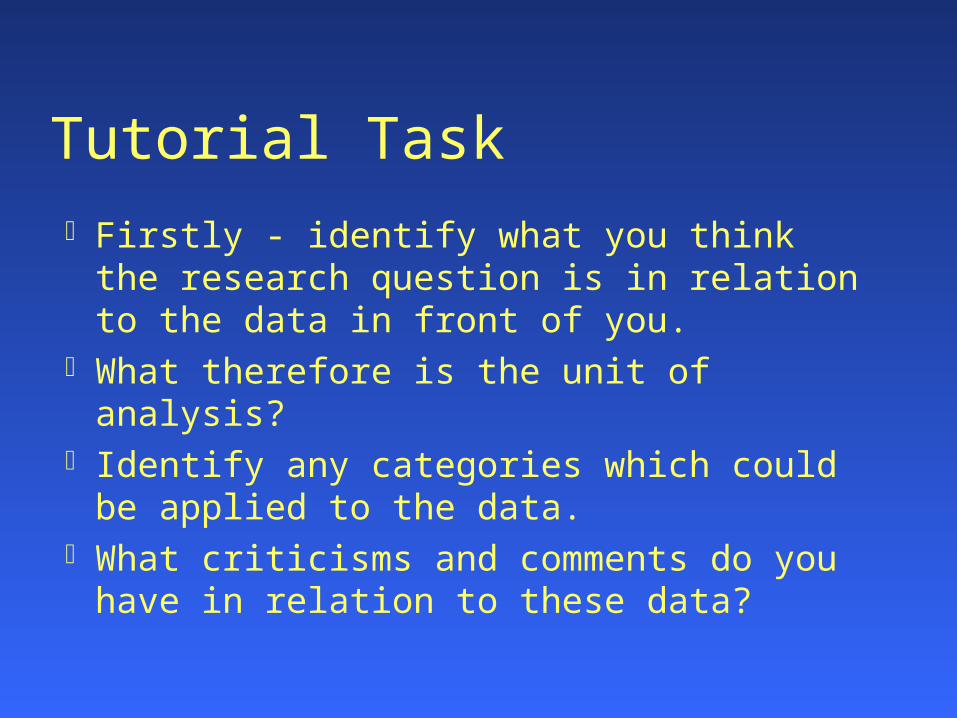
Tutorial Task Firstly - identify what you think the
research question is in relation to the data in front of you.
What therefore is the unit of analysis? Identify any categories which could
be applied to the data. What criticisms and comments do you
have in relation to these data?
Feedback
The unit of analysis was “sentences or statements that related to informational needs of patients”
The categories that were drawn up by the researcher in this case were firstly “positive factors” and “negative factors” and then following this various themes were identified…


![>ÀÌÊEÊ Àii Ê Õ ` }Ê Ê Ê ÊÊÊÊ ià } ]Ê ÃÌÀÕVÌ ÊEÊ > >}i i Ì · PDF file- >ÀÌÊEÊ Àii Ê Õ ` }Ê Ê Ê ÊÊÊÊ ià } ]Ê ÃÌÀÕVÌ ÊEÊ > >}i i Ì Registration](https://img.pdfslide.us/doc/110x75/5aba34ed7f8b9aa6018ec7de/-e-ii-i-v-e-i-i-e-ii-i-v-e-i-i-registration-form-the-hkie-.jpg)


![TCL Q3 & YTD Dec 18 Signed Results · 2019-01-30 · ! Êê ® Ê 15 ÊÔ Í Ê 6 Ê % Ê Ê Ê ¡ 9 Ê F1 Gë \ + Ê : °7 Ê ÊC º = Ê z a ± Ê Ê Ê ] ¢ Ê ¯ . y ÊI r Hì](https://img.pdfslide.us/doc/110x75/5f561fa3e994306673769de0/tcl-q3-ytd-dec-18-signed-results-2019-01-30-15-6.jpg)


![À }Ê/ i Ê iÀiÊ ÊÃV Ê À }Ê/ i Ê iÀiÊ ÊÃV Ê > `ÊÜ À « >ViÊÌ ... › 2017 › 04 › tshirt-action.pdfJ À }/ i iÀi VÌ ÃÊ Ê/i>V iÀÃ]Ê ÕÀÃiÃ]Ê `Ü ÛiÃ]Ê](https://img.pdfslide.us/doc/110x75/60bf2e37c1c1697ab666bd47/-i-ii-fv-i-ii-fv-oe-vioe.jpg)