Embed Size (px)
Citation preview

National Commercial Bank
Qualitative and Quantitative Pillar 3 Disclosures
As of 31 December 2014

Qualitative and Quantitative Pillar 3 Disclosures
As at 31 December 2014
Contents 1.0 Scope of Application ...................................................................................................................................................................................................................................... 1
1.1 Introduction ................................................................................................................................................................................................................................................. 1 1.2 Basis of Consolidation ................................................................................................................................................................................................................................. 1 (i) Entities (within the group) fully consolidated for regulatory purposes .......................................................................................................................................................... 2 (ii) Significant investments in banking, financial and insurance entities that are outside the scope of regulatory consolidation ....................................................................... 2 (iii) Entities (within the group) neither consolidated nor deducted .................................................................................................................................................................... 3 1.3 Transferability of Capital ............................................................................................................................................................................................................................. 3
2.0 Capital Structure ........................................................................................................................................................................................................................................... 4 3.0 Capital Adequacy ........................................................................................................................................................................................................................................ 11 4.0 Credit risk .................................................................................................................................................................................................................................................... 13
4.1 Strategies ................................................................................................................................................................................................................................................... 15 4.2 Organization Structure ............................................................................................................................................................................................................................... 15 4.3 Risk reporting and monitoring – risk rating systems ................................................................................................................................................................................. 16 4.4 Internal methodologies for calculating economic capital requirements ..................................................................................................................................................... 20 4.5 Credit risk management policy, past due and impaired, specific and general allowances ......................................................................................................................... 20 4.6 Application of the standardized approach for credit risk ............................................................................................................................................................................ 23 4.7 Credit Risk Mitigation ............................................................................................................................................................................................................................... 25 4.8 Use of External Credit Assessment Institutions (ECAIs) .......................................................................................................................................................................... 27 4.9 Exposure related to counterparty credit risk .............................................................................................................................................................................................. 27 4.10 Securitization ........................................................................................................................................................................................................................................... 29
5.0 Market Risk.................................................................................................................................................................................................................................................. 30 5.1 Strategies ................................................................................................................................................................................................................................................... 30 5.2 Organization Structure ............................................................................................................................................................................................................................... 30 5.3 Risk reporting and monitoring ................................................................................................................................................................................................................... 30 5.4 Risk Mitigation – Hedging ........................................................................................................................................................................................................................ 31 5.5 Internal methodologies for calculating economic capital requirements ..................................................................................................................................................... 31 5.6 Application of the standardized approach for market risk ......................................................................................................................................................................... 32
6.0 Operational risk ........................................................................................................................................................................................................................................... 33 6.1 Framework ................................................................................................................................................................................................................................................. 33 6.2 Assessment ................................................................................................................................................................................................................................................ 33 6.3 Application of the standardized approach for operational risk .................................................................................................................................................................. 36
7.0 Equities in Banking Book ............................................................................................................................................................................................................................ 37 8.0 Interest Rate Risk in Banking Book ........................................................................................................................................................................................................... 41
Qualitative and Quantitative Pillar 3 Disclosures
As at 31 December 2014
1
1.0 Scope of Application
1.1 Introduction
The Pillar 3 disclosures and the related regulations apply to the National Commercial Bank (the Bank) at a consolidated level. Please refer to
note 1.1 of the Audited Financial Statements for the year ended 31 December 2014 for details on the incorporation and activities of the Bank.
1.2 Basis of Consolidation
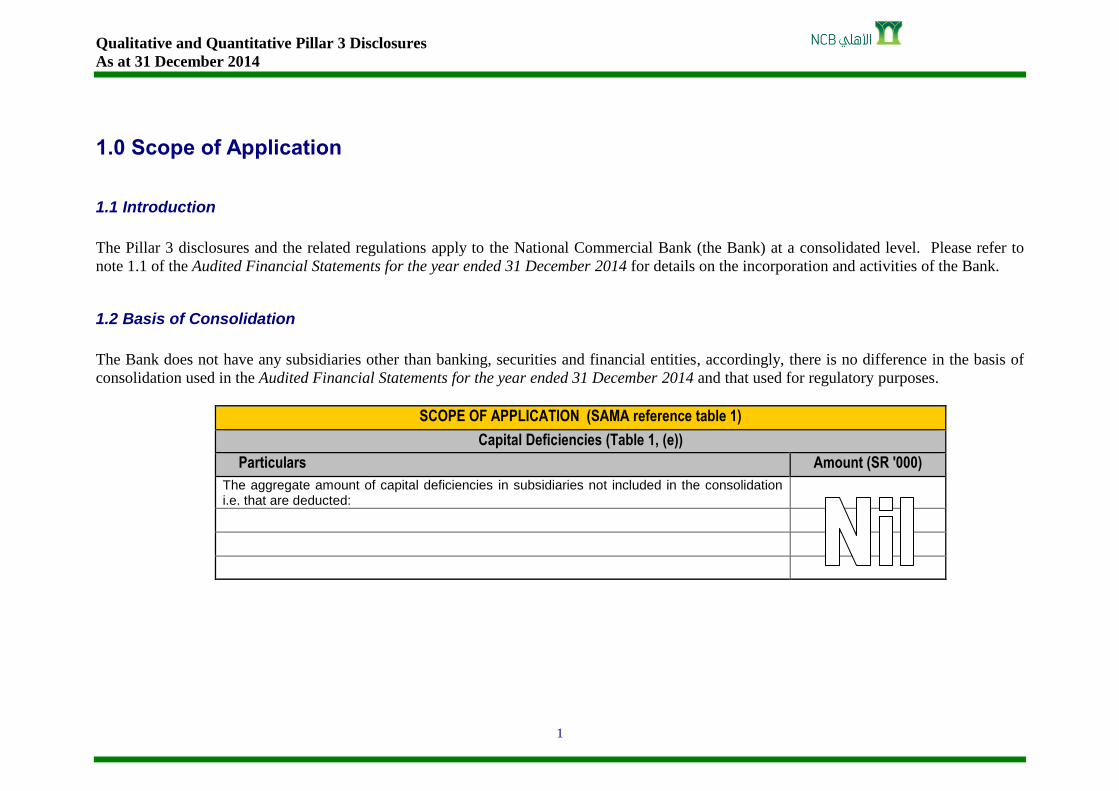
The Bank does not have any subsidiaries other than banking, securities and financial entities, accordingly, there is no difference in the basis of
consolidation used in the Audited Financial Statements for the year ended 31 December 2014 and that used for regulatory purposes.
SCOPE OF APPLICATION (SAMA reference table 1)
Capital Deficiencies (Table 1, (e))
Particulars Amount (SR '000)
The aggregate amount of capital deficiencies in subsidiaries not included in the consolidation i.e. that are deducted:
Qualitative and Quantitative Pillar 3 Disclosures
As at 31 December 2014
2
(i) Entities (within the group) fully consolidated for regulatory purposes
Following is a list of the consolidated subsidiaries of the Bank.
(1) NCB Capital Company (NCBC)
(1.1) Eastgate Capital Holdings Inc. (Eastgate)
(1.2) NCBC Investment Management Umbrella Company Plc
(2) Türkiye Finans Katılım Bankası A.Ş.(TFK) and its special purpose entities
(3) Real Estate Development Company (Redco)
(4) Alahli Insurance Services Marketing Company
Please refer to note 1.2 of the Audited Financial Statements for the year ended 31 December 2014 for details on the incorporation and activities
of the subsidiaries of the Bank.
(ii) Significant investments in banking, financial and insurance entities that are outside the scope of regulatory consolidation
Capital investment in banking, financial and insurance entities where NCB owns more than 10% of its issued common share capital are subject
to certain thresholds of both NCB and the entities’ capital set by Basel III. Thus the aggregate of all NCB’s investments does not trigger any
deduction adjustment; and therefore they are risk weighted ate 250%. Following is a list of significant investments in banking, financial and
insurance entities that are outside the scope of regulatory consolidation:
Qualitative and Quantitative Pillar 3 Disclosures
As at 31 December 2014
3
(1) Al-Ahali Takaful Company
The Bank has a 30% ownership in Al-Ahali Takaful Company. Al-Ahali Takaful Company (the Company) is a Saudi Joint Stock
Company registered in the Kingdom of Saudi Arabia under Commercial Registration No. 4030171573 dated 21 Rajab 1428H,
corresponding to 4 August 2007. The object of the Company is to transact cooperative insurance operations and related activities in the
Kingdom of Saudi Arabia. The Company was listed on the Saudi stock market on 18 August 2007. The Company commenced its
commercial operations on 4 February 2008.
(2) Arabian Financial Services Company
The Bank has 13% ownership in Arabian Financial Services (AFS) company. It is the region's leading provider of electronic-payments
and consumer-finance outsourcing services.
(3) Saudi Traveler Cheques Company
The Bank has 25% ownership in the Saudi Travelers Cheques Company (STCC). Saudi Riyal Travelers Cheques are issued by the
company which was jointly established by the banks of Saudi Arabia.
(4) The Saudi Credit Bureau
The Bank has 11% ownership in the Saudi Credit Bureau (SIMAH). It is the first and sole licensed national credit bureau offering
consumer and commercial credit information services to respective members in the Kingdom of Saudi Arabia.
(iii) Entities (within the group) neither consolidated nor deducted
All other equity investments are risk weighted at 100%.
1.3 Transferability of Capital
There are no restrictions, or other major impediments, on transfer of funds or regulatory capital within the group.

Qualitative and Quantitative Pillar 3 Disclosures
As at 31 December 2014
4
2.0 Capital Structure
The capital of the bank consists of the following:
(1) Eligible paid-up share capital
The authorized, issued and fully paid share capital of the Bank excluding Treasury shares1 consists of 1,995 million shares of SR 10 each. All
these shares carry equal voting rights and are not redeemable. These shares rank junior to all other claims on the Bank.
(2) Eligible reserves
Eligible reserves comprise statutory reserves, other reserves, retained earnings, minority interest and eligible portfolio (collective) allowances.
Eligible reserves are mainly created by accumulated appropriations of profit and are maintained for future growth.
Goodwill, intangible assets and other prescribed deductions are deducted from eligible capital.
(3) Debt Securities Issued
The National Commercial Bank issued Non- convertible unlisted Sukok on February 2014. The tenure is 10 years, callable on the 5th
anniversary
of the issue date and carrying profit payable semi-annually.
1 The bank acquired its own equity shares from a customer as a result of partial set-off of debt. Treasury shares are deducted from equity and accounted for at cost, being the
value of set-off.
Qualitative and Quantitative Pillar 3 Disclosures
As at 31 December 2014
5
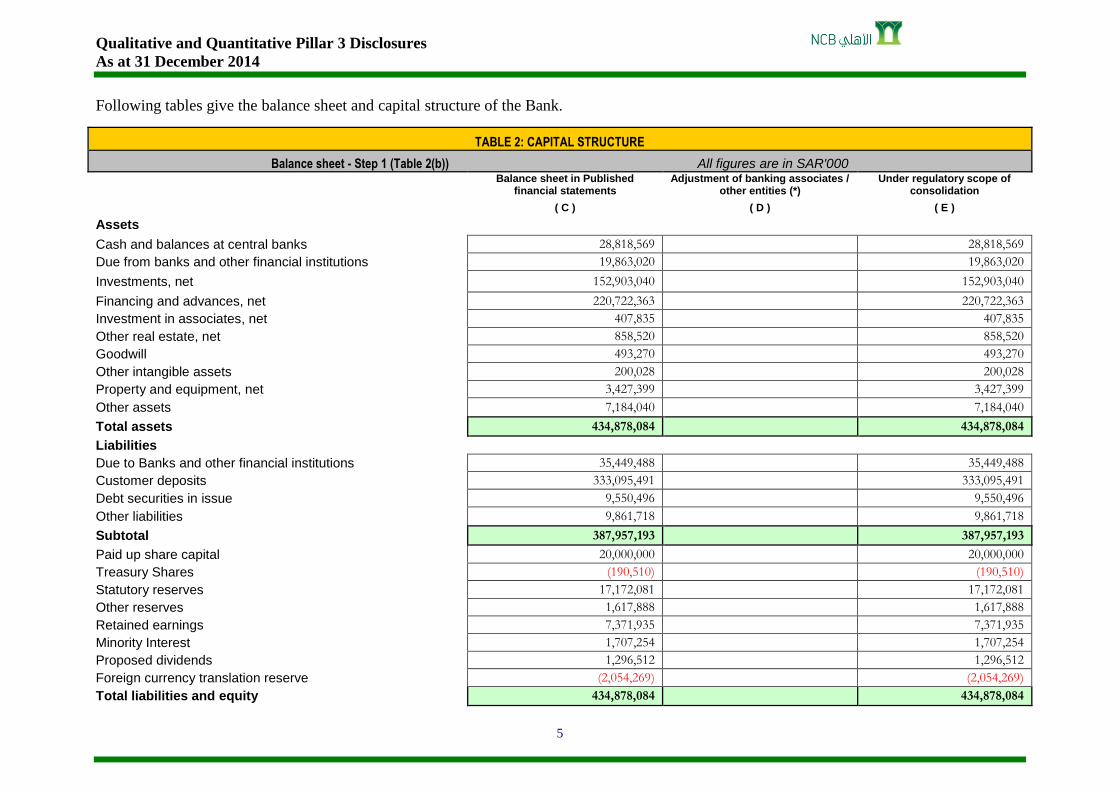
Following tables give the balance sheet and capital structure of the Bank.
TABLE 2: CAPITAL STRUCTURE
Balance sheet - Step 1 (Table 2(b)) All figures are in SAR'000
Balance sheet in Published
financial statements Adjustment of banking associates /
other entities (*) Under regulatory scope of
consolidation
( C ) ( D ) ( E )
Assets Cash and balances at central banks 28,818,569 28,818,569
Due from banks and other financial institutions 19,863,020 19,863,020
Investments, net 152,903,040 152,903,040
Financing and advances, net 220,722,363 220,722,363
Investment in associates, net 407,835 407,835
Other real estate, net 858,520 858,520
Goodwill 493,270 493,270
Other intangible assets 200,028 200,028
Property and equipment, net 3,427,399 3,427,399
Other assets 7,184,040 7,184,040
Total assets 434,878,084 434,878,084
Liabilities Due to Banks and other financial institutions 35,449,488 35,449,488
Customer deposits 333,095,491 333,095,491
Debt securities in issue 9,550,496 9,550,496
Other liabilities 9,861,718 9,861,718
Subtotal 387,957,193 387,957,193
Paid up share capital 20,000,000 20,000,000
Treasury Shares (190,510) (190,510)
Statutory reserves 17,172,081 17,172,081
Other reserves 1,617,888 1,617,888
Retained earnings 7,371,935 7,371,935
Minority Interest 1,707,254 1,707,254
Proposed dividends 1,296,512 1,296,512
Foreign currency translation reserve (2,054,269) (2,054,269)
Total liabilities and equity 434,878,084 434,878,084

Qualitative and Quantitative Pillar 3 Disclosures
As at 31 December 2014
6
TABLE 2: CAPITAL STRUCTURE
Balance sheet - Step 2 (Table 2(c)) All figures are in SAR'000
Balance sheet in Published
financial statements
Adjustment of banking
associates / other entities
Under regulatory scope of
consolidation
Reference*
( C ) ( D ) ( E ) Assets
Cash and balances at central banks 28,818,569 28,818,569
Due from banks and other financial institutions 19,863,020 19,863,020
Investments, net 152,903,040 152,903,040
Financing and advances, net 220,722,363 220,722,363
of which Collective provisions (2,755,499) (2,755,499)
A
Investment in associates, net 407,835 407,835
Other real estate, net 858,520 858,520
Goodwill 493,270 493,270
B
Other intangible assets 200,028 200,028
C
Property and equipment, net 3,427,399 3,427,399
Other assets 7,184,040 7,184,040
Total assets 434,878,084
434,878,084
Liabilities
Due to Banks and other financial institutions 35,449,488 35,449,488
Customer deposits 33,309,549 33,309,549
Debt securities in issue 9,550,496 9,550,496
Other liabilities 9,861,718 9,861,718
Subtotal 387,957,193
387,957,193
Paid up share capital 20,000,000 20,000,000
Treasury Shares (190,510) (190,510)
D
Statutory reserves 17,172,081 17,172,081
Other reserves 1,617,888 1,617,888
Retained earnings 7,371,935 7,371,935
Minority Interest 1,707,254 1,707,254
of which Common share capital issued by subsidiaries and held by third parties (amount allowed in group CET1) 1,541,447 1,541,447 E
Proposed dividends 1,296,512 1,296,512
Foreign currency translation reserve (2,054,269) (2,054,269)
Total liabilities and equity 434,878,084
434,878,084
*Please refer to pages 7 and 8 for the impact of these adjustments on the capital structure

Qualitative and Quantitative Pillar 3 Disclosures
As at 31 December 2014
7
TABLE 2: CAPITAL STRUCTURE
Common template (transition) - Step 3 (Table 2(d)) i
(From January 2013 to 2018 identical to post 2018) With amount subject to Pre- Basel III Treatment All figures are in SAR'000
Components of regulatory capital reported by the bank
Amounts subject to Pre - Basel III treatment
Source based on reference numbers / letters of the balance sheet under the regulatory scope of consolidation from step 2(see page 6)
Common Equity Tier 1 capital: Instruments and reserves Directly issued qualifying common share capital (and equivalent for non-joint stock
companies) plus related stock surplus 20,000,000
Retained earnings 8,668,447
Accumulated other comprehensive income (and other reserves) 16,735,700
Common share capital issued by subsidiaries and held by third parties (amount allowed in group Common Equity Tier 1 - CET1)
1,541,447
E
Common Equity Tier 1 capital before regulatory adjustments 46,945,594
Common Equity Tier 1 capital: Regulatory adjustments Goodwill (net of related tax liability) 493,270
B
Other intangibles other than mortgage-servicing rights (net of related tax liability) 200,028
C
Cash-flow hedge reserve (204)
Investments in own shares (if not already netted off paid-in capital on reported balance sheet)
190,510
D
Total regulatory adjustments to Common equity Tier 1 883,604 Common Equity Tier 1 capital (CET1) 46,061,990 Tier 1 capital (T1 = CET1 + Additional Tier 1 CapitalAT1) 46,061,990
Qualitative and Quantitative Pillar 3 Disclosures
As at 31 December 2014
8
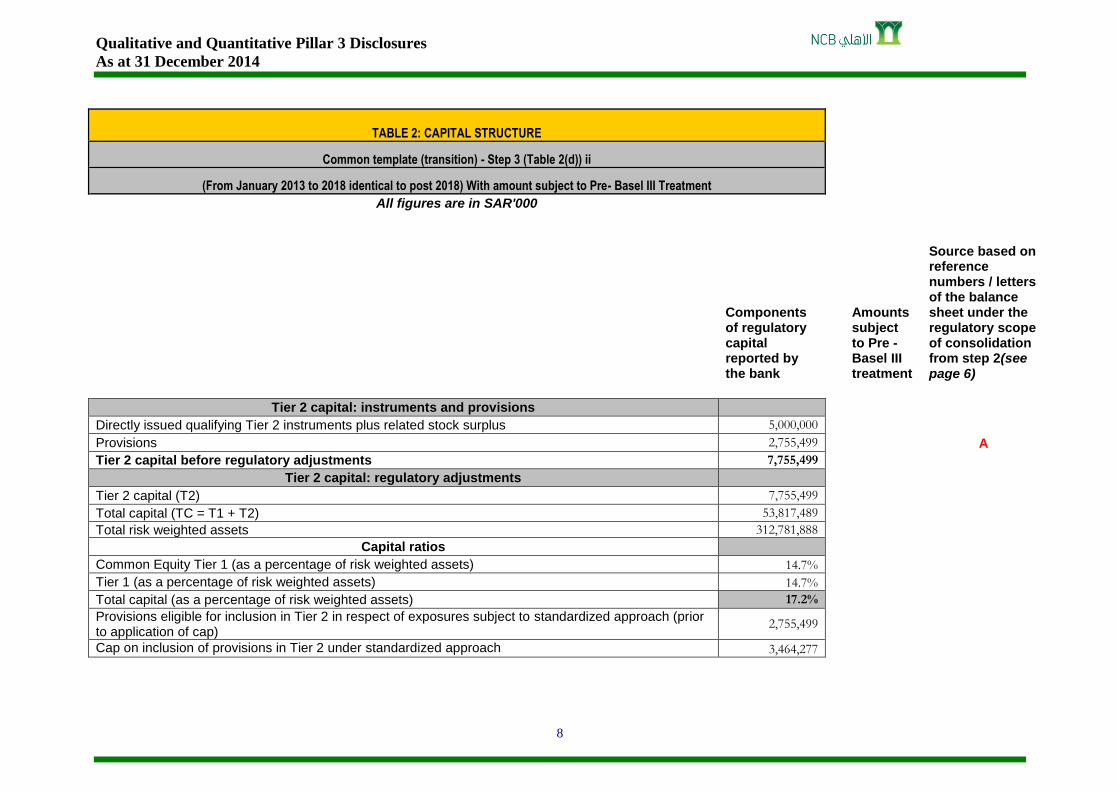
TABLE 2: CAPITAL STRUCTURE
Common template (transition) - Step 3 (Table 2(d)) ii
(From January 2013 to 2018 identical to post 2018) With amount subject to Pre- Basel III Treatment All figures are in SAR'000
Components of regulatory capital reported by the bank
Amounts subject to Pre - Basel III treatment
Source based on reference numbers / letters of the balance sheet under the regulatory scope of consolidation from step 2(see page 6)
Tier 2 capital: instruments and provisions Directly issued qualifying Tier 2 instruments plus related stock surplus 5,000,000
Provisions 2,755,499
A
Tier 2 capital before regulatory adjustments 7,755,499
Tier 2 capital: regulatory adjustments
Tier 2 capital (T2) 7,755,499
Total capital (TC = T1 + T2) 53,817,489
Total risk weighted assets 312,781,888
Capital ratios
Common Equity Tier 1 (as a percentage of risk weighted assets) 14.7%
Tier 1 (as a percentage of risk weighted assets) 14.7%
Total capital (as a percentage of risk weighted assets) 17.2%
Provisions eligible for inclusion in Tier 2 in respect of exposures subject to standardized approach (prior to application of cap)
2,755,499
Cap on inclusion of provisions in Tier 2 under standardized approach 3,464,277

Qualitative and Quantitative Pillar 3 Disclosures
As at 31 December 2014
9
TABLE 2: CAPITAL STRUCTURE
Main features template of regulatory capital instruments - (Table 2(e))
1 Issuer National Commercial Bank (NCOMBK)
2
Unique identifier (eg CUSPIN, ISIN or Bloomberg identifier for
private placement) ISIN No. SA13HFK0IEJ4
3 Governing law(s) of the instrument The instrument is governed by the laws of the Kingdom of Saudi Arabia
Regulatory treatment
4 Transitional Basel III rules Tier 2
5 Post-transitional Basel III rules Eligible
6 Eligible at solo/group/group & solo Group and Solo
7 Instrument type Subordinated Sukuk
8
Amount recognized in regulatory capital (Currency in mil, as of most
recent reporting date) SAR 5,000mil
9 Par value of instrument SAR 5,000mil
10 Accounting classification Liability - amortized cost
11 Original date of issuance 25th February 2014
12 Perpetual or dated Dated
13 Original maturity date 25th February 2024
14 Issuer call subject to prior supervisory approval Yes
15 Option call date, contingent call dates and redemption amount
Call option only available after 5 years or for a regulatory or tax event, 25th February 2019 as
the date for redemption, NCB shall be entitled to redeem in whole, but not in part, by giving
not less than thirty (30) days' nor more than sixty (60) days' notice to the Sukukholders
16 Subsequent call dates if applicable As above
Coupons / dividends

Qualitative and Quantitative Pillar 3 Disclosures
As at 31 December 2014
10
TABLE 2: CAPITAL STRUCTURE
Main features template of regulatory capital instruments - (Table 2(e))
17 Fixed or Floating dividend/coupon Floating
18 Coupon rate and any related index 6 months SIBOR + 110bps
19 Existence of a dividend stopper No
20 Fully discretionary, partially discretionary or mandatory Mandatory
21 Existence of step up or other incentive to redeem No
22 Non-cumulative or cumulative Non-cumulative
23 Convertible or non-convertible Non - convertible
24 If convertible, conversion trigger (s) N/A
25 If convertible, fully or partially N/A
26 If convertible, conversion rate N/A
27 If convertible, mandatory or optional conversion N/A
28 If convertible, specify instrument type convertible into N/A
29 If convertible, specify issuer of instrument it converts into N/A
30 Write-down feature Yes
31 If write-down, write-down trigger (s)
Terms of contract of the instrument provide the legal basis for SAMA to trigger write-down
(a contractual approach)
32 If write-down, full or partial Written down fully or partial
33 If write-down, permanent or temporary Permanent
34 If temporary write-down, description of the write-up mechanism N/A
35
Position in subordination hierarchy in liquidation (specify instrument
type immediately senior to instrument) Subordinated. Senior bondholders are immediately senior to this instrument
36 Non-compliant transitioned features N/A
37 If yes, specify non-compliant features N/A

Qualitative and Quantitative Pillar 3 Disclosures
As at 31 December 2014
11
3.0 Capital Adequacy
The bank defines capital as the resources necessary to cover unexpected losses and thus NCB, at all times, maintains a sufficient capital to cover
risks inherent in its business operations and to maintain a strong credit rating.
The Bank has an Internal Capital Adequacy Assessment Process (ICAAP) by which it examines its risk profile from both regulatory and
economic capital point of view and ensures that the level of capital supply:
• remains sufficient to support the Bank’s risk profile;
• exceeds the Bank’s formal, minimum regulatory capital requirements by a predefined buffer;
• is capable of withstanding stressed scenarios;
• remains consistent with the Bank’s strategic and operational plans.
Within the framework of the ICAAP, an annual Capital Plan is prepared. The Capital Plan is reviewed by the Senior Management and approved
by the Board of Directors of the Bank and is submitted to SAMA in accordance with their directives.
Regulatory and economic capital assessments are used for the management of risk and capital within the Bank. The economic capital assessment
is the more risk-sensitive measure and it takes into account the correlation between different risks.
The economic capital models employed at the Bank are calibrated to quantify the level of capital that is sufficient to absorb potential losses over
a one-year time horizon at a 99.9 percent degree of confidence.
The Bank identifies and manages the risks it faces through defined internal control procedures and stress testing. It assesses and manages the
following risks via the capital planning process:
Credit risk
Market risk
Operational risk
Liquidity risk
Interest rate risk
Concentration risk
Macroeconomic and business cycle risk
Strategic risk
Reputation risk
Settlement and Pre-settlement Risks

Qualitative and Quantitative Pillar 3 Disclosures
As at 31 December 2014
12
Scenario analysis and stress testing
The Bank regularly assesses eligible capital supply against stressed losses under a range of scenarios. Stress scenarios are developed using
historical losses, qualitative and quantitative techniques, and are employed to estimate the impact on capital requirements. The Senior
Management and the Board are regularly informed of the results of the stress tests to ensure that the Bank has sufficient capital and that any
unacceptable risks are mitigated. These scenarios are regularly reviewed and updated to account for the changing market conditions.
The Bank's Capital Plan examines that the Bank's current and projected capital is adequate to bear any stressed losses and to support its current
activities and future strategies and operational plans.
Following table gives the Bank's Capital Adequacy Ratios (CAR) as of 31st of December 2014.
CAPITAL ADEQUACY – CAR (SAMA reference table 3)
Capital Adequacy Ratios (TABLE 3, (f))
Particulars Total capital ratio Tier 1 capital ratio
%
Top consolidated level 17.2% 14.7%

Qualitative and Quantitative Pillar 3 Disclosures
As at 31 December 2014
13
4.0 Credit risk
Credit risk is the risk of financial loss resulting from the failure of a borrower or counterparty to honor its financial or contractual obligations.
Credit exposures arise principally in credit-related risk that is embedded in financing and advances and investments. There is also credit risk in
foreign exchange and derivative transactions, as well as off-balance sheet financial instruments, such as trade-finance related products
derivatives and financing commitments. Among the risks the Bank engages in, credit risk generates the largest regulatory capital requirement.
Following table gives exposures subject to credit risk and related capital charges as of 31st of December 2014.
CAPITAL ADEQUACY – Credit Risk (SAMA reference table 3)
Amount of Exposures Subject To Standardized Approach of Credit Risk and related Capital Requirements (TABLE 3, (b))
Portfolios Amount of exposures (On Balance Sheet)
(SAR '000)
Capital requirements
(SAR '000)
Amount of exposures
(Off Balance Sheet +
Derivatives) (SAR '000)
Capital requirements
(SAR '000)
Total Amount of Exposure
(SAR '000)
Total Capital requirements
(SAR '000) Sovereigns and central banks: 102,645,244 331,221 - - 102,645,244 331,221
SAMA and Saudi Government 64,917,551 - - - 64,917,551 -
Others 37,727,693 331,221 - - 37,727,693 331,221
Multilateral Development Banks (MDBs) 7,815,040 - - - 7,815,040 -
Public Sector Entities (PSEs) 107,332 8,359 12,292 893 119,624 9,252
Banks and securities firms 25,961,198 898,017 8,654,107 401,061 34,615,305 1,299,079
Corporates 168,156,411 10,222,412 32,662,972 2,299,870 200,819,383 12,522,282
Retail non-mortgages 68,288,176 4,065,407 3,939,113 167,712 72,227,289 4,233,118
Small Business Facilities Enterprises(SBFE's) 6,483,118 356,709 2,392,464 137,749 8,875,582 494,457
Mortgages 25,428,789 1,574,794 984,744 39,380 26,413,533 1,614,173
Residential 16,629,480 1,073,746 393,502 15,740 17,022,982 1,089,486
Commercial 8,799,309 501,048 591,242 23,640 9,390,551 524,687
Securitized assets 8,122,520 129,960 - - 8,122,520 129,960
Equity 1,443,774 123,292 - - 1,443,774 123,292
Others 22,927,501 1,451,625 2,808 457,369 22,930,309 1,908,994
Total 430,895,984 18,805,086 46,256,035 3,366,285 477,152,019 22,171,371

Qualitative and Quantitative Pillar 3 Disclosures
As at 31 December 2014
14
Following tables give exposures subject to credit risk as of 31st of December 2014 and the average exposure during the year then ended.
CREDIT RISK (SAMA reference table 4)
Credit Risk Exposure (Table 4, (b))
Portfolios Total gross credit risk exposure (SAR '000)
Average gross credit risk exposure over the period *
(SAR '000)
Sovereigns and central banks: 102,645,244 119,200,724
SAMA and Saudi Government 64,917,551 80,335,195
Others 37,727,693 38,865,529
Multilateral Development Banks (MDBs) 7,815,040 7,853,391
Public Sector Entities (PSEs) 119,624 67,293
Banks and securities firms 34,615,305 30,147,007
Corporates 200,819,383 189,936,251
Retail non-mortgages 72,227,289 68,620,981
Small Business Facilities Enterprises (SBFE's) 8,875,582 7,588,641
Mortgages 26,413,533 23,404,616
Residential 17,022,982 15,209,226
Commercial 9,390,551 8,195,390
Securitized assets 8,122,520 8,241,246
Equity 1,443,774 2,152,467
Others 22,930,309 22,454,808
Total 477,152,019 472,078,785
* The average is calculated on a quarterly basis

Qualitative and Quantitative Pillar 3 Disclosures
As at 31 December 2014
15
4.1 Strategies
The principal objective of credit risk management is to ensure a high quality credit portfolio and the minimization of losses. This objective is
accomplished by:
• maintaining a strong culture of responsible lending, supported by a robust risk policy and control framework;
• challenging business originators effectively in defining and implementing risk appetite within individual obligor and industry
concentration limits; and
• ensuring independent, expert scrutiny and approval of credit risks and their mitigation.
4.2 Organization Structure
Corporate Sector
The Head of Corporate Risk Management (HCRM) within the Credit Risk function supports the Chief Risk Officer (CRO), as head of the Risk
function, in overseeing credit risks at the highest level. The Credit Risk function primarily comprises: undertaking independent reviews and
approval of larger and higher-risk credit proposals, setting a risk appetite framework and developing and maintaining the Bank’s credit policy
and credit programs.
The credit risk function includes Senior Credit Officers based regionally and with industry specialization Kingdom-wide. These officers including
the HCRM, fulfill an essential role as independent risk control and approving units as distinct from business line management. They objectively
scrutinize and approve credit proposals within the limits set by the credit policy of the Bank.
Approval of the Credit and Remedial Management Committee, Executive Committee and/or Board is required to extend facilities to customers
above certain risk-based thresholds.

Qualitative and Quantitative Pillar 3 Disclosures
As at 31 December 2014
16
Retail Sector
The Head of Retail Risk Management within the Credit Risk function supports the Chief Risk Officer (CRO), and is comprised of three
departments, Credit Policy, Portfolio Management & Risk Analytics, and Collections to manage the overall risk profile of the consumer lending
business.
The Credit Policy Department is responsible for consumer credit risk management including setting the risk appetite framework and developing
and maintaining the Bank’s credit policies. The Consumer Lending business is governed by Consumer Finance Islamic Credit Policy (CFICP)
Manual which is approved by the Board of Directors, and defines the policies and procedures for the handling of all activities related to
consumer lending.
The Retail Portfolio Management & Risk Analytics Department handles all portfolio and risk analytic activities, including application and
behavioural scoring models related to the consumer portfolio.
The Collections Department is responsible for centrally managing Delinquent Accounts and Recoveries of Written-off accounts.
Enterprise Risk Management
Enterprise Risk Management Department, as part of Risk Group, is responsible for reporting on risk matters to Senior Management, Board and
to regulator, providing credit analytics, calculating and reporting the Bank’s regulatory and economic capital and performing stress tests. It owns
and develops risk models. It prepares quarterly risk reports for the Senior Management and the Risk Committee of the Board.
4.3 Risk reporting and monitoring – risk rating systems
The Bank's exposure to credit risk arises from a wide range of asset classes, customers and product types. A breakdown of the Bank’s financing
and advances to major economic sectors is provided in note 7.5 of the Audited Financial Statements for the year ended 31 December 2014.
To measure and manage the risk in these exposures, both to individually assessed customers and to those aggregated into portfolios, the Bank
employs risk rating systems and other methodologies (such as analysis of past dues). The main characteristics of the Bank’s credit risk rating
system are set out in notes 7.4 and 31 of the Audited Financial Statements for the year ended 31 December 2014.

Qualitative and Quantitative Pillar 3 Disclosures
As at 31 December 2014
17
Following table gives a geographic breakdown of exposures as of 31st of December 2014.
TABLE 4 (STA): CREDIT RISK: GENERAL DISCLOSURES
Geographic Breakdown (Table 4, (c))
Portfolios Geographic Area (SAR '000)
Saudi Arabia Other GCC & Middle East
Europe North America
South East Asia
Turkey Other Countries
Total
Sovereigns and central banks: 64,917,551 11,973,433 762,993 7,916,411 1,521,863 13,323,356 2,229,638 102,645,244
SAMA and Saudi Government 64,917,551
64,917,551
Others
11,973,433 762,993 7,916,411 1,521,863 13,323,356 2,229,638 37,727,693
Multilateral Development Banks (MDBs) 3,534,375
656,250 3,188,925 435,490
7,815,040
Public Sector Entities (PSEs)
119,624
119,624
Banks and securities firms 5,562,609 6,544,990 4,328,370 4,115,938 1,796,902 2,429,870 9,836,625 34,615,305
Corporate 134,269,155 23,005,906 4,801,826 14,935,128 775,882 20,256,438 2,775,047 200,819,383
Retail non-mortgages 60,897,370
11,329,918 72,227,288
Small Business Facilities Enterprises (SBFE's)
8,875,582 8,875,582
Mortgages 13,940,802
12,472,731 26,413,533
Residential 10,847,806
6,175,176 17,022,982
Commercial 3,092,996
6,297,555 9,390,551
Securitized assets
8,122,520
8,122,520
Equity 1,425,715 18,059
1,443,774
Others 13,589,444 129,330 4,314,552 1,837,311
2,923,041 136,631 22,930,309
Total 298,137,021 41,671,719 14,863,991 40,116,233 4,530,137 62,854,978 14,977,940 477,152,019

Qualitative and Quantitative Pillar 3 Disclosures
As at 31 December 2014
18
Following table gives an industry sector breakdown of exposures as of 31st of December 2014.
TABLE 4 (STA): CREDIT RISK: GENERAL DISCLOSURES
Industry Sector Breakdown (Table 4, (d))
Portfolios Industry sector (SAR '000)
Government and quasi
government
Banks and other
financial institutions
Agriculture and fishing
Manufacturing Mining and
quarrying
Electricity, water, gas and health services
Building and construction
Commerce Transportation and
communication
Services Consumer loans and
credit cards
Others Total
Sovereigns and central banks: 102,645,244
102,645,244
SAMA and Saudi Government 64,917,551
64,917,551
Others 37,727,693
37,727,693 Multilateral Development Banks MDBs)
7,815,040
7,815,040
Public Sector Entities (PSEs)
129 95,241 3,901
20,018
335 119,624
Banks and securities firms
34,594,330
20,975 34,615,305
Corporates 7,027,333 18,461,072 1,136,303 35,562,164 5,458,129 21345259 28,683,516 41,553,263 17,913,446 20,337,684 501,010 2,840,202 200,819,383
Retail non-mortgages
10,661 152,538 2,444,841 83,212 23,366 1,351,455 3,861,882 272,905 541,990 61,028,335 2,456,103 72,227,289
Small Business Facilities Enterprises (SBFE's)
10,644 152,520 2,444,709 83,199 23,366 1,350,848 3,858,255 272,870 541,730 130,911 6,530 8,875,582
Mortgages
4,796 136,246 1,610,424 68,242 79,918 2,513,621 2,537,150 227396 691,249 14,283,425 4,261,066 26,413,533
Residential
3,292 45,030 460,243 17,078 29,805 864,181 837,528 113,729 208,117 10,925,388 3,518,591 17,022,982
Commercial
1,504 91,216 1,150,181 51,164 50,113 1,649,440 1,699,621 113,667 483,132 3,358,037 742,475 9,390,551
Securitized assets
8,122,520 8,122,520
Equity
1,056,422
11,050
368,302
8,000
1,443,774
Others
8,108,353 10,630 97,334 3,461 1,509 53,313 115,155 6,599 5,220 9,035 14,519,699 22,930,309
Total 109,672,577 70,050,675 1,435,717 39,725,943 5,708,285 21,453,953 32,601,905 48,435,751 18,420,346 21,604,162 75,821,805 32,220,900 477,152,019

Qualitative and Quantitative Pillar 3 Disclosures
As at 31 December 2014
19
Following table gives a maturity breakdown of exposures as of 31st of December 2014.
CREDIT RISK (SAMA reference table 4)
Residual Contractual Maturity Breakdown (Table 4, (e))
Portfolios Maturity breakdown (SAR '000)
Less than 8 days
8-30 days
30-90 days
90-180 days
180-360 days
1-3 years
3-5 years
Over 5 years
Total
Sovereigns and central banks: 12,097,052 3,003,921 7,719,651 12,980,333 14,517,727 4,544,083 7,370,013 40,412,465 102,645,244
SAMA and Saudi Government 3,294,403 2,000,000 7,107,242 12,390,346 14,022,718 718,421 3,583 25,380,839 64,917,551
Others 8,802,649 1,003,921 612,409 589,988 495,009 3,825,662 7,366,430 15,031,627 37,727,693
Multilateral Development Banks (MDBs) 187,500 345,000 1,745,625 1,768,165 3,768,750 7,815,040
Public Sector Entities (PSEs) 53,097 47,524 1,018 12,051 26 5,908 119,624
Banks and securities firms 7,934,630 1,213,711 2,509,121 4,839,716 6,760,879 4,574,164 3,940,030 2,843,054 34,615,305
Corporates 8,708,094 9,609,213 24,651,932 21,763,703 15,046,966 33,947,632 18,071,620 69,020,223 200,819,383
Retail non-mortgages 4,865,152 2,287,989 5,024,970 7,184,851 10,054,892 26,418,257 14,342,731 2,048,448 72,227,289
Small Business Facilities Enterprises (SBFE's)
446,193 330,227 1,005,251 1,757,432 2,204,293 2,220,179 471,377 440,629 8,875,582
Mortgages 174,006 190,809 656,365 1,263,938 2,152,714 6,077,519 4,886,942 11,011,240 26,413,533
Residential 94,719 94,939 261,502 520,986 999,737 2,890,806 2,774,101 9,386,193 17,022,982
Commercial 79,287 95,870 394,864 742,952 1,152,977 3,186,713 2,112,841 1,625,047 9,390,551
Securitized assets 53,324 542,625 7,526,570 8,122,520
Equity 1,443,774 1,443,774
Others 11,396,559 3,336 4,545 16,835 727,356 123,132 10,658,545 22,930,309
Total 45,228,589 16,305,643 40,752,875 48,084,610 48,896,030 78,100,011 51,045,283 148,738,977 477,152,019

Qualitative and Quantitative Pillar 3 Disclosures
As at 31 December 2014
20
4.4 Internal methodologies for calculating economic capital requirements
The Bank's credit risk rating framework incorporates probability of default (‘PD’) of an obligor and loss severity expressed in terms of exposure-
at-default (‘EAD’) and loss-given-default (’LGD’). These measures are used to calculate expected loss and capital requirements.
For Corporate business, obligor PD is estimated using a 16-grade Customer Risk Rating scale for performing customers. These grades represent
varying degrees of strength of financial condition and qualitative factors. The Customer Risk Ratings are mapped to a PD value range.
For retail business, the portfolios are analyzed by pools and models are available to provide PD and LGD estimates based on historical
experience.
4.5 Credit risk management policy, past due and impaired, specific and general allowances
A discussion on the bank's credit risk management policy is included in note 31 of the Audited Financial Statements for the year ended 31
December 2014.
The bank considers all the facilities for a counterparty to be defaulted if any one of the facilities of the counterparty is past due more than 90
days.
The approaches followed for specific and general allowances (collective allowances) are explained in note 2.5 of the Audited Financial
Statements for the year ended 31 December 2014.

Qualitative and Quantitative Pillar 3 Disclosures
As at 31 December 2014
21
Following table gives an industry sector breakdown of impaired and past due loans and related allowances as of 31st December 2014.
CREDIT RISK (SAMA reference table 4)
Impaired Loans, Past Due Loans and Allowances (Table 4, (f))
Industry sector Impaired loans
(SR '000)
Defaulted (SR '000)
Aging of Past Due Loans (days) (SR '000) Specific allowances (SR '000) General allowances (SR '000)
Less than 90
90-180 180-360 Over 360 Charges during the
period
Charge-offs
during the period
Balance at the end of the period
Government and quasi government
- - - - - - - - - -
Banks and other financial institutions
3,211 3,211 2,487 1,424 64 1,723 (879) (4) 2,997 -
Agriculture and fishing
25,776 25,776 25,058 11,432 511 13,832 8,575 (2,632) 17,846 -
Manufacturing 484,610 484,610 426,886 109,319 4,671 370,619 123,787 (48,942) 421,329 -
Mining and quarrying 5,265 5,265 25,908 2,335 104 2,825 2,597 (1,602) 2,739 -
Electricity, water, gas and health services
8,531 8,531 54,389 2,702 2,561 3,269 3,513 - 7,875 -
Building and construction
559,573 559,573 441,124 82,490 33,157 443,926 (12,593) (15,001) 512,413 -
Commerce 1,044,017 1,044,017 741,791 296,178 65,403 682,435 407,485 (547,912) 936,016 -
Transportation and communication
42,951 42,951 60,081 4,388 196 38,367 19,365 (5,010) 38,070 -
Services 37,146 37,146 343,518 16,475 737 19,933 (7,399) - 32,769 -
Consumer loans and credit cards
549,360 549,360 3,357,617 446,975 50,342 52,045 955,371 (937,467) 346,984 -
Others 90,816 90,816 - 15,353 687 74,776 21,545 (19,959) 57,728 -
Total 2,851,256 2,851,256 5,478,860 989,072 158,433 1,703,750 1,521,367 (1,578,529) 2,376,766 2,755,499

Qualitative and Quantitative Pillar 3 Disclosures
As at 31 December 2014
22
Following table gives a geographic breakdown of impaired and past due loans and related allowances as of 31st December 2014.
CREDIT RISK (SAMA reference table 4)
Impaired Loans, Past Due Loans And Allowances (Table 4, (g))
Geographic area
(SR '000)
Impaired loans
(SR '000)
Aging of Past Due Loans (days) (SR '000) Specific allowances (SR '000)
General allowances (SR '000)
Less than 90 90-180 180-360 Over 360
Saudi Arabia 1,889,278 3,915,757 562,404 139,352 1,187,522 1,682,341 2,559,051
Other GCC & Middle East
Turkey 961,978 1,563,103 426,668 19,081 516,228 694,425 196,448
Others Countries
Total 2,851,256 5,478,860 989,072 158,433 1,703,750 2,376,766 2,755,499
Qualitative and Quantitative Pillar 3 Disclosures
As at 31 December 2014
23
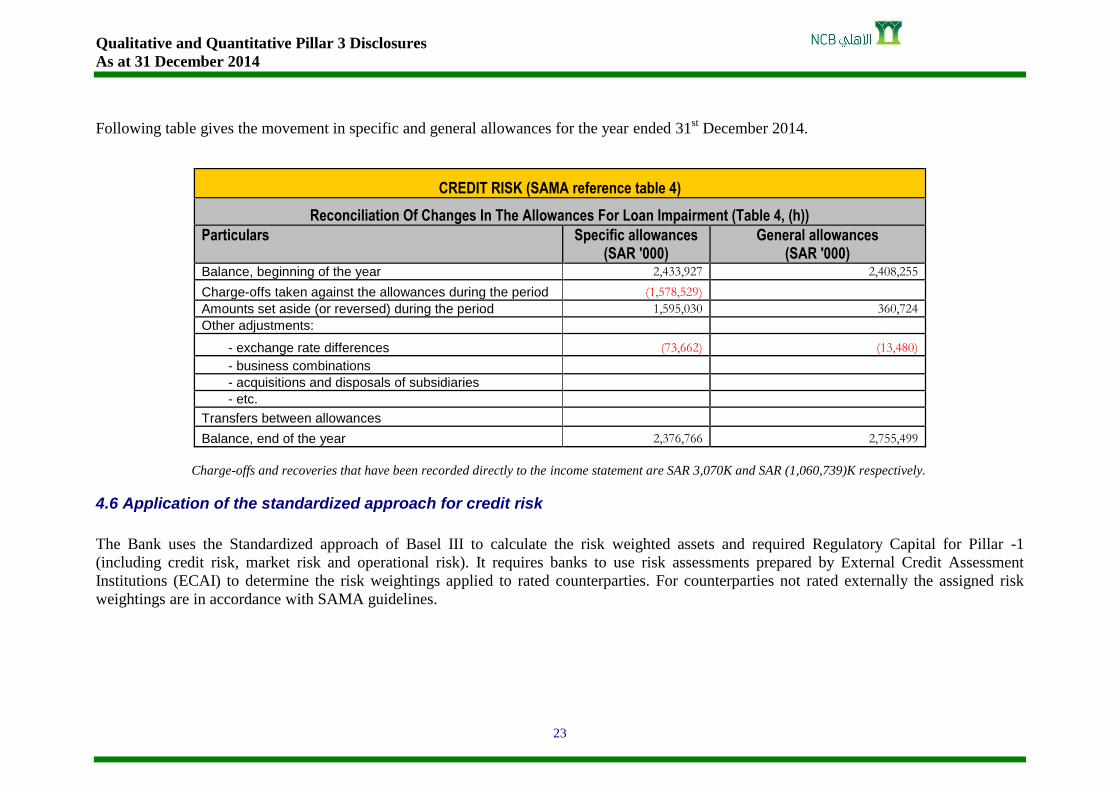
Following table gives the movement in specific and general allowances for the year ended 31st December 2014.
CREDIT RISK (SAMA reference table 4)
Reconciliation Of Changes In The Allowances For Loan Impairment (Table 4, (h))
Particulars Specific allowances (SAR '000)
General allowances (SAR '000)
Balance, beginning of the year 2,433,927 2,408,255
Charge-offs taken against the allowances during the period (1,578,529)
Amounts set aside (or reversed) during the period 1,595,030 360,724
Other adjustments:
- exchange rate differences (73,662) (13,480)
- business combinations
- acquisitions and disposals of subsidiaries
- etc.
Transfers between allowances
Balance, end of the year 2,376,766 2,755,499
Charge-offs and recoveries that have been recorded directly to the income statement are SAR 3,070K and SAR (1,060,739)K respectively.
4.6 Application of the standardized approach for credit risk
The Bank uses the Standardized approach of Basel III to calculate the risk weighted assets and required Regulatory Capital for Pillar -1
(including credit risk, market risk and operational risk). It requires banks to use risk assessments prepared by External Credit Assessment
Institutions (ECAI) to determine the risk weightings applied to rated counterparties. For counterparties not rated externally the assigned risk
weightings are in accordance with SAMA guidelines.
Qualitative and Quantitative Pillar 3 Disclosures
As at 31 December 2014
24
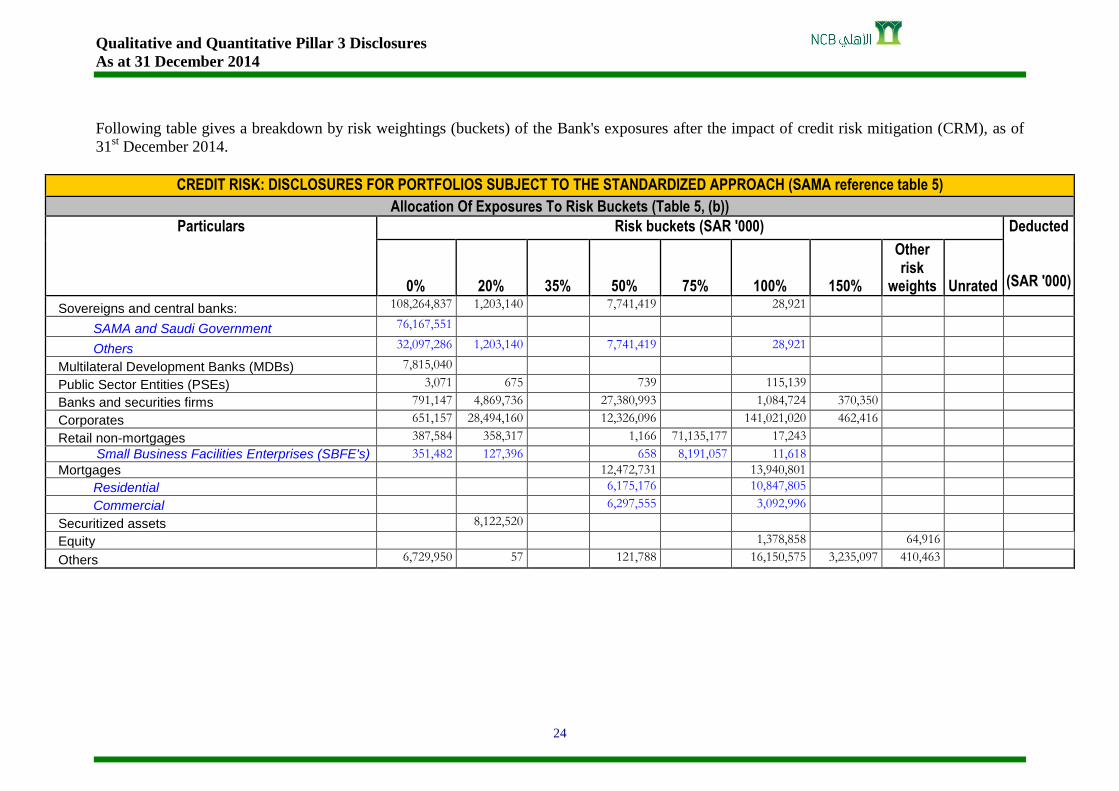
Following table gives a breakdown by risk weightings (buckets) of the Bank's exposures after the impact of credit risk mitigation (CRM), as of
31st December 2014.
CREDIT RISK: DISCLOSURES FOR PORTFOLIOS SUBJECT TO THE STANDARDIZED APPROACH (SAMA reference table 5)
Allocation Of Exposures To Risk Buckets (Table 5, (b))
Particulars Risk buckets (SAR '000) Deducted
(SAR '000) 0% 20% 35% 50% 75% 100% 150%
Other risk
weights Unrated
Sovereigns and central banks: 108,264,837 1,203,140 7,741,419 28,921
SAMA and Saudi Government 76,167,551
Others 32,097,286 1,203,140 7,741,419 28,921
Multilateral Development Banks (MDBs) 7,815,040
Public Sector Entities (PSEs) 3,071 675 739 115,139
Banks and securities firms 791,147 4,869,736 27,380,993 1,084,724 370,350
Corporates 651,157 28,494,160 12,326,096 141,021,020 462,416
Retail non-mortgages 387,584 358,317 1,166 71,135,177 17,243
Small Business Facilities Enterprises (SBFE's) 351,482 127,396 658 8,191,057 11,618
Mortgages 12,472,731 13,940,801
Residential 6,175,176 10,847,805
Commercial 6,297,555 3,092,996
Securitized assets 8,122,520
Equity 1,378,858 64,916
Others 6,729,950 57 121,788 16,150,575 3,235,097 410,463

Qualitative and Quantitative Pillar 3 Disclosures
As at 31 December 2014
25
4.7 Credit Risk Mitigation
Risk mitigation is an important aspect of the Bank's effective credit risk management and it takes many forms.
The Bank in the ordinary course of lending activities holds collaterals as security to mitigate credit risk in the financing and advances. The
collaterals are held mainly against commercial and individual loans and are managed against relevant exposures at their net realizable values.
The Bank monitors the market value of collateral obtained periodically and requests additional collateral in accordance with the terms of the
underlying agreements.
These collaterals mostly include time and other cash deposits, financial guarantees from other banks, local and international equities, real estate
and other fixed assets
The Bank’s policy is set out in note 31 of the Audited Financial Statements for the year ended 31 December 2014.
In terms of the regulatory guidelines, not all forms of collateral currently used by the Bank are recognized for the purposes of the calculation of
the credit risk capital requirement. The bank uses the Basel III 'comprehensive method' for the treatment of financial collaterals which requires a
standard supervisory haircut to be applied to the collateral to account for currency and maturity mismatches between the underlying exposure
and the collateral applied.
Eligible financial collaterals under the Standardised Approach as per SAMA guidelines is restricted to:
a. Cash (as well as certificates of deposit or comparable instruments);
b. Gold; and
c. Debt Securities
Non-financial collaterals mainly include guarantees.
Qualitative and Quantitative Pillar 3 Disclosures
As at 31 December 2014
26
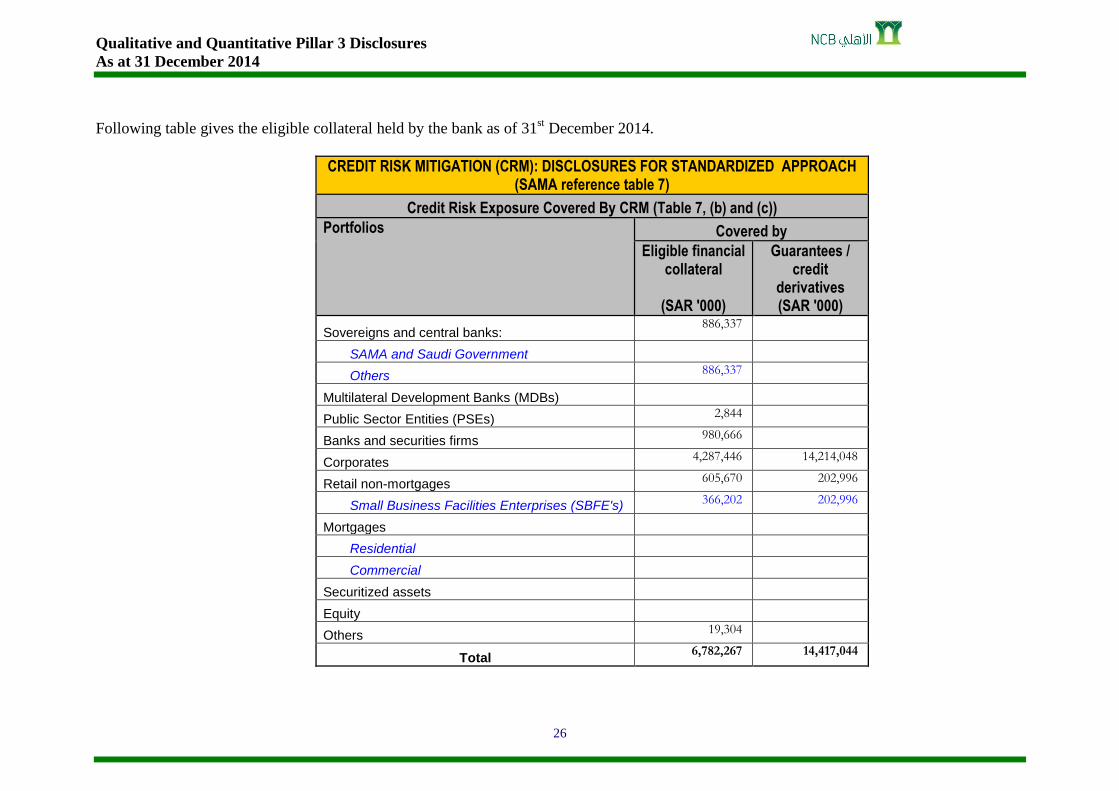
Following table gives the eligible collateral held by the bank as of 31st December 2014.
CREDIT RISK MITIGATION (CRM): DISCLOSURES FOR STANDARDIZED APPROACH (SAMA reference table 7)
Credit Risk Exposure Covered By CRM (Table 7, (b) and (c))
Portfolios Covered by
Eligible financial collateral
(SAR '000)
Guarantees / credit
derivatives (SAR '000)
Sovereigns and central banks: 886,337
SAMA and Saudi Government
Others 886,337
Multilateral Development Banks (MDBs)
Public Sector Entities (PSEs) 2,844
Banks and securities firms 980,666
Corporates 4,287,446 14,214,048
Retail non-mortgages 605,670 202,996
Small Business Facilities Enterprises (SBFE's) 366,202 202,996
Mortgages
Residential
Commercial
Securitized assets
Equity
Others 19,304
Total 6,782,267 14,417,044

Qualitative and Quantitative Pillar 3 Disclosures
As at 31 December 2014
27
4.8 Use of External Credit Assessment Institutions (ECAIs)
The Bank uses the following External Credit Assessment Institutions (ECAIs)
i) Standards and Poor's Rating Group
ii) Moody's Investor Service
iii) Fitch Group
External Credit Assessment Institutions risk assessments are used by the Bank as part of the determination of risk weightings for the following
classes of exposure:
• Sovereign and Central Banks;
• Banks and Securities Firms; and
• Corporates.
The process used to transfer credit assessment ratings to the banks’ counterparties is as follows. A data file containing external ratings is
downloaded from a specialist third party supplier (Bloomberg). The rating records from the External Credit Assessment Institutions specified
above are then linked with the Bank's counterparty records. As the majority of the bank's corporate borrowers are not rated by external agencies,
for regulatory capital calculations under the Basel III 'Standardised Approach' these are treated as 'unrated' exposures. The use of external ratings
within the Corporate exposure class mainly relates to its investments in corporate bonds.
The alignment of the alphanumerical scale of agencies used with risk buckets is based on the guidance issued by SAMA.
4.9 Exposure related to counterparty credit risk
Economic and Regulatory Capital is calculated for counterparty credit exposures on the Bank's derivatives portfolio using the 'Current Exposure
Method' within the Basel III Standardised Approach. Limits for corporate and banking counterparty credit exposures including derivatives are
approved by the relevant authority. Risk Group of the Bank is responsible for monitoring adherence to these limits on a daily basis.

Qualitative and Quantitative Pillar 3 Disclosures
As at 31 December 2014
28
Following table gives the exposures to counterparty credit risk for derivatives as of 31st of December 2014.
GENERAL DISCLOSURES FOR EXPOSURES RELATED TO COUNTERPARTY CREDIT RISK (CCR) (SAMA reference table 8)
General Disclosures (Table 8, (b) and (d))
Particulars Amount (SAR '000)
Gross positive fair value of contracts 1,039,048 Netting Benefits
Netted Current Credit Exposure*
Collateral held:
-Cash
-Government securities
-Others
Exposure amount (under the applicable method) 2,872,287 -Current Exposure Method (CEM) 2,872,287
Notional value of credit derivative hedges
Current credit exposure (by type of credit exposure): 2,872,287
-Interest rate contracts 456,967
-FX contracts 2,415,319
-Equity contracts
-Credit derivatives
-Commodity/other contracts * Currently, netting for credit exposure measurement purposes not permitted in KSA.
Qualitative and Quantitative Pillar 3 Disclosures
As at 31 December 2014
29
Specific wrong-way risk arises, if future exposure to a specific counterparty is expected to be high when the counterparty’s probability of default
is also high. The Bank’s Treasury Products Approval Committee (TPAC) approves all new products. As part of its approval process the TPAC
ensures that any new treasury product will not result in specific wrong-way risk.
The Bank usually does not take collateral nor is it required to provide collateral in connection with its over-the-counter derivatives activity.
Credit reserves are created in accordance with impairment of financial assets policy stated in note 3.14 of the Audited Financial Statements for
the year ended 31 December 2014.
4.10 Securitization
The Bank is not involved in any securitization activities which transfer credit risk away from the Bank to other entities.
Qualitative and Quantitative Pillar 3 Disclosures
As at 31 December 2014
30
5.0 Market Risk
Market risk is the risk that changes in market prices, such as special commission rate, credit spreads (not relating to changes in the obligor's /
issuer's credit standing), equity prices and foreign exchange rates, will affect the Bank's income or the value of its holdings of financial
instruments.
For risk capital computations, the Bank separates its exposure to market risk between trading and banking books. Trading book is mainly held by
the Treasury division and includes positions arising from market making and proprietary position taking, together with financial assets and
liabilities that are managed on a fair value basis.
5.1 Strategies
The objective of market risk management is to manage and control market risk exposures within acceptable parameters.
5.2 Organization Structure
Overall authority for market risk is vested in the Board of Directors. Risk Group is responsible for the development of detailed risk management
policies (subject to review and approval by the Board of Directors) and for the day-to-day review of their implementation.
The Group has an independent market risk management and control function which is responsible for measuring, monitoring and reporting
market risk exposures according to defined policies and limits on a regular basis.
5.3 Risk reporting and monitoring
The Bank uses tools such as Value-at-Risk (VaR) and other measures to monitor and limit market risk exposures. The scope and nature of risk
reporting and measurement systems used are explained in detail in note 32 of the Audited Financial Statements for the year ended 31 December
2014.

Qualitative and Quantitative Pillar 3 Disclosures
As at 31 December 2014
31
Stress testing
As VaR is a measure based on historical volatilities and correlations, which may break down during stressed market conditions, the Bank also
performs stress testing to evaluate the potential impact on portfolio values of more extreme, although plausible, events or movements in a set of
financial variables. Consideration is given to the actual market risk exposures, along with market events, in determining the stress scenarios.
Stress testing is performed by the Risk Group at a portfolio level, based on historical and stressed scenarios which are regularly reviewed and
updated. The stress testing results are regularly reported to the Senior Management and the Risk Management Committee of the Board and
provide them with an assessment of the financial impact such events would have on the capital and profitability of the Group.
5.4 Risk Mitigation – Hedging
The Bank's hedging and risk mitigation strategies primarily comprise the use of traditional market instruments, such as swaps and cash
instruments, to address risk factors arising at portfolio level. The Market Risk Management function is responsible for monitoring the continuing
effectiveness of the hedges.
5.5 Internal methodologies for calculating economic capital requirements
The main principal tool used by the Bank to calculate Economic Capital requirements for market risk is Value at Risk (VaR). The key
assumptions used in the VaR model are explained in note 32.1 of the Audited Financial Statements for the year ended 31 December 2014.

Qualitative and Quantitative Pillar 3 Disclosures
As at 31 December 2014
32
5.6 Application of the standardized approach for market risk
The Bank uses the Standardized approach of Basel III to calculate the required Regulatory Capital for market risk which covers general market
and specific risks. Brief descriptions of the risk items covered by market risk are given below:
a. Interest rate risk is the impact on Bank’s earnings and equity of changes in interest rates; the risk is two-fold:
• Specific Risk: risk of loss caused by an adverse price movement of a debt instrument or security due principally to factors related
to the issuer.
• General Market Risk: risk of loss arising from adverse changes in market conditions.
b. Equity risk is the risk that the Bank’s investments will depreciate due to equity market dynamics.
c. Foreign exchange risk is the risk arising from a change in exchange-rates on the Bank net asset / liability positions.
d. Commodity risk refers to the uncertainties of future market values and of the size of the future income, caused by the fluctuation in the
prices of commodities.
The primary market risks to which the Bank is exposed are foreign exchange risk and interest rate risk associated with its trading book that is
marked-to-market daily (mainly derivatives).
Following table gives the capital requirement for market risk as of 31st of December 2014.
CAPITAL ADEQUACY – Market Risk (SAMA reference table 3)
Capital Requirements For Market Risk (822, Table 3, (d) & Table 10, (b))
Interest rate risk
(SAR '000)
Equity position risk (SAR '000)
Foreign exchange risk
(SAR '000)
Commodity risk
(SAR '000)
Total
(SAR '000)
Standardized approach 370,663 - 322,674 - 693,338

Qualitative and Quantitative Pillar 3 Disclosures
As at 31 December 2014
33
6.0 Operational risk
The Bank defines operational risk as the risk of loss resulting from inadequate or failed processes, people, systems or external events.
Operational risks are inherent in the Bank’s operations and are typical of all banking and financial institutions. Operational risk management is a
primary duty of the business units.
The operational risk management function is established as a department of the Risk Group that primarily coordinates the implementation and
maintenance of the framework.
The Operational risk strategy for managing the effectiveness of the operational risk framework is as follows:
Proactive approach through Risk & Control Self-Assessment process.
Reactive approach through Loss & Events Data Collection, and Analysis.
Maintaining culture and awareness programs.
Introducing comprehensive monitoring and reporting tools.
Developing supportive practices for managing Operational Risk exposures.
6.1 Operational Risk Framework
The main elements comprising the operational risk framework are:
- Governance
- Loss data collection
- Risk and control self-assessment
- Key risk indicators
- Stress testing & scenario analysis
- Monitoring and reporting
Qualitative and Quantitative Pillar 3 Disclosures
As at 31 December 2014
34
6.2 Operational Risk Assessment
6.2.1 Governance
The Board of Directors approves, monitors and reviews the operational risk appetite, framework, policies and practices; ensuring proper
developing, implementing and maintaining a framework that is fully integrated into the bank’s overall risk management processes.
Business Group Heads are actively involved in evaluating exposure to operational risks associated with their business through the Operational
Risk Committee. A network of Divisional Operational Risk Managers (DORMs) within the business units assists management with the
monitoring and mitigation of operational risks. Material operational risks are addressed to the senior management of the individual business
units, escalated to the Operational Risk department and to the Operational Risk Committee -when necessary.
6.2.2 System and Loss Data Collection
The SAS Operational Risk Monitor is being used for collecting operational risk losses that occurs within the bank. The tool is considered to be
the industry’s prime tool for operational risk losses collection. From this system, NCB is able to record and consider major operational
risks/incidents and effectively determine the appropriate measures to mitigate and manage the exposure to these risks. Recorded events are
rigorously monitored and analyzed for further escalation. As a result, a comprehensive loss data collection for managing, tracking and reporting
of risk information is effectively in place.
Qualitative and Quantitative Pillar 3 Disclosures
As at 31 December 2014
35
6.2.3 Risk and Control Self-Assessment [RCSA]
A qualitative and quantitative risk assessment is conducted within NCB using an identified universe of operational risks contained in the Risk &
Control Self-Assessment Framework (RCSA). The assessment of risks and controls is conducted at the business unit level and is subject to
treatment and escalation to Group Heads, which sets out the operational risk exposure that NCB is willing to tolerate. In 2014, the Operational
Risk department continued conducting the RCSA exercise across NCB covering core and support function divisions in order to ensure active
comprehensive operational risk register for NCB is being held.
6.2.4 High level of awareness culture across NCB
Operational risk management continue the training programs (Internal and External) and encourage the participation of all staff mainly those
with functions that are assigned with roles and responsibilities that oversee operational risks within their respective areas. Operational Risk
Awareness sessions were delivered to officers across the Kingdom regions.
6.2.5 Key Risk Indicator [KRI]
To ensure that NCB is compliant with Basel III requirements, the Operational Risk department uses its risk management and control system to
provide a reliable and effective reporting mechanism. Key Risk Indicators (KRIs) are used as a monitoring tool to provide early warnings of
operational problems or highlight failures. KRI reports that are generated by the businesses are reviewed on a quarterly basis and monitored by
the Operational Risk department for effective management.
Qualitative and Quantitative Pillar 3 Disclosures
As at 31 December 2014
36
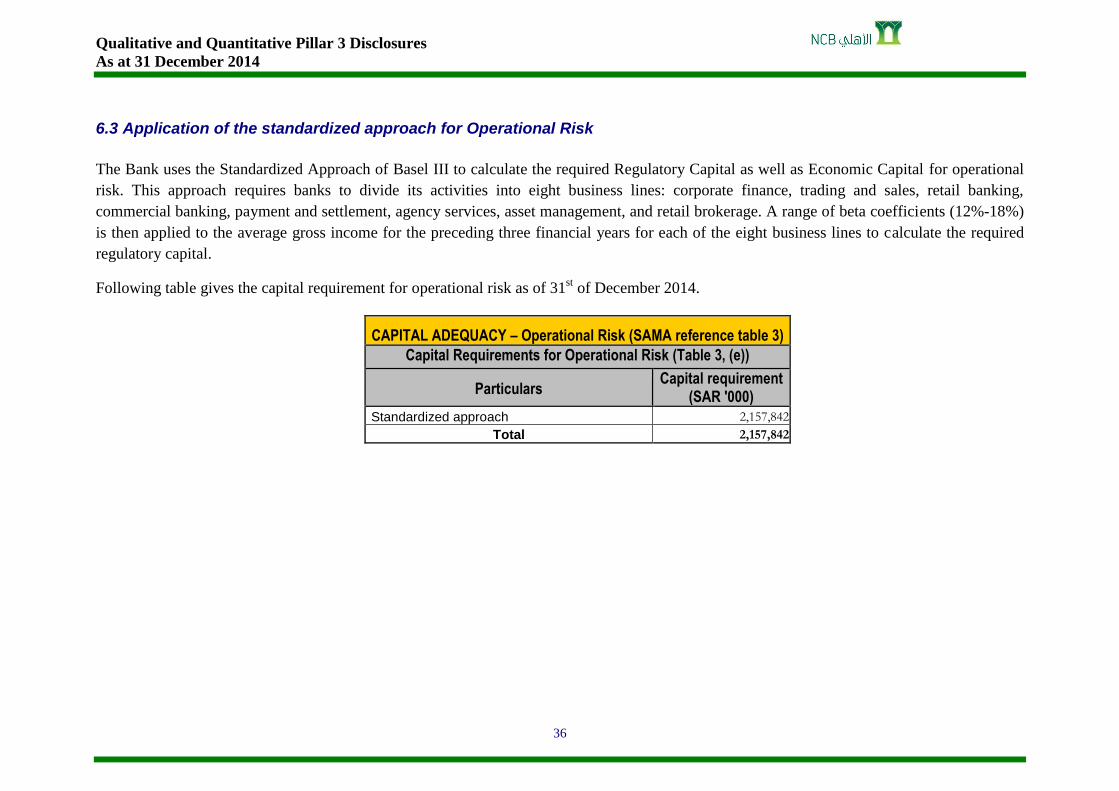
6.3 Application of the standardized approach for Operational Risk
The Bank uses the Standardized Approach of Basel III to calculate the required Regulatory Capital as well as Economic Capital for operational
risk. This approach requires banks to divide its activities into eight business lines: corporate finance, trading and sales, retail banking,
commercial banking, payment and settlement, agency services, asset management, and retail brokerage. A range of beta coefficients (12%-18%)
is then applied to the average gross income for the preceding three financial years for each of the eight business lines to calculate the required
regulatory capital.
Following table gives the capital requirement for operational risk as of 31st of December 2014.
CAPITAL ADEQUACY – Operational Risk (SAMA reference table 3)
Capital Requirements for Operational Risk (Table 3, (e))
Particulars Capital requirement
(SAR '000)
Standardized approach 2,157,842
Total 2,157,842

Qualitative and Quantitative Pillar 3 Disclosures
As at 31 December 2014
37
7.0 Equities in Banking Book
The Bank's equity investments are intended to be held for an unspecified period of time, and may be sold in response to the Bank's needs.
Quoted equity investments are valued based on market prices whereas unquoted equity investments are carried at cost. Impairment allowances, if
required, are created in accordance with the accounting policies mentioned in note 3.14 of the Audited Financial Statements for the year ended
31 December 2014.The Bank does not actively trade these investments.
Following table gives the value of equity investments as of 31st of December 2014.
EQUITIES: DISCLOSURES FOR BANKING BOOK POSITIONS (SAMA reference table 13)
Value Of Investments (Table 13, (b))
Un-quoted investments Quoted investments
Value disclosed in Financial Statements
(SAR '000)
Fair value
(SAR '000)
Value disclosed in Financial Statements
(SAR '000)
Fair value
(SAR '000)
Publicly quoted share values (if materially different
from fair value) (SAR '000)
Investments 456,410 N/A 1,140,746 1,140,746
Qualitative and Quantitative Pillar 3 Disclosures
As at 31 December 2014
38
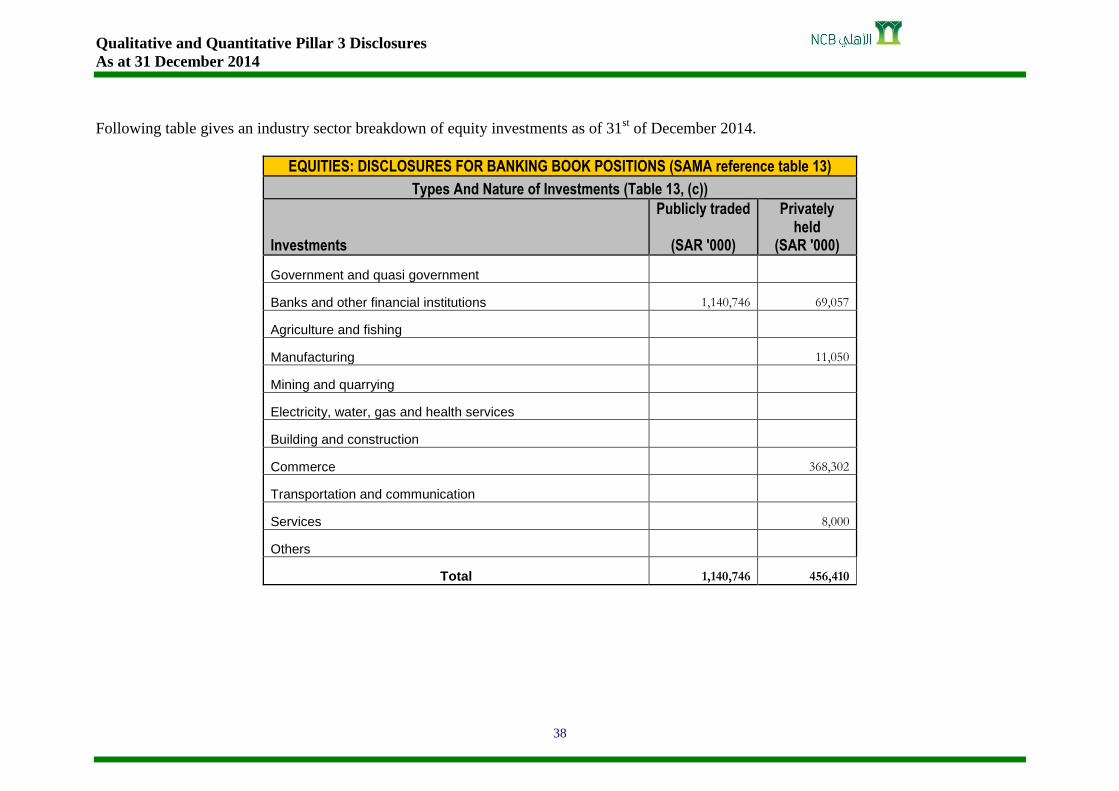
Following table gives an industry sector breakdown of equity investments as of 31st of December 2014.
EQUITIES: DISCLOSURES FOR BANKING BOOK POSITIONS (SAMA reference table 13)
Types And Nature of Investments (Table 13, (c))
Investments
Publicly traded
(SAR '000)
Privately held
(SAR '000)
Government and quasi government
Banks and other financial institutions 1,140,746 69,057
Agriculture and fishing
Manufacturing 11,050
Mining and quarrying
Electricity, water, gas and health services
Building and construction
Commerce 368,302
Transportation and communication
Services 8,000
Others
Total 1,140,746 456,410

Qualitative and Quantitative Pillar 3 Disclosures
As at 31 December 2014
39
Following table gives the realized and unrealized gains on equity investments as of 31st of December 2014.
EQUITIES: DISCLOSURES FOR BANKING BOOK POSITIONS (SAMA reference table 13)
Gains / Losses Etc. (Table 13, (d) and (e))
Particulars Amount (SAR '000)
Cumulative realized gains (losses) arising from sales and liquidations in the reporting period 411,849
Total unrealized gains (losses) 987,364
Total latent revaluation gains (losses)
Unrealized gains (losses) included in Capital 987,364
Latent revaluation gains (losses) included in Capital
Qualitative and Quantitative Pillar 3 Disclosures
As at 31 December 2014
40
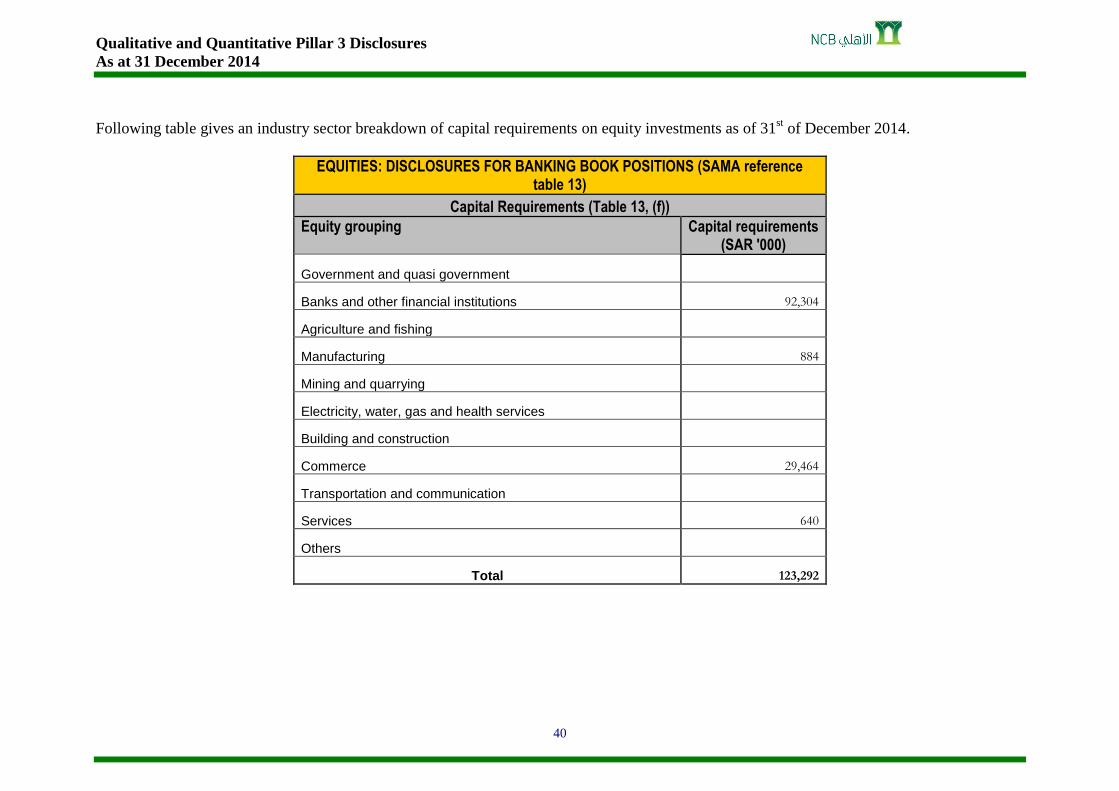
Following table gives an industry sector breakdown of capital requirements on equity investments as of 31st of December 2014.
EQUITIES: DISCLOSURES FOR BANKING BOOK POSITIONS (SAMA reference table 13)
Capital Requirements (Table 13, (f))
Equity grouping Capital requirements (SAR '000)
Government and quasi government
Banks and other financial institutions 92,304
Agriculture and fishing
Manufacturing 884
Mining and quarrying
Electricity, water, gas and health services
Building and construction
Commerce 29,464
Transportation and communication
Services 640
Others
Total 123,292
Qualitative and Quantitative Pillar 3 Disclosures
As at 31 December 2014
41
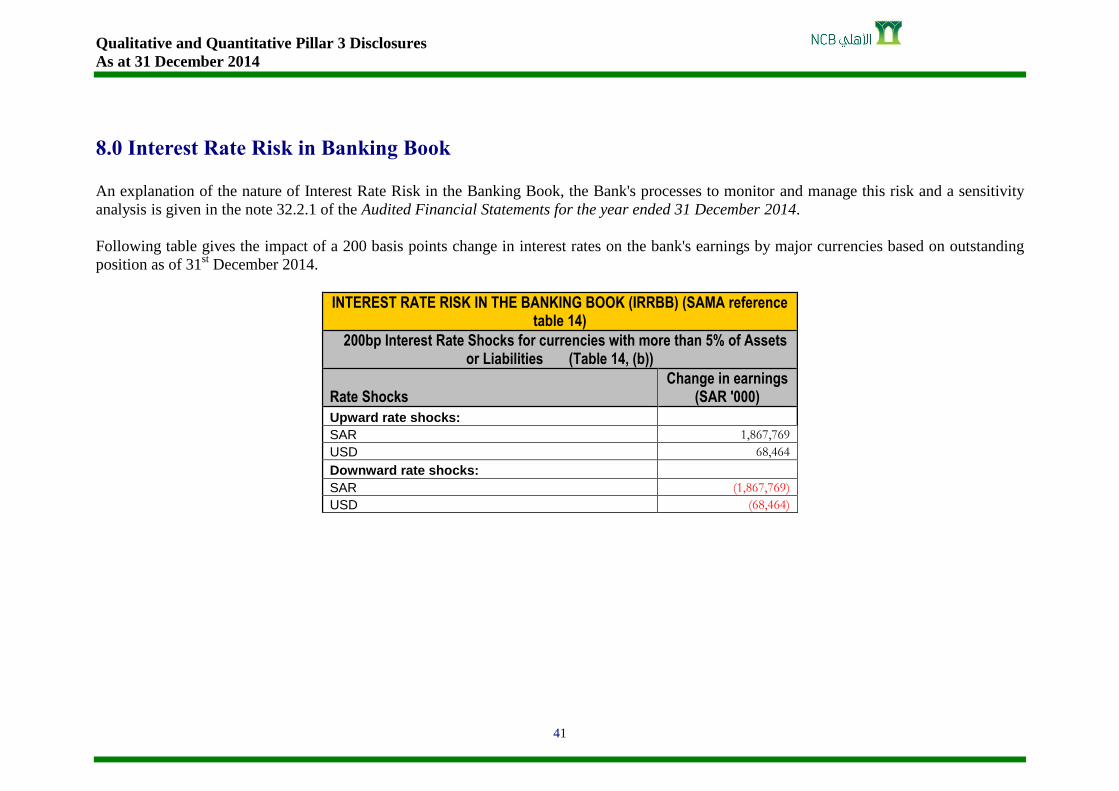
8.0 Interest Rate Risk in Banking Book
An explanation of the nature of Interest Rate Risk in the Banking Book, the Bank's processes to monitor and manage this risk and a sensitivity
analysis is given in the note 32.2.1 of the Audited Financial Statements for the year ended 31 December 2014.
Following table gives the impact of a 200 basis points change in interest rates on the bank's earnings by major currencies based on outstanding
position as of 31st December 2014.
INTEREST RATE RISK IN THE BANKING BOOK (IRRBB) (SAMA reference table 14)
200bp Interest Rate Shocks for currencies with more than 5% of Assets or Liabilities (Table 14, (b))
Rate Shocks Change in earnings
(SAR '000)
Upward rate shocks:
SAR 1,867,769 USD 68,464
Downward rate shocks:
SAR (1,867,769) USD (68,464)

Qualitative and Quantitative Pillar 3 Disclosures
As at 31 December 2014
42
Summary of Pillar 3 Qualitative disclosure requirements.
Reference Description Section Page Table 1 Scope of Application 1.0 1
Table 2 Capital Structure 2.0 4
Table 3 Capital Adequacy 3.0 9
Risk Exposure and Assessment
General Qualitative Disclosure Requirements 4.1 – 4.5, 5.1 – 5.5, 6.1 – 6.2, 7.0 & 8.0
15-23 30-31 33-35 37-41
Risk Exposure and Assessment
Credit Risk 4.3, 4.4& 4.6 16, 20, 23
Table 4 Credit Risk: General Disclosures for All Banks 4.5 20
Table 5 Credit Risk: Disclosures for Portfolios Subject to the Standardized Approach and Supervisory Risk Weights in the IRB Approaches
4.8 27
Table 6 Credit Risk: Disclosures for Portfolios Subject to IRB Approaches Not Applicable
Table 7 Credit Risk Mitigation : Disclosures for Standardized and IRB Approaches 4.7 25
Table 8 General Disclosure for Exposure Related To Counterparty Credit Risk 4.9 27
Table 9 Securitization : Disclosure For Standardized and IRB Approaches 4.10 29
Table 10 Market Risk : Disclosure For Banks Using the Standardized Approaches 5.6 32
Table 11 Market Risk : Disclosures For Banks Using the Internal Models Approach (IMA) for Trading Portfolios
Not Applicable
Table 12 Operational Risk 6.1 – 6.3 33-36
Table 13 Equities : Disclosures for Banking Book Positions 7.0 37-40
Table 14 Interest Rate Risk in the Banking Book (IRRBB) 8.0 41

Qualitative and Quantitative Pillar 3 Disclosures
As at 31 December 2014
43
Summary of Pillar 3 Quantitative disclosure requirements.
Reference Description Section Page Table 1, (e) Capital Deficiencies (for subsidiaries not consolidated) 1.2 1
Table 2, (b) Capital Structure 2.0 5
Table 2, (c) Capital Structure 2.0 6
Table 2, (d) i Capital Structure 2.0 7
Table 2, (d) ii Capital Structure 2.0 8
Table 2, (e) Capital Structure 2.0 9-10
Table 3, (b) Amount of Exposures Subject to Standardized Approach of Credit Risk and related Capital Requirements
4.0 13
Table 3, (d) Capital Requirements for Market Risk 5.6 32
Table 3, (e) Capital Requirements for Operational Risk 6.3 36
Table 3, (f) Capital Adequacy Ratio 3.0 12
Table 4, (b) Credit Risk Exposures - Standardized Approach (STA) 4.0 14
Table 4, (c) Geographical Breakdown – STA 4.3 17
Table 4, (d) Industry Sector Breakdown – STA 4.3 18
Table 4, (e) Residual Contractual Maturity Breakdown – STA 4.3 19
Table 4, (f) Impaired Loans, Past Due Loans and Allowances – STA (Industry Sector) 4.5 21
Table 4, (g) Impaired Loans, Past Due Loans and Allowances – STA (Geographical) 4.5 22
Table 4, (h) Reconciliation of Changes in the Allowances for Loan Impairment 4.5 23
Table 5, (b) Allocation of Exposures to Risk Buckets - STA 4.6 24
Table 7, (b) and (c) Credit Risk Exposures Covered by CRM (Collateral) - STA 4.7 26
Table 8, (b) and (d) General Disclosures (for exposure related to counterparty credit risk) 4.9 28
Table 10, (b) Level of Market Risk in Terms of Capital Requirements 5.6 32
Table 13, (b) Equities : Value of Investments 7.0 37
Table 13, (c) Equities : Types and Nature of Investments 7.0 38
Table 13, (d) and (e) Equities : Gains/Losses etc. 7.0 39
Table 13, (f) Equities : Capital Requirements 7.0 40
Table 14, (b) 200 bps Interest Rate Shocks for currencies with more than 5% of Assets or Liabilities 8.0 41