Embed Size (px)
Citation preview

Qualitative and Quantitative Methods for Isolationand Characterization of Lignin-Modifying EnzymesSecreted by Microorganisms
Ayyappa Kumar Sista Kameshwar1 & Wensheng Qin1
# Springer Science+Business Media New York 2016
Abstract Lignin is a polyphenolic biopolymer synthe-sized by plants, for providing strength and rigidity to theplant cellular structure. It is closely associated with otherplant polysaccharides in the cell wall such as celluloseand hemicellulose, constituting the most abundant bio-polymer on the earth’s surface. However, the completeutilization of it is being explored for the past few years.Various research groups around the world are trying toreplace conventional fuels with the second-generationbiofuels from lignocellulose. Several physical, chemical,and biological conversion methods have been developedfor the separation and utilization of this biomass, as aresult of which biological methods for lignocellulose con-version are considered to be cheap and environment-friendly. Microorganisms, especially fungi and bacteria,have been able to degrade the lignocellulose networkand convert it to commercially important biofuels by se-creting several intra- and extra-cellular enzymes. In thepast few years, research has been conducted to isolateefficient lignin-degrading microorganisms, as separationof lignin from cellulosic biomass is considered as a majorhurdle in biofuel and pulping industries. In this article, weextensively discuss different small- and large-scalemethods developed for the isolation and characterizationof lignin-degrading microorganisms. We have also com-prehensively discussed about the qualitative and quantita-tive methods for the identification and characterization ofthe lignin-degrading and lignin-degrading auxiliary
enzymes by comparing different methods based on theirefficiency. This review can be used as a primer for under-standing and selecting the most efficient method for iso-lation and characterization of lignin-degrading microor-ganisms and their enzymes.
Keywords Lignin . Cellulose . Biofuels . Plant biomass .
Lignin oxidizing enzymes . Auxiliary enzymes .
lignin-degradingmicroorganisms
Introduction
Forest biomass is one of the richest renewable resources on theearth’s surface, which has a great potential for biobased prod-ucts. These products can be produced by converting the majorcomponents of the plant cell wall such as cellulose, hemicel-lulose, pectin (carbohydrates), and lignin (polyphenolic) com-pounds. These components are usually present in inseparablecomplex networks, becoming highly abundant biopolymer.Lignin plays various roles in the plant development by pro-viding strength, rigidity, and defense against microbial infec-tions [1]. Compared to lignin, other plant biomass componentssuch as cellulose and hemicellulose have been highly exploredfor the production of paper and biofuels. Various researchgroups around the world have developed several methodsfor the separation and utilization of lignin from the lignocel-lulose network using chemical, mechanical, physical, and bi-ological methods. State of the art reviews on lignin valoriza-tion and pretreatment methods have been published in the lastfew years [2–4]. Compared to other methods, biologicalmethods are considered to be ecofriendly and cheap, as thesemethods does not involve high energy for the removal oflignin from the lignocellulosic biomass [2]. However, com-mercially valuable materials such as carbon fiber,
* Wensheng [email protected]
1 Department of Biology, Lakehead University, 955 Oliver Road,Thunder Bay, Ontario P7B 5E1, Canada
Bioenerg. Res.DOI 10.1007/s12155-016-9784-5
thermoplastic elastomers, engineering plastics, polymericfoams have been developed using chemical, physical, andmechanical methods [3, 4]. Microorganisms, especially fungibelonging to basidiomycetes phylum, have been able to de-grade lignin along with cellulose and hemicellulose. Thesebasidiomycetes fungi are divided into three classes (white,brown, and soft rot fungi), based on their wood-decaying pat-terns. Among these three classes of fungi, white rot fungi arehighly studied for their ability to degrade lignin effectively,whereas brown and soft rot fungi degrade cellulose and hemi-cellulose components of the plant biomass readily but canslowly decompose lignin. At the same time, studies have alsoreported that some bacteria are able to successfully breakdown the lignin [5]. Bacteria such as Streptomycesviridosporous T7A and soil bacteria such as Nocardia sp.,Rhodococcus sp., Pseudomonas putida mt-2, Rhodococcusjostii RHA1, and Sphingomonas paucimobilis SYK-6 wereshown to degrade lignin considerably [5]. In the main, thebacteria showing lignin-degrading ability belong to actinomy-cetes, α-proteobacteria, and γ-proteobacteria. However, theligninolytic ability of these bacteria is comparatively less thanthat of major white rot fungi such as Phanerochaetechrysosporium [5].
Two decades ago, the lignin-degrading ability of basidio-mycetes fungi was credited for the generation of reactive ox-ygen species. Later, this was correlated by production of
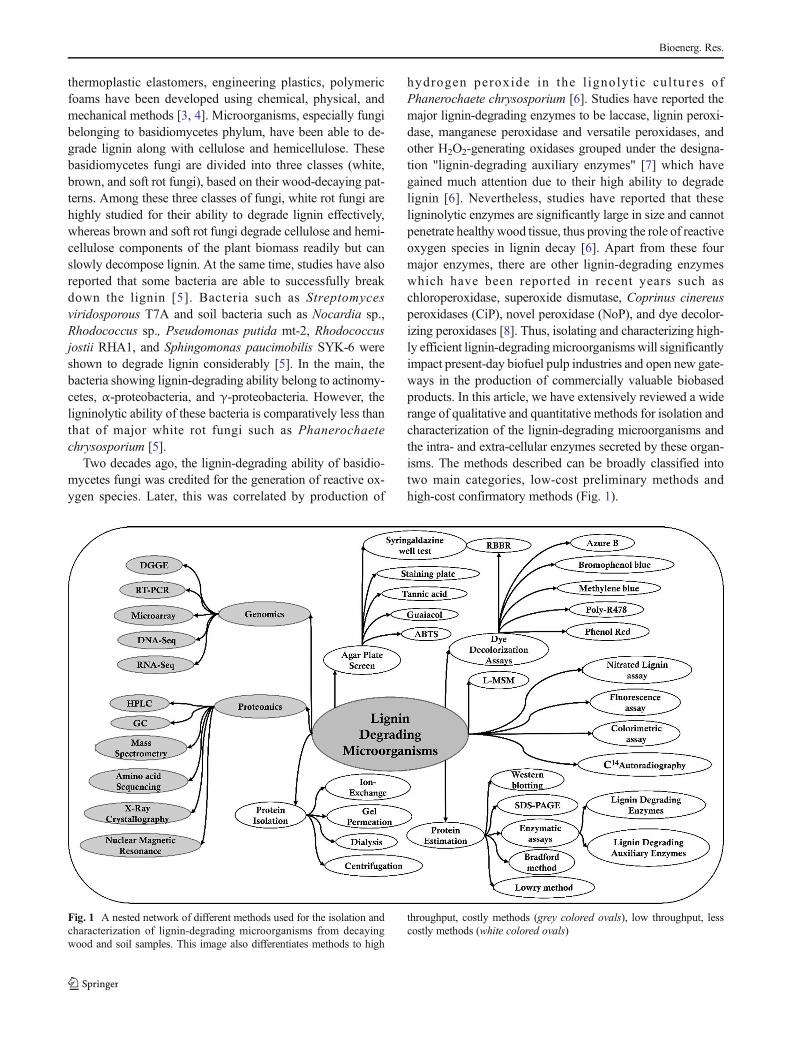
hydrogen peroxide in the l ignolyt ic cul tures ofPhanerochaete chrysosporium [6]. Studies have reported themajor lignin-degrading enzymes to be laccase, lignin peroxi-dase, manganese peroxidase and versatile peroxidases, andother H2O2-generating oxidases grouped under the designa-tion "lignin-degrading auxiliary enzymes" [7] which havegained much attention due to their high ability to degradelignin [6]. Nevertheless, studies have reported that theseligninolytic enzymes are significantly large in size and cannotpenetrate healthy wood tissue, thus proving the role of reactiveoxygen species in lignin decay [6]. Apart from these fourmajor enzymes, there are other lignin-degrading enzymeswhich have been reported in recent years such aschloroperoxidase, superoxide dismutase, Coprinus cinereusperoxidases (CiP), novel peroxidase (NoP), and dye decolor-izing peroxidases [8]. Thus, isolating and characterizing high-ly efficient lignin-degradingmicroorganisms will significantlyimpact present-day biofuel pulp industries and open new gate-ways in the production of commercially valuable biobasedproducts. In this article, we have extensively reviewed a widerange of qualitative and quantitative methods for isolation andcharacterization of the lignin-degrading microorganisms andthe intra- and extra-cellular enzymes secreted by these organ-isms. The methods described can be broadly classified intotwo main categories, low-cost preliminary methods andhigh-cost confirmatory methods (Fig. 1).
Fig. 1 A nested network of different methods used for the isolation andcharacterization of lignin-degrading microorganisms from decayingwood and soil samples. This image also differentiates methods to high
throughput, costly methods (grey colored ovals), low throughput, lesscostly methods (white colored ovals)
Bioenerg. Res.
Methods for Isolation and Characterizationof Lignin-Degrading Microorganisms
Lignin Minimal Salt Medium (L-MSM) Potential lignin-degrading microorganisms can be isolated using enrich-ment culture technique [9]. Lignin enrichment media con-sist (g/l) of Na2HPO4 (2.4), K2HPO4 (2.0), NH4NO3
(0.1), MgSO4 (0.01), CaCl2 (0.01) and lignin or kraft lig-nin (1.0) [10–12]. Kraft lignin is obtained as a result ofthe kraft pulping process, which is performed to separatecellulose and remove a sufficient amount of lignin fromthe given plant biomass [13]. The above-mentioned com-ponents are thoroughly mixed and autoclaved then furthertransferred either to flasks (for liquid media) or to plateswith agar (for solid media). According to Abhay et al.(2007), some bacterial strains cannot grow by using ligninor kraft lignin as a sole carbon source because of its highmolecular weight and limited degrading abilities. In suchsituations, nutrients of the growth media can be optimizedby providing 1.0 % glucose and 0.5 % peptone (w/v) inL-MSM broth or agar medium as subsidiary substrates[11]. L-MSM is an easy and low-cost method used forthe preliminary isolations of lignin-degrading microorgan-isms. However, the microorganisms must be characterizedfor their lignin-degrading ability using advanced or spe-cific methods, especially if the kraft lignin is used in thegrowth medium as it also contains some amounts of cel-lulose or hemicellulose which are easily degraded bymicroorganisms.
Dye Decolorization Method for Isolation Several studieshave reported that lignin-degrading enzymes show great abil-ity to degrade polychlorinated biphenyls (PCBs), polycyclicaromatics hydrocarbons (PAHs), chlorinated phenols, pesti-cides, and dyes [14–18]. Purified lignin-degrading enzymeswere able to efficiently degrade or decolorize various dyeswith different and complex chemical structures. Cripps et al.(1990) have reported that anaerobic bacteria convert the toxicazo dyes in to colorless carcinogenic compounds, however thesame azo dyes not degraded under aerobic conditions [15].Spadaro et al. (1992) have showed that Phanerochaetechrysosporium was able to efficiently decolorize and mineral-ize the toxic azo dyes to carbon dioxide [19]. Detoxificationstudies conducted by Heinfling et al. (1997) and Abadullaet al. (2000) have shown that fungal species such asTrametes versicolor, Bjerkandera adusta are able to signifi-cantly minimize the toxicity of azo and phthalocyanine dyes;in addition, immobilized laccase enzymes of Trametes hirsutahave reduced the toxicity of triphenylmethane, indigoid, azo,and anthraquinone dyes by 80 % respectively [17, 20]. Levinet al. (2004) have showed the primary isolation of lignolyticmicrobes by inoculated test strains on malt extract agar platescontaining (12.7 g/l) malt extract, glucose (10 g/l), agar (20 g/
l) and further supplemented with any one of six different dyes;Poly R-478 (0.02 %), Anthraquinone blue (0.02 %),Malachite Green (50 μM), azure B (50 μM), Congo Redand Xylidine Ponceau or Acid Red 26 [21]. Bandounas et al.(2011) have used the lignin-mimicking dyes such as azure B,Indigo Carmine, Malachite Green, Congo Red, XylidinePonceau, Methylene Blue, Toludine Blue O, and RemazolBrilliant Blue R (RBBR) for dye decolorization studies onboth liquid and solid media [22]. According to Levin et al.2004, dye decolorization tests should contain 0.02 % ofanthroquinonic dyes whereas other dyes such as MalachiteGreen, Azure B, Congo Red and Xylidine Ponceau shouldbe supplemented at 50 μM along with the growth medium[21]. Sample inoculum should consist of two agar plugs of25 mm taken from a 5-day-old culture grown on MEA. Inorder to monitor the decolorization of the dyes two controlsmust be maintained; an uninoculated plate with the same dyeconcentrations acts as a control for abiotic decolorization, acontrol plate without any dye must be inoculated the same asthe test plates. The test must be replicated three times; all theplates are incubated at 28 °C for 21 to 28 days. Dye decolor-ization is analyzed bymeasuring (a) the radial extension of thefungal mycelium, (b) average growth rates, calculated as cm/day, and (c) growth of fungal colonies and decolorized zones,calculated weekly. If the fungus is able to efficiently degradethe dye then a clear zone appears, and further, the samples areassessed quantitatively for enzyme activities [21]. The dyedecolorization methods are cost-efficient and simple methodsused for isolation of lignin-degrading bacteria or fungi, butthese methods require further characterization using some ad-vanced or specific methods which are discussed below.
Staining Lignin Agar Method Sundman and Nase (1971)wre the first to propose a simple and convenient method forestimating the lignin-degrading ability of the test strains. Thecomposition of the assay medium involves 5 g ammoniumtartarate, 1 g malt extract, 0.5 g MgSO4.7H2O, 0.01 gCaCl2.2H2O, 0.1 g NaCl, 0.01 g FeCl3, kraft lignin(0.025 %) 1 mg thiamine, and 15 g agar in 1 liter of distilledwater followed by adjusting the pH to 4.5; 1 ml of separatelysterilized glucose (20 % w/v) is aseptically added to the finalmedium. The fungal growth medium is autoclaved and trans-ferred to plates. Later, the plates are inoculated with the teststrains and incubated for 5–10 days at 27 °C, followed bystaining with freshly prepared 1 % w/v solutions of FeCl3and K3 [Fe (CN)6]. Plates show clear zones around the colo-nies indicating oxidized phenolic compounds; at the sametime, phenols in undegraded lignin plates will stain blue green[23]. This method is used to show the degradation of phenoliccompounds in lignin by the test strains; however, the degra-dation of non-phenolic lignin compounds is not shown by thisprocedure. Thus, this method does not prove the completedegradation of lignin by microorganisms [24, 25].
Bioenerg. Res.

Tannic Acid AgarMethodAccording to Pointing SB (1999),this method is a modification of the Bavendamm test (1928)[26] using tannic acid or gallic acid in the assay medium [23].This assay is used to analyze the overall activity ofpolyphenoloxidase but is not specific to any of the lignin-modifying enzymes. The culture medium contains 1 ml of20 % (w/v) glucose and 1 ml of 1 % (w/v) tannic acid whichare sterilized separately and added aseptically to the autoclavedlignin basal medium (1.6 % w/v). The medium is asepticallytransferred to petri plates, then inoculated with test strain andincubated at 27 °C in darkness. Appearance of a brownoxidization zone around the fungal colonies represents theoverall polyphenoloxidase activity. However, natural browncolored pigment released by most of the fungi leads to furtherambiguity in interpreting oxidization zones, which is consid-ered to be the main disadvantage of this method [23, 26].
Autoradiography Using 14C-ring Labeled DehydrogenationPolymerizate Temp et al. (1998) has developed a small-scalemethod for the isolation of lignin-degrading microorganismsusing 14C-ring labeled dehydrogenation polymerizate [27].However, for the first time Haider et al. (1975) have devel-oped the most efficient method for determining the lignin-degrading ability of microorganisms, based on the measure-ment of 14CO2 evolved from the 14C-labelled cultures (14C-ring-labeled dehydrogenation polymerizate) [28, 29].However, the large scale analysis of lignin-degrading micro-organisms using this method involves high cost and signifi-cant manpower, and at the same time it is also expensive withregard to the disposal of radioactive labelled lignin com-pounds. According to Temp et al. (1998), test fungal strainsare primarily cultured on 2 % (w/v) malt extract agar for10 days. Further 0.5 by 0.5 cm of agar blocks from theprecultures are transferred to the wells of sterile tissue cultureplates consisting of 3 ml of sterile basal liquid medium. Thesefungal cultures are incubated at 27 °C for 3 days and observedfor the growth of mycelium prior to the addition ofradiolabeled dehydrogenation polymerizate (DHP). On the4th day, 14C-DHP is dissolved in 5 μl of dimethylformamideand later added to each well. After 24 hours, sterile Whatman3 mm filter paper is cut exactly to the dimensions of cultureplates and soaked in sterile saturated barium hydroxide solu-tion. The above soaked filter paper is further placed over thewells and closed firmly for the next 5 days at 30 °C. When14CO2 is evolved from the plates as a result of lignin degra-dation, it gets trapped in the filter papers as insoluble BaCO3.Finally, the filter papers are removed and exposed to X-rayfilm for 5 days; development of dark color circles on theautoradiogram corresponds to the position well formed as aresult of trapped 14CO2. The intensity of the dark coloredcircles is directly proportional to the lignolytic capacity ofthe test fungal cultures. Finally, autoradiograms obtained fromthe above procedures are scanned and analyzed using any
standard image analysis program. The whole experiment mustbe conducted with either two or three replicates; uninoculatedculture plates with 3 ml of liquid basal medium (pH 4.6) alongwith radiolabeled DHP act as a control for the assay [27]. Thismethod acts as a sensitive assay for identifying novel andefficient lignin-degrading microorganisms.
Colorimetric Assay Using Diazotized Derivative ofSulfonic Acid Rajan et al. (1992) developed a simple, rapid,and sensitive colorimetric assay for studying bacterial lignindegradation [30]. This spectrophotometric assay involves thereaction between diazotized sulfanilicacid and alkaline ligninsolution [30]. The whole reaction contains three major steps:preparation of acid precipitable fraction of lignin, biodegrada-tion of lignin samples by test strains, and reaction of diazo-tized sulfanilic acids with lignin. The detailed protocol andmechanism of the above steps is not discussed [30]. Thoughthe method is simple and rapid, it has a disadvantage of beingsensitive to non-lignin UV absorbing compounds which aregenerally observed in biological systems.
Spectrophotometric Assays Ahmad et al. (2010) proposedtwo spectrophotometric assays for the identification andscreening of the lignin-degrading microorganisms [31]. Thismethod can be used for rapid screening of the ligninolyticabilities of the microorganisms. According to Ahmad et al.(2010), lignin medium required for this assay was preparedbased on the literature [32].
Fluorescence Assay for Screening LigninolyticMicroorganism In this assay, a fluorophore is attached to thelignin polymer, thus disruption or breakdown of the ligninpolymer causes a change in the fluorophore’s environmentleading to a change in fluorescence. This method involves afluorescent lignin medium prepared by mixing 5 mg of ligninin 0.5 ml of H2O and 3 mg of (0.02 mM) K2CO3 thoroughly.The mixture thus obtained is further filtered using cotton wool;later, 100μl of 0.2mM fluorescein isothiocyanate (FITC) stocksolution in water is added in aliquots for overnight stirringunder a foil. Further, this solution is acidified, precipitated,and collected using centrifugation for 2 minutes at10,000 rpm; the obtained lignin–fluorescein isothiocyanate(lignin-FITC) is used in the fluorescence assay. As the totalvolume of fluorescence assay constitutes 200 μl, assay can beperformed in 96-well plates. The assay mixture consists oflignin-FITC stock solution containing 1 mg of lignin-FITCprepared in 5 mM Tris buffer with a pH 7.4 containing50 mM NaCl and then diluted to 4.5 ml of Tris buffer. To eachwell, 160 μl of lignin-FITC stock solution is added along with30 μl culture supernatant and 10 μl of 2 mM H2O2 solution.The change in fluorescence should be measured under a spec-trophotometer at absorbance of λex 490 nm, λem 520 nm forevery 1 minute for the first 10 minutes; after this, every
Bioenerg. Res.
10 minutes for next 2 hours. The assay is conducted in dupli-cate for consistency, and assay mixture containing buffer solu-tion replaced with either lignin or culture supernatant can act ascontrol. The entire assay is performed by replacing H2O2 in theassay mixture with the buffer solution. The concentration de-pendence of the reaction can be inspected by performing theassay at different concentrations (10 μl, 30 μl, 50 μl) of culturesupernatants. The fluorescence data vs time can be subtractedfrom the control data (without culture supernatant) usingMicrosoft Excel or other software. Generally, 10–30 % of errorrate is typically observed between the duplicate assays [31].
Nitrated Lignin Assay This assay involves chemicallynitrated lignin; disruption or degrading of lignin polymerreleases nitrated phenolic compounds, thus resulting in in-crease in absorbance. As the name suggests this assay in-volves nitrated lignin for the qualitative determination ofmicroorganisms. Ahmad et al. (2010) developed twomethods for the preparation of nitrated lignin. In the firstmethod, 5 mg of lignin and 3 mg of K2CO3 are mixed in0.5 ml of water thoroughly and filtered to remove insolublecompounds. This is followed by the addition of 100 μltetranitromethane to the above mixture during constant stir-ring under a foil at room temperature for 1 hour, and thencentrifuged for 2 minutes at 10,000 rpm. Upon centrifuga-tion, the whole solution is separated, the aqueous layer beingremoved to evaporate the remaining solution under vacuum,this method results in 0.6–1.3 mg nitrated lignin. For UVassay, a stock solution is prepared by mixing 1 mg ofnitrated lignin in 100 ml of 750 mM Tris buffer at apH 7.4 containing 50 mM NaCl. The second method in-volves 5 mg of lignin mixed in 1 ml of glacial acetic acid,and later the insoluble materials are filtered. Concentratednitric acid 0.2 ml was added to the above reaction mixtureat a constant stirring for 1 hour followed by adding 2 ml ofwater. This is followed by neutralization of the assay mix-ture to pH 7.4 using 1 M NaOH, resulting in a yellow-colored solution which is further diluted by 100-fold using750 mM Tris buffer (pH 7.4) containing 50 mM NaCl whichis used as stock solution for UV assay. The UV assay reac-tion mixture consists of a total mixture of 200 μl solution ineach well of a 96-well plate, containing 30 μl of culturesupernatant, 160 μl of nitrated lignin solution, and 10 μlof 40 mM H2O2 solution. The assay plates are constantlymeasured every 1 min time interval for 20 minutes using aspectrophotometer at an absorbance of 430 nm. In the assaymixture, either nitrated lignin or culture supernatant can bereplaced by buffer solution, which acts as control to theassay reaction. The assay reaction can be performed in du-plicates for consistency; however, about 10–30 % of errorrate is typically observed between the replicates. Similar tothat of the fluorescence assay, the concentration dependency
of the reaction can be investigated using different concentra-tions (10 μl, 30 μl, 50 μl) of culture supernatants [31].
Denaturing Gradient Gel Electrophoresis (DGGE) DGGEis an undeniably significant approach for screening compositeecosystems on a large scale; it can easily analyze various en-vironmental samples significantly in much less time. Recentstudies have widely involved DGGE for assessing microbialpopulation [33]. Polymerase chain reaction denaturing gradi-ent gel electrophoresis (PCR-DGGE) has become a part ofmodern molecular microbial ecology [34]. Microbial ecologydeals with studying intra-microbial, microbial, and environ-mental interactions; it involves long-term analysis involvingvarious and numerous environmental samples. DGGE hasgained higher importance in modern microbial ecology be-cause most of the conventional methods such as cloning orhybridization are not always practical for microbial ecologicalinvestigations. These conventional techniques require an ad-ditional understanding of the microorganisms by developingadapted probes which can target specific microorganismsamong diverse population, and also do not provide any infor-mation about environmental effects on microbial populations[34]. DGGE has the special advantage of visually profilingand monitoring changes occurring in different microbial com-munities which usually undergo different treatments. It is arapid and efficient separation technique of similar lengthDNA sequences amplified by PCR, with chances of varyingin single base pairs [34–36]. The DGGE method primarilyinvolves the collection of DNA from the samples with multi-ple organisms; later, the collected DNA samples are amplifiedby PCR. Usually most conserved sequences such as 16SrDNA are considered for DGGE analysis. DGGE is per-formed at a constant temperature of 60 °C and under the in-fluence of increasing concentrations of denaturing chemicalswhich forcefully separate DNA molecules. Separation ofDNA molecules are based on electrical charge, molecularweight, and shape. The negatively charged DNA migratesthrough the pores of polyacrylamide gels, as it is attracted bythe positively charged electrode. At a temperature of 60 °Cand increasing concentrations of the denaturing agent’s break-down of the hydrogen bonds between the base pairs, the sep-aration of DNA fragments occurs, which is said to be melted[34, 35]. This defines the melting regions [stretches of basepairs with similar melting temperatures example: base pairscontaining A (adenine), T (Thymine) and those containing G(Guanine) and C (Cytosine) are melted apart]. Dissimilarity inDNA sequences within these regions will lead to differentmelting temperatures, thus causing differential migration ofdissimilar sequences [35].
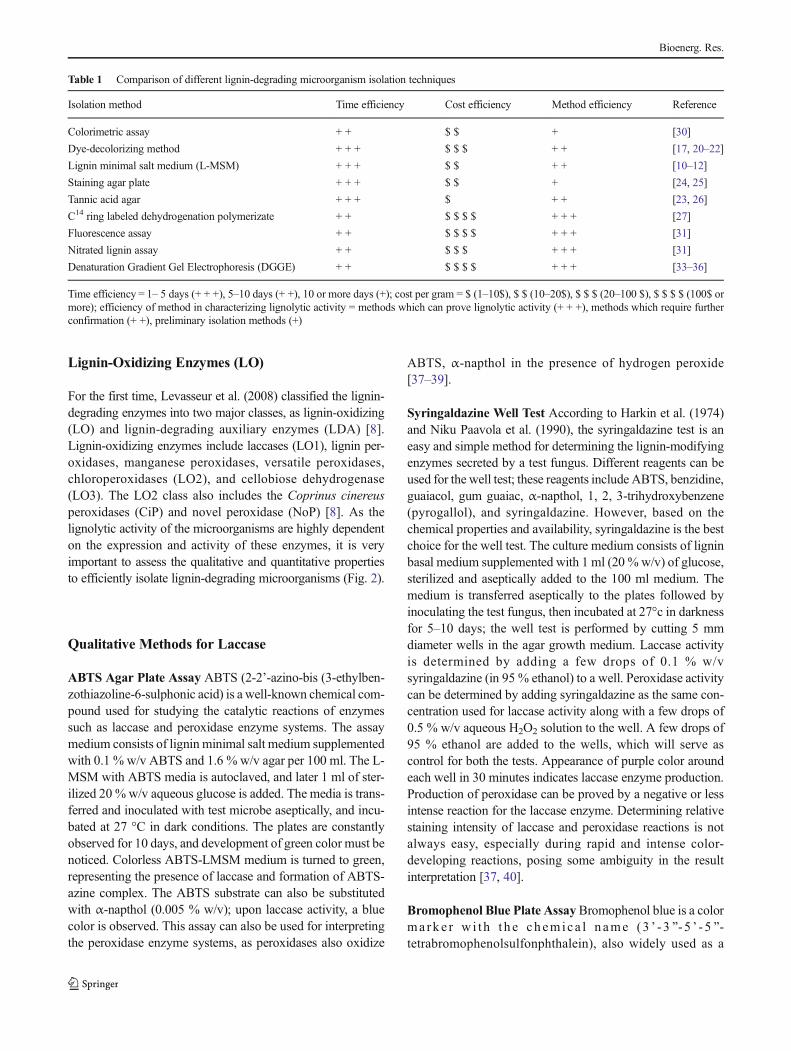
The above discussed isolation and characterizationmethods for lignin-degrading microorganisms were comparedbased on the cost effectiveness, time, and method efficiencies(Table 1).
Bioenerg. Res.
Lignin-Oxidizing Enzymes (LO)
For the first time, Levasseur et al. (2008) classified the lignin-degrading enzymes into two major classes, as lignin-oxidizing(LO) and lignin-degrading auxiliary enzymes (LDA) [8].Lignin-oxidizing enzymes include laccases (LO1), lignin per-oxidases, manganese peroxidases, versatile peroxidases,chloroperoxidases (LO2), and cellobiose dehydrogenase(LO3). The LO2 class also includes the Coprinus cinereusperoxidases (CiP) and novel peroxidase (NoP) [8]. As thelignolytic activity of the microorganisms are highly dependenton the expression and activity of these enzymes, it is veryimportant to assess the qualitative and quantitative propertiesto efficiently isolate lignin-degrading microorganisms (Fig. 2).
Qualitative Methods for Laccase
ABTS Agar Plate Assay ABTS (2-2’-azino-bis (3-ethylben-zothiazoline-6-sulphonic acid) is a well-known chemical com-pound used for studying the catalytic reactions of enzymessuch as laccase and peroxidase enzyme systems. The assaymedium consists of lignin minimal salt medium supplementedwith 0.1 % w/v ABTS and 1.6 % w/v agar per 100 ml. The L-MSM with ABTS media is autoclaved, and later 1 ml of ster-ilized 20 % w/v aqueous glucose is added. The media is trans-ferred and inoculated with test microbe aseptically, and incu-bated at 27 °C in dark conditions. The plates are constantlyobserved for 10 days, and development of green color must benoticed. Colorless ABTS-LMSM medium is turned to green,representing the presence of laccase and formation of ABTS-azine complex. The ABTS substrate can also be substitutedwith α-napthol (0.005 % w/v); upon laccase activity, a bluecolor is observed. This assay can also be used for interpretingthe peroxidase enzyme systems, as peroxidases also oxidize
ABTS, α-napthol in the presence of hydrogen peroxide[37–39].
Syringaldazine Well Test According to Harkin et al. (1974)and Niku Paavola et al. (1990), the syringaldazine test is aneasy and simple method for determining the lignin-modifyingenzymes secreted by a test fungus. Different reagents can beused for the well test; these reagents include ABTS, benzidine,guaiacol, gum guaiac, α-napthol, 1, 2, 3-trihydroxybenzene(pyrogallol), and syringaldazine. However, based on thechemical properties and availability, syringaldazine is the bestchoice for the well test. The culture medium consists of ligninbasal medium supplemented with 1 ml (20 % w/v) of glucose,sterilized and aseptically added to the 100 ml medium. Themedium is transferred aseptically to the plates followed byinoculating the test fungus, then incubated at 27°c in darknessfor 5–10 days; the well test is performed by cutting 5 mmdiameter wells in the agar growth medium. Laccase activityis determined by adding a few drops of 0.1 % w/vsyringaldazine (in 95 % ethanol) to a well. Peroxidase activitycan be determined by adding syringaldazine as the same con-centration used for laccase activity along with a few drops of0.5 % w/v aqueous H2O2 solution to the well. A few drops of95 % ethanol are added to the wells, which will serve ascontrol for both the tests. Appearance of purple color aroundeach well in 30 minutes indicates laccase enzyme production.Production of peroxidase can be proved by a negative or lessintense reaction for the laccase enzyme. Determining relativestaining intensity of laccase and peroxidase reactions is notalways easy, especially during rapid and intense color-developing reactions, posing some ambiguity in the resultinterpretation [37, 40].
Bromophenol Blue Plate AssayBromophenol blue is a colorma rke r w i t h t h e chem ic a l n ame (3 ’ - 3^- 5 ’ - 5^-tetrabromophenolsulfonphthalein), also widely used as a
Table 1 Comparison of different lignin-degrading microorganism isolation techniques
Isolation method Time efficiency Cost efficiency Method efficiency Reference
Colorimetric assay + + $ $ + [30]
Dye-decolorizing method + + + $ $ $ + + [17, 20–22]
Lignin minimal salt medium (L-MSM) + + + $ $ + + [10–12]
Staining agar plate + + + $ $ + [24, 25]
Tannic acid agar + + + $ + + [23, 26]
C14 ring labeled dehydrogenation polymerizate + + $ $ $ $ + + + [27]
Fluorescence assay + + $ $ $ $ + + + [31]
Nitrated lignin assay + + $ $ $ + + + [31]
Denaturation Gradient Gel Electrophoresis (DGGE) + + $ $ $ $ + + + [33–36]
Time efficiency = 1– 5 days (+ + +), 5–10 days (+ +), 10 or more days (+); cost per gram = $ (1–10$), $ $ (10–20$), $ $ $ (20–100 $), $ $ $ $ (100$ ormore); efficiency of method in characterizing lignolytic activity = methods which can prove lignolytic activity (+ + +), methods which require furtherconfirmation (+ +), preliminary isolation methods (+)
Bioenerg. Res.

dye. Tekere et al. (2001) showed the dye-decolorizing abilitiesof lignin-degrading enzymes. Different dyes (Crystal Violet,Cresol Red and Blue Dextran), were used by Tekere et al.:however, Bromophenol Blue is one of the efficient dyes whichcan be used for quantitative detection of laccase enzyme. Thedye-decolorization medium consists (w/v) of 2 % glucose,3 % malt extract, 0.02 % dye, 0.1 % peptone (mycological),and 1 % agar. The plates are inoculated with test strains andlater incubated at 27 °C to 30 °C based on the optimum tem-perature of the test strain. The degree of decolorization of thedye is visually examined by noticing clear halo zones aroundlaccase-producing strains [25].
Guaiacol Agar Plate Assay Guaiacol is a naturally occurringyellow-colored aromatic compound derived from guaiacum.It is a product obtained upon pyrolysis of lignin present inwood smoke [41, 42]. Any particular assay media can besupplemented with 0.01 % guaiacol, Fatemeh et al. (2012)have used Nutrient agar supplemented with 0.5 mM guaiacolfor the detection of laccase activity of Bacillus subtilis WPI[43]. The media containing guaiacol is autoclaved and trans-ferred aseptically to the plates, followed by inoculation of teststrain. The plates are incubated at 27 °C and 37 °C based onoptimum temperature of test strain for 10 days; further platesare examined for the development of orange or brown colorhalo zones around laccase-producing microbial strains.Similarly, the drop screen procedure can be used for identify-ing laccase-producing bacteria, by preparing 12 μl of guaiacolto 1 ml of 100 % ethanol. A 2-day-old culture is considered,and later the above-prepared guaiacol solution is added dropby drop: the culture is kept aside for 4 hours and allowed todevelop an orange or brown halo zone around laccase-producing fungal colonies [44, 45].
Quantitative Assays for Laccase
ABTSAssayABTS is a non-phenolic dye which forms one ofthe most efficient substrates for laccase to study enzymaticreaction kinetics. ABTS is oxidized by the laccase enzymeto its more stable cation radical form. The final concentrationof the cation radical in the reaction mixture is responsible forthe development of intense blue–green color, which can befurther correlated to laccase enzyme activity. The assay reac-tion mixture contains 0.5 mM of ABTS, 2.8 ml of 0.1 mMsodium acetate buffer with a pH 4.5, and 100 μl of culturesupernatant. Test mixture is added and immediately incubatedfor 5 minutes, and later the absorbance is read at 420 nm usinga spectrophotometer with a suitable blank. Laccase enzymeactivity is further measured in units, one unit of laccase in-volved in the oxidization of 1 μ mol of ABTS substrate perminute [46]. Sodium azide (0.1 mMNaN3) inhibits the wholereaction by lowering the concentration of ABTS cation radicalby dilution, preventing the further formation of cation radicalby completely inhibiting laccase enzyme [47].
DMPAssay 2,6-Dimethoxyphenol (2, 6-DMP) and other de-rivatives of it are plant phenolic compounds; these compoundsare predominantly present in the thermal degradation of hard-wood. DMP is one of the well-known substrates for thelaccase enzyme, it has been widely used as a substrate forlaccase enzyme to study the reaction kinetics, as it converts2, 6-DMP to 3,5,3’,5’-tetramethoxydiphenoquinone byresulting in a color change. The reaction mixture contains10 mM DMP solution in 100 mM sodium acetate buffer witha pH 4.0 (ε469 = 275001 mM cm-1 referred to 2,6-DMP con-centration). Whole assay reaction is carried out at room tem-perature (22–27 °C). The enzyme activity is demonstrated inunits where one unit of enzyme activity is defined as the
Fig. 2 Demonstrates variousquantitative and qualitative assaysof lignin-oxidizing enzymes
Bioenerg. Res.
amount of laccase oxidizing 1 μM of 2,6-DMP per minute[48–50].
Syngaldazine Assay According to Harkin and Obst (1973),syringaldazine (4-hydroxy-3,5 dimethoxy benzaldehydeazine) is an excellent substrate for easy and rapid detectionof the laccase enzyme. Dilute syringaldazine solution in etha-nol (mixture of alcohols or dimethyl sulfoxide) upon treatmentwith laccase enzyme changes its color from yellow to deeppurple. The change in color is obtained from two-fold phenoldehydrogenation of syringaldazine and intramolecular pairingof the free radicals, resulting in highly colored tetramethoxy-azo-bis-methylene quinone complex. Unlike other substrates,color formation occurs when syringaldazine readily reactswith the laccase enzyme, and similarly color development israpid at all pH conditions; at the same time, color fades rapidlyoutside the pH range of 3–7 [51]. The reaction mixture con-sists of syringaldazine (1.3 × 10⁻² mM) in 0.1 mM phosphatebuffer with pH 6.0 or 50 mM acetate buffer pH 4.5, and asuitable amount of enzyme is added to the reaction mixture.The reaction is continuously observed for the development ofpurple color (tetramethoxy-azo-bis-methylene quinone com-plex) at 30 °C by measuring its absorbance at 525 nm with amolecular extinction coefficient of 65,000 M−1 cm−1. Theoxidization of syringaldazine by laccase enzyme is deter-mined in units where one unit of laccase oxidizes 1 μmol ofsyringaldazine per minute [52].
Mediator-Dependent Laccase Activity Assays
PAH Biodegradation Assay Several studies have reportedconcerning the efficiency of laccases in the oxidation ofnon-natural compounds such as polycyclic aromatic hydrocar-bons (PAH’s). Polycyclic aromatic hydrocarbons (PAH) arehighly toxic organic pollutants exceedingly distributed in ter-restrial and aquatic environments [53–57]. Laccase activitycan be determined by oxidation of anthracene by reducing 9,10-anthraquinone in the presence of sodium borohydridewater-soluble solution. The method primarily involves the di-lution of the laccase sample with acetate buffer at pH 5.0 orwith enzyme diluent if required. Assay mixture containing50 μl of laccase sample and 50 μl of PAH reaction solutionis transferred to the 96-well plate. Anthracene and mediatorcompounds can act as controls for checking the PAH autoxi-dation (it can contain 50 μl of PAH but the laccase should bereplaced). Contents of the reaction mixture must be thorough-ly mixed with either single or multi-channel pipette; the wellsof the 96-well plate are covered using a sealing film and in-cubated in darkness at room temperature for 24 hours. After24 hours, the oxidation reaction of laccase is stopped byadding 100 μl of 100 % ethanol and 20 μl of sodium borohy-dride water-soluble solution (SWS) followed by thorough
mixing of the reaction contents. The plate is sealed againand incubated at room temperature for 15 minutes; then theabsorbance of the reaction mixture is taken using a spectro-photometer at 419 nm. One unit of PAH-activity can be mea-sured by the amount of enzyme which produces 1 μmol of9,10-anthroquinone per minute under the described conditions[58].
Decolorization Assay Using Poly-R478 Poly-R478 is a well-known lignin model compound related to the class of PAHs;thus, both types of compound can be degraded by the laccasemediator system. Polymeric dye decolorization was devel-oped based on its correlation with PAH biodegradation.Similarly to the PAH biodegradation method, initially laccasesamples are diluted using acetate buffer (pH 5.0) or with en-zyme diluent if required. The reaction mixture consists of50 μl of laccase sample and 150 μl of Poly-R478, with con-trols having the same amount of Poly-R478 as the reactionmixture but without laccase. The contents of the reaction mix-ture are thoroughly mixed and the absorbance of the reactionis constantly monitored under spectrophotometer at 520 nm.Later, the plates are sealed with sealing film and incubated for15 minutes to 6 hours at room temperature, based on theamount of the enzyme added. Laccase enzyme activity canbe measured based on its ability to decolorize Poly-R478;one unit of decolorization activity of laccase is equal to1 μmol of Poly-R478 per minute under the described condi-tions [58–60].
Iodide Assay This is a mediator-dependent laccase assaywhich catalyzes the oxidation of iodide to iodine [61]. At thesame time, in situ generation of iodine from iodide usinglaccase is an advantageous reaction for industrial and medicalsterilization purposes when compared to peroxidase-basedsystems, as it uses dioxygen instead of peroxide. The methodcommences by diluting the laccase samples with enzyme dil-uent. The reaction mixture contains 20 μl of laccase sampleand 180 μl of iodide assay solution. The total reaction mixtureis mixed thoroughly, and the absorbance is recorded at 353 nmusing a plate reader. Then the plate is sealed using a sealingtape and incubated at room temperature in dark conditions for1–6 hours. After incubation, the sealing film is removed andabsorbance is recorded again at 353 nm, for calculating therelative activities based on the difference between primaryabsorption followed by dividing by the incubation time (inminutes). The laccase enzyme activity is measured based onthe oxidization of 1 μmol iodide/min at its correspondingconditions [58, 61].
All the above-discussed qualitative and quantitativemethods for the characterization of laccase enzymes werecompared with respect to their cost, time and method efficien-cies (Table 2).
Bioenerg. Res.

Qualitative Assays for Peroxidases
Poly-R478 Agar Plate Studies have shown that fungal abilityin decolorization of Poly-R478 (a polymeric dye) is correlatedwith secretion of several lignin-degrading peroxidases or polyphenoloxidases [64–66]. This screening method involves theL-MSM or any microbial growth medium supplemented with(w/v) of 0.02 % of Poly-R478 with 1.6 % of agar and 1 ml of20 % (w/v) of glucose (aqueous) for 100 ml of screeningmedium. Later the medium is aseptically transferred to theplates and inoculated with test strain and incubated at 27 °C(in darkness). Screening plates are examined daily for 10 days,and production of lignin-degrading peroxidases can be in-ferred by observing a clear halo zone around the test colonyin the violet-colored medium. Decolorization of Poly-R478 isone of the most significant and convenient qualitativemethods for determination of lignin-degrading peroxidases.Compared to other assays, peroxidases can be easily estimatedwithout the addition of hydrogen peroxide to the medium.However, there is some ambiguity when this assay is usedfor laccase estimation, as laccase secreted by several tropicalmarine fungi fails to decolorize Poly-R478 [66]; at the sametime, laccases secreted by several terrestrial basidiomycetesare able to decolorize Poly-R478 [65]. The decolorizationability of the test fungus can also be estimated by using brothcultures and estimating the degree of decolorization by spec-trophotometer at an absorbance ratio of 520/350 nm [25].
Azure B Agar Plate Assay Several fungi which secrete ligninperoxidase and manganese peroxidase also have the ability todecolorize or degrade Azure B dye. However, laccase enzymecannot decolorize Azure B; thus, it can be used as a qualitativetest for ligninolytic peroxidase production. The assay mediumcontains lignin minimal salt medium (L-MSM) or any
microbial growth medium supplemented with 0.01 % w/vAzure B and later 1 ml of 20 % w/v aqueous glucose solutionper 100 ml of assay medium. The medium is autoclaved andaseptically transferred to the plates, and inoculated with testfungus and incubated at 27 °C in dark conditions. The testplates are examined regularly and monitored for the appear-ance of clear halo zones around fungal colonies. Clearance ofblue color in the assay plates confirms the production of ligninand manganese peroxidase. One of the advantages of usingthe Azure B clearance test is that it doesn’t require the additionof hydrogen peroxide to the assay medium [67].
Methylene Blue Assay Magalhaes et al. (1996) showed thatmethylene blue can be used as the simple and rapid visualinspection assay for lignin peroxidase enzyme activity in theculture supernatant. The assay mixtures contain 2.2 ml ofculture supernatant (without dialysis), 0.1 ml of 1 mM meth-ylene blue, 0.3 ml of 0.5 M sodium tartarate buffer with a(pH 4.0), and 0.1 ml of 4.5 mM H2O2. Oxidative reaction ofthe lignin peroxidase will start after the addition of H2O2. Thetest mixtures should be closely examined to observe a changein color from greenish blue to purple blue. The time taken forcolor development can be correlated to lignin peroxidase ac-tivity of the test strain. The color that develops in the presenceof lignin peroxidase is compared to a blank assay; twice-distilled water is used to replace the supernatant [68].
Methyl Catechol Assay Brown et al. (1993) have reportedmethyl catechol assay for determining the production of manga-nese peroxidase enzyme qualitatively in the culture supernatants.The assay mixture consists of 0.4 mMmethyl catechol, 0.2 mMMnSO4, and 50 mM sodium succinate buffer solution with apH of 4.5 and 0.1 mM H2O2. The oxidative reaction is initiatedby the addition of H2O2 to the reactionmixture. The text mixture
Table 2 Comparison of different qualitative and quantitative methods for the identification and characterization of laccase enzyme
Isolation method Method type Time efficiency Cost efficiency Method efficiency Reference
ABTS plate assay Qualitative + + $ $ $ $ + + + [37–39]
Syringaldazine assay Qualitative + + $ $ $ $ + + [37, 40]
Bromophenol blue Qualitative + + $ + [25]
Guaiacol plate assay Qualitative + + $ + + [44, 45]
ABTS enzyme assay Quantitative + + + $ $ $ $ + + + [47, 62]
Syringaldazine assay Quantitative + + + $ $ $ $ + + + [51, 52, 63]
DMP assay Quantitative + + + $ + + + [49, 50]
PAH biodegradation Quantitative + + + $ $ $ + + [58]
Poly-R478 decolorization Quantitative + + + $ $ $ $ + + [58–60]
Iodide assay Quantitative + + + $ $ + + [58, 61]
Time efficiency = 1– 2 days (+ + +), 3–10 days (+ +), 10 or more days (+); cost per gram = $ (1–10$), $ $ (10–20$), $ $ $ (20–100 $), $ $ $ $ (100$ ormore); efficiency of method in characterizing lignolytic activity = methods which can prove lignolytic activity (+ + +), methods which require furtherconfirmation (+ +), preliminary isolation methods (+)
Bioenerg. Res.
should be closely observed for the color change from pale yel-low–brown to orange–brown or yellowish–brown. The speed ofcolor change is directly proportional to MnP activity of the testculture. Inactivated culture supernatants or double-distilled watercan be used for blank assay [69].
Quantitative Assays for Lignin Peroxidases
Veratryl Alcohol OxidationVeratryl alcohol is a well-knownsubstrate for the lignin peroxidase (LiP) and is frequently usedfor quantification of LiP. Themethod is based on the oxidationof veratryl alcohol (3, 5-dimethoxybenzyl alcohol) toveratraldehyde. The reaction mixture contains 1 ml of125 mM sodium tartarate buffer (pH 3.0), 500 μl 10 mMveratryl alcohol, 500 μl of 2 mM H2O2 solution, and 500 μlof culture filtrate of test strain. The reaction can be performedin a 96-well plate by thoroughly mixing the contents; reactionis initiated by adding H2O2. The change in absorbance is con-tinuously monitored using a spectrophotometer at 310 nm.Enzyme activity can be evaluated as one unit of enzyme ac-tivity for the oxidation of 1 μmol of veratraldehyde (oxidizedproduct of veratryl alcohol) produced per minute per ml ofculture filtrate of test strain [70].
Azure B Assay Archibald et al. (1992) have developed enzy-matic assay using Azure B for the quantification of ligninperoxidase [67]. Several fungi with ability to secrete ligninperoxidase also have the ability to decolorize Azure B dye;thus, it is also used as a qualitative test for the primary isola-tion of lignin-degrading microorganisms [23]. The reactionmixture for Azure B assay contains 1 ml of 50 mM sodiumtartarate (pH 4.5 or 2.5), 0.1 mM hydrogen peroxide, and32μMAzure B. Similarly to the VA assay, reaction is initiatedby adding H2O2, resulting in a change in absorbance or decol-orization of the substrate Azure B, which is monitored at651 nm using a plate reader at an interval of 1 minute for aperiod of 30 minutes [67, 71].
Manganese Peroxidase Assays According to Paszczyńskiet al. (1988), manganese peroxidase can be quantified usinga variety of aromatic compounds, especially those compoundswhich are used for the assays of common peroxidases such ashorseradish peroxidase. However, the reaction mixture shouldcontain Mn (II) ions — potential substrates used for MnPactivity and their respective wavelengths are: (a) TMPD(N,N,N,N-Tetramethyl-1,4-phenylenediamine (2HCl))(610 nm), (b) vanillylacetone (336 nm), (c) 2,6-dimethoxyphenol (568 nm), (d) syringicacid (260 nm), (e)guaiacol (465 nm), (f) curcumin (430 nm), (g) syringaldazine(525 nm), (h) coniferyl alcohol (263 nm), and (i) o-dianisidine(−2HCl) (460 nm) [72]. The reactionmixtures using the abovesubstrates generally consist of 0.5 M sodium tartarate buffer
(pH 5.0), 1 mM substrate dissolved in water (for water-solublecompounds), or 50 % aqueous N’,N-dimethylformamide (forwater-insoluble compounds), 1 mMMnSO4, 1 mMH2O2, andenzyme solution or culture filtrate containing about 0.2 U/mlof enzyme. The reaction is initiated by adding hydrogen per-oxide; reaction is monitored using spectrophotometer, and thewavelength is set based on the substrate used [72].
Phenol Red Assay Phenol red assay is one of the widely usedassays for determination of manganese peroxidase (MnP).The reaction mixture consists of 25 mM lactate, 0.1 mMMnSO4, 1 mg of bovine serum albumin, 0.1 mg of phenolred per ml, and 0.5 ml of culture filtrate in 20 mM sodiumsuccinate buffer with a pH of 4.5, making a total volume of1 ml. The reaction is initiated by adding hydrogen peroxide tothe reaction mixture by making the final concentration to0.1 mM. The enzymatic reaction is stopped after one minuteby adding 50 μl of 10 % NaOH; the whole reaction is moni-tored at an absorbance of 610 nm. The reaction mixture with-out Mn2+ (without adding MnSO4) acts as a control for thephenol red oxidation assay. Manganese peroxidase enzymeactivity is calculated by subtracting the phenol red oxidizingactivity values without Mn2+ (control) from the phenol redoxidizing activity values with Mn2+ (test), which is expressedas A610 per minute per milliliter [73, 74].
Vanillylacetone Assay Vanillylacetone (4-(4-hydroxy-3-methoxyphenyl)-2-butanone) is also called zingerone, and it isstructurally similar to vanillin or eugenol, routinely used forman-ganese peroxidase assay. Manganese peroxidase can be assessedusing vanillylacetone as a substrate [75]. The reaction mixtureconsists of 0.1 mM vanillylacetone (substrate), 0.1 mMMnSO4,
0.05 mM H2O2, 100 mM sodium tartarate with pH of 5.0, andenzyme or culture filtrate is added to make the total volume1.0 ml. The contents of the reaction mixture are mixed thorough-ly, followed by addition of hydrogen peroxide to initiate thereaction. Disappearance of vanillylacetone is monitored usingspectrophotometer at absorbance of 336 nm(ε336 = 18,300); oneunit of manganese peroxidase activity is defined as 1 μmol ofvanillylacetone oxidized per minute [75].
2,6-Dimethoxyphenol AssayManganese peroxidase enzymeactivity can be assessed directly by observing the formation ofMn3+ tartarate complex during oxidation of 0.1 mM MnSo4with a molar extinction coefficient of 6500M−1 .cm−1 (Mn 2+-dependent peroxidase activity). Manganese peroxidase is alsoindirectly quantified based on its oxidization of 2,6-dimethoxyphenol to 3, 3’, 5, 5’-tetramethoxy-p, p’-diphenoquinone (Mn2+-independent peroxidase activity).Reaction mixture consists of 1 mM 2,6-DMP, 0.1 mM hydro-gen peroxide, 1 mM MnSO4, and 100 mM sodium tartarate(pH 4.5). This assay is mainly used to determine themanganese-independent peroxidase activity; manganese
Bioenerg. Res.
peroxidase activity is corrected for manganese-independentperoxidase activity by subtracting the activity obtained atpH 4.5 in the absence of Mn2+ (MnSO4). The oxidation of2,6-DMP is monitored using spectrophotometer at absorbanceof 469 nm; one unit of manganese peroxidase activity is de-fined as 1 μmol of DMP oxidized per minute [76].
Mn (II) as Substrate According to Paszczyński et al. (1988),oxidation of Mn (II) to Mn (III) is the most convenient assayfor determining the activity of manganese peroxidase [72].Usually, purified preparations of MnP are best suited for thisassay, as the contaminating metals such as iron and copperinhibit the MnP activity. Reaction mixture consists of 0.1 Msodium tartarate (pH 5.0), 0.1 mM hydrogen peroxide,0.1 mM MnSO4, and the culture filtrate or enzyme. Theresulting product, Mn (III), forms a stable complex transientlywith tartaric acid, which can be monitored at an absorbance of238 nm using spectrophotometer during first 5 to 30 secondsof the reaction. Similarly to all other assays, reaction is initi-ated by adding hydrogen peroxide; one unit of MnP oxidizes1 μmol of Mn (II) per minute [72].
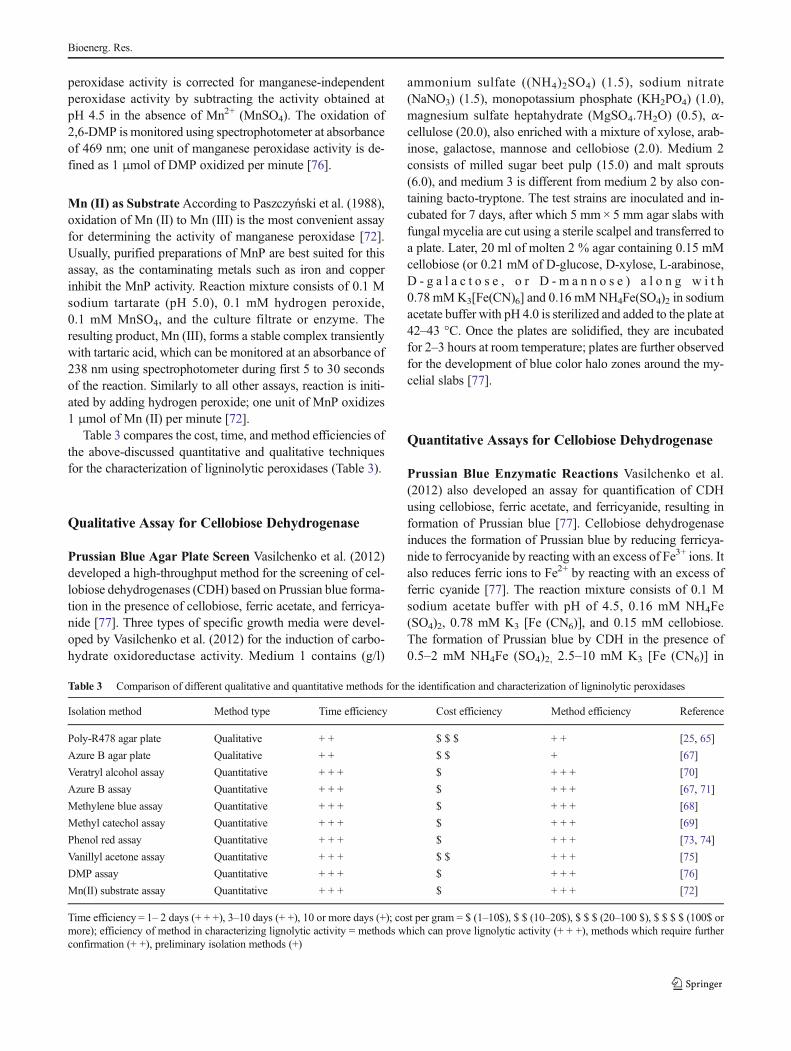
Table 3 compares the cost, time, and method efficiencies ofthe above-discussed quantitative and qualitative techniquesfor the characterization of ligninolytic peroxidases (Table 3).
Qualitative Assay for Cellobiose Dehydrogenase
Prussian Blue Agar Plate Screen Vasilchenko et al. (2012)developed a high-throughput method for the screening of cel-lobiose dehydrogenases (CDH) based on Prussian blue forma-tion in the presence of cellobiose, ferric acetate, and ferricya-nide [77]. Three types of specific growth media were devel-oped by Vasilchenko et al. (2012) for the induction of carbo-hydrate oxidoreductase activity. Medium 1 contains (g/l)
ammonium sulfate ((NH4)2SO4) (1.5), sodium nitrate(NaNO3) (1.5), monopotassium phosphate (KH2PO4) (1.0),magnesium sulfate heptahydrate (MgSO4.7H2O) (0.5), α-cellulose (20.0), also enriched with a mixture of xylose, arab-inose, galactose, mannose and cellobiose (2.0). Medium 2consists of milled sugar beet pulp (15.0) and malt sprouts(6.0), and medium 3 is different from medium 2 by also con-taining bacto-tryptone. The test strains are inoculated and in-cubated for 7 days, after which 5 mm× 5 mm agar slabs withfungal mycelia are cut using a sterile scalpel and transferred toa plate. Later, 20 ml of molten 2 % agar containing 0.15 mMcellobiose (or 0.21 mM of D-glucose, D-xylose, L-arabinose,D - g a l a c t o s e , o r D - m a n n o s e ) a l o n g w i t h0.78 mMK3[Fe(CN)6] and 0.16 mMNH4Fe(SO4)2 in sodiumacetate buffer with pH 4.0 is sterilized and added to the plate at42–43 °C. Once the plates are solidified, they are incubatedfor 2–3 hours at room temperature; plates are further observedfor the development of blue color halo zones around the my-celial slabs [77].
Quantitative Assays for Cellobiose Dehydrogenase
Prussian Blue Enzymatic Reactions Vasilchenko et al.(2012) also developed an assay for quantification of CDHusing cellobiose, ferric acetate, and ferricyanide, resulting information of Prussian blue [77]. Cellobiose dehydrogenaseinduces the formation of Prussian blue by reducing ferricya-nide to ferrocyanide by reacting with an excess of Fe3+ ions. Italso reduces ferric ions to Fe2+ by reacting with an excess offerric cyanide [77]. The reaction mixture consists of 0.1 Msodium acetate buffer with pH of 4.5, 0.16 mM NH4Fe(SO4)2, 0.78 mM K3 [Fe (CN6)], and 0.15 mM cellobiose.The formation of Prussian blue by CDH in the presence of0.5–2 mM NH4Fe (SO4)2, 2.5–10 mM K3 [Fe (CN6)] in
Table 3 Comparison of different qualitative and quantitative methods for the identification and characterization of ligninolytic peroxidases
Isolation method Method type Time efficiency Cost efficiency Method efficiency Reference
Poly-R478 agar plate Qualitative + + $ $ $ + + [25, 65]
Azure B agar plate Qualitative + + $ $ + [67]
Veratryl alcohol assay Quantitative + + + $ + + + [70]
Azure B assay Quantitative + + + $ + + + [67, 71]
Methylene blue assay Quantitative + + + $ + + + [68]
Methyl catechol assay Quantitative + + + $ + + + [69]
Phenol red assay Quantitative + + + $ + + + [73, 74]
Vanillyl acetone assay Quantitative + + + $ $ + + + [75]
DMP assay Quantitative + + + $ + + + [76]
Mn(II) substrate assay Quantitative + + + $ + + + [72]
Time efficiency = 1– 2 days (+ + +), 3–10 days (+ +), 10 or more days (+); cost per gram = $ (1–10$), $ $ (10–20$), $ $ $ (20–100 $), $ $ $ $ (100$ ormore); efficiency of method in characterizing lignolytic activity = methods which can prove lignolytic activity (+ + +), methods which require furtherconfirmation (+ +), preliminary isolation methods (+)
Bioenerg. Res.
0.1 mM sodium acetate buffer (pH 3.0–5.5) is monitored con-stantly at 700 nm [77]. Similarly, Kramer et al. (1992),have shown that the reduction of (Fe3+) ferric acetatespectrophotometrically in the presence of sodium acetate(0.1 mM with pH 3.0–5.0) at absorbance of 340 nmwith absorption coefficient for Fe3+ is 1.33 mM−1
cm−1 [78]. CDH enzyme assay developed by Krameret al. (1992) was based on reduction of ferricyanideby CDH in the presence of cellobiose (5 mM) in sodi-um acetate buffer (pH 2.0-5.0) by monitoring the chang-es in absorbance using spectrophotometer at 420 nm[78].
2,6-Dichlorphenol-Indophenol (DCPIP) From studies it isknown that cellobiose dehydrogenase (CDH) oxidizes cello-biose to cellobionolactone in the presence of an electron ac-ceptor such as DCPIP, cytochrome c, or metal ions [79].DCPIP is a suitable electron acceptor for CDH enzyme; thus,DCPIP is widely used for the quantification of CDH enzymeactivity [79]. According to Baminger et al. (2001) cytochromec (equine), azino-di-(3-ethyl-benzthiazolin-6-sulfonic acid)cation radical are the best electron acceptors; at the same time,DCPIP, 1,4 benzoquinone, dyes such as methylene blue,phenoxazine dyes (such as Meldola’s Blue and ferricyanide),and phenothiazine are also considered as efficient electronacceptors. The reaction mixture consists of 100 μl DCPIP(prepared by dissolving 3 mM in water containing 10 % v/vethanol), 100 μl lactose (prepared by dissolving 3 mM300 mM in 100 mM sodium acetate buffer with pH of 4.0);to the above solution appropriate amounts of same buffer,sodium fluoride, and lactose are added as specified. Reactionis initiated by adding diluted cellobiose dehydrogenase sam-ple (20 μl) to the reaction mixture to make the total volume upto 1 ml. Reaction mixtures without sodium fluoride, laccase,and culture filtrates are considered as blanks. The reaction isimmediately monitored using a spectrophotometer for the first5 minutes at absorbance of 520 nm (ε520 = 6.8 × 10³M − 1 cm− 1). In order to calculate the CDH activity, only the linearrange of the slope is used; thus, one unit of enzyme activityis defined as the amount of CDH reducing 1 μmol of DCPIPper minute under standard reaction conditions [80].
DNS Assay Henrikson et al. (1997) developed an enzymaticassay for CDH which is insensitive to the laccases or otherphenoloxidases which are usually present in the living sys-tems. This method is based on the decrease of reducing endgroups in lactose determined by the DNS method.Ferricyanide present in the reaction mixture acts as an efficientelectron acceptor for the CDH enzyme system. The reaction iscarried out in screw-cap test tubes; reaction mixture consistsof 2.5 ml of cold substrate solution of 4 mM potassium ferri-cyanide added along with 2.5 mM lactose (in 50 mM sodiumacetate buffer pH 5.0). Suitable volumes of enzyme or culturefiltrate and 50mM sodium acetate buffer (pH 5.0) are added tothe reaction mixture, making up a final volume of 5 ml. Thecontents of the reaction mixture are mixed thoroughly andincubated at 40 °C. The 0.5 ml of test samples are taken atregular intervals from time zero (after adding CDH) and im-mediately mixed with 0.5 ml of DNS reagent; addition ofDNS reagent stops the reaction. After collecting all the sam-ples, tubes with DNS reagents are boiled for 5 minutes andcooled to room temperature, followed by monitoring absor-bance at 575 nm. The slope of decreasing absorbance calcu-lated from linear region is transferred to molar concentrationby dividing with 752 which is the molar extinction coefficientestimated for standard curve of glucose. One unit of CDH isdefined as the amount of lactose (1 nmol) oxidized per minuteunder standard conditions, which is determined bymonitoringCDH absorbance at 280 nm [81].
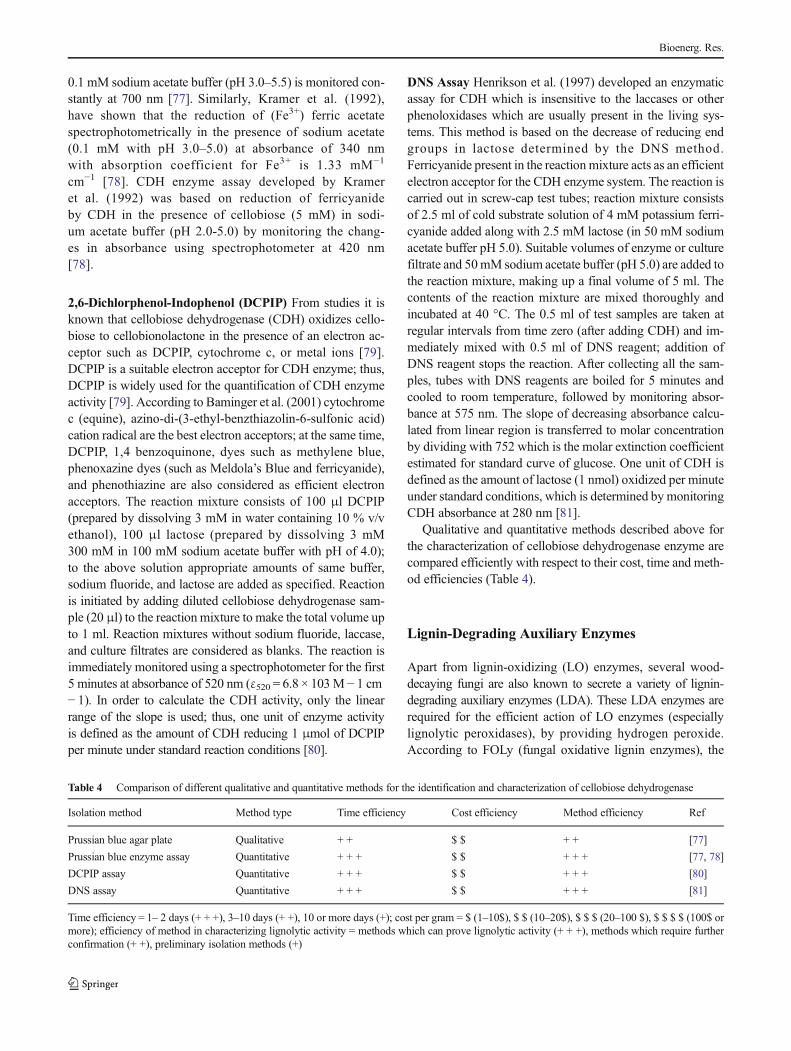
Qualitative and quantitative methods described above forthe characterization of cellobiose dehydrogenase enzyme arecompared efficiently with respect to their cost, time and meth-od efficiencies (Table 4).
Lignin-Degrading Auxiliary Enzymes
Apart from lignin-oxidizing (LO) enzymes, several wood-decaying fungi are also known to secrete a variety of lignin-degrading auxiliary enzymes (LDA). These LDA enzymes arerequired for the efficient action of LO enzymes (especiallylignolytic peroxidases), by providing hydrogen peroxide.According to FOLy (fungal oxidative lignin enzymes), the
Table 4 Comparison of different qualitative and quantitative methods for the identification and characterization of cellobiose dehydrogenase
Isolation method Method type Time efficiency Cost efficiency Method efficiency Ref
Prussian blue agar plate Qualitative + + $ $ + + [77]
Prussian blue enzyme assay Quantitative + + + $ $ + + + [77, 78]
DCPIP assay Quantitative + + + $ $ + + + [80]
DNS assay Quantitative + + + $ $ + + + [81]
Time efficiency = 1– 2 days (+ + +), 3–10 days (+ +), 10 or more days (+); cost per gram = $ (1–10$), $ $ (10–20$), $ $ $ (20–100 $), $ $ $ $ (100$ ormore); efficiency of method in characterizing lignolytic activity = methods which can prove lignolytic activity (+ + +), methods which require furtherconfirmation (+ +), preliminary isolation methods (+)
Bioenerg. Res.

LDA are divided into seven different classes: LDA1 (aryl alco-hol oxidase), LDA2 (vanillyl alcohol oxidase), LDA3 (glyoxaloxidase), LDA4 (pyranose oxidase), LDA5 (galactose oxidase),LDA6 (glucose oxidase), LDA7 (benzoquinone reductase) [8].Different quantitative enzymatic assays used for assessing theenzyme activity of LDAs are discussed below (Fig. 3).
Aryl Alcohol Oxidase
Veratryl Alcohol Assay Several studies have reported theusage of veratryl alcohol as substrate for the quantificationof aryl alcohol oxidase (AAO) [82–89]. The reaction mixtureconsists of 1 mM veratryl alcohol in 0.05 M citrate phosphatebuffer (pH 3.0), purified enzyme or culture filtrate making thetotal volume up to 2 ml, which is used for the determination ofoxidase activity. The oxidation reaction of the veratryl alcoholat room temperature is monitored constantly at an absorbanceof 310 nm (ε310 = 9,300 M−1 cm−1); the resulting increase inabsorbance is due to the formation of veratraldehyde. Theenzyme activity is measured by the amount of the enzyme thatconverts 1 μmol of veratryl alcohol to veratraldehyde(product) obtained per minute [82–88].
Vanillyl Alcohol Oxidase Studies have shown that vanillylalcohol oxidases (VAO) catalyze the oxidation of various ar-omatic substrates, mainly 4-hydroxybenzyl alcohols vanillylalcohol, eugenol, chavicol, 4-alkyl-phenols [90, 91]. Fraajieet al. (1995) showed the substrate specificity for VAO, which
conveys that apart from oxidation of 4-hydroxybenzyl alco-hols, VAO can also catalyze the oxidative deamination anddemethylation of 4-hydroxybenzylamines and 4-methoxy-methyl phenols respectively (Table 5). It is believed thatvanillyl alcohol is the only enzyme inducer and growth sub-strate for VAO, thus named as vanillyl alcohol oxidase.Furukawa et al. (1999) proposed that VAO showed higheraffinity and enzyme activity for eugenol when compared tovanillyl alcohol. Vanillyl alcohol was converted to vanillinwith much lower affinity, and only 50 % of enzyme activitywas observed when compared to eugenol [90].
(i) Vanillyl alcohol oxidase is routinely assayed usingvanillyl alcohol by producing vanillin, which can bemonitored using a spectrophotometer at 340 nm [92].The reaction mixture contains a total volume of 2.4 mlcontaining culture filtrates (dialyzed and cell free),115 mM (NH4)2SO4, 42 mM glycine/sodium hydroxide(pH 10.0). The reaction is initiated by adding 1.25 mMvanillyl alcohol to the reaction mixture; one unit of en-zyme oxidizes 1 μmol vanillyl alcohol to vanillin atpH 10.0 and 30 °C [92, 93].
(ii) Furukawa et al. (1999) used eugenol for the first time toperform the enzymatic assay of VAO. The reaction mix-ture contains 10 mM eugenol and a suitable amount ofenzyme filtrate in 1 ml of buffer incubated at 30 °C in ashaker at 160 rpm. The reaction is stopped by adding1 ml of methanol, and then the formation of coniferyl
Fig. 3 Different enzymatic assays used for the quantitative estimation of lignin-degrading enzymes (LDA)
Bioenerg. Res.
alcohol is confirmed by HPLC. The enzyme activity ofVAO is defined as the amount of enzyme catalyzingoxidation of eugenol for the production of 1 μmolconiferyl alcohol per minute [90].
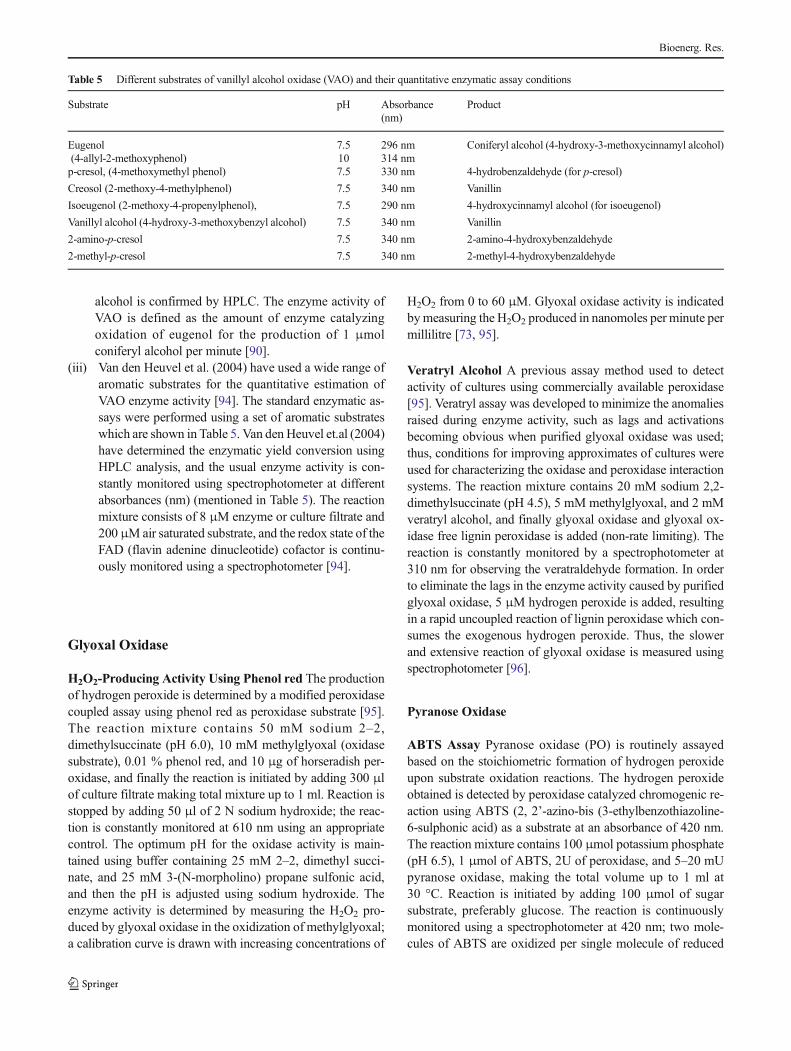
(iii) Van den Heuvel et al. (2004) have used a wide range ofaromatic substrates for the quantitative estimation ofVAO enzyme activity [94]. The standard enzymatic as-says were performed using a set of aromatic substrateswhich are shown in Table 5. Van den Heuvel et.al (2004)have determined the enzymatic yield conversion usingHPLC analysis, and the usual enzyme activity is con-stantly monitored using spectrophotometer at differentabsorbances (nm) (mentioned in Table 5). The reactionmixture consists of 8 μM enzyme or culture filtrate and200μMair saturated substrate, and the redox state of theFAD (flavin adenine dinucleotide) cofactor is continu-ously monitored using a spectrophotometer [94].
Glyoxal Oxidase
H2O2-Producing Activity Using Phenol red The productionof hydrogen peroxide is determined by a modified peroxidasecoupled assay using phenol red as peroxidase substrate [95].The reaction mixture contains 50 mM sodium 2–2,dimethylsuccinate (pH 6.0), 10 mM methylglyoxal (oxidasesubstrate), 0.01 % phenol red, and 10 μg of horseradish per-oxidase, and finally the reaction is initiated by adding 300 μlof culture filtrate making total mixture up to 1 ml. Reaction isstopped by adding 50 μl of 2 N sodium hydroxide; the reac-tion is constantly monitored at 610 nm using an appropriatecontrol. The optimum pH for the oxidase activity is main-tained using buffer containing 25 mM 2–2, dimethyl succi-nate, and 25 mM 3-(N-morpholino) propane sulfonic acid,and then the pH is adjusted using sodium hydroxide. Theenzyme activity is determined by measuring the H2O2 pro-duced by glyoxal oxidase in the oxidization of methylglyoxal;a calibration curve is drawn with increasing concentrations of
H2O2 from 0 to 60 μM. Glyoxal oxidase activity is indicatedbymeasuring the H2O2 produced in nanomoles per minute permillilitre [73, 95].
Veratryl Alcohol A previous assay method used to detectactivity of cultures using commercially available peroxidase[95]. Veratryl assay was developed to minimize the anomaliesraised during enzyme activity, such as lags and activationsbecoming obvious when purified glyoxal oxidase was used;thus, conditions for improving approximates of cultures wereused for characterizing the oxidase and peroxidase interactionsystems. The reaction mixture contains 20 mM sodium 2,2-dimethylsuccinate (pH 4.5), 5 mM methylglyoxal, and 2 mMveratryl alcohol, and finally glyoxal oxidase and glyoxal ox-idase free lignin peroxidase is added (non-rate limiting). Thereaction is constantly monitored by a spectrophotometer at310 nm for observing the veratraldehyde formation. In orderto eliminate the lags in the enzyme activity caused by purifiedglyoxal oxidase, 5 μM hydrogen peroxide is added, resultingin a rapid uncoupled reaction of lignin peroxidase which con-sumes the exogenous hydrogen peroxide. Thus, the slowerand extensive reaction of glyoxal oxidase is measured usingspectrophotometer [96].
Pyranose Oxidase
ABTS Assay Pyranose oxidase (PO) is routinely assayedbased on the stoichiometric formation of hydrogen peroxideupon substrate oxidation reactions. The hydrogen peroxideobtained is detected by peroxidase catalyzed chromogenic re-action using ABTS (2, 2’-azino-bis (3-ethylbenzothiazoline-6-sulphonic acid) as a substrate at an absorbance of 420 nm.The reaction mixture contains 100 μmol potassium phosphate(pH 6.5), 1 μmol of ABTS, 2U of peroxidase, and 5–20 mUpyranose oxidase, making the total volume up to 1 ml at30 °C. Reaction is initiated by adding 100 μmol of sugarsubstrate, preferably glucose. The reaction is continuouslymonitored using a spectrophotometer at 420 nm; two mole-cules of ABTS are oxidized per single molecule of reduced
Table 5 Different substrates of vanillyl alcohol oxidase (VAO) and their quantitative enzymatic assay conditions
Substrate pH Absorbance(nm)
Product
Eugenol(4-allyl-2-methoxyphenol)
7.510
296 nm314 nm
Coniferyl alcohol (4-hydroxy-3-methoxycinnamyl alcohol)
p-cresol, (4-methoxymethyl phenol) 7.5 330 nm 4-hydrobenzaldehyde (for p-cresol)
Creosol (2-methoxy-4-methylphenol) 7.5 340 nm Vanillin
Isoeugenol (2-methoxy-4-propenylphenol), 7.5 290 nm 4-hydroxycinnamyl alcohol (for isoeugenol)
Vanillyl alcohol (4-hydroxy-3-methoxybenzyl alcohol) 7.5 340 nm Vanillin
2-amino-p-cresol 7.5 340 nm 2-amino-4-hydroxybenzaldehyde
2-methyl-p-cresol 7.5 340 nm 2-methyl-4-hydroxybenzaldehyde
Bioenerg. Res.
hydrogen peroxide. The enzyme activity is defined as one unitof pyranose oxidase required for the oxidization of 2 μmolABTS under the standard assay conditions [89].
2,6-Dichlorophenolindophenol (DCPIP) Assay DCPIP is awell-known two-electron acceptor for various flavin-dependent oxidoreductases; pyranose oxidase is usually quan-tified by performing a time-dependent reduction of DCPIPsubstrate. The reaction mixture consists of 150 μM DCPIPin 50 mM phosphate buffer (pH 6.5), 20 mM D-glucose sub-strate at 30 °C. The reaction is initiated by adding 10 μl ofdiluted pyranose oxidase enzyme or an appropriate amount ofculture filtrate; decolorization of the substrate is continuouslymonitored using a spectrophotometer at an absorbance of520 nm. The enzyme activity is defined as one unit of pyra-nose oxidase required for the decolorization (oxidization) ofDCPIP per minute [97].
Galactose Oxidase Galactose oxidase activity is convention-ally monitored by peroxidase-coupled ABTS reaction.Horseradish peroxidase (HRP) catalyzes the oxidization ofABTS substrate by taking up hydrogen peroxide released bygalactose oxidase, resulting in a soluble green-colored endproduct which can be measured using a spectrophotometerat 410 nm. The reaction mixture consists of 8 mg D-galactose,20 mg of ABTS substrate, 300 units or 3.3 mg of horseradishperoxidase dissolved in 20 ml of 100 mM sodium phosphatebuffer at pH 7.0. According to Baron et.al (1994), this methodcan be used both qualitatively and quantitatively for the esti-mation of galactose oxidase [98]. Qualitative assays for galac-tose oxidase contain 90 μl of reagent and 10 μl of culturefiltrate or enzyme solution added to each well and kept aside.The plates are constantly observed for the development ofgreen color; this test is a convenient method for preliminaryanalysis of culture medium. Reaction mixture of quantitativeassay contains 50 μl culture filtrate or enzyme mixed with1.0 ml of reagent, and the reaction is continuously monitoredusing spectrophotometer at 410 nm [98].
Glucose Oxidase Glucose oxidase (GOX) is a highly studiedenzyme for its applications in modern medicine. It is knownthat fungi and insects are the major sources of glucose oxidaseenzyme. GOX also plays a critical role during the biomassdegradation process of fungi by generating hydrogen perox-ide. Different dyes can be used for the quantitative estimationof GOX activity, such as o-Dianisidine [99, 100], ABTS, 2,6-Dichlorophenolindophenol (DCPIP) [100], o-toluidine[101],guaiacum [102], 4-aminophenazone or adrenaline [103], 3-methyl-2-benzothiazolinone hydrazone coupled with N,N–dimethylaniline [104], N,N-diethylaniline oxidatively coupledwith 4-aminophenazone or phenol [105], and leuco PatentBlue Violet [106]. Chemical properties of ABTS such as sol-ubility, safety, and stability makes it highly advantageous
when compared to all the other chemical substrates.Conventionally, GOX is quantified using the peroxidase–glu-cose oxidase coupled reaction, where glucose and oxygenform as a substrate for GOX. The glucose oxidase ABTSassay reaction mixture consists of 1 ml of 100 mM sodiumphosphate buffer (pH 6.0), 0.5 ml of 1 M glucose, 0.1 ml of1 mg/ml of ABTS in distilled water, and finally 0.1 ml of2 mg/ml horseradish peroxidase (HRP) in sodium phosphatebuffer (pH 6.0). The oxidized product of ABTS forms a green-colored product which can be continuously monitored usingspectrophotometer at 414 nm. One unit of enzyme activity isdefined as the amount of GOX required for the oxidization of1 μmol of ABTS per minute at standard conditions [107, 108].
Fluorometric Method Using Homovanillic Acid Guilbaultet al. (1968) have proposed a new fluorometric method usinghomovanillic acid for determining the activity of oxidativeenzymes such as peroxidases and glucose oxidases [109].This method involves the conversion of non-fluorescenthomovanillic acid to fluorescent 2,2’-dihydroxy −3,3’-dimethoxybiphenyl-5,5’-diacetic acid; the rate of formationof fluorescent compound is related to the activity of the en-zyme [109]. The reaction mixture contains 2.7 ml of 0.1M trisbuffer (pH8.0) mixed with 0.1 ml of stock solution, 0.1 Mglucose solution, 0.1 ml of 2.5 mg/ml homovanillic acid,and 0.1 ml of 0.75 mg /ml peroxidase solution (HRP). Thereaction is initiated by adding 0.1 ml of glucose oxidase solu-tion to the reactionmixture; the whole reaction is continuouslymon i to r ed fo r change in f l uo r e scence us ing aspectrophotofluorometer [109].
Benzoquinone Reductase The enzymatic activity of benzo-quinone reductase can be performed by two different methods,using 2,6-dimethoxy-1,4-benzoquinone (2,6-DMBQ) or 1,4-benzoquinone and NADH [110–112]. Enzyme activity of qui-none reductases is routinely assayed using 2,6-DMBQ; thismethod estimates the oxidation of NADH by quinone reduc-tase. The reaction mixture using 2,6-DMBQ contains 1 ml of50 mM sodium citrate buffer with pH 6.0, 100 μM 2,6-DMBQ, and benzoquinone reductase enzyme. Reaction is ini-tiated by adding 200 μM NADH to the reaction mixture atroom temperature. The whole reaction is monitored using aspectrophotometer at 340 nm [110]. Benzoquinone reductaseenzyme activity can also be assessed quantitatively using 1,4-benzoquinone, where the reaction mixture consists of 25 mMTris–HCl buffer with pH 8.0, 250 μM 1,4-benzoquinone,200 μM NADH, and benzoquinone reductase. Reaction isinitiated by the addition of NADH; the total reaction is mon-itored using spectrophotometer at 340 nm [111]. Constamet al. (1991) used structurally different quinones for assayingquinone reductase enzyme [112]; this assay consists of 25mMTris/HCl buffer (pH 8.0), 250 μM of different quinone struc-tures (QI, QII, QIII and QIV) [112], and 200 μM of NADH,
Bioenerg. Res.
and an appropriate amount of enzyme is added. The wholereaction is continuously observed at 340 nm using spectropho-tometer; this method has shown the non-enzymaticoxidization of NADH by quinones. The enzyme activity isdefined as one unit of quinone reductase required for theoxidization of 1 μM of NADH per minute [112].
In order to gain a complete understanding about the lignin-degrading abilities of the microorganisms, it is important tocomprehend the underlying molecular pathways required forthe expression of lignin-degrading enzymes. At the same time,it is also equally important to study the functional and struc-tural properties of these ligninolytic enzymes, which can beachieved by employing various well-established protein andgene characterization techniques. A number of research arti-cles on gene and protein characterization techniques are avail-able, and a few are listed below to indicate the standard pro-tocols [89, 90, 96, 110, 113–119].
Concluding Remarks
The intricate structure of lignin can potentially be a valu-able source for the production of commercially valuableplatform chemicals. Efficient utilization of lignin and oth-er cell-wall polysaccharides such as cellulose and hemi-cellulose are significantly dependent on their efficientseparation. Traditional methods for the isolation and char-acterization of lignin-degrading microorganisms were al-ready well established. However, selecting an efficientmethod for qualitative and quantitative characterizationof lignin-degrading microbes and their respectiveligninolytic enzymes is difficult. This article intensivelyreviews all the reported methods up to the present, andcompares the advantages and disadvantages of each meth-od. It also provides useful guidelines for selecting theappropriate isolation and characterization methods basedon their cost, time, and method efficiencies. In the pastdecade, there has been a tremendous advancement in thefield of genomics, especially next-generation sequencing.The whole genome sequences of prominent wood-degrading fungi such as P. chrysosporium and Postiaplacenta have revealed high-quality information abouttheir lignocellulose-degrading abilities on a large scale[120, 121]. These studies have resulted in a rapid increasein whole genome and transcriptome studies of variouswood-decaying microorganims using DNA, RNA, andChIP sequencing protocols [122, 123]. Thus, well-designed experiments with a combination of traditionallow throughput and recent state of the art high-throughput methods will be powerful in identifying andcharacterizing lignin-degrading microorganims and theirmolecular pathways.
Acknowledgments This work was supported by NSERC-RDF fund toWensheng Qin and Ontario Trillium Scholarship (OTS) to AyyappaKumar Sista Kameshwar.
References
1. Sattler SE, Funnell-Harris DL (2013)Modifying lignin to improvebioenergy feedstocks: strengthening the barrier against pathogens.Front Plant Sci 4:70. doi:10.3389/fpls.2013.00070
2. Kumar P, Barrett DM, Delwiche MJ, Stroeve P (2009) Methodsfor pretreatment of lignocellulosic biomass for efficient hydrolysisand biofuel production. Ind Eng Chem Res 48(8):3713–3729
3. Ragauskas AJ, Beckham GT, Biddy MJ, Chandra R, Chen F,Davis MF, Davison BH, Dixon RA, Gilna P, Keller M (2014)Lignin valorization: improving lignin processing in thebiorefinery. Science 344(6185):1246843
4. Rinaldi R, Jastrzebski R, Clough MT, Ralph J, Kennema M,Bruijnincx PC,Weckhuysen BM (2016) Paving the way for ligninvalorisation: recent advances in bioengineering, biorefining andcatalysis. Angew Chem Int Ed Engl 55(29):8164–8215
5. Bugg TD, Ahmad M, Hardiman EM, Singh R (2011) The emerg-ing role for bacteria in lignin degradation and bio-product forma-tion. Curr Opin Biotechnol 22(3):394–400
6. Pollegioni L, Tonin F, Rosini E (2015) Lignin‐degrading enzymes.FEBS J 282(7):1190–1213
7. Kirk TK, Farrell RL (1987) Enzymatic Bcombustion^: the micro-bial degradation of lignin. Annu Rev Microbiol 41(1):465–501
8. Levasseur A, Piumi F, Coutinho PM, Rancurel C, Asther M,Delattre M, Henrissat B, Pontarotti P, Asther M, Record E(2008) FOLy: an integrated database for the classification andfunctional annotation of fungal oxidoreductases potentially in-volved in the degradation of lignin and related aromatic com-pounds. Fungal Genet Biol 45(5):638–645
9. Morii H, Nakamiya K, Kinoshita S (1995) Isolation of a lignin-decolorizing bacterium. J Ferment Bioeng 80(3):296–299
10. Pfennig N, Lippert KD (1966) Über das vitamin B12-Bedürfnisphototropher Schwefelbakterien. Arch Mikrobiol 55(3):245–256
11. Raj A, Reddy MK, Chandra R, Purohit HJ, Kapley A (2007)Biodegradation of kraft-lignin by Bacillus sp. isolated from sludgeof pulp and paper mill. Biodegradation 18(6):783–792
12. Haq I, Kumar S, Kumari V, Singh SK, Raj A (2016) Evaluation ofbioremediation potentiality of ligninolytic Serratia liquefaciens fordetoxification of pulp and paper mill effluent. J HazardMater 305:190–199
13. Chakar FS, Ragauskas AJ (2004) Review of current and futuresoftwood kraft lignin process chemistry. Ind Crop Prod 20(2):131–141
14. Pointing S (2001) Feasibility of bioremediation bywhite-rot fungi.Appl Microbiol Biotechnol 57(1–2):20–33
15. Cripps C, Bumpus JA, Aust S (1990) Biodegradation of azo andheterocyclic dyes by Phanerochaete chrysosporium. Appl EnvironMicrobiol 56(4):1114–1118
16. Rodriguez E, Pickard MA, Vazquez-Duhalt R (1999) Industrialdye decolorization by laccases from ligninolytic fungi. CurrMicrobiol 38(1):27–32
17. Abadulla E, Tzanov T, Costa S, Robra K-H, Cavaco-Paulo A,Gübitz GM (2000) Decolorization and detoxification of textiledyes with a laccase from Trametes hirsuta. Appl EnvironMicrobiol 66(8):3357–3362
18. Podgornik H, Poljanšek I, Perdih A (2001) Transformation ofIndigo carmine by Phanerochaete chrysosporium ligninolytic en-zymes. Enzym Microb Technol 29(2):166–172
Bioenerg. Res.
19. Spadaro JT, Gold MH, Renganathan V (1992) Degradation of azodyes by the lignin-degrading fungus Phanerochaetechrysosporium. Appl Environ Microbiol 58(8):2397–2401
20. Heinfling A, Bergbauer M, Szewzyk U (1997) Biodegradation ofazo and phthalocyanine dyes by Trametes versicolor andBjerkandera adusta. Appl Microbiol Biotechnol 48(2):261–266
21. Levin L, Papinutti L, Forchiassin F (2004) Evaluation ofArgentinean white rot fungi for their ability to produce lignin-modifying enzymes and decolorize industrial dyes. BioresourTechnol 94(2):169–176
22. Bandounas L, Wierckx NJ, de Winde JH, Ruijssenaars HJ (2011)Isolation and characterization of novel bacterial strains exhibitingligninolytic potential. BMC Biotechnol 11(1):94
23. Pointing SB (1999) Qualitative methods for the determination oflignocellulolytic enzyme production by tropical fungi. FungalDiversity 2:17–33
24. Sundman V, Nase L (1971) A simple plate test for direct visuali-zation of biological lignin degradation. Paperi ja puu 2:67–71
25. Tekere M, Mswaka A, Zvauya R, Read J (2001) Growth, dyedegradation and ligninolytic activity studies on Zimbabweanwhite rot fungi. Enzym Microb Technol 28(4):420–426
26. Bavendamm W (1928) Über das Vorkommen und den Nachweisvon Oxydasen bei holzzerstörenden Pilzen. Z PflanzenkrPflanzenschutz 38(9/10):257–276
27. Temp U, Eggert C, Eriksson K-EL (1998) A small-scale methodfor screening of lignin-degrading microorganisms. Appl EnvironMicrobiol 64(4):1548–1549
28. Eriksson K-EL, Blanchette R, Ander P (2012) Microbial and en-zymatic degradation of wood and wood components. SpringerScience & Business Media, Berlin Heidelberg
29. Haider K, Trojanowski J (1975) Decomposition of specifically14C-labelled phenols and dehydropolymers of coniferyl alcoholas models for lignin degradation by soft and white rot fungi. ArchMicrobiol 105(1):33–41
30. Rajan JS, Srinivasan V (1992) A colorimetric assay for ligninbased on its reaction with diazotized sulfanilic acid and its use instudies on lignin biodegradation by bacteria. Biotechnol Tech6(3):219–222
31. Ahmad M, Taylor CR, Pink D, Burton K, Eastwood D, BendingGD, Bugg TD (2010) Development of novel assays for lignindegradation: comparative analysis of bacterial and fungal lignindegraders. Mol Biosyst 6(5):815–821
32. Zimmermann W, Paterson A, Broda P (1988) Conventional andhigh-performance size-exclusion chromatography ofgraminaceous lignin–carbohydrate complexes. MethodsEnzymol 161:191–199
33. McAuliffe L, Ellis RJ, Lawes JR, Ayling RD, Nicholas RA (2005)16S rDNA PCR and denaturing gradient gel electrophoresis; asingle generic test for detecting and differentiating Mycoplasmaspecies. J Med Microbiol 54(8):731–739
34. Muyzer G, Smalla K (1998) Application of denaturing gradientgel electrophoresis (DGGE) and temperature gradient gel electro-phoresis (TGGE) in microbial ecology. Antonie VanLeeuwenhoek 73(1):127–141
35. Muyzer G, De Waal EC, Uitterlinden AG (1993) Profiling ofcomplex microbial populations by denaturing gradient gel electro-phoresis analysis of polymerase chain reaction-amplified genescoding for 16S rRNA. Appl Environ Microbiol 59(3):695–700
36. Sheffield VC, Cox DR, Lerman LS, Myers RM (1989)Attachment of a 40-base-pair G+ C-rich sequence (GC-clamp)to genomic DNA fragments by the polymerase chain reactionresults in improved detection of single-base changes. Proc NatlAcad Sci 86(1):232–236
37. Niku-PaavolaM, Raaska L, ItävaaraM (1990) Detection of white-rot fungi by a non-toxic stain. Mycol Res 94(1):27–31
38. Thurston CF (1994) The structure and function of fungal laccases.Microbiology 140(1):19–26
39. Soden D, O’callaghan J, Dobson A (2002) Molecular cloning of alaccase isozyme gene from Pleurotus sajor-caju and expression inthe heterologous Pichia pastoris host. Microbiology 148(12):4003–4014
40. Harkin JM, Larsen MJ, Obst JR (1974) Use of syringaldazine fordetection of laccase in sporophores of wood rotting fungi.Mycologia 66:469–476
41. Duffey S, Aldrich J, Blum M (1977) Biosynthesis of phenol andguaiacol by the hemipteran Leptoglossus phyllopus. CompBiochem Physiol B 56(2):101–102
42. Dorfner R, Ferge T, Kettrup A, Zimmermann R, Yeretzian C(2003) Real-time monitoring of 4-vinylguaiacol, guaiacol, andphenol during coffee roasting by resonant laser ionization time-of-flight mass spectrometry. J Agric Food Chem 51(19):5768–5773
43. Sheikhi F, Ardakani MR, Enayatizamir N, Rodriguez-Couto S(2012) The determination of assay for laccase of Bacillus subtilisWPI with two classes of chemical compounds as substrates.Indian J Microbiol 52(4):701–707
44. Kiiskinen LL, Rättö M, Kruus K (2004) Screening for novellaccase‐producing microbes. J Appl Microbiol 97(3):640–646
45. López M, Guisado G, Vargas-García M, Suárez-Estrella F,Moreno J (2006) Decolorization of industrial dyes by ligninolyticmicroorganisms isolated from composting environment. EnzymMicrob Technol 40(1):42–45
46. Childs RE, Bardsley WG (1975) The steady-state kinetics of per-oxidase with 2, 2′-azino-di-(3-ethyl-benzthiazoline-6-sulphonicacid) as chromogen. Biochem J 145:93–103
47. Johannes C, Majcherczyk A (2000) Laccase activity tests andlaccase inhibitors. J Biotechnol 78(2):193–199
48. Heinzkill M, Bech L, Halkier T, Schneider P, Anke T (1998)Characterization of laccases and peroxidases from wood-rottingfungi (family Coprinaceae). Appl Environ Microbiol 64(5):1601–1606
49. Edens WA, Goins TQ, Dooley D, Henson JM (1999) Purificationand characterization of a secreted laccase of Gaeumannomycesgraminis var. tritici. Appl Environ Microbiol 65(7):3071–3074
50. Prillinger H, Esser K (1977) The phenoloxidases of the ascomy-cete Podospora anserina. Mol Gen Genet 156(3):333–345
51. Harkin JM, Obst JR (1973) Syringaldazine, an effective reagentfor detecting laccase and peroxidase in fungi. Experientia 29(4):381–387
52. Dedeyan B, Klonowska A, Tagger S, Tron T, Iacazio G, Gil G, LePetit J (2000) Biochemical and molecular characterization of alaccase from Marasmius quercophilus. Appl Environ Microbiol66(3):925–929
53. Collins PJ, KottermanM, Field JA, DobsonA (1996)Oxidation ofAnthracene and Benzo[a]pyrene by Laccases from Trametesversicolor. Appl Environ Microbiol 62(12):4563–4567
54. Johannes C, Majcherczyk A, Hüttermann A (1996) Degradationof anthracene by laccase of Trametes versicolor in the presence ofdifferent mediator compounds. Appl Microbiol Biotechnol 46(3):313–317
55. Majcherczyk A, Johannes C, Hüttermann A (1998) Oxidation ofpolycyclic aromatic hydrocarbons (PAH) by laccase of Trametesversicolor. Enzym Microb Technol 22(5):335–341
56. Johannes C, Majcherczyk A, Hüttermann A (1998) Oxidation ofacenaphthene and acenaphthylene by laccase of Trametesversicolor in a laccase-mediator system. J Biotechnol 61(2):151–156
57. Pickard MA, Roman R, Tinoco R, Vazquez-Duhalt R (1999)Polycyclic aromatic hydrocarbon metabolism by white rot fungiand oxidation by Coriolopsis gallica UAMH 8260 laccase. ApplEnviron Microbiol 65(9):3805–3809
Bioenerg. Res.
58. Alcalde M, Bulter T (2003) Colorimetric assays for screeninglaccases. In: Arnold FH, Giorgiu G (eds.) Directed enzyme evo-lution. Springer, Berlin Heidelberg, pp 193–201
59. Glenn JK, Gold MH (1983) Decolorization of several polymericdyes by the lignin-degrading basidiomycete Phanerochaetechrysosporium. Appl Environ Microbiol 45(6):1741–1747
60. Gold MH, Glenn JK, Alic M (1988). Use of polymericdyes inlignin biodegradation assays. Methods Enzymol161:74–78
61. Xu F (1996) Catalysis of novel enzymatic iodide oxidation byfungal laccase. Appl Biochem Biotechnol 59(3):221–230
62. Gabler M, Hensel M, Fischer L (2000) Detection and substrateselectivity of new microbial D-amino acid oxidases. EnzymMicrob Technol 27(8):605–611
63. Lonergan G, Baker W (1995) Comparative study of substrates offungal laccase. Lett Appl Microbiol 21(1):31–33
64. Boominathan K, Reddy C, Arora D, Elander R, Mukerji K (1992)Handbook of applied mycology. Marcel Dekker, New York
65. Pointing S, Vrijmoed L, Jones E (1999) Laccase is produced as thesole lignin-modifying enzyme in submerged liquid culture by thewhite-rot fungus Pycnoporus sanguineus L. Mycologia 91:345–349
66. Pointing S, Vrijmoed L, Jones E (1998) A qualitative assessmentof lignocellulose degrading enzyme activity in marine fungi. BotMar 41(1–6):293–298
67. Archibald FS (1992) A new assay for lignin-type peroxidasesemploying the dye azure B. Appl Environ Microbiol 58(9):3110–3116
68. Magalhães DB, de Carvalho MEA, Bon E, Neto JSA, Kling SH(1996) Colorimetric assay for lignin peroxidase activity determi-nation using methylene blue as substrate. Biotechnol Tech 10(4):273–276
69. Brown JA, Li D, Alic M, Gold MH (1993) Heat shock inductionof manganese peroxidase gene transcription in Phanerochaetechrysosporium. Appl Environ Microbiol 59(12):4295–4299
70. Arora DS, Gill PK (2001) Comparison of two assay proceduresfor lignin peroxidase. Enzym Microb Technol 28(7):602–605
71. Tariq V-N, Irvine W (1995) Ligninolytic enzyme activity: a com-parison of the veratryl alcohol and Azure B assay systems.Biotechnol Tech 9(3):197–202
72. Paszczyński A, Crawford RL, Huynh V-B (1988) Manganese per-oxidase of Phanerochaete chrysosporium: purification. MethodsEnzymol 161C:264–270
73. Vares T, Kalsi M, Hatakka A (1995) Lignin peroxidases, manga-nese peroxidases, and other ligninolytic enzymes produced byphlebia radiata during solid-state fermentation of wheat straw.Appl Environ Microbiol 61(10):3515–3520
74. Orth AB, Royse D, Tien M (1993) Ubiquity of lignin-degradingperoxidases among various wood-degrading fungi. Appl EnvironMicrobiol 59(12):4017–4023
75. Paszczyński A, Huynh V-B, Crawford R (1985) Enzymatic activ-ities of an extracellular, manganese-dependent peroxidase fromPhanerochaete chrysosporium. FEMS Microbiol Lett 29(1–2):37–41
76. Martinez MJ, Ruiz-Duenas FJ, Guillen F, Martinez AT (1996)Purification and catalytic properties of two manganese peroxidaseisoenzymes from Pleurotus eryngii. Eur J Biochem 237(2):424–432
77. Vasilchenko LG, Ludwig R, Yershevich OP, Haltrich D,Rabinovich ML (2012) High‐throughput screening for cellobiosedehydrogenases by Prussian Blue in situ formation. Biotechnol J7(7):919–930
78. Kremer SM, Wood PM (1992) Evidence that cellobiose oxidasefrom Phanerochaete chrysosporium is primarily an Fe (III)reductas. Eur J Biochem 205(1):133–138
79. Baminger U, Subramaniam SS, Renganathan V, Haltrich D (2001)Purification and characterization of cellobiose dehydrogenase
from the plant pathogen Sclerotium (Athelia) rolfsii. ApplEnviron Microbiol 67(4):1766–1774
80. Baminger U, Nidetzky B, Kulbe KD, Haltrich D (1999) A simpleassay for measuring cellobiose dehydrogenase activity in the pres-ence of laccase. J Microbiol Methods 35(3):253–259
81. Henriksson G, Polk V, Eriksson K-E (1997) Assay for cellobiosedehydrogenase in the presence of laccase. Biotechnol Tech 11(10):743–745
82. Guillen F, Martinez AT, Martinez MJ (1992) Substrate specificityand properties of the aryl‐alcohol oxidase from the ligninolyticfungus Pleurotus eryngii. Eur J Biochem 209(2):603–611
83. Gutierrez A, Caramelo L, Prieto A, Martínez MJ, Martinez AT(1994) Anisaldehyde production and aryl-alcohol oxidase and de-hydrogenase activities in ligninolytic fungi of the genus Pleurotus.Appl Environ Microbiol 60(6):1783–1788
84. Ruiz-Dueñas FJ, Ferreira P, Martínez MJ, Martínez AT (2006)In vitro activation, purification, and characterization ofEscherichia coli expressed aryl-alcohol oxidase, a unique H 2 O2-producing enzyme. Protein Expr Purif 45(1):191–199
85. Ferreira P, Hernández-Ortega A, Herguedas B, Rencoret J,Gutiérrez A, Martinez M, Jiménez-Barbero J, Medina M (2010)Kinetic and chemical characterization of aldehyde oxidation byfungal aryl-alcohol oxidase. Biochem J 425:585–593
86. Tamboli DP, Telke AA, Dawkar VV, Jadhav SB, Govindwar SP(2011) Purification and characterization of bacterial aryl alcoholoxidase from Sphingobacterium sp. ATM and its uses in textiledye decolorization. Biotechnol Bioprocess Eng 16(4):661–668
87. Feldman D, Kowbel DJ, Glass NL, Yarden O, Hadar Y (2015)Detoxification of 5-hydroxymethylfurfural by the Pleurotusostreatus lignolytic enzymes aryl alcohol oxidase and dehydroge-nase. Biotechnol Biofuels 8(1):63
88. Ferreira P, Medina M, Guillén F, Martinez M, Van Berkel W,Martinez A (2005) Spectral and catalytic properties of aryl-alcohol oxidase, a fungal flavoenzyme acting on polyunsaturatedalcohols. Biochem J 389:731–738
89. Danneel HJ, Rossner E, Zeeck A, Giffhorn F (1993) Purificationand characterization of a pyranose oxidase from the basidiomycetePeniophora gigantea and chemical analyses of its reaction prod-ucts. Eur J Biochem 214(3):795–802
90. Furukawa H, Wieser M, Morita H, Sugio T, Nagasawa T (1999)Purification and characterization of vanillyl-alcohol oxidase fromByssochlamys fulva V107. J Biosci Bioeng 87(3):285–290
91. FraaijeMW,Veeger C, van BerkelWJ (1995) Substrate specificityof flavin-dependent vanillyl-alcohol oxidase from Penicilliumsimplicissimum. Eur J Biochem 234:271–277
92. Jong E, Berkel WJ, Zwan RP, Bont JA (1992) Purification andcharacterization of vanillyl‐alcohol oxidase from Penicilliumsimplicissimum. Eur J Biochem 208(3):651–657
93. Fraaije MW, Pikkemaat M, Van Berkel W (1997) Enigmatic gra-tuitous induction of the covalent flavoprotein vanillyl-alcohol ox-idase in Penicillium simplicissimum. Appl Environ Microbiol63(2):435–439
94. van den Heuvel RH, van den Berg WA, Rovida S, van Berkel WJ(2004) Laboratory-evolved vanillyl-alcohol oxidase produces nat-ural vanillin. J Biol Chem 279(32):33492–33500
95. Kersten PJ, Kirk TK (1987) Involvement of a new enzyme,glyoxal oxidase, in extracellular H2O2 production byPhanerochaete chrysosporium. J Bacteriol 169(5):2195–2201
96. Kersten PJ (1990) Glyoxal oxidase of Phanerochaetechrysosporium: its characterization and activation by lignin per-oxidase. Proc Natl Acad Sci 87(8):2936–2940
97. Brugger D, Krondorfer I, Shelswell C, Huber-Dittes B, Haltrich D,Peterbauer CK (2014) Engineering pyranose 2-oxidase for modi-fied oxygen reactivity. PLoS One 8(9):e109242
98. Baron AJ, Stevens C, Wilmot C, Seneviratne KD, Blakeley V,Dooley DM, Phillips S, Knowles PF, McPherson MJ (1994)
Bioenerg. Res.

Structure and mechanism of galactose oxidase. The free radicalsite. J Biol Chem 269(40):25095–25105
99. Raba J, Mottola HA (1995) Glucose oxidase as an analytical re-agent. Crit Rev Anal Chem 25(1):1–42
100. Dobrick LA (1958) Screening method for glucose of blood serumutilizing glucose oxidase and an indophenol indicator. J BiolChem 231(1):403–409
101. Salomon L, Johnson JE (1959) Enzymatic microdetermination ofglucose in blood and urine. Anal Chem 31(3):453–456
102. Morley G, Dawson A, Marks V (1968) Manual and autoanalyzermethods for measuring blood glucose using guaiacum and glucoseoxidase. Assoc Clin Biochem Proc 5(2):42–45
103. Trinder P (1969) Determination of blood glucose using anoxidase-peroxidase system with a non-carcinogenic chromogen.J Clin Pathol 22(2):158–161
104. Werner W, Rey H-G, Wielinger H (1970) Über die Eigenschafteneines neuen Chromogens für die Blutzuckerbestimmung nach derGOD/POD-Methode. Fresenius’ ZAnal Chem 252(2–3):224–228
105. Kabasakalian P, Kalliney S, Westcott A (1974) Enzymatic bloodglucose determination by colorimetry of N, N-diethylaniline-4-aminoantipyrine. Clin Chem 20(5):606–607
106. Clapp PA, Evans DF (1991) Spectrophotometric determination ofhydrogen peroxide with leuco Patent Blue Violet. Anal ChimActa243:217–220
107. Bateman RC Jr, Evans JA (1995) Using the glucose oxidase/peroxidase system in enzyme kinetics. J Chem Educ 72(12):A240
108. Betancor L, López-Gallego F, Hidalgo A, Alonso-Morales N,Dellamora-Ortiz G, Guisán JM, Fernández-Lafuente R (2006)Preparation of a very stable immobilized biocatalyst of glucoseoxidase from Aspergillus niger. J Biotechnol 121(2):284–289
109. Guilbault GG, Brignac PJ Jr, ZimmerM (1968) Homovanillic acidas a fluorometric substrate for oxidative enzymes. Analytical ap-plications of the peroxidase, glucose oxidase, and xanthine oxi-dase systems. Anal Chem 40(1):190–196
110. Brock BJ, Rieble S, Gold MH (1995) Purification and character-ization of a 1, 4-benzoquinone reductase from the basidiomycetePhanerochaete chrysosporium. Appl Environ Microbiol 61(8):3076–3081
111. Kim K (2002) Characterization of 1, 4-benzoquinone reductasefrom bovine liver. Biotechnol Bioprocess Eng 7(4):216–220
112. Constam D, Muheim A, Zimmermann W, Fiechter A (1991)Purification and partial characterization of an intracellular
NADH: quinone oxidoreductase from Phanerochaetechrysosporium. J Gen Microbiol 137(9):2209–2214
113. Rehman AU, Thurston CF (1992) Purification of laccase I fromArmillaria mellea. Microbiology 138(6):1251–1257
114. Yadav M, Yadav P, Yadav KDS (2009) Purification and character-ization of lignin peroxidase from Loweporus lividus MTCC‐1178.Eng Life Sci 9(2):124–129
115. Cheng X, Jia R, Li P, Tu S, Zhu Q, Tang W, Li X (2007)Purification of a new manganese peroxidase of the white-rot fun-gus Schizophyllum sp. F17, and decolorization of azo dyes by theenzyme. Enzym Microb Technol 41(3):258–264
116. Asada Y, Watanabe A, Ohtsu Y, Kuwahara M (1995) Purificationand characterization of an aryl-alcohol oxidase from the lignin-degrading basidiomycete Phanerochaete chrysosporium. BiosciBiotechnol Biochem 59(7):1339–1341
117. Leitner C, Volc J, Haltrich D (2001) Purification and characteriza-tion of pyranose oxidase from the white rot fungus Trametes mul-ticolor. Appl Environ Microbiol 67(8):3636–3644
118. Paukner R, Staudigl P, Choosri W, Haltrich D, Leitner C (2015)Expression, purification, and characterization of galactose oxidaseof Fusarium sambucinum in E. coli. Protein Expr Purif 108:73–79
119. Swoboda BE, Massey V (1965) Purification and properties of theglucose oxidase from Aspergillus niger. J Biol Chem 240(5):2209–2215
120. Martinez D, Larrondo LF, Putnam N, Gelpke MDS, Huang K,Chapman J, Helfenbein KG, Ramaiya P, Detter JC, Larimer F(2004) Genome sequence of the lignocellulose degrading fungusPhanerochaete chrysosporium strain RP78. Nat Biotechnol 22(6):695–700
121. Martinez D, Challacombe J, Morgenstern I, Hibbett D, SchmollM, Kubicek CP, Ferreira P, Ruiz-Duenas FJ, Martinez AT, KerstenP (2009) Genome, transcriptome, and secretome analysis of wooddecay fungus Postia placenta supports unique mechanisms of lig-nocellulose conversion. Proc Natl Acad Sci 106(6):1954–1959
122. Kameshwar AkS QW (2016) Recent developments in using ad-vanced sequencing technologies for the genomic studies of ligninand cellulose degrading microorganisms. Int J Biol Sci 12(2):156–171
123. Ohm RA, Riley R, Salamov A, Min B, Choi I-G, Grigoriev IV(2014) Genomics of wood-degrading fungi. Fungal Genet Biol 72:82–90
Bioenerg. Res.