Embed Size (px)
Citation preview
i
Qualitative and quantitative diagnosis of macro and micronutrient deficiencies in soils across three agro-ecological environments of northern Nigeria using the
double-pot technique
S. K. Foli July 2012

ii

iii
Qualitative and quantitative diagnosis of macro and micronutrient deficiencies in soils across three agro-ecological environments of northern Nigeria using the double-pot technique
S. K. Foli MSc internship report Plant Production Systems group Course code: PPS-70424 Wageningen University July 2012 Supervisors: Dr Linus Franke Farming Systems Researcher (N2Africa project www.n2africa.org) Plant Production Systems Wageningen University Prof Abdullahi Bala Department of Soil Science Federal University of Technology Minna, Nigeria Examiner: Prof Ken Giller Chair Plant Production Systems Department of Plant Sciences Wageningen University Plant Production Systems Group Wageningen University and Research Centre P.O. Box 430, 6700AK, Wageningen The Netherlands

iv
Acknowledgements This internship was conducted within the N2Africa project in partial fulfilment of the MSc Plant Sciences with specialisation (C) Natural Resource Management of Wageningen University (WUR). My sincere gratitude go to Dr Linus Franke and Professor Ken Giller of the Plant Production Systems group of WUR for making it possible to carry out the work in Nigeria. I also wish to thank the Agronomy team leader of the project Dr Frederick Baijukya for his guidance in designing the experiment. Professor Abdullahi Bala was my supervisor on the ground and his feedback contributed greatly to the success of the experiment. I therefore would like to acknowledge his assistant as well as that of fellow N2Africa project staff in Nigeria for their logistical support throughout the entire phase of this work. Especially Mercy Ijeh and Esther Chinedu, many thanks for your immense dedication.
v
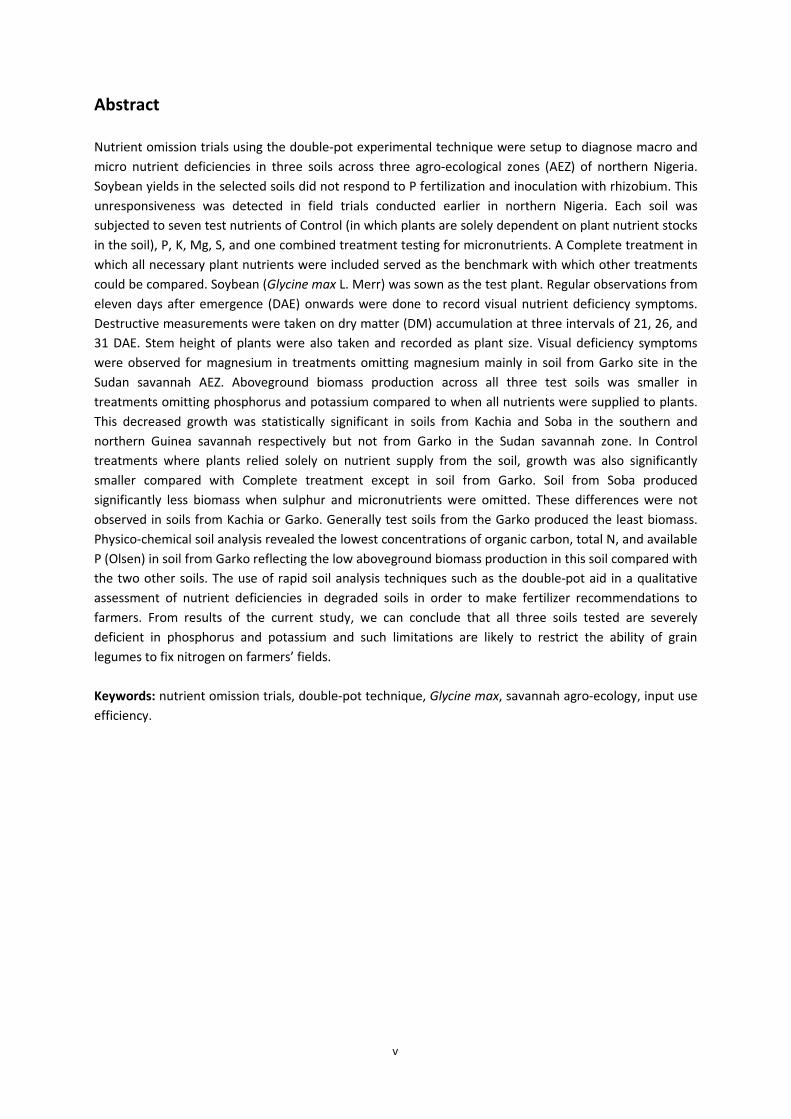
Abstract Nutrient omission trials using the double-pot experimental technique were setup to diagnose macro and micro nutrient deficiencies in three soils across three agro-ecological zones (AEZ) of northern Nigeria. Soybean yields in the selected soils did not respond to P fertilization and inoculation with rhizobium. This unresponsiveness was detected in field trials conducted earlier in northern Nigeria. Each soil was subjected to seven test nutrients of Control (in which plants are solely dependent on plant nutrient stocks in the soil), P, K, Mg, S, and one combined treatment testing for micronutrients. A Complete treatment in which all necessary plant nutrients were included served as the benchmark with which other treatments could be compared. Soybean (Glycine max L. Merr) was sown as the test plant. Regular observations from eleven days after emergence (DAE) onwards were done to record visual nutrient deficiency symptoms. Destructive measurements were taken on dry matter (DM) accumulation at three intervals of 21, 26, and 31 DAE. Stem height of plants were also taken and recorded as plant size. Visual deficiency symptoms were observed for magnesium in treatments omitting magnesium mainly in soil from Garko site in the Sudan savannah AEZ. Aboveground biomass production across all three test soils was smaller in treatments omitting phosphorus and potassium compared to when all nutrients were supplied to plants. This decreased growth was statistically significant in soils from Kachia and Soba in the southern and northern Guinea savannah respectively but not from Garko in the Sudan savannah zone. In Control treatments where plants relied solely on nutrient supply from the soil, growth was also significantly smaller compared with Complete treatment except in soil from Garko. Soil from Soba produced significantly less biomass when sulphur and micronutrients were omitted. These differences were not observed in soils from Kachia or Garko. Generally test soils from the Garko produced the least biomass. Physico-chemical soil analysis revealed the lowest concentrations of organic carbon, total N, and available P (Olsen) in soil from Garko reflecting the low aboveground biomass production in this soil compared with the two other soils. The use of rapid soil analysis techniques such as the double-pot aid in a qualitative assessment of nutrient deficiencies in degraded soils in order to make fertilizer recommendations to farmers. From results of the current study, we can conclude that all three soils tested are severely deficient in phosphorus and potassium and such limitations are likely to restrict the ability of grain legumes to fix nitrogen on farmers’ fields. Keywords: nutrient omission trials, double-pot technique, Glycine max, savannah agro-ecology, input use efficiency.

vi
Table of Content
Acknowledgements ........................................................................................................................................ iv
Abstract ........................................................................................................................................................... v
1. Introduction ................................................................................................................................................. 7
2. Materials and Methods ............................................................................................................................... 9
2.1 Description of double pot-technique ..................................................................................................... 9
2.2 Site selection and soil sampling ............................................................................................................. 9
2.3 Experimental factors and design .......................................................................................................... 11
2.4 Setup and experiment management ................................................................................................... 11
2.5 Harvest and measurements ................................................................................................................. 12
2.6 Mathematical and statistical analysis .................................................................................................. 12
3. Results ....................................................................................................................................................... 15
3.1 Visual deficiencies symptoms .............................................................................................................. 15
3.2 Growth and biomass production ......................................................................................................... 16
3.3 Relative growth and nutrient sufficiency quotients............................................................................. 20
3.4 Nutrient analysis .................................................................................................................................. 21
4. Discussion .................................................................................................................................................. 23
4.1 Methodology ........................................................................................................................................ 23
4.2 Nutrient deficiencies and aboveground biomass production .............................................................. 23
4.3 Implications for nitrogen fixation......................................................................................................... 24
5. Conclusions ................................................................................................................................................ 25
6. References ................................................................................................................................................. 27
7. Appendices ................................................................................................................................................ 29
7.1 Experimental plan and layout of screen house .................................................................................... 29
7.2 Composition of nutrient solutions ....................................................................................................... 31
7.3 Average nutrient concentration of aboveground plant biomass (ICP-AES Analysis) ........................... 32
7
1. Introduction Throughout the savannah zones of the north where agriculture is characterised to be intensive (Harris and Yusuf 2001), the use of external inputs are generally low resulting in continuous removal of plant nutrients from the soil (Smalling, Nandwa et al. 1997). Despite the low soil fertility levels in these savannah regions, crop yields are not always correspondingly low and farmers are sometimes able to record good yields nearing potential for that agro-ecological zone (Vanlauwe, Diels et al. 2002). Contrary to widespread belief, the number of farmers that apply inorganic fertilizers is high. Farmer surveys by Manyong et al. (2001) revealed that 97 per cent of farmers in study areas of the northern Guinea savannah apply inorganic fertilizers of one sort or the other to their fields. Farmers often address low soil fertility of their fields through application of NPK, urea, and phosphate fertilizers (Manyong, Makinde et al. 2001; Chianu and Tsujii 2005). Application of such fertilizers alone for soil fertility amendment is a short term solution since there is the likelihood of depleting other essential plant nutrients (Nziguheba, Tossah et al. 2009). Continuous application of for example NPK alone could lead to unresponsiveness of crop to future application of inorganic fertilizers. Farmers in these regions acknowledge the residual N benefits of cultivating legumes within their cereal dominant cropping systems. Atmospheric nitrogen fixation can benefit cereals cropped after legumes as wells as reduce the N uptake from the soil during cropping of legumes (Yusuf, Iwuafor et al. 2009). Nitrogen fixation however can be hampered in soils where other nutrients for example phosphorus are limiting (Sanginga 2003). In the savannah zones of west Africa, the long dry season brings with it Harmattan dust from the Sahara (McTainsh 1984; Stoorvogel, Van Breemen et al. 1997). Estimates of 0.9 t ha year-1 of Harmattan dust have been calculated for the northern Guinea savannah bringing in nutrient inputs of approximately 19, 10, 4 kg ha-1 annually of K, Ca, and Mg respectively (Harris 1998). On-going agronomic research for development by various international agricultural research institutions and their local partners in Nigeria call for a comprehensive understanding of soil fertility and its status in the region. Both from physical soil surveys and socio-economic investigations regarding perception and management strategies of farmers. A complete overview of plant nutrient limitations is important for future fertilizer recommendations to target a more holistic supply of plant nutrients during fertilizer application in smallholder cropping systems. This would eventually improve the use efficiencies of organic as well as inorganic inputs in the future. This report is based on an experiment conducted using the double-pot technique in plant nutrient analysis. The technique allows the qualitative as well as quantitative analysis of soils for bioavailability of plant nutrients (Janssen 1974). The aim of the experiment is to detect major plant nutrient deficiencies in selected soils. Additionally, this study seeks to contribute to future fertilizer recommendations by research and extension. This research hence entails experiment to diagnose plant macro and micronutrient deficiencies in three selected soils across three agro-ecological environments of northern Nigeria namely: southern and northern Guinea and Sudan savannah zones. The findings will also contribute to efforts in identifying limitations to biological nitrogen fixation in these regions.

8
9
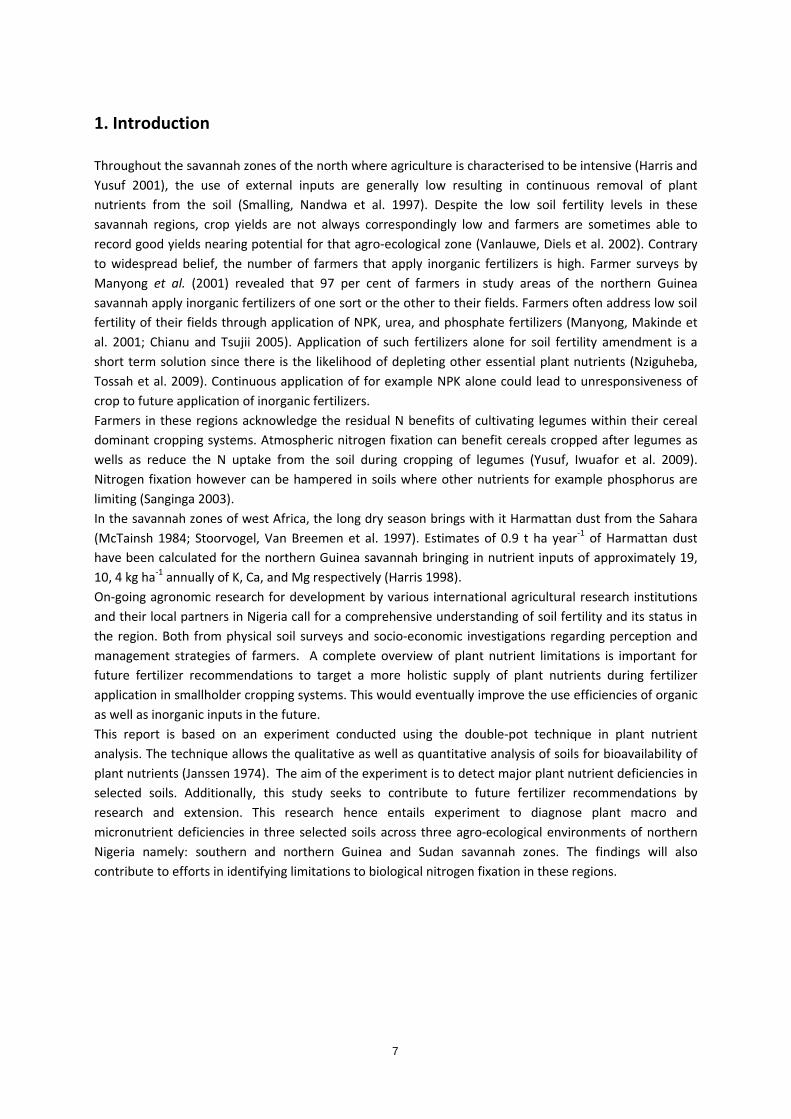
2. Materials and Methods 2.1 Description of double pot-technique The experiments were set up using the double-pot technique developed by Janssen (1974). This method is a rapid procedure used in diagnosing deficient plant nutrients of selected soils. Figure 1 illustrates the setup of the technique. Seedlings are sown in the upper pot (Fig. 1, Pot 1), the bottom Pot (pot 2) contains a nutrient solution in which the desired test nutrient is omitted. The rationale being that, seedlings can simultaneously acquire nutrients from the soil and nutrient solution. The growth of plants in a solution with an omitted nutrient can be compared with that of a complete nutrient solution (i.e. no nutrients omitted). Any difference in growth between complete and omitted solutions is a measure of availability of that omitted nutrient in the test soil. As shown in Figure 1, an upper pot (Pot 1) containing the test plant is placed on a lower pot containing the nutrient solution (Pot 2). Pot 1 has holes fabricated at the bottom to allow roots to reach the nutrient solution. A 2 mm gauze can be used to provide access from Pot 1 to Pot 2. Pot 2 should have a lid to support the weight of Pot 1 as well as holes to let roots through, these holes also facilitate aeration of the nutrient solution. A PVC pipe filled with quartz sand is inserted in the middle of Pot 1 for providing water to plants throughout the experimental period. An air space of approx. 1 cm should be left between the nutrient solution and the lid of Pot 2. For this experiment, the volume of pot 1 was 1 L whilst pot 2 was 3 L. No PVC pipe was used since the amount of soil per pot was small (250 g). 2.2 Site selection and soil sampling Three soils were selected across three agro-ecological zones (AEZ) of Nigeria to be used as test soils in this experiment. The soils were sampled from the local government areas (LGA) of Kachia in the southern Guinea (SGS), Soba in the northern Guinea (NGS), and Garko in the Sudan savannah (SS) zone. This study falls under the N2Africa project and soils were selected to cover all three agro-ecologies of the project. LGAs chosen for soil sampling are part of the ten impact zones in which N2Africa Nigeria operate and selected sites within those LGAs were chosen based on results from previous agronomic experiments on soybean within the project. From these experiments, response of soybean grain yield to P fertilization and inoculation with rhizobium was positive on some fields but on others this response was not significantly greater than the control (N2Africa Agronomy team, 2011, Personal Communication). Lack of response of soybean yield to P fertilization and inoculation was observed on ten farmers’ fields on which trails were conducted in the 2010 cropping season of northern Nigeria. These fields were not restricted to specific AEZs but scattered across all three in which the project operates. To design a feasible experiment, one site was randomly selected per AEZ. Soils were sampled on fields adjacent to experiments fields so as to eliminate residual effect of fertilizers used during the experiments in the previous season. Composite samples were taken per field in a W
Figure 1. Illustration of the setup of the double pot technique.
10
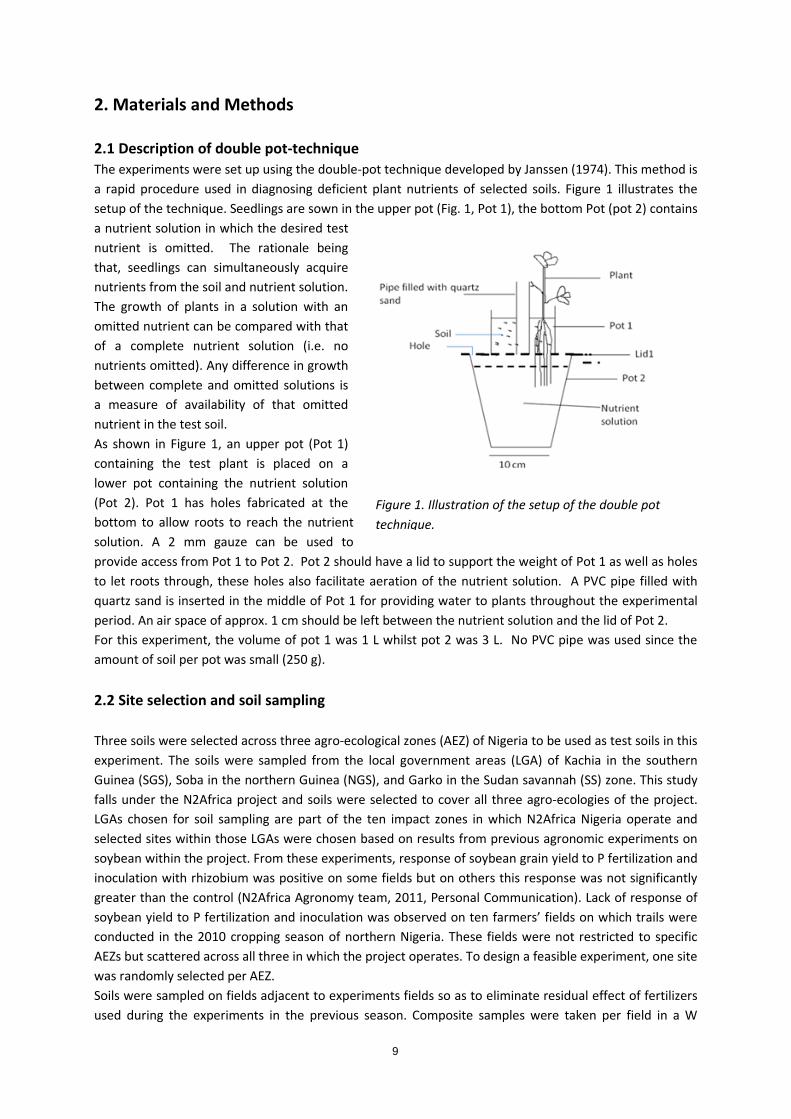
pattern from a depth of 0-20 cm. Twelve to fifteen subsamples from each field were collected and mixed to form composite samples. Samples were prepared for laboratory analysis by air drying and passing through a 2 mm sieve. Circa 200 g of soil per site was sent for analysis at IITA analytical laboratories in Ibadan, Nigeria (IITA 2011). Soils were analysed for pH (in a 1:2 soil water volume ratio), organic carbon and total N were analysed using dry combustion method, available P through Olsen method. Exchangeable cations (K, Mg, Na, and Ca) were determined using ammonium acetate extraction. Particle sizes (sand, silt, and clay) were obtained using the hydrometer method. Results of soil analysis are given in Table 1.
Table 1. Physico-chemical properties of the three selected soils used in the nutrient omission experiments. Sites Exchangeable cations (cmol kg-1) Texture (%) pH %OC %N P(mg kg-1) Ca Mg K Na ECEC Sand Silt Clay Kachia 5.1 0.93 0.094 0.96 1.93 0.95 0.16 0.09 3.13 47 20 33 Soba 5.5 0.71 0.065 2.32 1.13 0.65 0.10 0.09 1.97 47 36 17 Garko 6 0.55 0.054 0.02 1.45 0.78 0.12 0.09 2.45 69 20 11
Figure 2. Satellite images of the sites on which soil was sampled for the experiment showing a sub-humid zone of 1) Kachia (9.520833°N 7.570649°E), and two agro-ecologies both characterised as semi-arid 2) Soba (10.593158°N 8.030638°E), and 3) Garko (11.393640°N 8.530081°E)
11
2.3 Experimental factors and design The experiment included factors: soil type (3 soils) and nutrient application (8 treatments). Each nutrient treatment was assigned to the three different soils and these replicated four times. The setup was repeated three times to allow for destructive sampling at three time intervals. The experiment was set up in a completely randomized fashion with a total of 288 experimental units (3*8*4*3). Table 2 shows the various treatments involved whilst Table 3 shows the nutrient salts used. A treatment for calcium (Treatment number 6) was initially included in the setup of this experiments but was removed from the analysis since the double pot technique was found to be inappropriate for testing calcium deficiency (Janssen 1974) in soils. Plant roots do not grow into solution deficient in calcium.
Table 2. Treatments and nutrients applied in the omission experiments. Nutrient treatment Code Nutrients added
Complete 1 P, K, Mg, Ca, S, Na, Micronutrients1
Control2 2 - P omitted 3 K, Mg, Ca, S, Micronutrients K omitted 4 P, Mg, Ca, S, Micronutrients Mg omitted 5 P, K, Ca, S, Micronutrients S omitted 7 P, K, Mg, Ca, Micronutrients (Micro)nutrients omitted 8 P, K, Mg, Ca, S, 1Composition of micronutrients added is given in Table 3. 2Distilled water only was applied in the lower pots for this treatment.
Table 3. Stock solutions of nutrients for preparation of 1 L nutrient solution. Element Form applied Ca CaCl2 P K2HPO4, CaHPO4
K K2SO4, KCl, K2HPO4 Mg MgSO4, MgCl2 S MgSO4, K2SO4 Micronutrients 1Fe(III)Cl, ZnSO4, CuSO4, MnCl2, H3BO3, Na2MoO4 1 Fe(III)Cl was added separately of the other trace elements. Nutrients salts were available as solute; 1 molar stock were therefore prepared by dissolving approximately ten per cent (in grams) of the molar weight of the salts in 100 ml of distilled water. For example, 1.1 g of CaCl2 was dissolved in 100 ml of distilled water to make a 1 molar solution (Lommen, Heuvelink et al. 2012). 1 ml of these stock solutions were consequently added to 1 L of water to form the nutrient solutions in the lower pot making sure to omit the appropriate test nutrient. Regarding trace elements, 1 L composite solution was made by adding 1 ml of each trace element to a litre of distilled water. 1 ml per litre of this composite solution was then added to the pots which contained the nutrient solutions. A complete overview of nutrient stocks and quantities diluted (per litre of water) are presented in the Appendices (Section 7.2). 2.4 Setup and experiment management The experiment was conducted in screen house ‘Jupiter’ of the International Institute of Tropical Agriculture (IITA), Kano station. Soybean (Glycine max L. Merr) variety TGx 1448-2E was the test plant. Three seeds were sown per pot at planting and thinned to single uniform plants per pot five days after

12
emergence (DAE). Soybean seeds were inoculated with LegumeFix Rhizobium Inoculant (Legume Tech Ltd, 2010) acquired through the N2Africa project prior to sowing. At seven DAE, soils in pots were covered with a thin layer of gravel to reduce evaporation. Pots were watered every other day and kept moist at all times. The amount of water applied to pots was determined by adding water to soils until they reached plasticity. Two thirds of this amount was then administered to plants. The nutrient solutions were renewed at 3 weeks after planting and solutions were kept at pH 6-7 using NaOH. Karate-Z insecticide with 22% Lamda – Cyhalothrin as active ingredient (Protection 2012) was used to control red spider mite which were feeding on foliar parts of the plants. The first sign of the pest were observed at 12 DAE. The experiment period from emergence until final harvest was 31 days. 2.5 Harvest and measurements From eleven DAE onwards, regular observations were made to detect visual nutrient deficiency symptoms on foliar parts of plants. Pots were harvested at three different intervals throughout the duration of the experiment at 21, 26 and 31 DAE in order to establish a growth trend in the test soils. Stem height (in cm) of plants and aboveground biomass production (in grams) were the measurements taken. Pots were harvested at the base of the plant and stem height was taken as the length from base of the plant to the apex. Stem height was used as the growth parameter to measure plant size in similar experiments by Jassen (1990). Fresh weight (FW) was recorded directly after harvest and plants were oven dried at 70°C for 72 hours. Dry weight of plants was then taken. After final harvests, composite samples of aboveground biomass per treatments per soils were ball grinded and sent for elemental analysis KU Leuven using the Inductively Coupled Plasma (ICP-AES) method. Plant samples were analysed for all nutrient treatments including nitrogen (N). 2.6 Mathematical and statistical analysis To measure availability of nutrient in a specific soil, the concept of sufficiency quotient (Janssen 1974) was used. The sufficiency quotient is an index of difference in growth and dry matter accumulation between plants growing in a complete and deficient nutrient solution. To be able to calculate sufficiency quotient, the mean growth rate at any given time needs to be determined with the following equations; First of all, we determine the growth per unit time using;
𝑅𝑠 = 1 𝑆
d𝑆d𝑡
(1)
The above equation gives increase in plant size per unit time where RS is the relative growth parameter. To get the mean growth at any given time, we use; 𝑅𝑠 = (ln𝑆2 − ln 𝑆1)/(𝑡2− 𝑡1) (2) We can then calculate then calculate the sufficiency quotient (SQ) per nutrient; SQP = (RS)-P/ (RS) C (3) SQP = is the sufficiency quotient for phosphorus (P), (RS)C is the relative growth in plants in a Complete solution and (RS)-P is the relative growth in plants on in a solution with P omitted.

13
Relative growth of plants expressing growth in omitted nutrient treatments over growth in the complete treatment (Vanlauwe, Diels et al. 2002) was calculated as follows; Soybean aboveground biomass in omitted treatment x 100 (4) Soybean aboveground biomass in Complete treatment Genstat 14th Edition statistical programme was applied to the data to establish significant differences in DM accumulation at the various harvest intervals. Differences in total DM production are also analysed. The generalized linear model (GLM) method is applying Analysis of Variance (ANOVA) was performed on the data to establish significant different growth at 5 per cent level (α = 0.05).

14
15
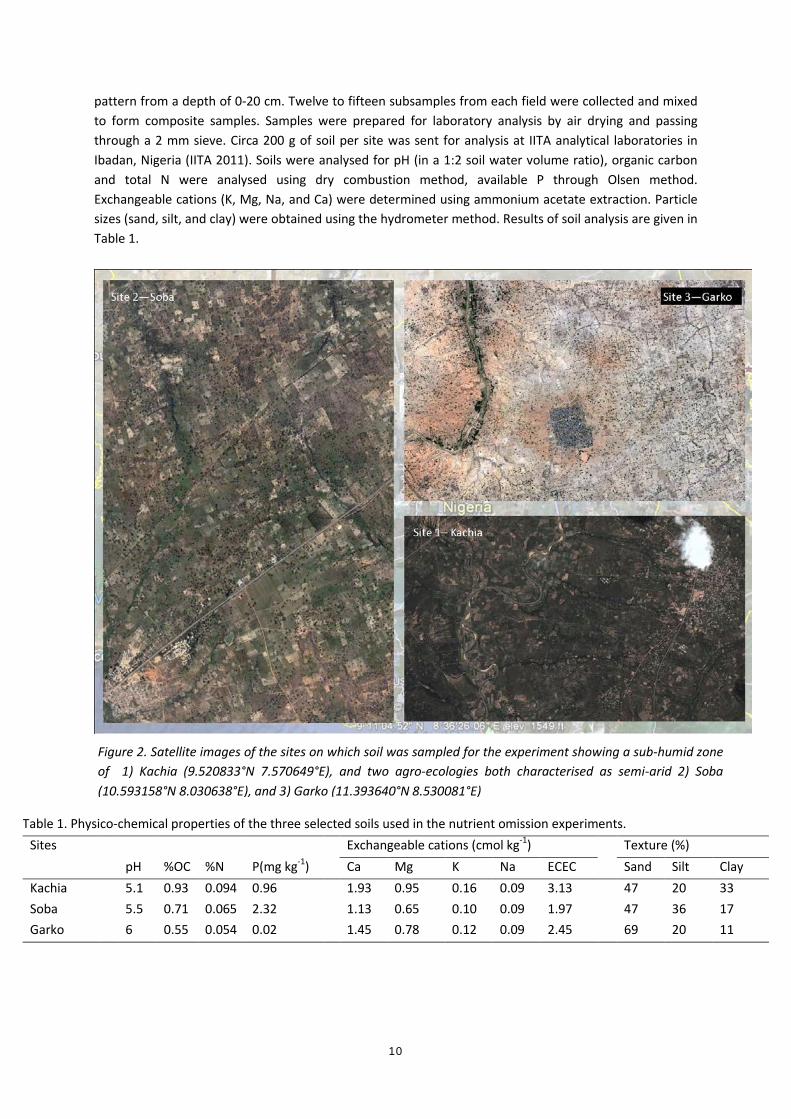
3. Results 3.1 Visual deficiencies symptoms
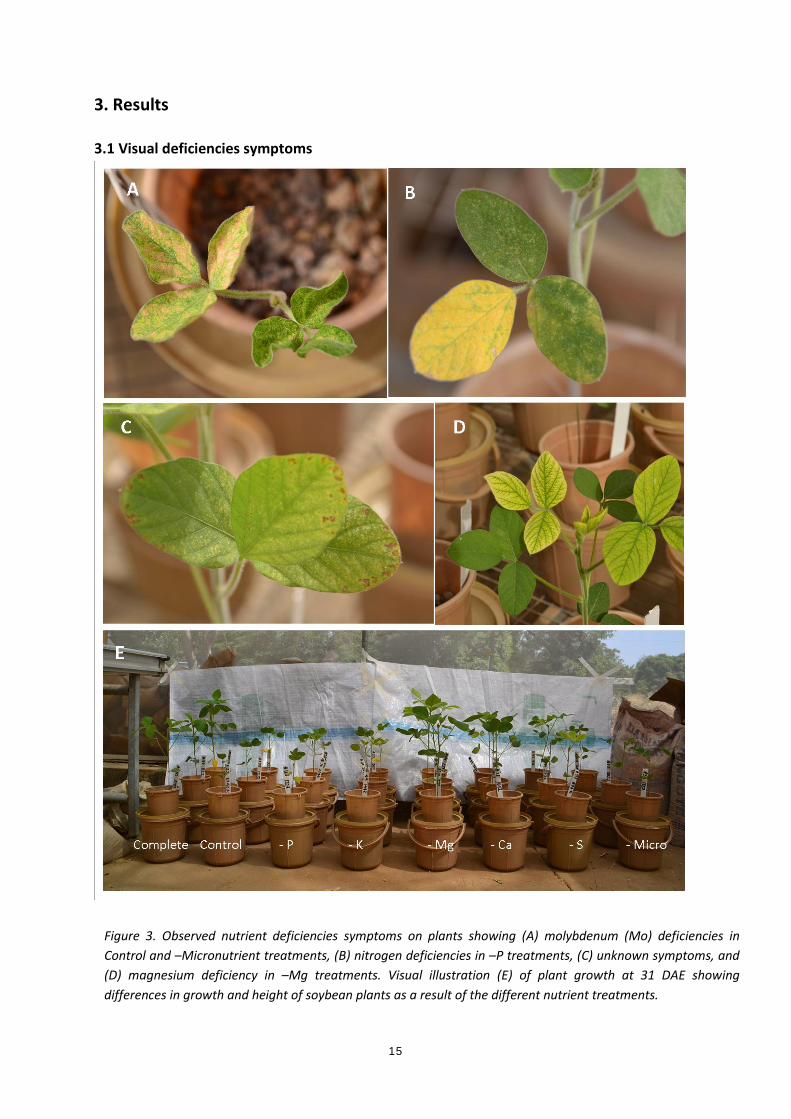
Figure 3. Observed nutrient deficiencies symptoms on plants showing (A) molybdenum (Mo) deficiencies in Control and –Micronutrient treatments, (B) nitrogen deficiencies in –P treatments, (C) unknown symptoms, and (D) magnesium deficiency in –Mg treatments. Visual illustration (E) of plant growth at 31 DAE showing differences in growth and height of soybean plants as a result of the different nutrient treatments.
16
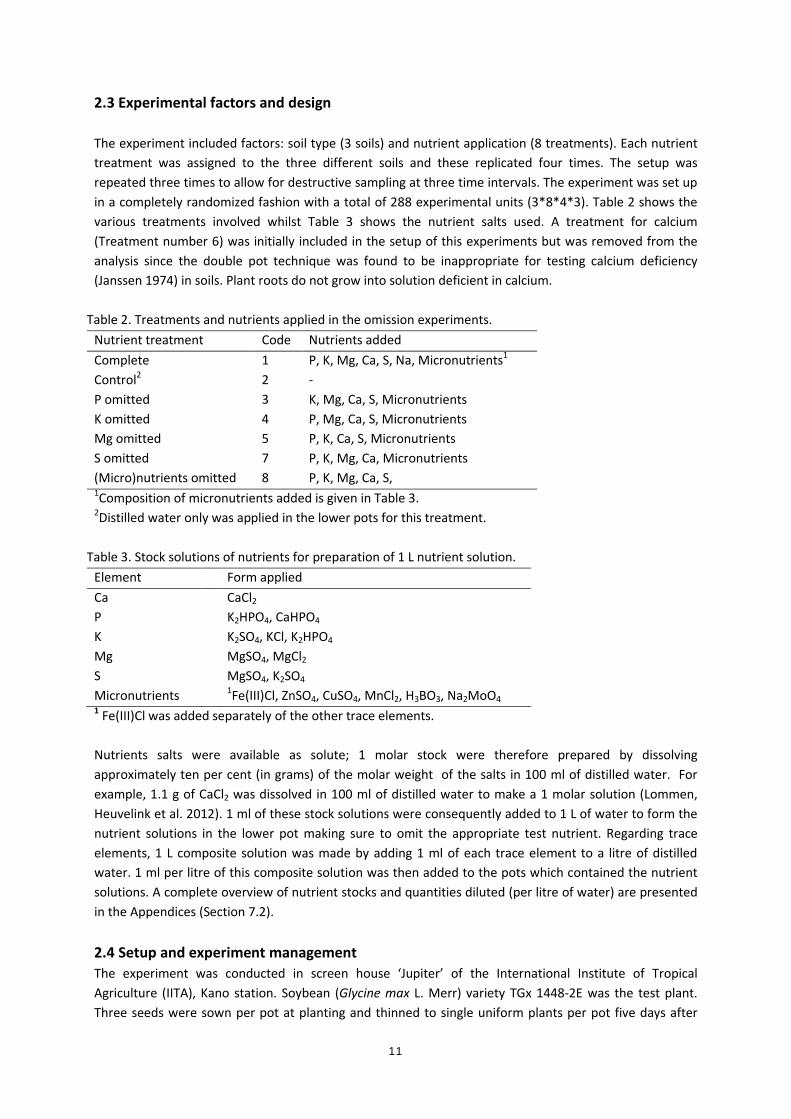
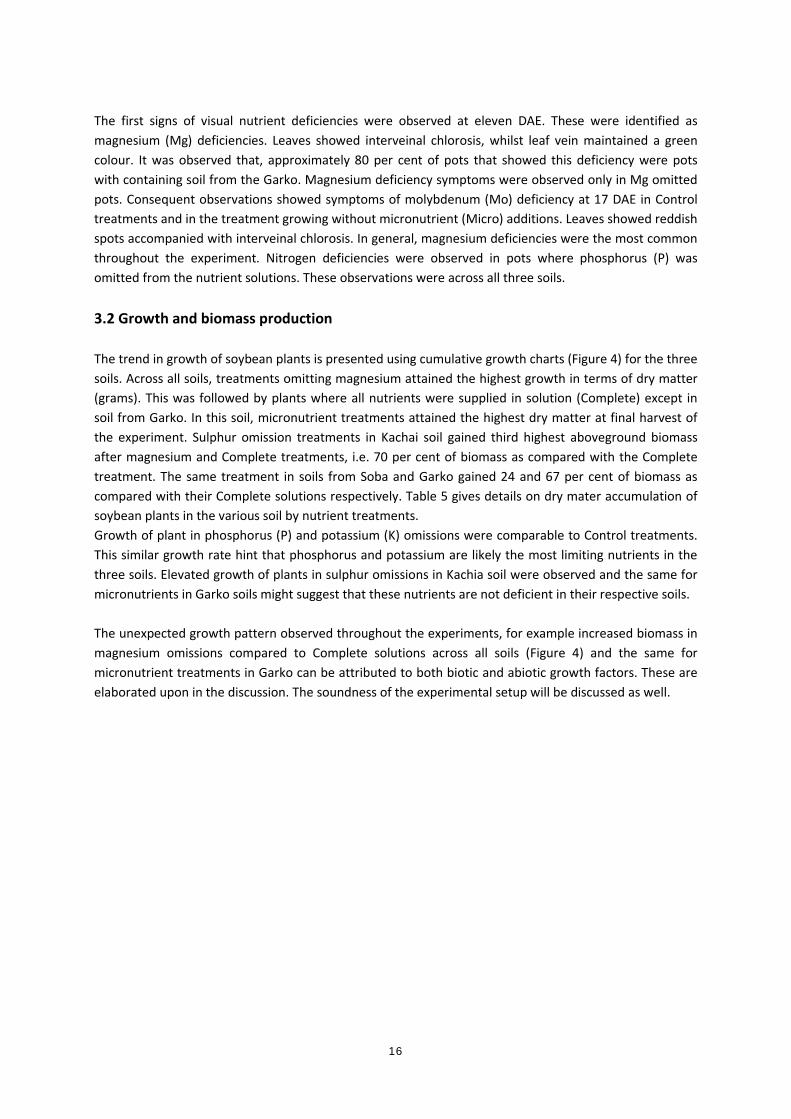
The first signs of visual nutrient deficiencies were observed at eleven DAE. These were identified as magnesium (Mg) deficiencies. Leaves showed interveinal chlorosis, whilst leaf vein maintained a green colour. It was observed that, approximately 80 per cent of pots that showed this deficiency were pots with containing soil from the Garko. Magnesium deficiency symptoms were observed only in Mg omitted pots. Consequent observations showed symptoms of molybdenum (Mo) deficiency at 17 DAE in Control treatments and in the treatment growing without micronutrient (Micro) additions. Leaves showed reddish spots accompanied with interveinal chlorosis. In general, magnesium deficiencies were the most common throughout the experiment. Nitrogen deficiencies were observed in pots where phosphorus (P) was omitted from the nutrient solutions. These observations were across all three soils. 3.2 Growth and biomass production The trend in growth of soybean plants is presented using cumulative growth charts (Figure 4) for the three soils. Across all soils, treatments omitting magnesium attained the highest growth in terms of dry matter (grams). This was followed by plants where all nutrients were supplied in solution (Complete) except in soil from Garko. In this soil, micronutrient treatments attained the highest dry matter at final harvest of the experiment. Sulphur omission treatments in Kachai soil gained third highest aboveground biomass after magnesium and Complete treatments, i.e. 70 per cent of biomass as compared with the Complete treatment. The same treatment in soils from Soba and Garko gained 24 and 67 per cent of biomass as compared with their Complete solutions respectively. Table 5 gives details on dry mater accumulation of soybean plants in the various soil by nutrient treatments. Growth of plant in phosphorus (P) and potassium (K) omissions were comparable to Control treatments. This similar growth rate hint that phosphorus and potassium are likely the most limiting nutrients in the three soils. Elevated growth of plants in sulphur omissions in Kachia soil were observed and the same for micronutrients in Garko soils might suggest that these nutrients are not deficient in their respective soils. The unexpected growth pattern observed throughout the experiments, for example increased biomass in magnesium omissions compared to Complete solutions across all soils (Figure 4) and the same for micronutrient treatments in Garko can be attributed to both biotic and abiotic growth factors. These are elaborated upon in the discussion. The soundness of the experimental setup will be discussed as well.
17
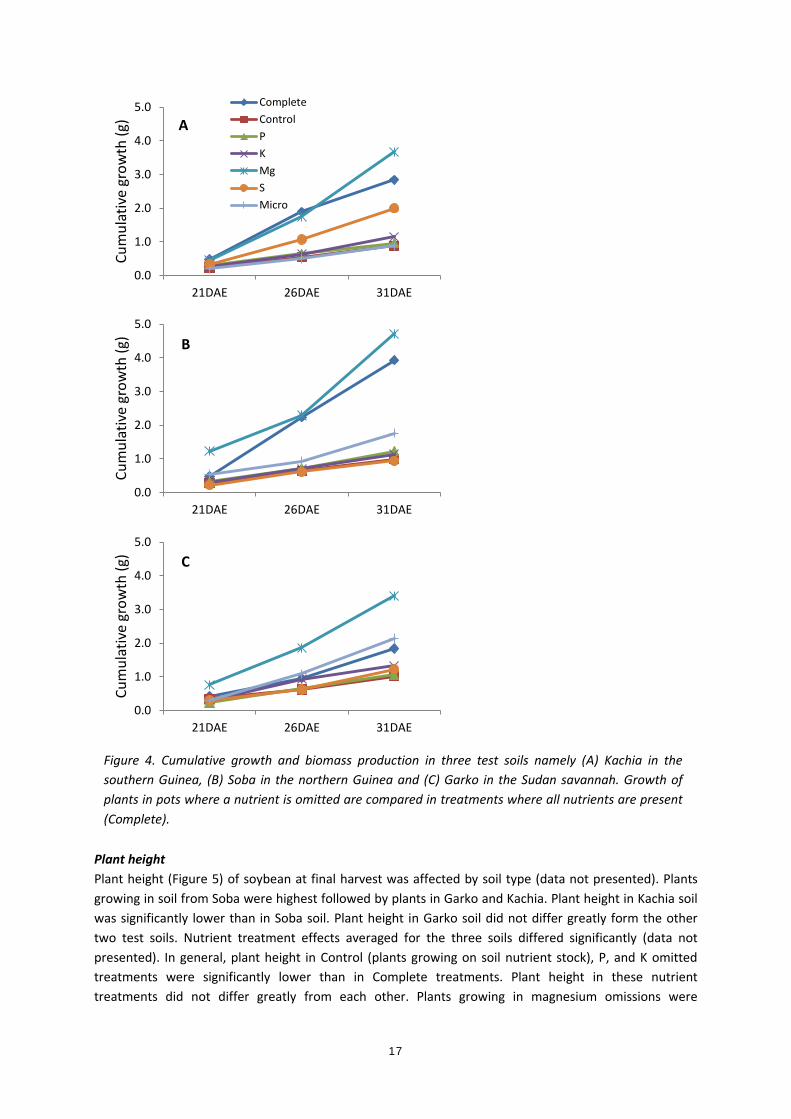
Plant height Plant height (Figure 5) of soybean at final harvest was affected by soil type (data not presented). Plants growing in soil from Soba were highest followed by plants in Garko and Kachia. Plant height in Kachia soil was significantly lower than in Soba soil. Plant height in Garko soil did not differ greatly form the other two test soils. Nutrient treatment effects averaged for the three soils differed significantly (data not presented). In general, plant height in Control (plants growing on soil nutrient stock), P, and K omitted treatments were significantly lower than in Complete treatments. Plant height in these nutrient treatments did not differ greatly from each other. Plants growing in magnesium omissions were
0.0
1.0
2.0
3.0
4.0
5.0
21DAE 26DAE 31DAE
Cum
ulat
ive
grow
th (g
) CompleteControlPKMgSMicro
0.0
1.0
2.0
3.0
4.0
5.0
21DAE 26DAE 31DAE
Cum
ulat
ive
grow
th (g
)
0.0
1.0
2.0
3.0
4.0
5.0
21DAE 26DAE 31DAE
Cum
ulat
ive
grow
th (g
)
Figure 4. Cumulative growth and biomass production in three test soils namely (A) Kachia in the southern Guinea, (B) Soba in the northern Guinea and (C) Garko in the Sudan savannah. Growth of plants in pots where a nutrient is omitted are compared in treatments where all nutrients are present (Complete).
A
B
C

18
significantly taller than in the Complete. Plant height in sulphur omissions was much less than in the Complete. Plant height in micronutrient treatments was similar to growth in the Complete treatment. Interaction effects between soil and nutrient factors were highly significant (Table 4). In soils from Kachia, plant height in Control treatments was much less than in Complete, however, P and K omission treatments attained similar height with the Complete treatment and were also not significantly different from the Control treatment. Plants in magnesium omission attained greater height than in the Complete, Control, P, and K. Plant height in sulphur treatments was similar to the Complete but micronutrient treatments were significantly lower than the Complete. In Soba soils, Control, P, and K omissions treatments were significantly smaller compared with the Complete treatment. Plant height in the magnesium omission was significantly greater than in Complete as well as all other treatments. Plants in –S treatments were smaller as compared to Complete but there was no difference between Complete and micronutrient omission treatments. In Garko soils, plant height in Control, -P, and -K treatments was comparable to the Complete. The same was true for sulphur and micronutrient omission treatments. Plants in which magnesium was omitted were the only treatments showing significantly greater plant height than all other treatments except when compared to micronutrient omission treatments.
Table 4. Mean plant height (in cm) of soybean in nutrient treatments across three soils. Means are compared between nutrient treatments within the same soil. Means followed by letters indicating significant difference as established by an LSDo.05 test
Soils (S) Nutrient treatment (T) Complete Control -P -K -Mg -S -Micro Kachia 27.6a 20.5b 22.0ab 22.9ab 34.1c 28.0ade 21.4bf Soba 32.4a 21.0b 25.0bc 22.6bd 39.6e 20.7bf 29.5abg Garko 24.3a 26.2a 23.7a 23.7a 31.5b 23.6ac 28.7ab PSxT <0.001 LSDo.05 5.832 SED 2.962
0
5
10
15
20
25
30
35
40
Complete Control -P -K -Mg -S -Micro
Plan
t hei
ght a
t 31D
AE (c
m)
Kachia
Soba
Garko
Figure 5. Plant height of soybean in three soils Kachia, Soba, and Garko and seven nutrient treatments. Plant height was measured as the length (in cm) from the base of the plat at soil level to apex of main stem.

19
Aboveground biomass (DM) production
Table 5. Average DM production (in grams) of soybean in the interaction between soil and nutrient treatments. Means are compared between the different nutrient treatments within the same soil. Means followed by letters indicating significant differences as established by LSD0.05 tests.
Soils (S) Nutrient treatment (T) Complete Control -P -K -Mg -S -Micro Kachia 2.84a 0.88b 0.97bc 1.15bd 3.67ae 1.99af 0.88abg Soba 3.93a 0.99b 1.23bc 1.13bd 4.71ae 0.94bf 1.76f Garko 1.84a 1.02a 1.07a 1.33a 3.41b 1.23a 3.13bc PSxT <0.001 LSD0.05 1.0388 SED 0.521 Aboveground biomass production was analysed between the different soil type and nutrient treatment effects (data not presented). Between the soils, Soba (NGS) produced the highest aboveground biomass (in grams) followed by Garko (SS) and least biomass was produced in soils from Kachia (SGS). Biomass production in Soba differed significantly from Kachia but not from Garko. There variations in biomass production between Kachia and Garko were not statistically significant. Comparing results in the Control treatment between the three soils (Figure 6), it can be observed that plants in Garko soil accumulated highest dry matter. This is however not in line with soil data shown in Table 1. From that table, Garko had the lowest total N and available P as well as a low organic carbon concentration . Interaction effects of soil and nutrient treatments were highly significant and are elaborated below. Plant growth is compared by nutrient treatments within the same soil. In Kachia, aboveground biomass was significantly lower in the Control compared to Complete treatments. This was the same between the Complete treatment and phosphorus (P) and potassium (K) omissions. Biomass production in magnesium deficient solutions did not differ significantly from Complete solutions. In the absence of sulphur or
0.0
1.0
2.0
3.0
4.0
5.0
Complete Control -P -K -Mg -S -Micro
Tota
l DM
31D
AE (g
) Kachia
Soba
Garko
Figure 6. Average aboveground biomass production in grams at final harvest of experiment (31DAE). Chart shows interaction effects between Soil and Nutrient treatments. Statistically significant variations between nutrient treatments within the same test soils are given in in Table 5.
20
micronutrients, the production of biomass was not significantly lower than in Complete solutions. Biomass production between Control, P omission, and K omission treatments were similar in this soil. In soil from Soba, all nutrient treatments including the Control accumulated significantly less biomass than in Complete treatments. Except for magnesium which gained more biomass than in the Complete but this was not significant. Within treatments, magnesium omission pots gained significantly more biomass than Control, -P, -K, -S, and -Micronutrient treatments. As mentioned earlier, plants growing in soil from Garko (SS) produced the lowest average aboveground biomass. Within soil nutrient treatment variations showed that plants growing in omission treatments Control, -P, -K, and -S accumulated less biomass than the Complete treatment although these were not statistically different. Two treatments magnesium (Mg) and micronutrients (Micro) however, gained significantly more aboveground biomass as compared to the Complete treatment as well Control, P, K, and S treatments. Total biomass produced between magnesium and micronutrient omission treatments did not differ significantly between each other. 3.3 Relative growth and nutrient sufficiency quotients
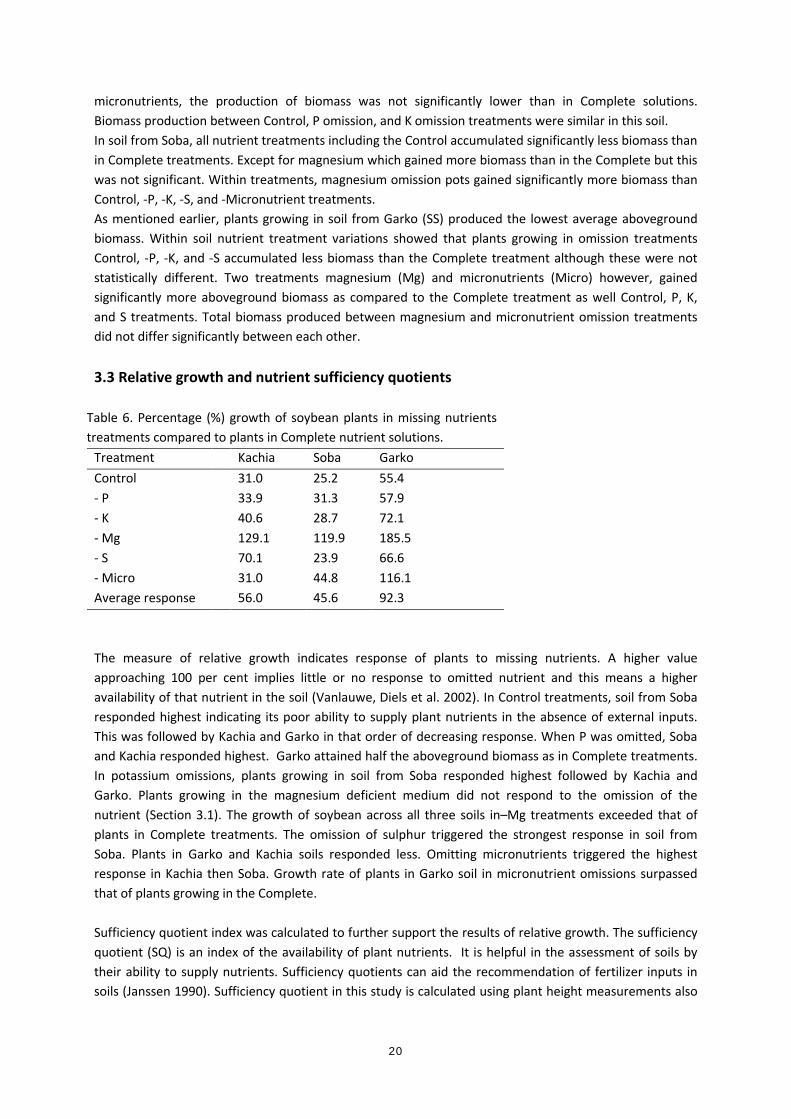
Table 6. Percentage (%) growth of soybean plants in missing nutrients treatments compared to plants in Complete nutrient solutions.
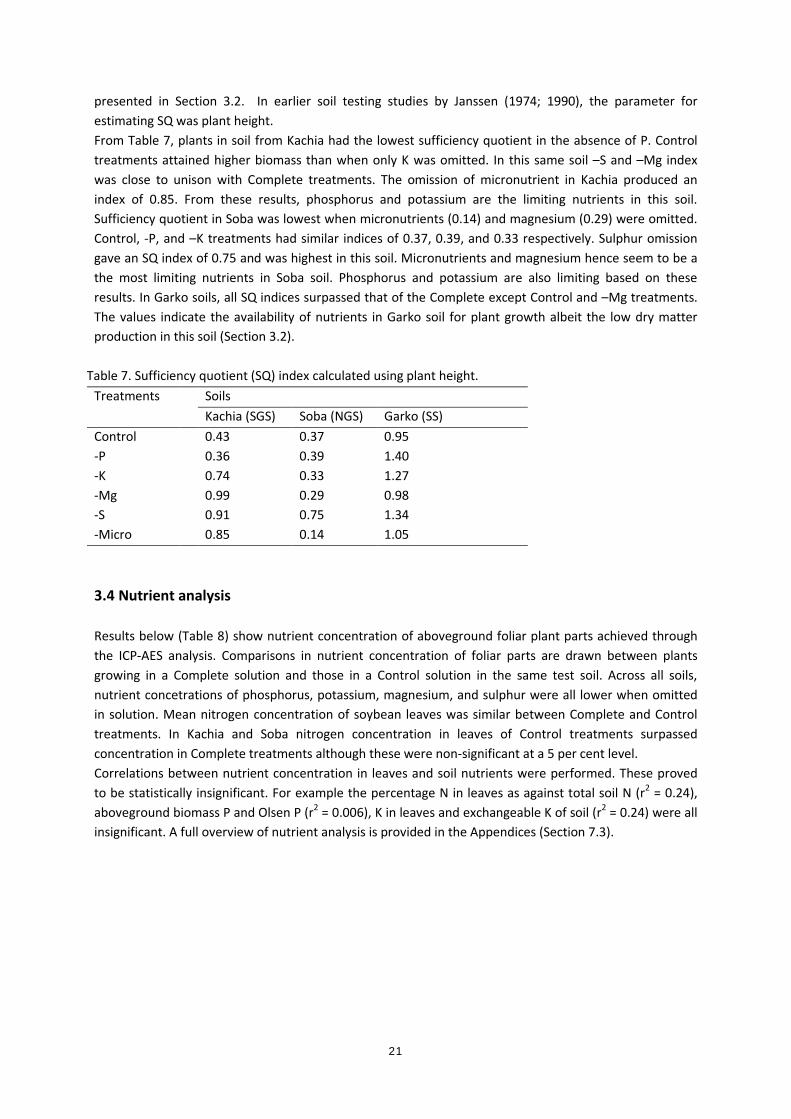
Treatment Kachia Soba Garko Control 31.0 25.2 55.4 - P 33.9 31.3 57.9 - K 40.6 28.7 72.1 - Mg 129.1 119.9 185.5 - S 70.1 23.9 66.6 - Micro 31.0 44.8 116.1 Average response 56.0 45.6 92.3 The measure of relative growth indicates response of plants to missing nutrients. A higher value approaching 100 per cent implies little or no response to omitted nutrient and this means a higher availability of that nutrient in the soil (Vanlauwe, Diels et al. 2002). In Control treatments, soil from Soba responded highest indicating its poor ability to supply plant nutrients in the absence of external inputs. This was followed by Kachia and Garko in that order of decreasing response. When P was omitted, Soba and Kachia responded highest. Garko attained half the aboveground biomass as in Complete treatments. In potassium omissions, plants growing in soil from Soba responded highest followed by Kachia and Garko. Plants growing in the magnesium deficient medium did not respond to the omission of the nutrient (Section 3.1). The growth of soybean across all three soils in–Mg treatments exceeded that of plants in Complete treatments. The omission of sulphur triggered the strongest response in soil from Soba. Plants in Garko and Kachia soils responded less. Omitting micronutrients triggered the highest response in Kachia then Soba. Growth rate of plants in Garko soil in micronutrient omissions surpassed that of plants growing in the Complete. Sufficiency quotient index was calculated to further support the results of relative growth. The sufficiency quotient (SQ) is an index of the availability of plant nutrients. It is helpful in the assessment of soils by their ability to supply nutrients. Sufficiency quotients can aid the recommendation of fertilizer inputs in soils (Janssen 1990). Sufficiency quotient in this study is calculated using plant height measurements also
21
presented in Section 3.2. In earlier soil testing studies by Janssen (1974; 1990), the parameter for estimating SQ was plant height. From Table 7, plants in soil from Kachia had the lowest sufficiency quotient in the absence of P. Control treatments attained higher biomass than when only K was omitted. In this same soil –S and –Mg index was close to unison with Complete treatments. The omission of micronutrient in Kachia produced an index of 0.85. From these results, phosphorus and potassium are the limiting nutrients in this soil. Sufficiency quotient in Soba was lowest when micronutrients (0.14) and magnesium (0.29) were omitted. Control, -P, and –K treatments had similar indices of 0.37, 0.39, and 0.33 respectively. Sulphur omission gave an SQ index of 0.75 and was highest in this soil. Micronutrients and magnesium hence seem to be a the most limiting nutrients in Soba soil. Phosphorus and potassium are also limiting based on these results. In Garko soils, all SQ indices surpassed that of the Complete except Control and –Mg treatments. The values indicate the availability of nutrients in Garko soil for plant growth albeit the low dry matter production in this soil (Section 3.2).
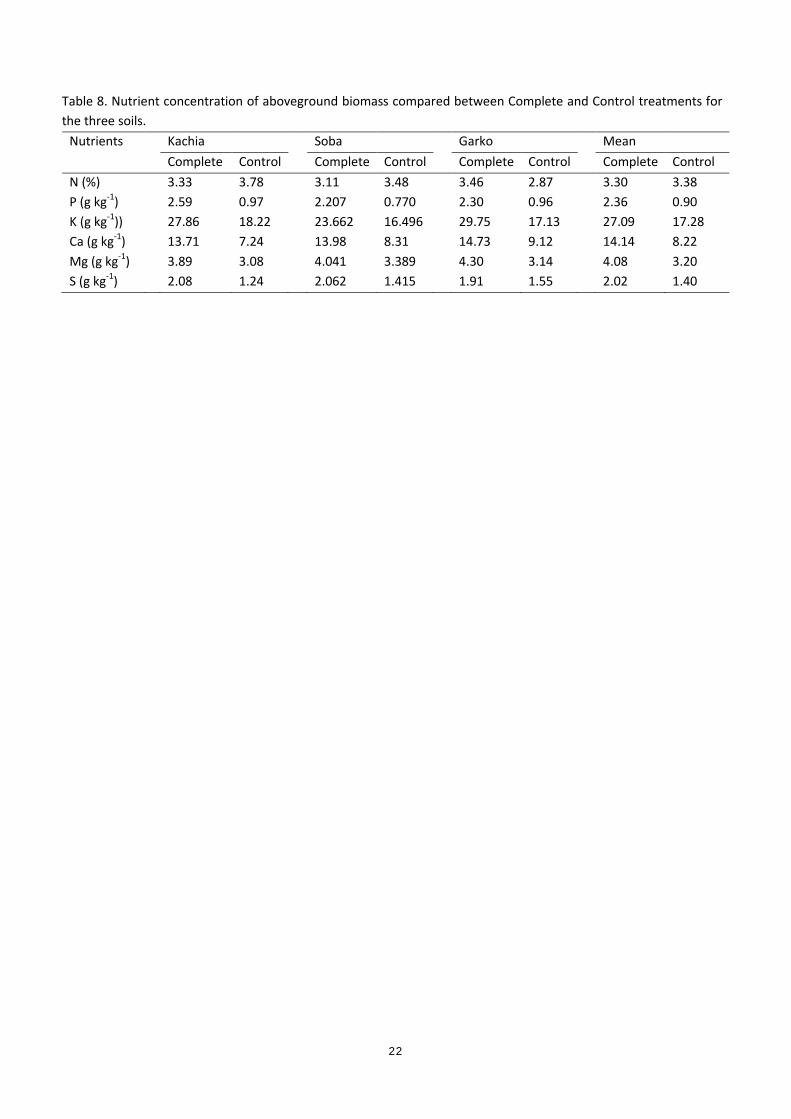
Table 7. Sufficiency quotient (SQ) index calculated using plant height. Treatments Soils Kachia (SGS) Soba (NGS) Garko (SS) Control 0.43 0.37 0.95 -P 0.36 0.39 1.40 -K 0.74 0.33 1.27 -Mg 0.99 0.29 0.98 -S 0.91 0.75 1.34 -Micro 0.85 0.14 1.05 3.4 Nutrient analysis Results below (Table 8) show nutrient concentration of aboveground foliar plant parts achieved through the ICP-AES analysis. Comparisons in nutrient concentration of foliar parts are drawn between plants growing in a Complete solution and those in a Control solution in the same test soil. Across all soils, nutrient concetrations of phosphorus, potassium, magnesium, and sulphur were all lower when omitted in solution. Mean nitrogen concentration of soybean leaves was similar between Complete and Control treatments. In Kachia and Soba nitrogen concentration in leaves of Control treatments surpassed concentration in Complete treatments although these were non-significant at a 5 per cent level. Correlations between nutrient concentration in leaves and soil nutrients were performed. These proved to be statistically insignificant. For example the percentage N in leaves as against total soil N (r2 = 0.24), aboveground biomass P and Olsen P (r2 = 0.006), K in leaves and exchangeable K of soil (r2 = 0.24) were all insignificant. A full overview of nutrient analysis is provided in the Appendices (Section 7.3).
22
Table 8. Nutrient concentration of aboveground biomass compared between Complete and Control treatments for the three soils.
Nutrients Kachia Soba Garko Mean Complete Control Complete Control Complete Control Complete Control N (%) 3.33 3.78 3.11 3.48 3.46 2.87 3.30 3.38 P (g kg-1) 2.59 0.97 2.207 0.770 2.30 0.96 2.36 0.90 K (g kg-1)) 27.86 18.22 23.662 16.496 29.75 17.13 27.09 17.28 Ca (g kg-1) 13.71 7.24 13.98 8.31 14.73 9.12 14.14 8.22 Mg (g kg-1) 3.89 3.08 4.041 3.389 4.30 3.14 4.08 3.20 S (g kg-1) 2.08 1.24 2.062 1.415 1.91 1.55 2.02 1.40
23
4. Discussion 4.1 Methodology It is necessary to review the methodology of the experiments on which this report is based. First of all regarding the test plant that was used, it is recommended to use plants with uniform growth in early stages of development. Maize has proven to be a suitable crop for rapid analysis soil especially for its uniform growth and non-tillering characteristics (Janssen 1974). In the case that other crops are of socio-economic importance to the regions where soil testing is being done, it is advisable to use that specific crop. A major reason why soybean has been the test crop in this study. A disadvantage of this is that the suitability of the crop to rapidly respond to nutrient deficiency in test soils was unknown prior to this study. Janssen (1974) confirmed that seed size is one criteria to judge the suitability of crops for this type of study in whereby, the smaller the seed, the faster it takes to exhaust its energy reserves and hence respond to possible nutrient deficiency in soils. Average weight of 100 maize and soybean seeds is 15 and 16.9 g respectively (Adeniyan and Ayoola 2006; Kolo and Mamudu 2008) and unlikely to severely influence the outcome when used in such experiments. On the other hand, the energy and protein concentration of soybean (405 Kcal and 34 g respectively per 100 g seeds) is roughly 15 per cent higher than that of maize (345 Kcal and 9.4 g protein per 100 g seeds). Soybean hence has more energy reserves within its seed and this might influence the suitability of soybean as a test crop. Further comparisons of both crops for suitability in such experiments could prove useful to verify this. The suitability of pots used in the experiments needs to be questioned regarding their influence on outcome of results. Especially in tropical experimental conditions, pots with thick walls help to buffer external heat in the environment of the screen house (Frederick Baijukya, 2011 Personal Communication). Pots fabricated from PVC pipes are ideal for environments such as the northern Guinea savannah where average day temperatures at the time of the experiments reached 34 °C and temperatures inside the screen house are very likely to be higher. The pots used in this experiment had walls circa 1.5 mm thick and their capacity to buffer external heat from warming up nutrient solutions and influencing normal root function can be questioned. From Hong-chi and Sun-ho (1987) and Ziska (1998), elevated temperatures of 31 °C at the root zone of soybean plants stimulated root growth and resulted in a higher root/shoot ratio. In the nutrient limited soils used in this particular experiment, increased root growth might mean reduced nutrients for shoot growth hence influencing the reliability of the soil diagnosis (Gleeson 1993; Nijs and Impens 1997). Secondly, high temperatures at the root zone of plants can lead to increased potassium (K) uptake (Hong-chi and Sun-ho 1987). An increased level of potassium absorption by plants leads to depressed uptake of magnesium (Spear, Edwards et al. 1978; Jakobsen 1993). 4.2 Nutrient deficiencies and aboveground biomass production Nitrogen deficiencies were clearly visible on plants in which major plant nutrients were omitted. In the Control, -P, and –K treatments, N was clearly deficient. N availability was not investigated due to the test plant being a legume. However, the appearance of N deficiencies in treatments where major plant nutrients are omitted but not in other treatments (e.g. –Mg, -S, and –Micronutrients) suggest a link between the availability of phosphorus and possibly potassium and nitrogen fixation. A link between P availability and nitrogen fixation was observed by Sanginga (2003; 2003) . Hence, investments in P and K fertilizers are ultimately necessary for smallholder farmers to reap the benefits of nitrogen fixation. Visual magnesium deficiencies were obvious in this study although plants growing in Mg deficient solutions accumulated significantly higher biomass than plants growing on a complete solution. The researcher believes that the use of different nutrient compounds resulted in more K being supplied to –Mg treatments as compared to other treatments. In -Mg treatments, sulphur was applied as K2SO4 and P

24
was supplied as K2HPO4 whereas in all other treatments, S and Mg were supplied as MgSO4 This meant that K was applied twice in -Mg solutions hence the increased growth and dry matter accumulation in these treatments. Dry matter accumulation by soil type was different from one treatment to the other. In Complete solution, Garko soils attained the lowest dry matter and this corresponds to the organic carbon, total nitrogen, and available P of these soils (Table 1). In other treatments such as when potassium and micronutrients were omitted the same test soil accumulated the highest dry matter although these increases were insignificant from the Complete. Among the three soils, there was a general trend of decreased biomass production when all (Control) nutrients were omitted and also when P and K were omitted. In these treatments all soils accumulated less biomass. Especially soils from Kachia and Soba gained an average of 32 per cent of the biomass of Complete solutions when P was removed from solution. Garko soils gained close to 60 per cent of biomass of their Complete solution although the Complete solutions subjected to soil from Garko gained significantly less biomass than Soba in the same treatment. In the absence of potassium, Soba attained 29 per cent of biomass as in the Complete, Kachia attained 41 per cent and the 72 per cent gained by Garko suggests a reduced severity of K deficiencies in that region. Garko lies in the Sudan savannah zone north of the other two agro-ecologies meaning a likely increased amount of Harmattan dust deposition (McTainsh 1984) and annual input of K beyond the levels experienced in the southern and northern Guinea zones. Treatment variations for sulphur across soils suggest soil from Soba to be deficient in sulphur but not those from Garko and Kachia. The same is true for micronutrient treatments, i.e. Kachia showed the highest response followed by Soba. Garko soil attained slightly higher aboveground biomass than its Complete treatment. 4.3 Implications for nitrogen fixation This study set out to diagnose plant nutrients limiting soybean growth at selected sites in northern Nigeria. The soils tested in this experiment were collected from sites that had a history of unresponsiveness to P fertilizer application and inoculation with rhizobium during the cultivation of soybean (A. Bala, 2011, Personal Communication). There is a clear link between soil P and atmospheric nitrogen fixation by grain legumes whereby low availability of P restricts the potential for nitrogen fixation (Giller and Cadisch 1995; Sanginga, Okogun et al. 1996). From results obtained from this study, it can be confirmed that all three soils exhibit a significant deficiency in plant available phosphorus. Moreover, deficiencies of other essential plant nutrients could result in the unresponsiveness of crops in soils even with P fertilization (Nziguheba, Tossah et al. 2009). Potassium (K) deficiencies could eventually limit plant growth even in the presence of sufficient P in the soil (Paris 1992). For the three soils used in this study, Kachia and Garko were shown to be deficient in potassium. Relative growth of plants in these two soils was 41 and 29 per cent respectively compared to plants growing with supplied potassium. From the literature, the savannah zones of northern Nigeria receive an average annual input of 17 kg ha-1 of potassium from Harmattan dust blown in from the Sahara region (McTainsh 1984; Stoorvogel, Van Breemen et al. 1997) but these inputs are unlikely to match plant uptake from soil as we can conclude from this study.

25
5. Conclusions The use of the double-pot experimental technique aids the qualitative analysis of plant nutrient deficiencies. It is a rapid technique that can easily be set up. Original protocol designed for such studies needs to be strictly followed in order to obtain reliable results. Care should be taken in order to minimise the influence of abiotic stress such as heat on the outcome of experiments. Suitability of the test crop being used should also be considered prior to experimentation. Results from this study confirm that soils from Kachia (SGS) and Soba (NGS) are deficient in phosphorus and potassium. Soil from Soba were also deficient in sulphur and micronutrients (visual molybdenum deficiencies). Different growth parameters such as plant height and aboveground biomass were used to establish this although these data were insufficient in concluding that soil from Garko (SS) are deficient in these nutrients. However plant height and dry matter production of soybean in Garko was lowest of the three soils. The deficiency of potassium in soils from Kachia and Soba and possible micronutrient deficiencies in Soba is likely to limit the response of soybean plants growing in these soils to fertilization with P and inoculation with rhizobia.

26

27
6. References
Adeniyan, O. N. and O. T. Ayoola (2006). "Growth and yield performance of some improved soybean varieties as influenced by intercropping with maize and cassava in two contrasting locations in Southwest Nigeria." African Journal of Biotechnology 5(20): 1886-1889.
Chianu, J. N. and H. Tsujii (2005). "Determinants of farmers’ decision to adopt or not adopt inorganic fertilizer in the savannas of northern Nigeria." Nutrient Cycling in Agroecosystems 70(3): 293-301.
Giller, K. E. and G. Cadisch (1995). "Future benefits from biological nitrogen fixation: An ecological approach to agriculture." Plant and Soil 174(1): 255-277.
Gleeson, S. K. (1993). "Optimization of Tissue Nitrogen and Root-Shoot Allocation." Annals of Botany 71(1): 23-31.
Harris, F. and M. A. Yusuf (2001). "MANURE MANAGEMENT BY SMALLHOLDER FARMERS IN THE KANO CLOSE-SETTLED ZONE, NIGERIA." Experimental Agriculture 37(03): 319-332.
Harris, F. M. A. (1998). "Farm-level assessment of the nutrient balance in northern Nigeria." Agriculture, Ecosystems & Environment 71(1-3): 201-214.
Hong-chi, L. and W. Sun-ho (1987). "Influence of temperature and phosphate on the development and function of root system of soybean (Glycine max)." Journal of Plant Nutrition 10(9-16): 1307-1307.
IITA. (2011). "Analytical services laboratory." from http://www.iita.org/analytical-services-laboratory.
Jakobsen, S. T. (1993). "Interaction between Plant Nutrients: III. Antagonism between Potassium, Magnesium and Calcium." Acta Agriculturae Scandinavica, Section B - Soil & Plant Science 43(1): 1-5.
Janssen, B. H. (1974). A double pot technique for rapid soil testing. Wageningen, [s.n.].
Janssen, B. H. (1990). A double-pot technique as a tool in plant nutrition analysis. Plant nutrition: physiology and application: proceedings of the eleventh international plant nutrition colloquium. M. L. Beusichem. Wageningen, Kluwer Academic Publishers: 759-763.
Kolo, M. G. M. and A. Y. Mamudu (2008). "Water treatment of Parkia biglobosa pulp dressed maize (Zea mays L.) seeds for Striga hermonthica control at Minna, Nigeria." Agricultura Tropica et Subtropica 41(3): 96-105.
Lommen, W. J. M., E. Heuvelink, et al. (2012). Research methods in crop science. Wageningen, Wageningen University, Centre for Crop Systems Analysis.
Manyong, V. M., K. O. Makinde, et al. (2001). "Fertiliser use and definition of farmer domains for impact-oriented research in the northern Guinea savanna of Nigeria." Nutrient Cycling in Agroecosystems 59(2): 129-141.
McTainsh, G. (1984). "The nature and origin of the aeolian mantles of central northern Nigeria." Geoderma 33(1): 13-37.
Nijs, I. and I. Impens (1997). "An Analysis of the Balance between Root and Shoot Activity in Lolium perenne cv. Melvina. Effects of CO2 Concentration and Air Temperature." New Phytologist 135(1): 81-91.
28
Nziguheba, G., B. Tossah, et al. (2009). "Assessment of nutrient deficiencies in maize in nutrient omission trials and long-term field experiments in the West African Savanna." Plant and Soil 314(1): 143-157.
Paris, Q. (1992). "The von Liebig Hypothesis." American Journal of Agricultural Economics 74(4): 1019-1028.
Protection, S. C. (2012). "Karate with Zeon Technology (Insecticide)." Retrieved 11 June 2012, 2012, from http://www.syngentacropprotection.com/pdf/labels/SCP1097AL1J0109.pdf.
Sanchez, P. A. (2002). "Soil Fertility and Hunger in Africa." Science 295(5562): 2019-2020.
Sanginga, N. (2003). "Role of biological nitrogen fixation in legume based cropping systems; a case study of West Africa farming systems." Plant and Soil 252(1): 25-39.
Sanginga, N., K. E. Dashiell, et al. (2003). "Sustainable resource management coupled to resilient germplasm to provide new intensive cereal-grain-legume-livestock systems in the dry savanna." Agriculture, Ecosystems & Environment 100(2-3): 305-314.
Sanginga, N., J. A. Okogun, et al. (1996). "Phosphorus requirement and nodulation of herbaceous and shrub legumes in low P soils of a Guinean savanna in Nigeria." Applied Soil Ecology 3(3): 247-255.
Smalling, E. M. A., S. M. Nandwa, et al. (1997). Soil fertility in Africa is at stake! Wadington, SSSA.
Spear, S. N., D. G. Edwards, et al. (1978). "Response of cassava, sunflower, and maize to potassium concentration in solution III. Interactions between potassium, calcium, and magnesium." Field Crops Research 1(0): 375-389.
Stoorvogel, J. J., N. Van Breemen, et al. (1997). "The nutrient input by Harmattan dust to a forest ecosystem in Cote d'Ivoire, Africa." Biogeochemistry 37(2): 145-157.
Vanlauwe, B., J. Diels, et al. (2002). "Fertility status of soils of the derived savanna and northern guinea savanna and response to major plant nutrients, as influenced by soil type and land use management." Nutrient Cycling in Agroecosystems 62(2): 139-150.
Yusuf, A. A., E. N. O. Iwuafor, et al. (2009). "Grain legume rotation benefits to maize in the northern Guinea savanna of Nigeria: Fixed-nitrogen versus other rotation effects." Nutrient Cycling in Agroecosystems 84(2): 129-139.
Ziska, L. H. (1998). "The Influence of Root Zone Temperature on Photosynthetic Acclimation to Elevated Carbon Dioxide Concentrations." Annals of Botany 81: 717-721.
29
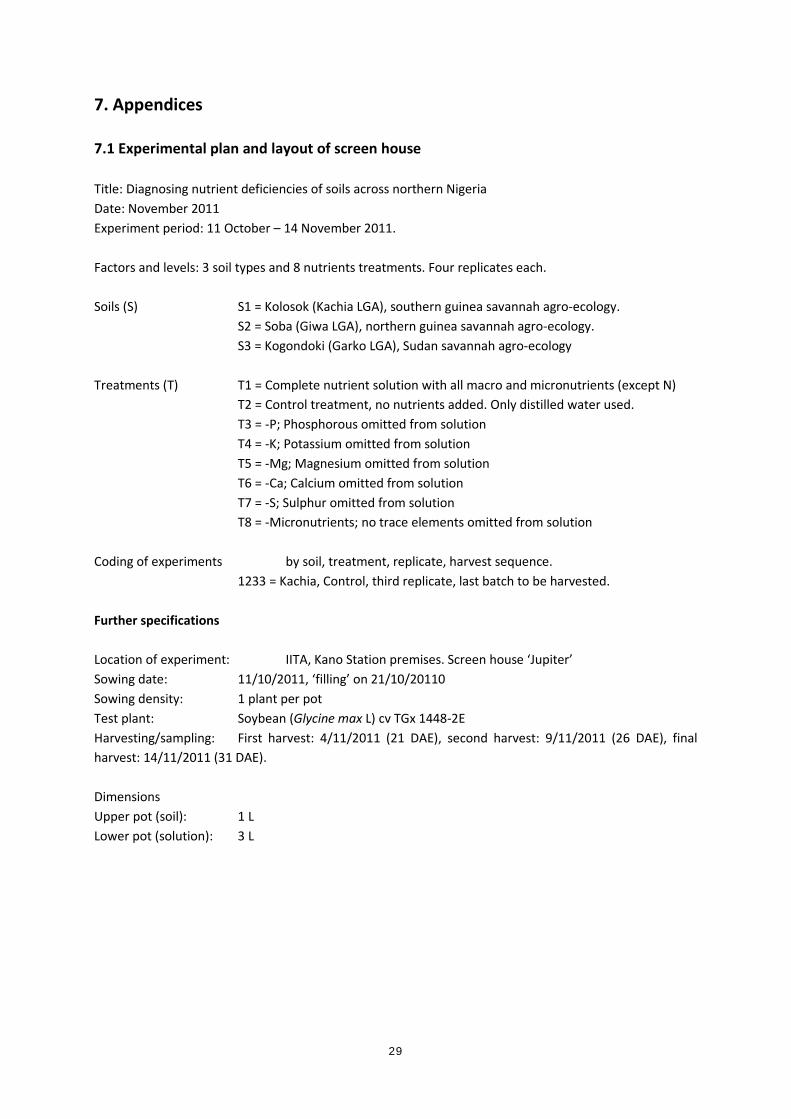
7. Appendices 7.1 Experimental plan and layout of screen house Title: Diagnosing nutrient deficiencies of soils across northern Nigeria Date: November 2011 Experiment period: 11 October – 14 November 2011. Factors and levels: 3 soil types and 8 nutrients treatments. Four replicates each. Soils (S) S1 = Kolosok (Kachia LGA), southern guinea savannah agro-ecology. S2 = Soba (Giwa LGA), northern guinea savannah agro-ecology. S3 = Kogondoki (Garko LGA), Sudan savannah agro-ecology Treatments (T) T1 = Complete nutrient solution with all macro and micronutrients (except N) T2 = Control treatment, no nutrients added. Only distilled water used. T3 = -P; Phosphorous omitted from solution T4 = -K; Potassium omitted from solution T5 = -Mg; Magnesium omitted from solution T6 = -Ca; Calcium omitted from solution T7 = -S; Sulphur omitted from solution T8 = -Micronutrients; no trace elements omitted from solution Coding of experiments by soil, treatment, replicate, harvest sequence. 1233 = Kachia, Control, third replicate, last batch to be harvested. Further specifications Location of experiment: IITA, Kano Station premises. Screen house ‘Jupiter’ Sowing date: 11/10/2011, ‘filling’ on 21/10/20110 Sowing density: 1 plant per pot Test plant: Soybean (Glycine max L) cv TGx 1448-2E Harvesting/sampling: First harvest: 4/11/2011 (21 DAE), second harvest: 9/11/2011 (26 DAE), final harvest: 14/11/2011 (31 DAE). Dimensions Upper pot (soil): 1 L Lower pot (solution): 3 L
30
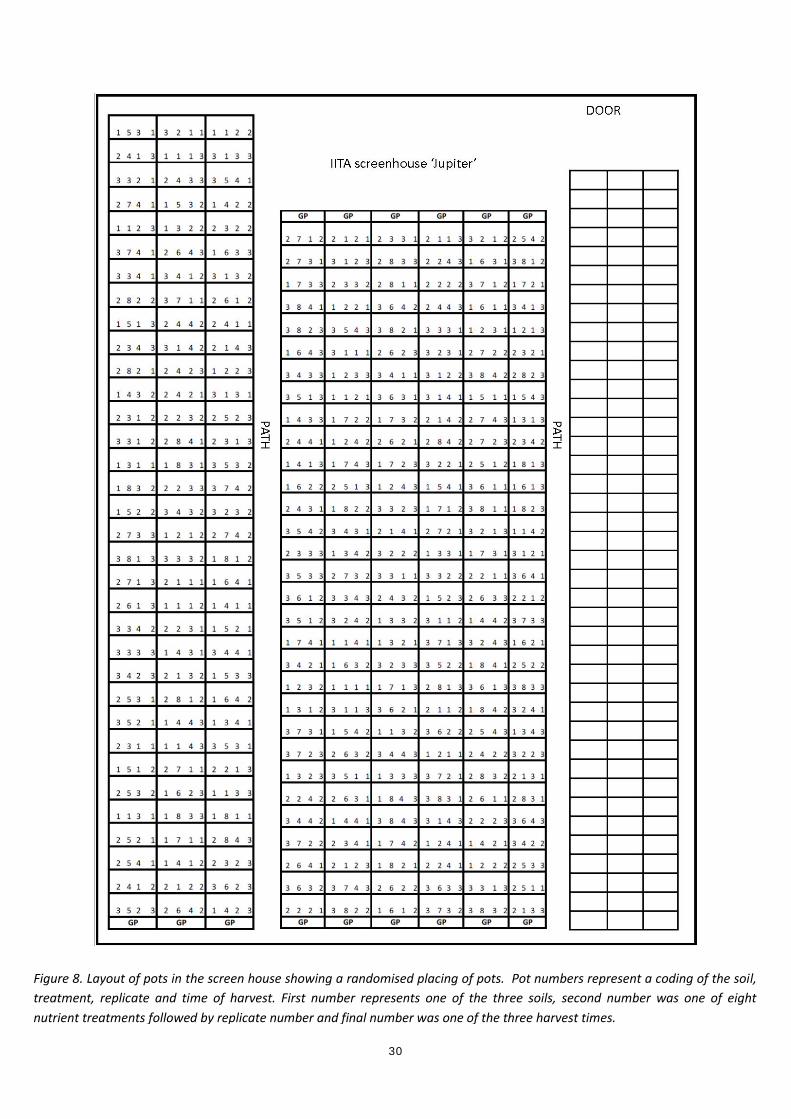
Figure 8. Layout of pots in the screen house showing a randomised placing of pots. Pot numbers represent a coding of the soil, treatment, replicate and time of harvest. First number represents one of the three soils, second number was one of eight nutrient treatments followed by replicate number and final number was one of the three harvest times.
31
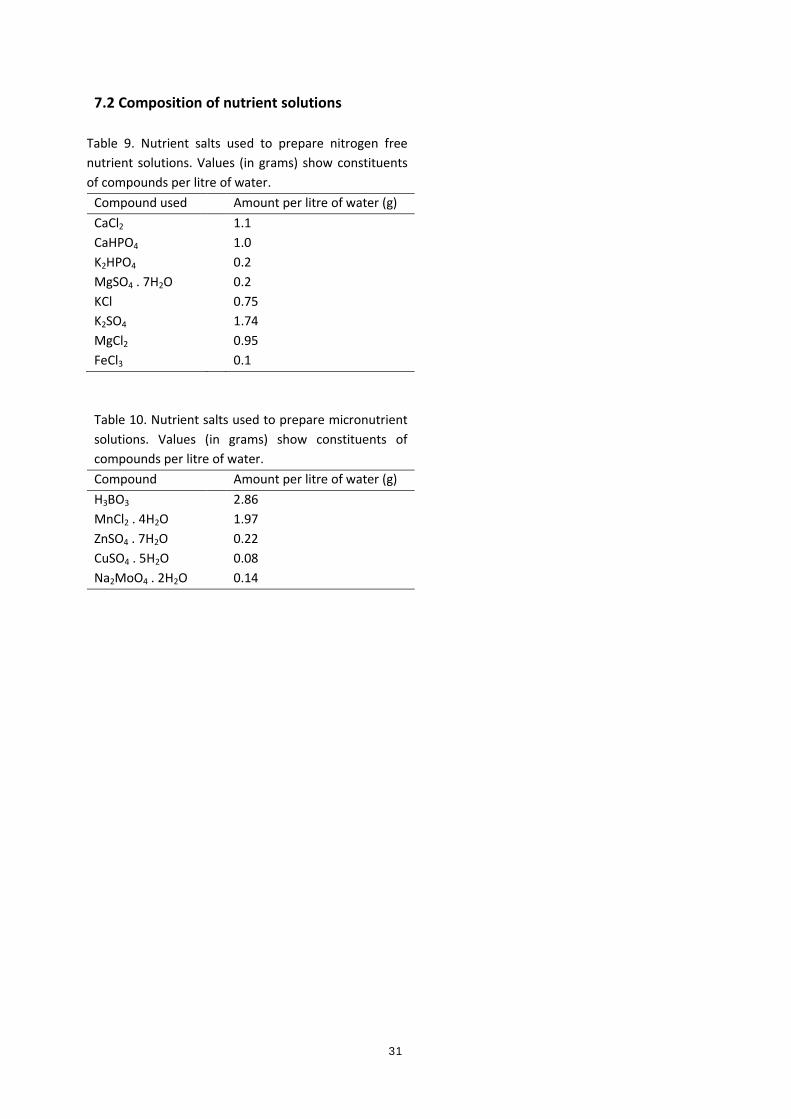
7.2 Composition of nutrient solutions
Table 9. Nutrient salts used to prepare nitrogen free nutrient solutions. Values (in grams) show constituents of compounds per litre of water.
Compound used Amount per litre of water (g) CaCl2 1.1 CaHPO4 1.0 K2HPO4 0.2 MgSO4 . 7H2O 0.2 KCl 0.75 K2SO4 1.74 MgCl2 0.95 FeCl3 0.1 Table 10. Nutrient salts used to prepare micronutrient solutions. Values (in grams) show constituents of compounds per litre of water. Compound Amount per litre of water (g) H3BO3 2.86 MnCl2 . 4H2O 1.97 ZnSO4 . 7H2O 0.22 CuSO4 . 5H2O 0.08 Na2MoO4 . 2H2O 0.14

32
7.3 Average nutrient concentration of aboveground plant biomass (ICP-AES Analysis) Table 11. Raw data showing nutrient concentration of soybean plants by soil type and nutrient treatment. Results from laboratory analysis using ICP-AES method. Soil Treatment N Na Mg K Ca P S Cu Fe Mn Zn B Cr Al % g kg-1 Kachia Complete 3.331 0.13 3.89 27.86 13.71 2.59 2.08 0.004 0.192 0.160 0.0873 0.057 0.001 0.183
Kachia Control 3.110 0.15 4.04 23.66 13.98 2.21 2.06 0.004 0.244 0.120 0.1196 0.063 0.002 0.236
Kachia -P 3.461 0.21 4.30 29.75 14.73 2.30 1.91 0.003 0.248 0.184 0.1035 0.066 0.001 0.233
Kachia -K 3.777 0.21 3.08 18.22 7.24 0.97 1.24 0.005 0.246 0.268 0.0551 0.023 0.002 0.225
Kachia -Mg 3.478 0.27 3.39 16.50 8.31 0.77 1.42 0.004 0.212 0.080 0.0567 0.026 0.001 0.175
Kachia -S 2.870 0.30 3.14 17.13 9.12 0.96 1.55 0.003 0.298 0.040 0.0455 0.024 0.002 0.273
Kachia -Ca 3.626 0.66 4.01 20.88 11.21 0.82 1.43 0.007 0.362 0.290 0.0993 0.070 0.002 0.326
Kachia -Micro 3.822 0.51 4.34 18.53 12.75 0.72 1.42 0.005 0.236 0.114 0.0879 0.071 0.001 0.209
Soba Complete 3.616 0.52 4.29 20.93 13.87 0.93 1.55 0.003 0.295 0.174 0.1287 0.075 0.001 0.270
Soba Control 3.446 0.31 3.96 18.94 13.08 0.78 1.38 0.004 0.247 0.225 0.0824 0.068 0.001 0.228
Soba -P 3.509 0.53 4.12 17.71 12.93 0.71 1.31 0.003 0.284 0.112 0.0821 0.062 0.001 0.247
Soba -K 3.302 0.34 3.95 18.10 13.33 0.94 1.40 0.003 0.244 0.103 0.0964 0.072 0.001 0.245
Soba -Mg 2.680 0.15 3.95 26.03 13.06 1.97 1.92 0.004 0.236 0.204 0.1341 0.059 0.002 0.226
Soba -S 2.654 0.13 3.95 25.02 14.26 2.32 1.98 0.007 0.236 0.154 0.1397 0.062 0.002 0.265
Soba -Ca 2.823 0.09 3.90 25.77 14.96 2.01 1.82 0.006 0.253 0.157 0.1151 0.071 0.001 0.269
Soba -Micro 3.229 0.41 3.51 24.52 10.65 1.14 1.45 0.004 0.232 0.177 0.0447 0.043 0.002 0.246

33
Garko Complete 2.668 0.19 3.75 21.00 13.00 1.60 1.68 0.004 0.196 0.066 0.0832 0.056 0.002 0.201
Garko Control 2.909 0.26 4.40 25.11 15.13 1.72 1.76 0.003 0.234 0.079 0.0601 0.061 0.002 0.259
Garko -P 3.998 0.29 3.65 28.21 12.69 2.20 2.00 0.003 0.241 0.120 0.0629 0.021 0.002 0.288
Garko -K 4.348 0.37 3.70 26.68 11.33 1.91 2.00 0.004 0.183 0.101 0.0594 0.021 0.001 0.186
Garko -Mg 3.567 0.38 3.54 22.95 12.17 1.56 1.72 0.003 0.230 0.036 0.0450 0.021 0.003 0.240
Garko -S 3.563 0.53 3.38 23.43 9.94 1.10 1.39 0.004 0.227 0.152 0.0469 0.016 0.004 0.243
Garko -Ca 3.339 0.33 3.73 22.06 11.76 1.39 1.57 0.002 0.251 0.068 0.0585 0.019 0.002 0.247
Garko -Micro 3.002 0.34 3.52 19.76 12.01 1.30 1.45 0.002 0.266 0.036 0.0549 0.016 0.002 0.286