Embed Size (px)
Citation preview
University of Arkansas, FayettevilleScholarWorks@UARK
Theses and Dissertations
8-2017
Qualitative Analysis of Social Capital in Arkansas –A Case Study based ApproachValerie KildersUniversity of Arkansas, Fayetteville
Follow this and additional works at: http://scholarworks.uark.edu/etd
Part of the Agricultural Economics Commons
This Thesis is brought to you for free and open access by ScholarWorks@UARK. It has been accepted for inclusion in Theses and Dissertations by anauthorized administrator of ScholarWorks@UARK. For more information, please contact [email protected], [email protected].
Recommended CitationKilders, Valerie, "Qualitative Analysis of Social Capital in Arkansas – A Case Study based Approach" (2017). Theses and Dissertations.2419.http://scholarworks.uark.edu/etd/2419
Qualitative Analysis of Social Capital in Arkansas – A Case Study based Approach
A thesis submitted in partial fulfillment
of the requirements for the degree of
Master of Science in Agriculture Economics
by
Valerie Kilders
Humboldt University zu Berlin
Bachelor of Science in Agriculture, 2015
August 2017
University of Arkansas
This thesis is approved for recommendation to the Graduate Council.
_________________________________
Dr. Eric Wailes
Thesis Director
_________________________________ _________________________________
Dr. Joost Dessein Dr. Daniel Rainey
Committee Member Committee Member
Abstract
Despite the vast research on social capital in general, only very little research is focused on the
quality of social capital. While some research studies incorporated aspects that are associated
with the quality of social capital, they often take a one dimensional approach that fails to take the
different aspects of the topic into consideration. In order to gain more insights into this I
conducted a series of semi-structured interviews in three rural counties in Arkansas. The counties
were selected on the basis of a social capital index of all U.S. counties using quantitative
measures. I used a guide on qualitative research on social capital as my conceptual framework to
analyze the interviews. The analysis, which utilized NVivo, a qualitative data management
program, yielded a variety of results. I was able to observe that the involvement in a large
number of groups tended to prevent participants from becoming involved on a deeper level.
However, often the same people were involved in the majority of groups and many of the groups
struggled to recruit new members. In addition, ethnic differences were not perceived to be a
hampering factor in building intense social capital by the participants. Among other things the
results also showed that there are noteworthy differences in the quality of social capital between
the three counties. The results indicate that there seems to be a correlation between the level of
local social capital when measured via qualitative or quantitative indicators. A factor that should
be explored further in future research.
This study supplements the growing body of literature on social capital. In exploring the largely
untapped aspect of social capital quality new insights are gained. The results can be used to
improve existing measures of social capital and to develop more efficient policies, particularly
for rural areas in Arkansas
Acknowledgements
I would like to thank the members of my thesis committee, Dr. Eric Wailes, Dr. Daniel Rainey,
and Dr. Joost Dessein. Their continued support and valuable input has been a tremendous help in
conducting my research and writing my thesis.
I have also greatly benefitted from the assistance of Dr. Jeff Miller, who has given me
indispensable advice on qualitative research and for the use of the NVivo software.
In addition my thanks goes to all the participants of the different counties. Giving me your time
and sharing your thoughts with me has been invaluable for my research.
I am indebted to the fantastic administrative staff at the Agricultural Economics and Agricultural
Business department of the Dale Bumpers College of Agricultural, Food & Life Sciences at the
University of Arkansas. The department has been vital in making this research possible.
I would also like to thank Evy Mettepenningen, who has been very supportive in administrative
matters.
Lastly I am deeply grateful to the professors, the university staff, fellow students and friends I
have met throughout my academic path. They have supplied me with the knowledge, skills and
perseverance to write this thesis.

Dedication
I would like to dedicate this thesis to my parents and my sister. Despite thoroughly testing their
patience at times, they have supported me relentlessly in all matters of life. By passing on their
experience and imprinting me with their values they have given me the ability to see the world
with open eyes and inspired me to live off the beaten path. They have allowed me to pursue my
goals and for this I am forever thankful.
Das Erste, was der Mensch im Leben vorfindet, das Letzte wonach er die Hand ausstreckt, das
Kostbarste was er im Leben besitzt ist die Familie – Adolf Kolping
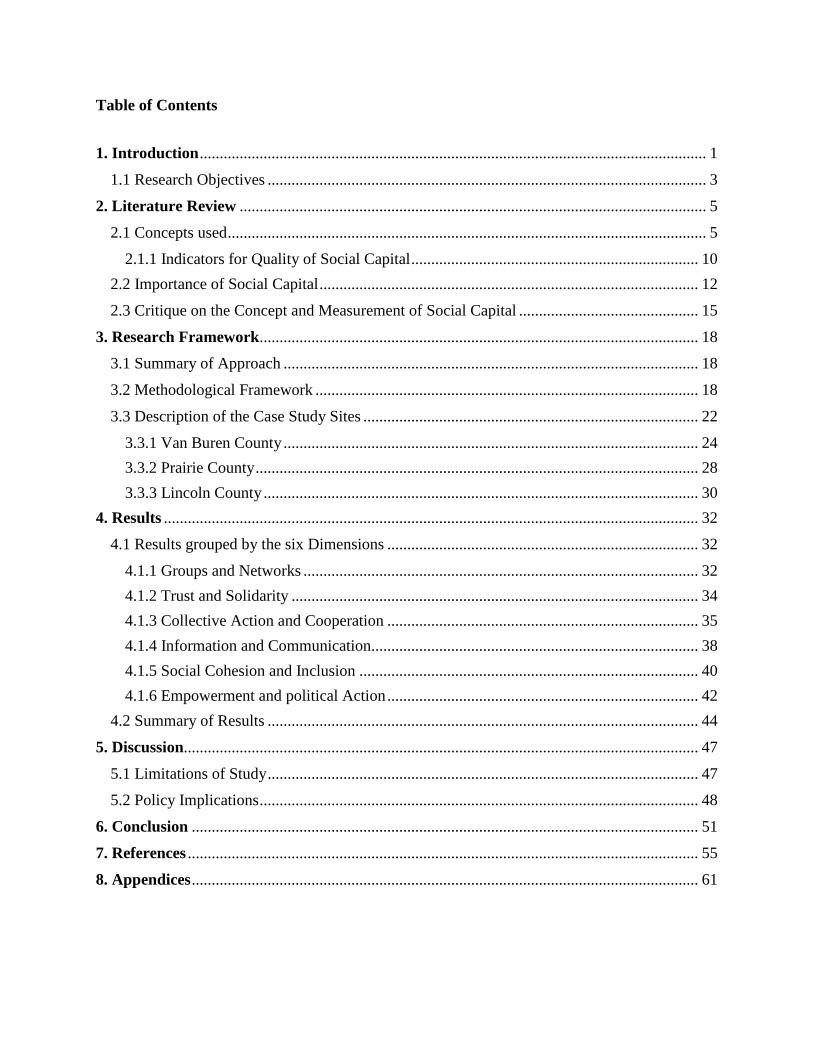
Table of Contents
1. Introduction ............................................................................................................................... 1
1.1 Research Objectives .............................................................................................................. 3
2. Literature Review ..................................................................................................................... 5
2.1 Concepts used ........................................................................................................................ 5
2.1.1 Indicators for Quality of Social Capital ........................................................................ 10
2.2 Importance of Social Capital ............................................................................................... 12
2.3 Critique on the Concept and Measurement of Social Capital ............................................. 15
3. Research Framework.............................................................................................................. 18
3.1 Summary of Approach ........................................................................................................ 18
3.2 Methodological Framework ................................................................................................ 18
3.3 Description of the Case Study Sites .................................................................................... 22
3.3.1 Van Buren County ........................................................................................................ 24
3.3.2 Prairie County ............................................................................................................... 28
3.3.3 Lincoln County ............................................................................................................. 30
4. Results ...................................................................................................................................... 32
4.1 Results grouped by the six Dimensions .............................................................................. 32
4.1.1 Groups and Networks ................................................................................................... 32
4.1.2 Trust and Solidarity ...................................................................................................... 34
4.1.3 Collective Action and Cooperation .............................................................................. 35
4.1.4 Information and Communication.................................................................................. 38
4.1.5 Social Cohesion and Inclusion ..................................................................................... 40
4.1.6 Empowerment and political Action .............................................................................. 42
4.2 Summary of Results ............................................................................................................ 44
5. Discussion................................................................................................................................. 47
5.1 Limitations of Study ............................................................................................................ 47
5.2 Policy Implications .............................................................................................................. 48
6. Conclusion ............................................................................................................................... 51
7. References ................................................................................................................................ 55
8. Appendices ............................................................................................................................... 61
List of Tables
Table 1: Social Capital Indicators in Italy .................................................................................... 16
Table 2: List of Participants .......................................................................................................... 21
Table 3: Education Level of Participants ...................................................................................... 22
Table 4: Median Age .................................................................................................................... 22
Table 5: Religious Adherents per County ..................................................................................... 24
Table 6: County Data for Rupasingha, Goetz, and Freshwater’s Social Capital Index Indicators 28
List of Figures
Figure 1: Dimensions of Social Capital .......................................................................................... 6
Figure 2: Relationship between the different Forms of Capital .................................................... 14
Figure 3: Location of the Case Study Sites ................................................................................... 25
Figure 4: Annual Estimates of the Resident Population 2005-2015 ............................................. 25
Figure 5: Median Household Income 2005-2015 ......................................................................... 26
Figure 6: Unemployment Rate (not seasonally adjusted) ............................................................. 26

Abbreviations
GDP Gross Domestic Product
NCCS National Center for Charitable Statistics
OECD Organization for Economic Co-Operation and Development
WVS World Value Survey
1
1. Introduction
Rural America has been found to have a very rich community life (Kellogg Foundation, 2002)
Butler Flora, Flora, and Gasteyer (2015) describe McKenzie Country North Dakota, a very rural
area, where local shops trust their customer to pay later if they forget their checkbook.
Ranchers work together to sustainably graze the land. Members of the community band together
to erect a local playground. These examples can be seen as evidence for high levels of social
capital. Alongside cultural capital and human capital, the concept of social capital, while a less
tangible form of capital, is increasingly studied in the socio-economic literature. The database
ProQuest renders 47,137 results for the period of 1996-2016 for a keyword search on social
capital. The growing literature on the topic has shown the various areas on which social capital
can have an influence. Some examples include Putnam, Leonardi and Nonetti (1993), who
investigated the role of social capital in the economic advantage the north of Italy has over the
south. Akçomak and ter Weel (2012) found a correlation between crime rates and the level of
social capital and Acar (2011) found a positive influence of social capital on educational
performance. Organizations such as the World Bank and the Organization for Economic Co-
Operation and Development (OECD) have recognized the importance of social capital for rural
development and are actively integrating social capital measures in their programs. Messeley,
Rogge, and Dessein (2013) for example explored if actors could be actively engaged in reflecting
on the development of their region by using the rural web as a mobilizing tool. The rural web is a
new comprehensive theoretical framework on rural development that incorporates social capital
as one of its six main components.
In contrast to most other forms of capital researchers still have not been able to completely agree
on a universal definition. Putnam (1995) for example defined social capital as ‘features of social
2
organization such as networks, norms, and social trust that facilitate coordination and
cooperation for mutual benefit’. This differs significantly from Bourdieu’s definition which
defines social capital as ‘the aggregate of the actual or potential resources which are linked to
possession of a durable network of more or less institutionalized relationships of mutual
acquaintance and recognition’ (Bourdieu 1983). Partly due to the lack of agreement on one
definition a broad variety of methods to measure social capital has been developed. Most of them
focus on quantitative measures such as memberships in groups and organizations or the voter
turnout. Although they do not necessarily reflect the multidimensionality of social capital they
can be seen as indicators of the level of social capital in the particular area.
Rupasingha, Goetz, and Freshwater (2006) conducted a study that measured the quantitative
level of social capital on a county basis. Using principal component analysis the researchers
employed the associational density, the voter turnout in the last presidential elections, the
county-level response rate to the U.S. Census Bureau’s decennial census and the number of tax-
exempt non-profit organizations to create a county level index of social capital. This index shows
differences in the level of social capital across all U.S. counties with McKenzie County ranking
in the upper mid-range. While their study combines several quantitative metrics in order to create
an index of the level of social capital it completely ignores the quality aspect of social capital.
According to Morrow (1999) this is a common flaw in U.S. studies on social capital. The typical
study focuses on the analysis of large quantitative data sets and does not explore the quality of
social capital. Some studies distinguish between different forms of social capital, most
commonly bonding, bridging and sometimes also linking social capital (e.g. (Hawkins and
Maurer 2010) (Babaei, Ahmad and Gill 2012)). According to Putnam (2000) bonding social
capital is a sociological superglue and bridging social capital acts as a sociological WD-40.
3
Differentiating between the strength of relationships can be seen as an indicator for quality,
however it again only focuses on one aspect of social capital instead of acknowledging the
multidimensionality. Studying the quality of social capital will fill this knowledge gap.
Additionally, an understanding of differences in quality might be able to provide insights on
differences in quantity of social capital. Based on the aforementioned multidimensionality of
social capital, I define certain indicators and characteristics measuring quality for the different
dimensions of social capital. They include among others the reliability of information members
receive from their network and the inclusiveness of the communities and groups. Following one
of the few guides available on qualitative research on social capital, which was published by the
World Bank (2006), I conducted 30 semi-structured interviews in three rural counties in
Arkansas. The interviews aimed to gain insights on the research objectives described below.
I organized this study as follows. Chapter 2 is a literature review of the concept of social capital,
the importance of it and of the different measurements of social capital. This is followed in
Chapter 3 by an explanation of the research framework and methods used to conduct the study.
Additionally, the case study sites are described. In Chapter 4 the results research are stated.
Finally, I describe the limitations of my study and propose certain policy implications.
1.1 Research Objectives
The geographical focus area of my research are the rural counties in Arkansas, in particular three
counties that I chose as case study sites. Representing the counties that rank the highest the
lowest and the median for rural Arkansas counties in Rupasingha, Goetz, and Freshwater’s
(2006) index, I aimed to depict the range of levels of social capital. By conducting semi-
structured interviews in each of the case study sites, I intended to obtain observations to address
4
my research objectives. Due to the fact that this analysis is predominantly based on a qualitative
approach of an inductive nature, I chose to follow two main research objectives instead of a
hypothesis. The first objective is to identify the most salient themes and topics of each dimension
of social capital. The identified themes and topics will be used to frame my discussion of
similarities and differences in the dimensions of social capital among the three case study
counties and to aid in an evaluation on the quality of social capital in these three counties. The
second objective is to assess whether there are perceivable similarities and differences in the
quality of social capital among the three chosen case study sites.
5
2. Literature Review
2.1 Concepts used
Due to the complexity of the concept, it is necessary that I provide an explanation of how the
term social capital itself was interpreted in this thesis and how the quality aspect of it was
understood.
First it must be admitted that there is no broadly agreed upon definition in contrast to other forms
of capital such as the economic or human capital. Several papers have aimed to collect, compare
and/or find the common factor that unites all the definitions (e.g. (Adler and Kwon 2002,
Scrivens and Smith 2013, Hernandez 2015). The three most commonly used definitions are
provided by Pierre Bourdieu, James Coleman and Robert Putnam.
Focusing on the gain to an individual that can be achieved through the utilization of social capital
Bourdieu developed a very theoretical definition of the concept. According to him social capital
is ‘the aggregate of the actual or potential resources which are linked to possession of a durable
network of more or less institutionalized relationships of mutual acquaintance and recognition’
(Bourdieu 1983). In contrast, Coleman recognized the potential of social capital not only for the
individual but as well as for the community. He also describes its potential to benefit the private
and the public good (Scrivens and Smith 2013). According to him social capital can be ‘defined
by its function. It is not a single entity but a variety of different entities, with two elements in
common: they all consist of some aspect of social structures, and they facilitate certain actions of
actors-whether persons or corporate actors-within the structure’ (Coleman 1988). Finally,
Putnam was deeply influenced by Coleman’s work. In contrast to Coleman, who focused on the
micro- and meso-level of networks, Putnam perceived social capital as predominantly operating
at the macro- and meso-levels of society (Scrivens and Smith 2013). He defined social capital as
6
‘features of social organization such as networks, norms, and social trust that facilitate
coordination and cooperation for mutual benefit’ (Putnam 1995).
An in-depth analysis of similarities and differences between the three authors can be found in an
OECD working paper compiled by Scrivens and Smith (2013). They conclude that a single
definition that represents all the different elements of social capital, such as personal
relationships, civic engagement, trust and cooperative norms, might be a hindrance for statistical
measurement and analytical understanding. Agreeing with this, I decided to use the conceptual
framework published by the World Bank on qualitative research on social capital. The
framework recognizes the multidimensionality of the concept and chooses to organize it into six
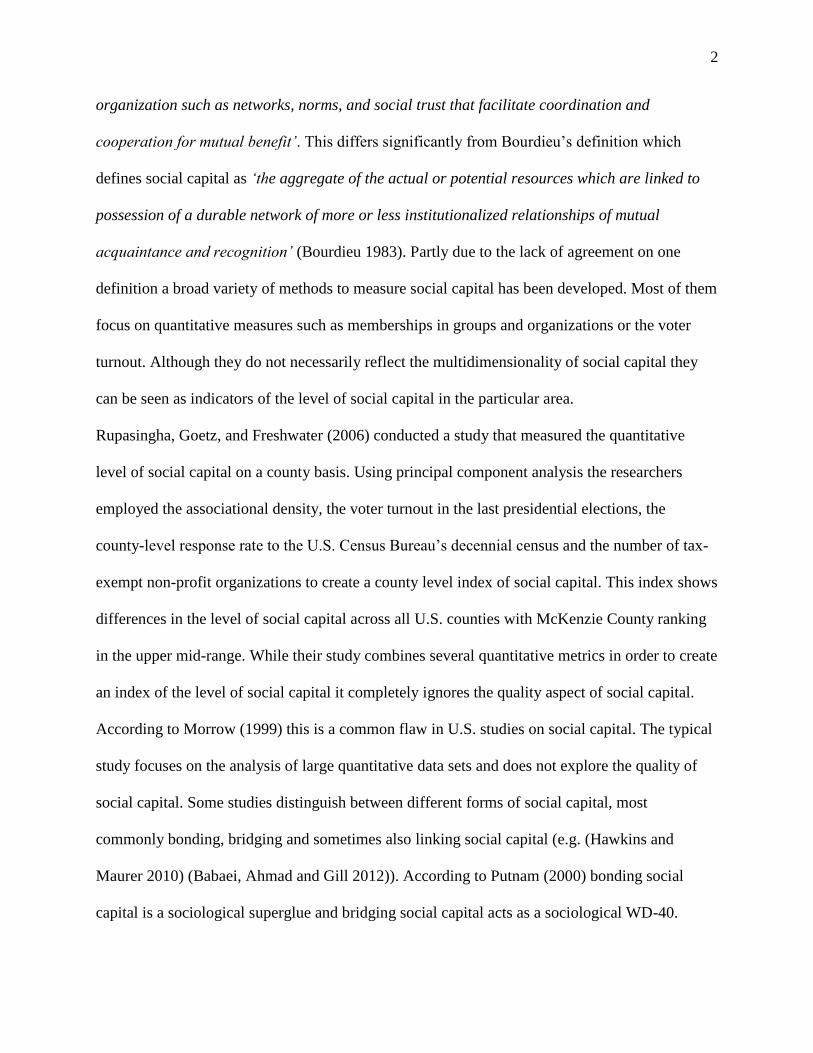
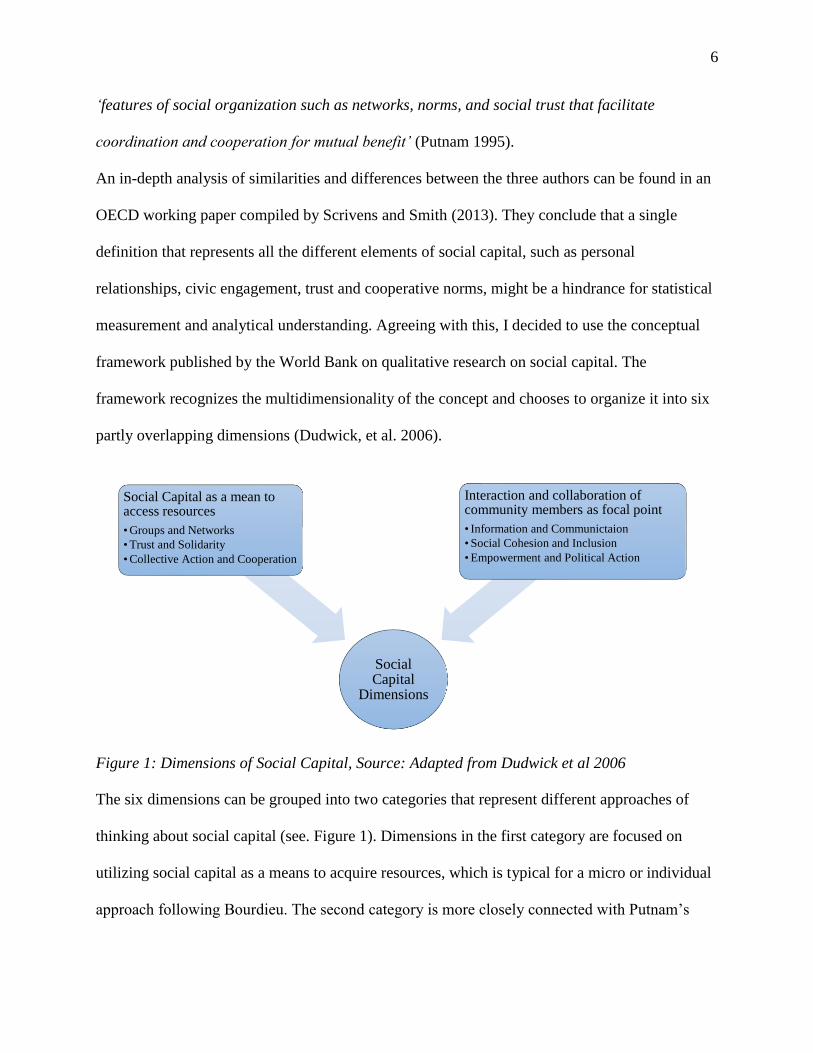
partly overlapping dimensions (Dudwick, et al. 2006).
Figure 1: Dimensions of Social Capital, Source: Adapted from Dudwick et al 2006
The six dimensions can be grouped into two categories that represent different approaches of
thinking about social capital (see. Figure 1). Dimensions in the first category are focused on
utilizing social capital as a means to acquire resources, which is typical for a micro or individual
approach following Bourdieu. The second category is more closely connected with Putnam’s
Social Capital
Dimensions
Social Capital as a mean to access resources
• Groups and Networks
• Trust and Solidarity
• Collective Action and Cooperation
Interaction and collaboration of community members as focal point
• Information and Communictaion
• Social Cohesion and Inclusion
• Empowerment and Political Action
7
ideology by making the interaction and collaboration of community members the focal point
(Dudwick, et al. 2006).
In the following section I will briefly describe the six different dimensions. The descriptions
contain certain aspects that can be associated with the quality of social capital; however, I
provide additional indicators for the quality in Chapter 2.2.
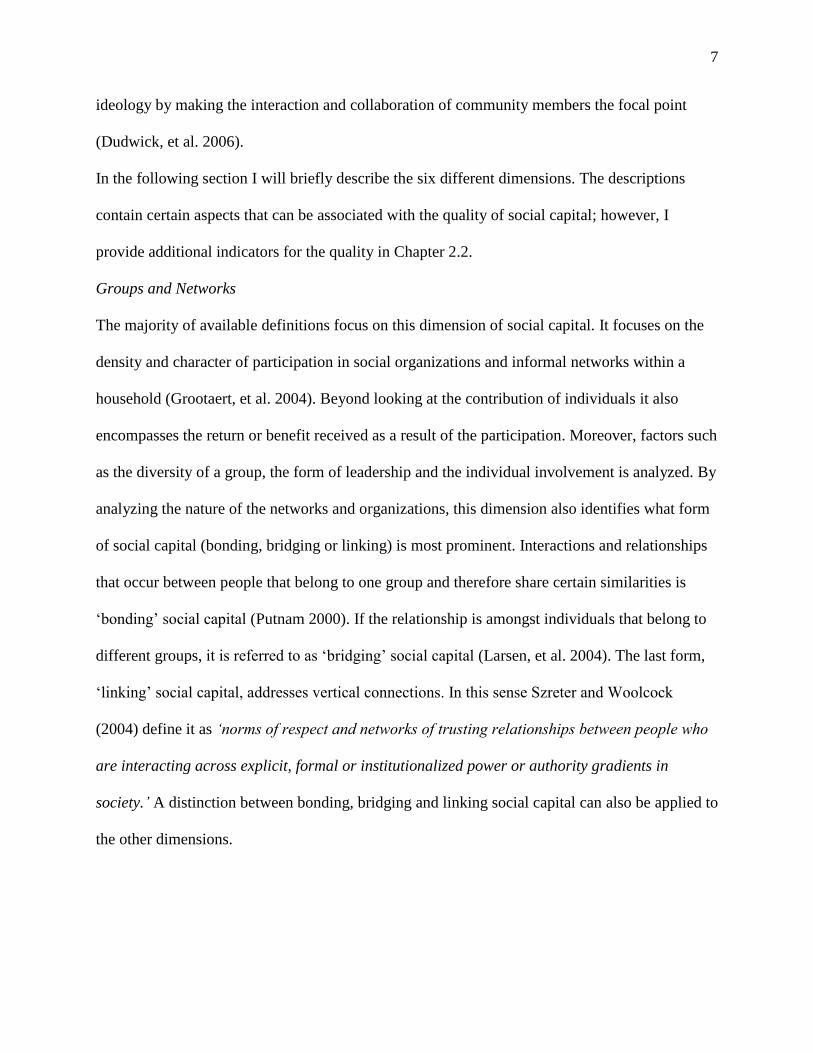
Groups and Networks
The majority of available definitions focus on this dimension of social capital. It focuses on the
density and character of participation in social organizations and informal networks within a
household (Grootaert, et al. 2004). Beyond looking at the contribution of individuals it also
encompasses the return or benefit received as a result of the participation. Moreover, factors such
as the diversity of a group, the form of leadership and the individual involvement is analyzed. By
analyzing the nature of the networks and organizations, this dimension also identifies what form
of social capital (bonding, bridging or linking) is most prominent. Interactions and relationships
that occur between people that belong to one group and therefore share certain similarities is
‘bonding’ social capital (Putnam 2000). If the relationship is amongst individuals that belong to
different groups, it is referred to as ‘bridging’ social capital (Larsen, et al. 2004). The last form,
‘linking’ social capital, addresses vertical connections. In this sense Szreter and Woolcock
(2004) define it as ‘norms of respect and networks of trusting relationships between people who
are interacting across explicit, formal or institutionalized power or authority gradients in
society.’ A distinction between bonding, bridging and linking social capital can also be applied to
the other dimensions.
8
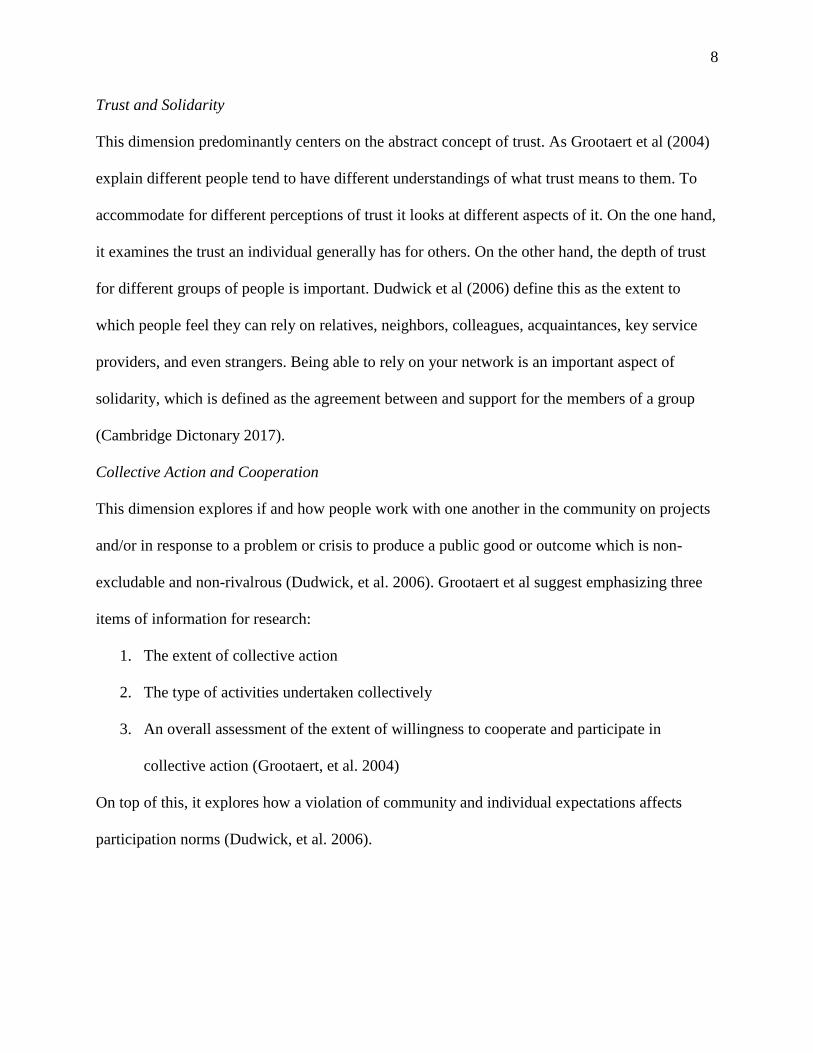
Trust and Solidarity
This dimension predominantly centers on the abstract concept of trust. As Grootaert et al (2004)
explain different people tend to have different understandings of what trust means to them. To
accommodate for different perceptions of trust it looks at different aspects of it. On the one hand,
it examines the trust an individual generally has for others. On the other hand, the depth of trust
for different groups of people is important. Dudwick et al (2006) define this as the extent to
which people feel they can rely on relatives, neighbors, colleagues, acquaintances, key service
providers, and even strangers. Being able to rely on your network is an important aspect of
solidarity, which is defined as the agreement between and support for the members of a group
(Cambridge Dictonary 2017).
Collective Action and Cooperation
This dimension explores if and how people work with one another in the community on projects
and/or in response to a problem or crisis to produce a public good or outcome which is non-
excludable and non-rivalrous (Dudwick, et al. 2006). Grootaert et al suggest emphasizing three
items of information for research:
1. The extent of collective action
2. The type of activities undertaken collectively
3. An overall assessment of the extent of willingness to cooperate and participate in
collective action (Grootaert, et al. 2004)
On top of this, it explores how a violation of community and individual expectations affects
participation norms (Dudwick, et al. 2006).
9
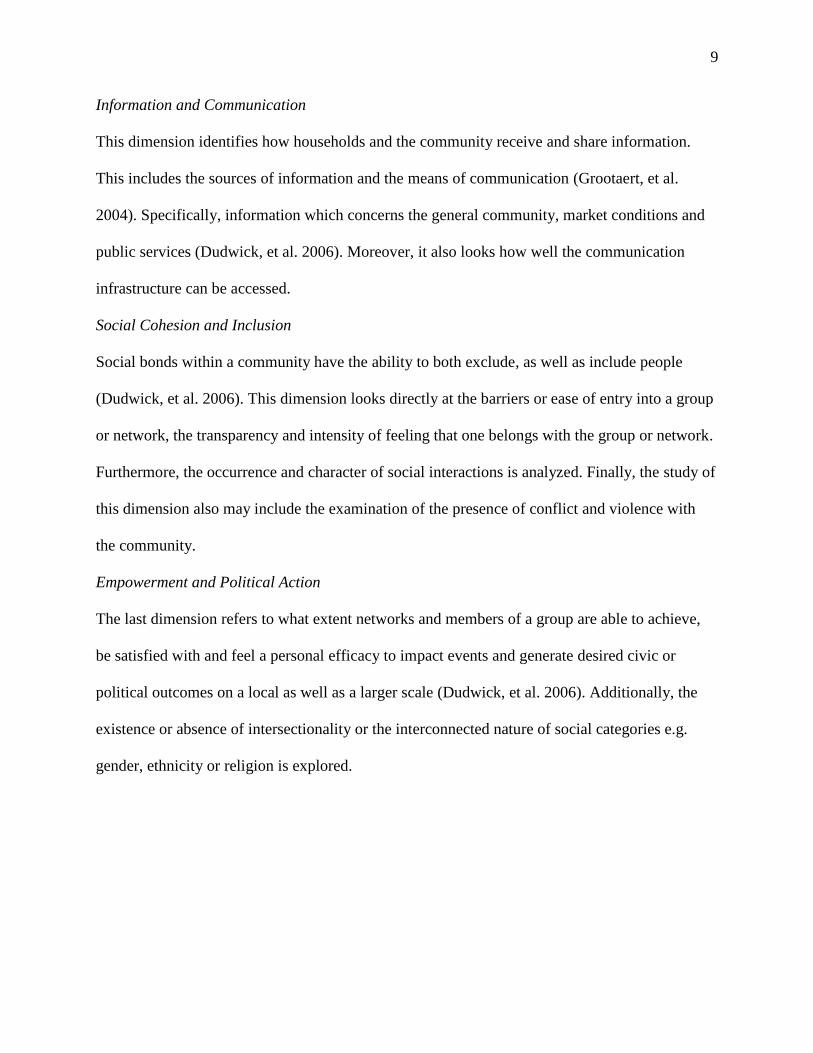
Information and Communication
This dimension identifies how households and the community receive and share information.
This includes the sources of information and the means of communication (Grootaert, et al.
2004). Specifically, information which concerns the general community, market conditions and
public services (Dudwick, et al. 2006). Moreover, it also looks how well the communication
infrastructure can be accessed.
Social Cohesion and Inclusion
Social bonds within a community have the ability to both exclude, as well as include people
(Dudwick, et al. 2006). This dimension looks directly at the barriers or ease of entry into a group
or network, the transparency and intensity of feeling that one belongs with the group or network.
Furthermore, the occurrence and character of social interactions is analyzed. Finally, the study of
this dimension also may include the examination of the presence of conflict and violence with
the community.
Empowerment and Political Action
The last dimension refers to what extent networks and members of a group are able to achieve,
be satisfied with and feel a personal efficacy to impact events and generate desired civic or
political outcomes on a local as well as a larger scale (Dudwick, et al. 2006). Additionally, the
existence or absence of intersectionality or the interconnected nature of social categories e.g.
gender, ethnicity or religion is explored.
10
2.1.1 Indicators for Quality of Social Capital
While the description of the dimensions incorporate quantity and quality aspects, it is necessary
to understand how exactly quality was understood in connection with social capital and which
indicators were used to measure it in this thesis.
‘Quality’ according to the Cambridge dictionary (2017) refers to the degree of excellence of
something. The direct measurement of quality is difficult due to the subjective and abstract
nature of it. While the database ProQuest renders 47,137 results between 1996-2016 for a
keyword search on social capital, it only provides 36 results for the keyword search on quality of
social capital. In addition, the majority of the 36 listed results do not provide any further
explanations about what exactly is meant by quality of social capital. One exception is a study by
Lee (2010). The author defined the quality of social capital as the associational commitment and
interaction. In particular he measured the participation in group meetings and activities and
political discussions, which were specific to his research. Lee defined an active participation as
an indicator for high quality of social capital. While this ventures into the first dimension of
social capital, Groups and Networks, it does not include the aspects of the other five dimensions.
For my research I identified certain indicators and characteristics for each of the six dimensions
beyond the ones mentioned above that provide an insight into the quality of social capital. It is
important to note that the dimensions are interrelated and therefore some of the indicators and
findings apply to more than one dimension.
For the dimension of Groups and Networks, the quality aspect is among other things reflected in
how involved a person is in his or her groups and networks and how they interact with other
members. Another indicator for quality in this dimension is the return members receive through
11
their membership and how they can utilize the groups and networks to achieve individual
outcomes.
In the dimension of Trust and Solidarity, quality presents itself in the level of trust and solidarity
among not only friends and family but also with other members of the community such as
neighbors, colleagues and key service providers. The intimacy of the relationships and the ability
to rely and confide into other community members acts as indicators.
The quality of Collective Action and Cooperation is analyzed through several indicators.
Whether an individual or a community can or even has to rely on their networks and groups is
one indicator. How the collective action and cooperation functions among the community
members is another one. Lastly the level on which cooperation takes place serves as a proxy.
Level in this case refers to the geographical range of cooperation, e.g. within the community,
county, state, etc. and between whom the cooperation takes place, e.g. members of one age
group, social circle, etc..
The dependability of information members receive from their networks and groups, the way
members communicate and make decisions are indicators for the quality of Information and
Communication, the fourth dimension. I also look at how well they can access the
communication infrastructure.
In order to evaluate the quality of the fifth dimension of social capital Social Cohesion and
Inclusion within a community I look at how inclusive the groups are and how different groups,
people and communities work with one another. The bridging and linking aspect of social capital
is especially emphasized in this dimension.
In the last dimension Empowerment and Political Action, I use the extent and form of influence
that individuals and groups have within the community and on politics as indicators.
12
Furthermore, I also look at the conflict potential of decision making within groups and within the
community.
2.2 Importance of Social Capital
The descriptions above of the different dimensions and how quality expresses itself in the
different dimensions already provide an insight about how broad the concept is. In line with this
social capital influences a wide range of outcomes. A variety of studies have shown a positive
correlation between social capital and economic growth/success. Rupasingha, Goetz, and
Freshwater (2000) found that the per-capita income of counties with high levels of social capital
grew faster than in counties with low levels of social capital. In ‘Making democracy work’
(1993) Putnam, Leonardi, and Nonetti identified social capital as a key factor explaining why the
north of Italy outperformed the south economically. Knack & Keefer (1997) found trust and
civic cooperation have significant impacts on the aggregate economic activity for example by
triggering greater investments and promoting beneficial policies. A spatial analysis in Germany
showed a positive relationship between economic well-being and social capital on a regional and
local basis (Botzen 2016).
A positive correlation between higher levels of social capital and the performance of small
companies was found by Stam, Arzlanian, and Elfring (2014). In addition, social capital was
identified as positively contributing to a firm’s ability to identify opportunities (Bhagavatula, et
al. 2010).
The influence of social capital is however not only limited to economic factors, but expands far
beyond that. Akçomak & ter Weel (2012) investigated communities in the Netherlands and
13
found a significant correlation between crime rates and the level of social capital. Communities
that had higher levels of social capital had lower crime rates.
Another observed effect is the mainly positive influence of high social capital, especially within
a family, on educational performance (Acar 2011). Coleman (1988) found that social capital
contributes to lower dropout rates in high school and is therefore an important factor in building
human capital. Besides being beneficial for the level of education, social capital seems to also be
beneficial for an individual’s health (Hutchinson 2006).
Within the development context, different aspects of social capital were shown to be valuable in
areas such as resource management (Krishna and Uphoff 1999), the reduction of transaction cost
(Fafchamps and Minten 1998) and in making agricultural extension services more effective
(Reid and Salmen 2002).
However, while the results in the studies mentioned above indicate the significance of social
capital on social and individual outcomes, other studies (e.g. (Rupasingha, Goetz and Freshwater
2006) used factors such as crime rate or household income as indicators for measuring the level
of social capital. This highlights the complicated and reciprocal relationship of social capital and
associated factors. Moreover, several studies have also pointed out that an abundance of social
capital or high levels of social capital can also have negative effects. Woolcock and Narayan
(2000) emphasize that ‘social capital can be used to promote or to undermine the public good’
therefore highlighting the dualistic nature of it. Portes (1998) summarized four negative
consequences that can be related to social capital: (1) exclusion of outsiders, (2) excess claims on
group members, (3) restrictions on individual freedoms, and (4) downward leveling norms.
Examples Portes (1998) gives for this are e.g. the Mafia and youth gangs.
14
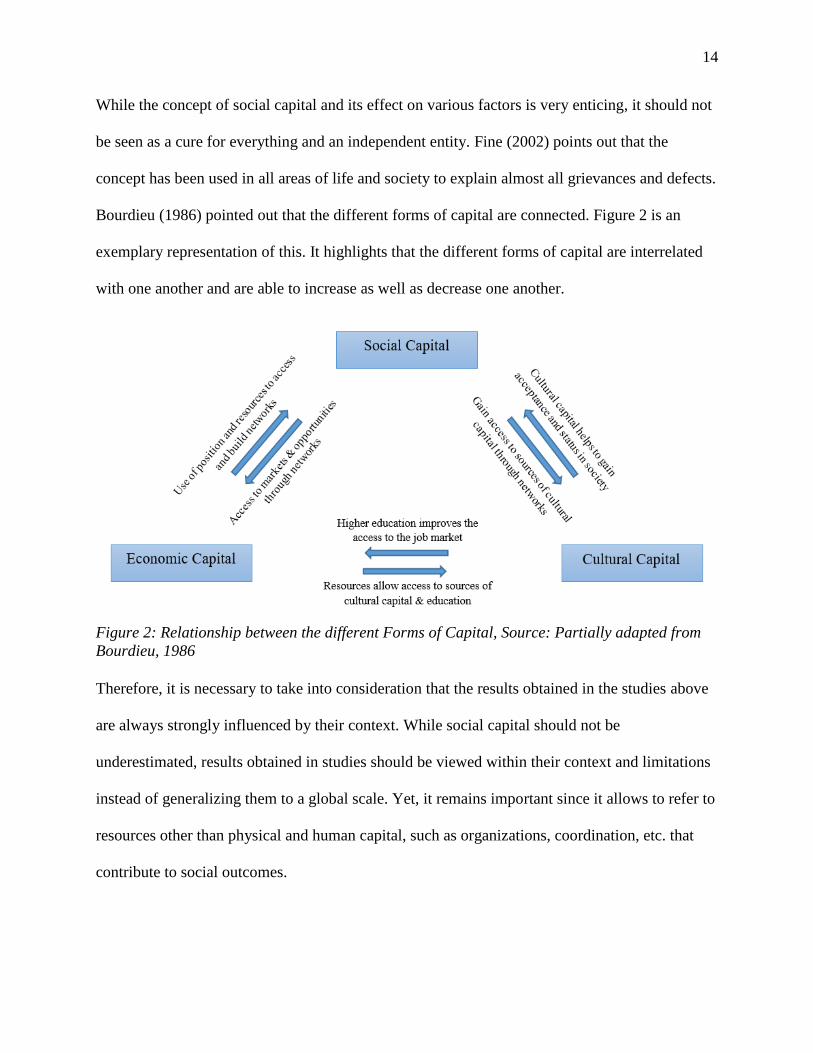
While the concept of social capital and its effect on various factors is very enticing, it should not
be seen as a cure for everything and an independent entity. Fine (2002) points out that the
concept has been used in all areas of life and society to explain almost all grievances and defects.
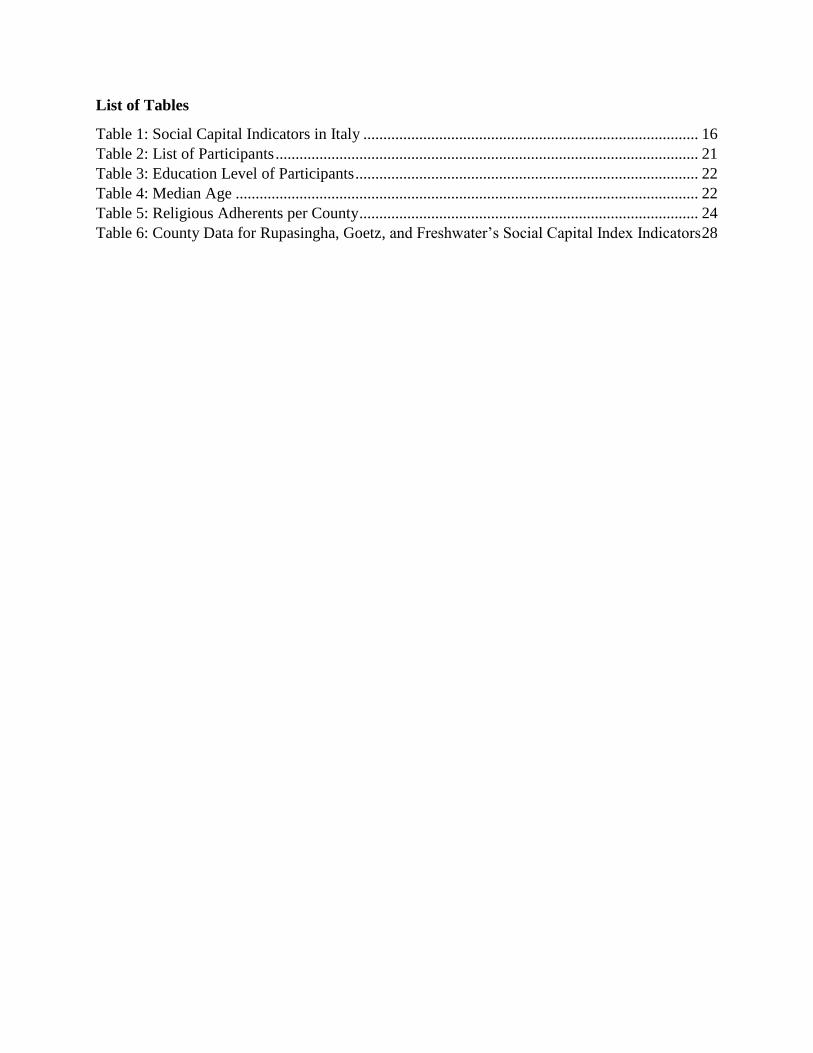
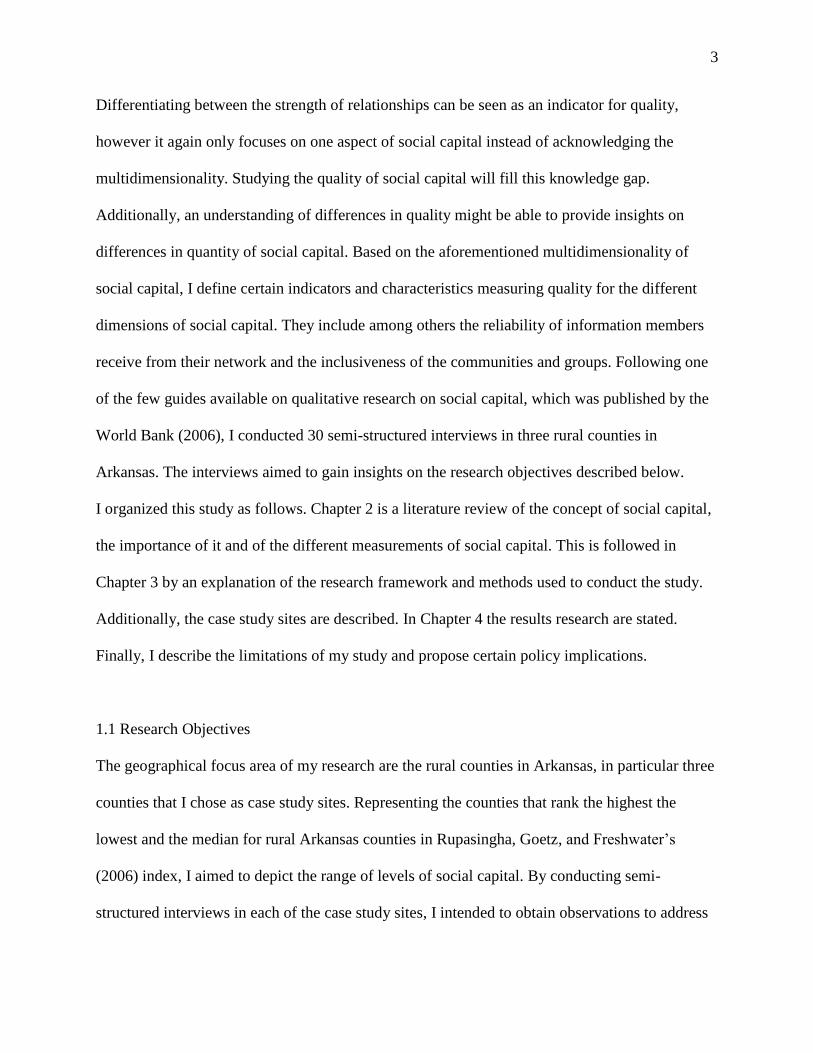
Bourdieu (1986) pointed out that the different forms of capital are connected. Figure 2 is an
exemplary representation of this. It highlights that the different forms of capital are interrelated
with one another and are able to increase as well as decrease one another.
Figure 2: Relationship between the different Forms of Capital, Source: Partially adapted from
Bourdieu, 1986
Therefore, it is necessary to take into consideration that the results obtained in the studies above
are always strongly influenced by their context. While social capital should not be
underestimated, results obtained in studies should be viewed within their context and limitations
instead of generalizing them to a global scale. Yet, it remains important since it allows to refer to
resources other than physical and human capital, such as organizations, coordination, etc. that
contribute to social outcomes.
15
2.3 Critique on the Concept and Measurement of Social Capital
The literature on social capital is replete with discussions of the problems of properly measuring
social capital (e.g. (Guiso, Sapienza and Zingales 2004, Grootaert and van Bastelaer 2001,
Tzanakis 2013). Two critiques are often central to the discussion. First, opponents of the concept
comment on the designation of social capital as capital. They contend that social capital lacks
certain attributes of capital. Arrow (1999) argues that one important aspect of capital is that there
has to be a ‘deliberate sacrifice in the present for future benefit’. According to the author, this
does not hold true for social networks. Robinson, Schmid, and Siles (2002) counter by arguing
that the concept may indeed imply saving and investment for a future payoff. Baron and Hannan
(1994) criticize that social capital is acquired without opportunity cost, a prerequisite for capital.
Yet, building networks, trust and relationships requires the expenditure of time and effort, which
can be seen as the opportunity cost of social capital. The second critique regards the entire
concept of social capital. Bjørnskov and Sønderskov (2013) reason that the general concept of
social capital lacks coherence as defined by Gerring (1999), therefore making it unsuitable as a
general concept. However, they acknowledge that the coherence greatly varies between the
different conceptualizations.
Grootaert and Bastelaer (2001) describe critiques they received for using proxies instead of
direct measurements. As the authors explain though, the use of proxies is also a common practice
in the measurement of human capital. The lack of a direct form of measurement and use of
proxies has not prevented researchers to make great advances in the field. Additionally, it has
also not led people to mistake the proxies with human capital itself.
In their comparative study of northern and southern Italy Putnam, Leonardi, and Nonetti (1993)
used a census of membership in groups and associations as an indicator to measure social capital.
16
Their approach is the most common one and was used by other scholars in the field (e.g. (Casey
2004) (Beugelsdijk and van Schaik 2005)). An important question that remains when such an
approach is chosen is whether indicators such as trust and group membership are a consequence
or a source of social capital itself (Woolcock 1998). While group membership is relatively easy
to determine, trust is a more abstract construct. Surveys such as the World Value Survey (WVS)
elicit variables that attempt to represent trust. The OECD (2001) criticizes the validity of the
findings. They argue that some of the questions related to trust contain an interpretation bias. The
multidimensionality of social capital complicates the measurement, since it requires several
indicators, which reflect the multifaceted nature. Nevertheless, this also allows for a wide array
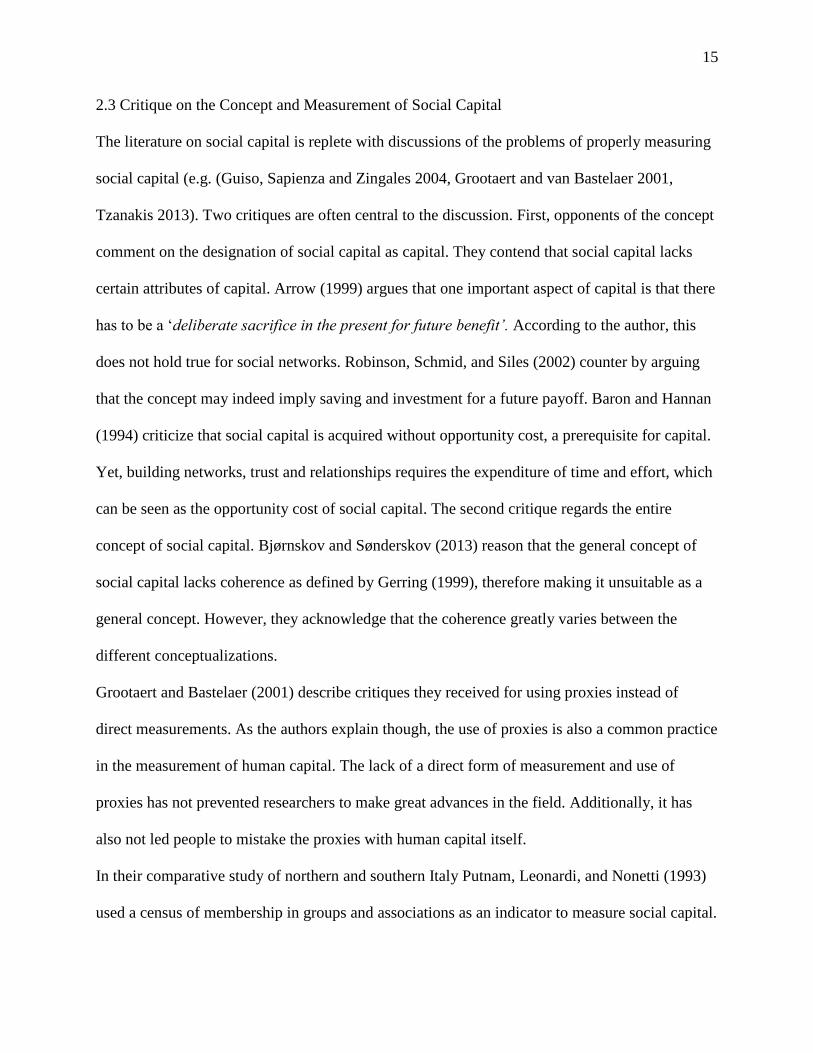
of indicators that can be chosen. Table 1, compiled by Andriani (2013), compares several studies
on social capital and their indicators against one another.
Table 1: Social Capital Indicators in Italy, Source: Andriani, 2013
Nuzzo (2006) Sabatini (2009) Guiso et al (2004)
Synthetic measures Synthetic measures Outcome-based measures
Sub-indicators
A Social Participation
B Political Participation
C Trust
Final indicator
SC = simple mean of
A + B + C
Five Indicators
1.Family ties
2. Informal networks of
friends and neighbours
3. Voluntary Organisations
4. Indicator of political
participation
5. Indicator of civic
awareness
Two indicators
1. Blood donation
2. Electoral turnout
17
As the table shows most of them focus on quantitatively collectable data. The World Bank
(2006) published a guide to using qualitative methods for social capital research. As the guide
points out, it is necessary to complement quantitative data with qualitative data to obtain all-
embracing results. A more comprehensive summary of measurement approaches can be found in
e.g. Andriani’s 2013 study.
Despite the wide range of empirical studies on social capital the focus of many studies is almost
solely on the nature of social capital (bonding, bridging, linking) or the quantity of social
relations, memberships, associational activities, etc. (Morrow 1999). The former approach does
incorporate aspects of quality but as mentioned above the studies often focus their attention on
just one aspect of social capital such as the nature and depth of the relationship (Putnam 2000).
By having defined indicators for quality for the six dimensions of social capital I am able to
avoid this short-coming.
18
3. Research Framework
3.1 Summary of Approach
Based on my research objectives, I developed the framework of analysis to address each
objective. First, I selected three counties using purposive choice to include countries with high,
medium and low levels of social capital as estimated by Rupasingha, Goetz, and Freshwater
(2006). I then developed a semi-structured interview process involving a set of community
members in each of the counties to respond to a set of open ended questions (See Appendix 1).
An institutional research board protocol was developed and submitted for approval (See
Appendix 2). I identified the primary participants by contacting key actors and stakeholders of
the community, such as governmental officials and leaders of groups and organizations. I then
found the subsequent participants through snowball sampling. The interviews were conducted
during the period of April 13th to May 8th 2017. I conducted the interviews as face-to-face or via
telephone or skype. I transcribed notes from the interviews and entered them into the NVivo
software to identify common themes and words.
3.2 Methodological Framework
The focus of my thesis is social capital in rural counties in Arkansas. I purposively selected three
counties based on Rupasingha, Goetz, and Freshwater’s (2006) data collection for 2009 on the
production of social capital in U.S. counties. The researchers created a county-level index of
social capital based on the voter turnout in the last presidential elections, the county-level
response rate to the U.S. Census Bureau’s decennial census, and the number of tax-exempt non-
profit organizations. In addition, they also looked at the associational density in each county. In
order to achieve a representation of the range of different levels of social capital, the three
19
counties that I selected represent the rural counties in Arkansas with the highest score on the
2009 county level index (Van Buren), the median score (Prairie) and the lowest score (Lincoln).
With regards to the associational density the counties rank similarly to the county-level index,
with Van Buren having the highest density, Lincoln being near the bottom and Prairie county
being close to the median. Comparable datasets are available for the years 1997, 2005, 2009 and
2014. The dataset for 2014 was published after the interviews were already completed. While
Van Buren County and Lincoln County maintained their rank, Prairie County ranked 4th out of
the 16 counties for 2014 showing an improvement to the previous results.
While I only look at certain aspects of social capital in this study, it is one of the only studies
analyzing social capital on a county basis. The Petris Social Capital Index (PSCI) is a similar
index. However, the PSCI limits its analysis to the number of employees hired at voluntary
organizations by the population of that county or state (Brown, et al. 2006). A study by Lee and
Kim (2013) recognized the limitations of Rupasingha, Goetz, and Freshwater’s index but
acknowledged its usefulness. The first limitation Lee and Kim see in the index is the use of
proxy-measures which might be an outcome of social capital rather than social capital itself. The
other limitation is the one dimensional focus of the index, which fails to explore the cognitive
dimension of social capital. The cognitive dimension according to the authors encompasses to
what extent social networking involves interpersonal trust and reciprocity (Lee and Kim 2013).
I define rural according to the definition of the U.S. Census Bureau. The agency differentiates
between rural and urban areas. Urban areas are those that encompass at least 2,500 people with at
least 1,500 of which reside outside institutional group quarters. Rural areas are those that do not
fall into this categorization (U.S. Census Bureau 2015a).
20
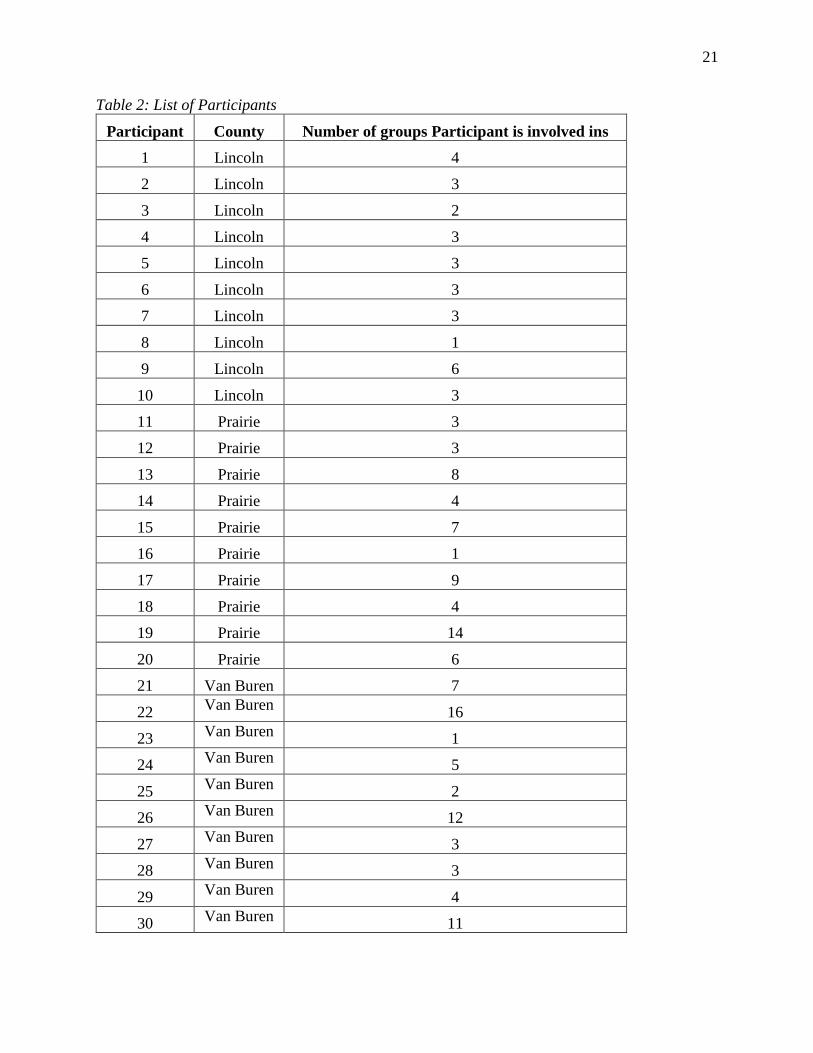
Within the rural counties I conducted a total number of 30 semi-structured with different
members of the respective communities (s. Table 2, 3 and 4). The semi-structured interviews
consisted of 8 main questions (s. Appendix 1). I provided them in advance to the interviewee and
supplemented them with individual follow-up questions. The questions cover the different
dimensions of social capital identified in Chapter 2.1. The above mentioned guide by the World
Bank recommends the use of interviews in the exploration of all dimensions of social capital
(Dudwick, et al. 2006). Additional qualitative approaches such as focus groups were not feasible
to conduct due to constraints on time and money
The participants were residents of the three counties from different areas of employment. I
identified the primary participants by contacting key actors and stakeholders of the community,
such as governmental officials and leaders of groups and organizations. I then found the
subsequent participants through snowball sampling.
The approach to examine the responses followed an emergent design concept. This meant that
while I defined certain main themes and sub-themes a priori based on the six dimensions of
social capital, new themes and concepts that I did not consider in the beginning were added
along the way. Based on the first analysis using the NVivo software, which is a qualitative data
management program (QSR International Pty Ltd. 2015). I then identified the most salient
themes and topics regarding the quality of social capital as well as examined the differences
between the individual counties. To do so I examined each transcribed interview with the NVivo
software. I coded the interviews according to the predetermined and emerging themes and sub-
themes. The different main and sub-themes were cross tabulated with one another based on an
overall and county-specific basis to identify connections and relations.
21
Table 2: List of Participants
Participant County Number of groups Participant is involved ins
1 Lincoln 4
2 Lincoln 3
3 Lincoln 2
4 Lincoln 3
5 Lincoln 3
6 Lincoln 3
7 Lincoln 3
8 Lincoln 1
9 Lincoln 6
10 Lincoln 3
11 Prairie 3
12 Prairie 3
13 Prairie 8
14 Prairie 4
15 Prairie 7
16 Prairie 1
17 Prairie 9
18 Prairie 4
19 Prairie 14
20 Prairie 6
21 Van Buren 7
22 Van Buren
16
23 Van Buren
1
24 Van Buren
5
25 Van Buren
2
26 Van Buren
12
27 Van Buren
3
28 Van Buren
3
29 Van Buren
4
30 Van Buren
11
22
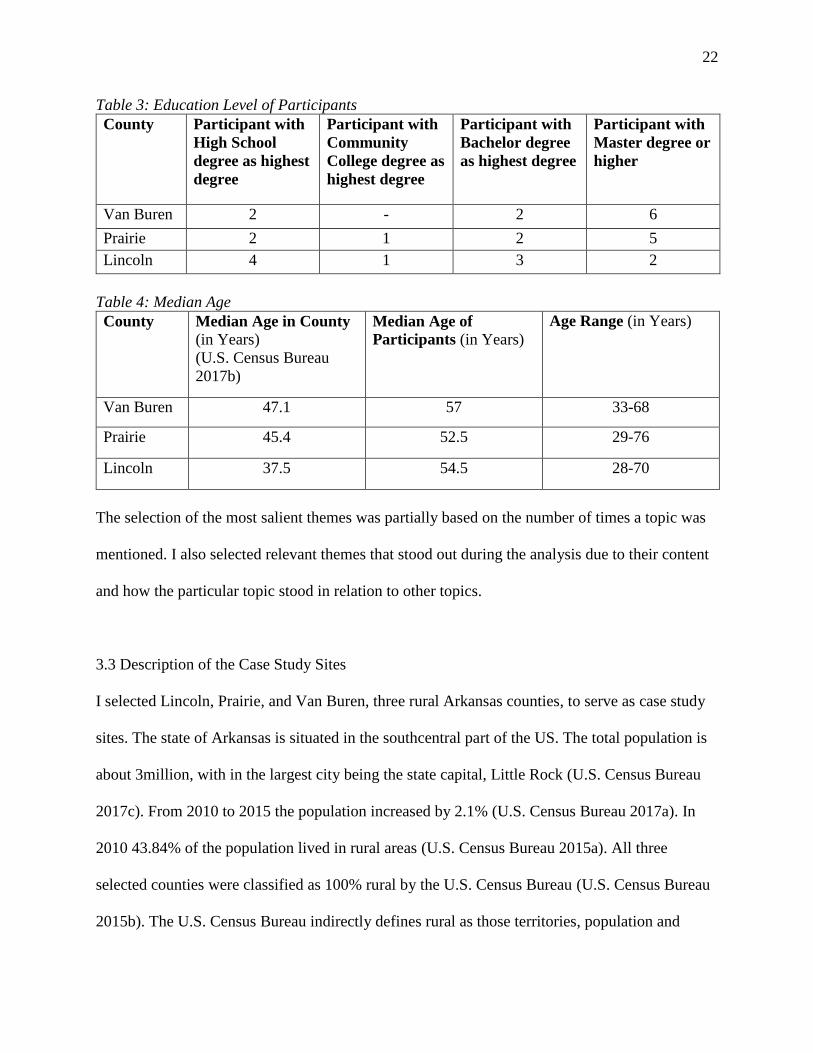
Table 3: Education Level of Participants
County Participant with
High School
degree as highest
degree
Participant with
Community
College degree as
highest degree
Participant with
Bachelor degree
as highest degree
Participant with
Master degree or
higher
Van Buren 2 - 2 6
Prairie 2 1 2 5
Lincoln 4 1 3 2
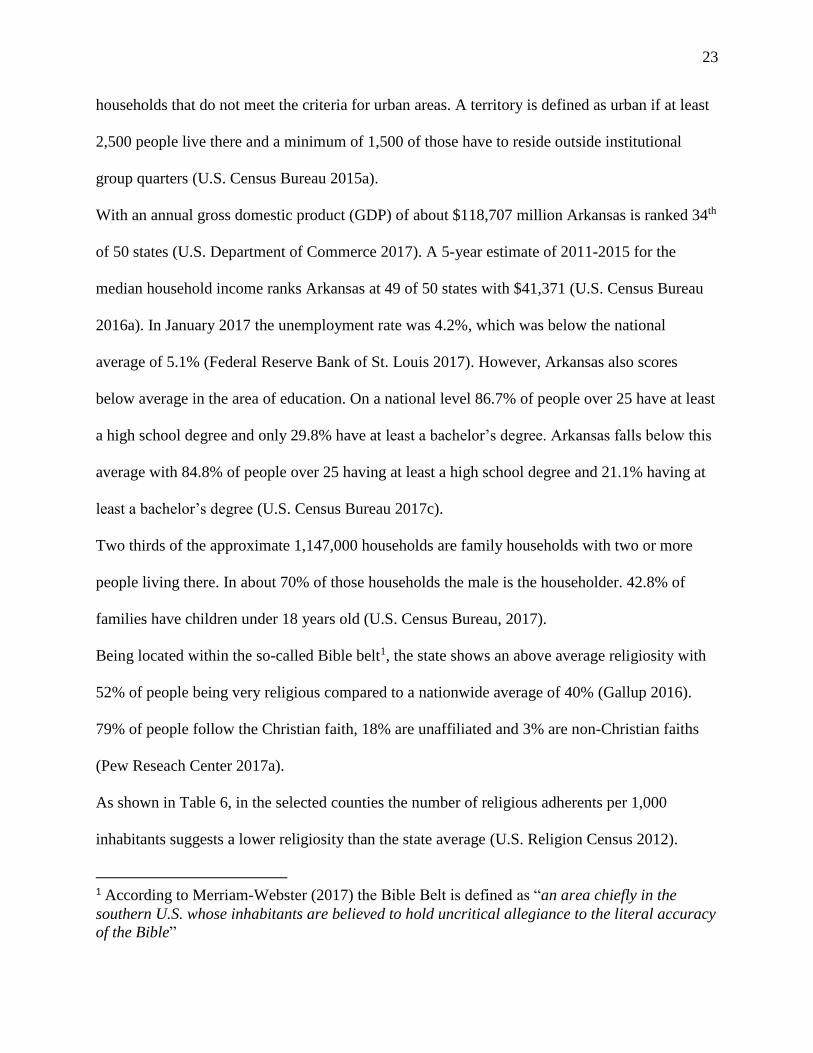
Table 4: Median Age
County Median Age in County
(in Years)
(U.S. Census Bureau
2017b)
Median Age of
Participants (in Years)
Age Range (in Years)
Van Buren 47.1 57 33-68
Prairie 45.4 52.5 29-76
Lincoln 37.5 54.5 28-70
The selection of the most salient themes was partially based on the number of times a topic was
mentioned. I also selected relevant themes that stood out during the analysis due to their content
and how the particular topic stood in relation to other topics.
3.3 Description of the Case Study Sites
I selected Lincoln, Prairie, and Van Buren, three rural Arkansas counties, to serve as case study
sites. The state of Arkansas is situated in the southcentral part of the US. The total population is
about 3million, with in the largest city being the state capital, Little Rock (U.S. Census Bureau
2017c). From 2010 to 2015 the population increased by 2.1% (U.S. Census Bureau 2017a). In
2010 43.84% of the population lived in rural areas (U.S. Census Bureau 2015a). All three
selected counties were classified as 100% rural by the U.S. Census Bureau (U.S. Census Bureau
2015b). The U.S. Census Bureau indirectly defines rural as those territories, population and
23
households that do not meet the criteria for urban areas. A territory is defined as urban if at least
2,500 people live there and a minimum of 1,500 of those have to reside outside institutional
group quarters (U.S. Census Bureau 2015a).
With an annual gross domestic product (GDP) of about $118,707 million Arkansas is ranked 34th
of 50 states (U.S. Department of Commerce 2017). A 5-year estimate of 2011-2015 for the
median household income ranks Arkansas at 49 of 50 states with $41,371 (U.S. Census Bureau
2016a). In January 2017 the unemployment rate was 4.2%, which was below the national
average of 5.1% (Federal Reserve Bank of St. Louis 2017). However, Arkansas also scores
below average in the area of education. On a national level 86.7% of people over 25 have at least
a high school degree and only 29.8% have at least a bachelor’s degree. Arkansas falls below this
average with 84.8% of people over 25 having at least a high school degree and 21.1% having at
least a bachelor’s degree (U.S. Census Bureau 2017c).
Two thirds of the approximate 1,147,000 households are family households with two or more
people living there. In about 70% of those households the male is the householder. 42.8% of
families have children under 18 years old (U.S. Census Bureau, 2017).
Being located within the so-called Bible belt1, the state shows an above average religiosity with
52% of people being very religious compared to a nationwide average of 40% (Gallup 2016).
79% of people follow the Christian faith, 18% are unaffiliated and 3% are non-Christian faiths
(Pew Reseach Center 2017a).
As shown in Table 6, in the selected counties the number of religious adherents per 1,000
inhabitants suggests a lower religiosity than the state average (U.S. Religion Census 2012).
1 According to Merriam-Webster (2017) the Bible Belt is defined as “an area chiefly in the
southern U.S. whose inhabitants are believed to hold uncritical allegiance to the literal accuracy
of the Bible”
24
Table 5: Religious Adherents per County, Source: U.S. Religion Census,2012
County Religious Adherents per 1,000 Inhabitants
Van Buren 408
Prairie 500
Lincoln 364
In the last ten presidential elections the Democrats only won in Arkansas in 1992 and 1996,
when Arkansas Governor Bill Clinton ran for office (National Archives and Records
Administration 2017). Since 2015 the Republican Asa Hutchinson has been the Governor of
Arkansas.
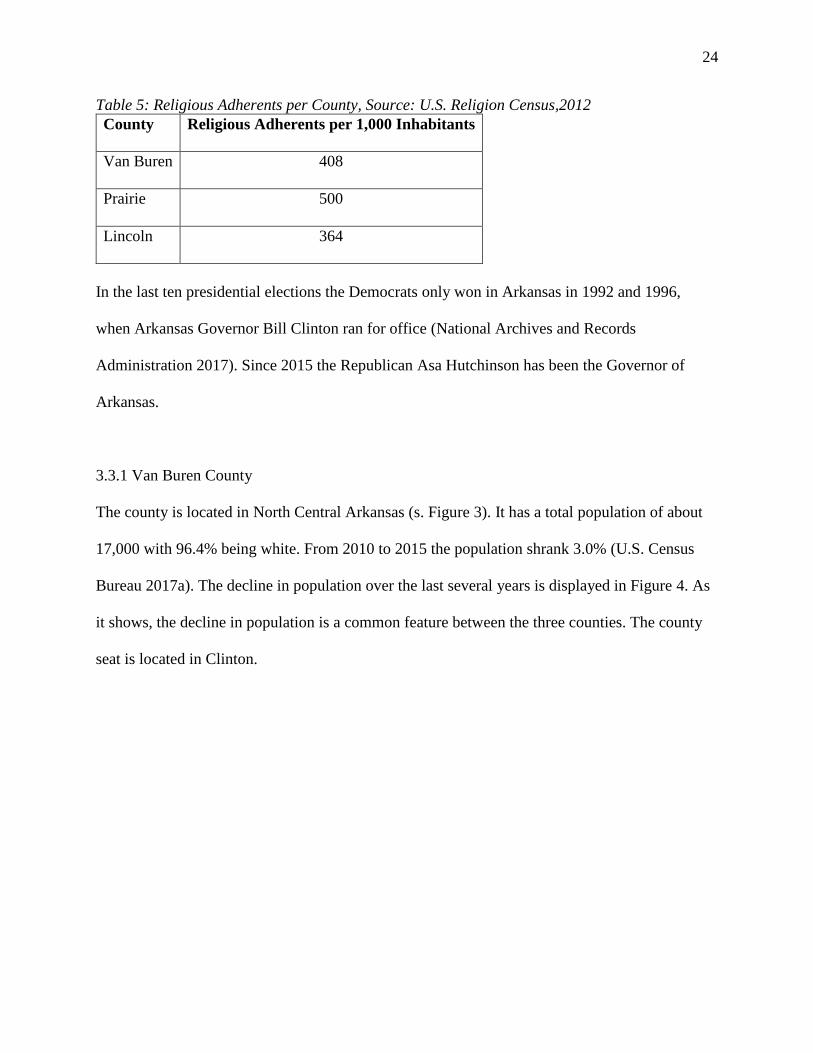
3.3.1 Van Buren County
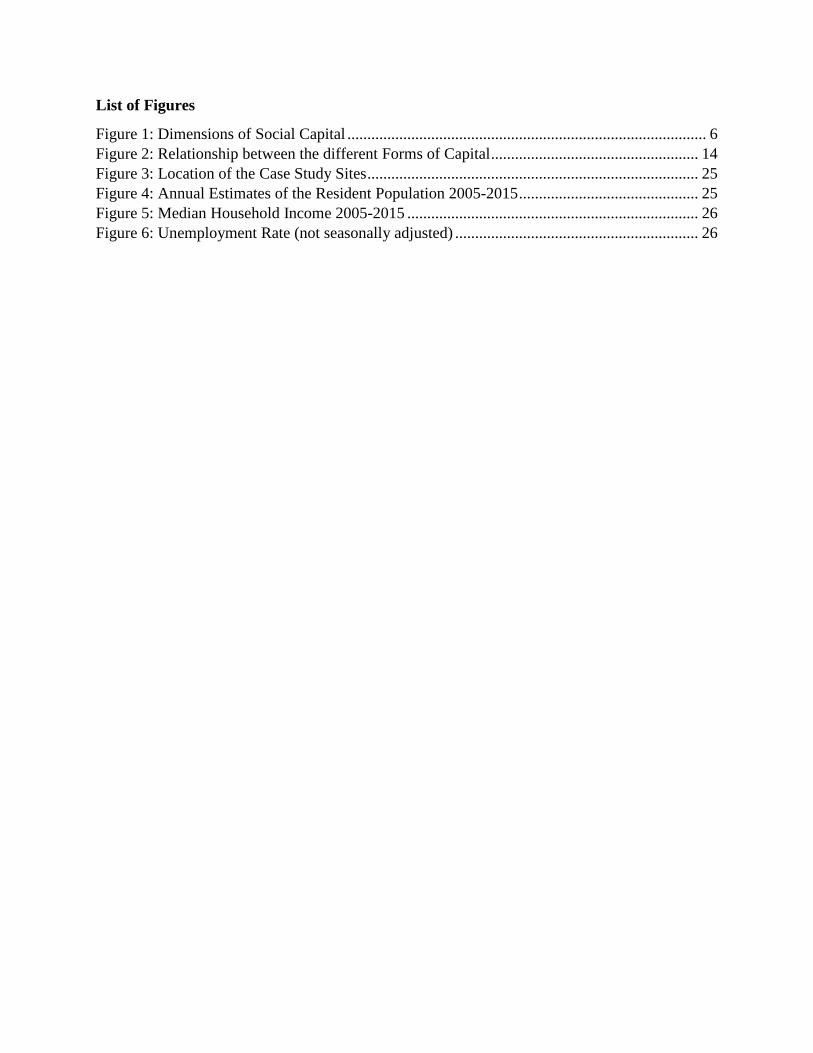
The county is located in North Central Arkansas (s. Figure 3). It has a total population of about
17,000 with 96.4% being white. From 2010 to 2015 the population shrank 3.0% (U.S. Census
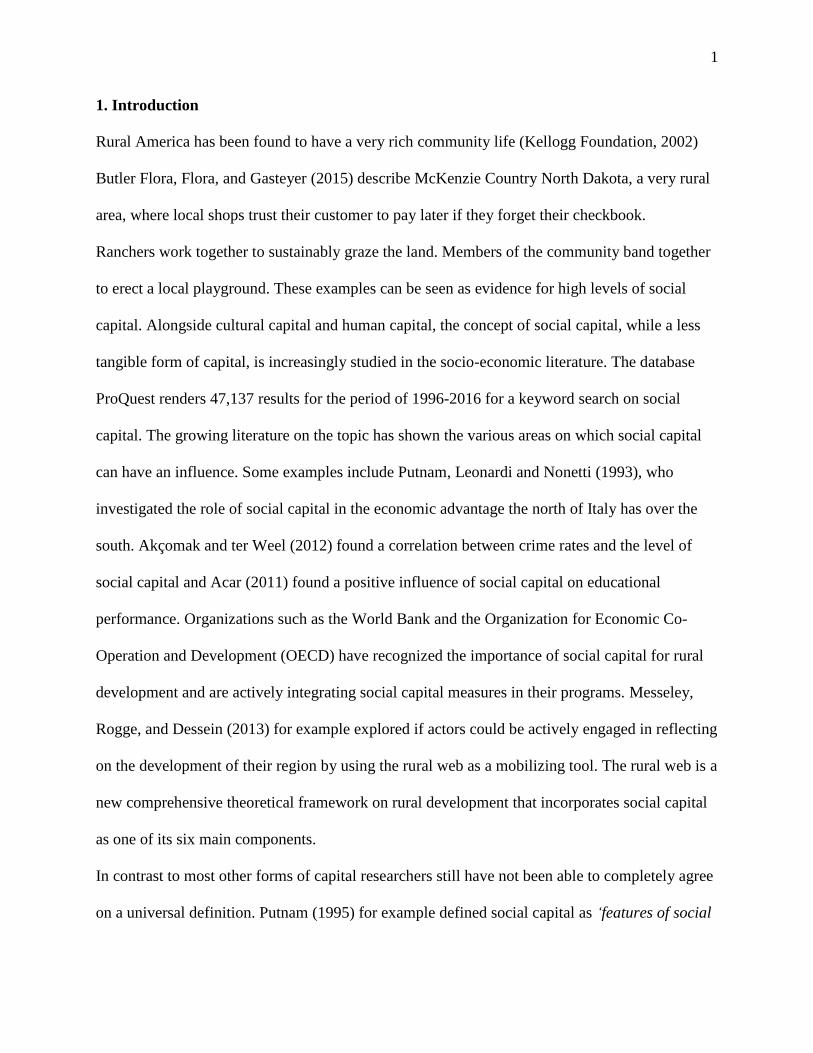
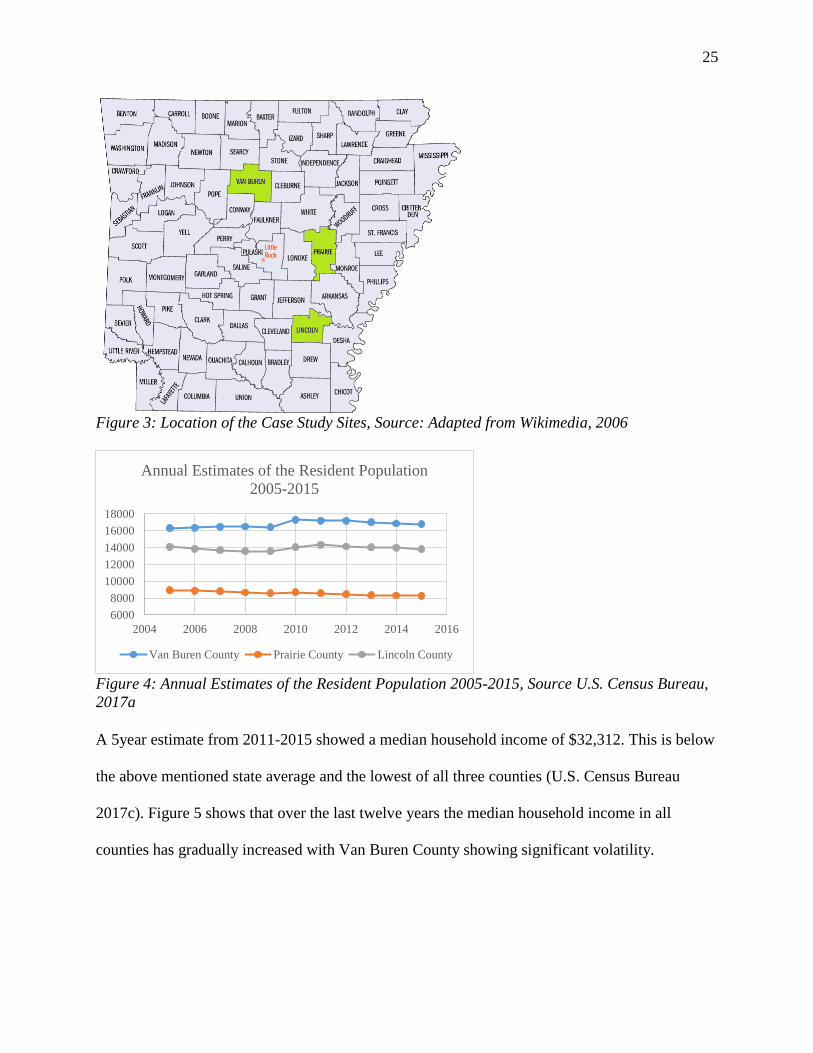
Bureau 2017a). The decline in population over the last several years is displayed in Figure 4. As
it shows, the decline in population is a common feature between the three counties. The county
seat is located in Clinton.
25
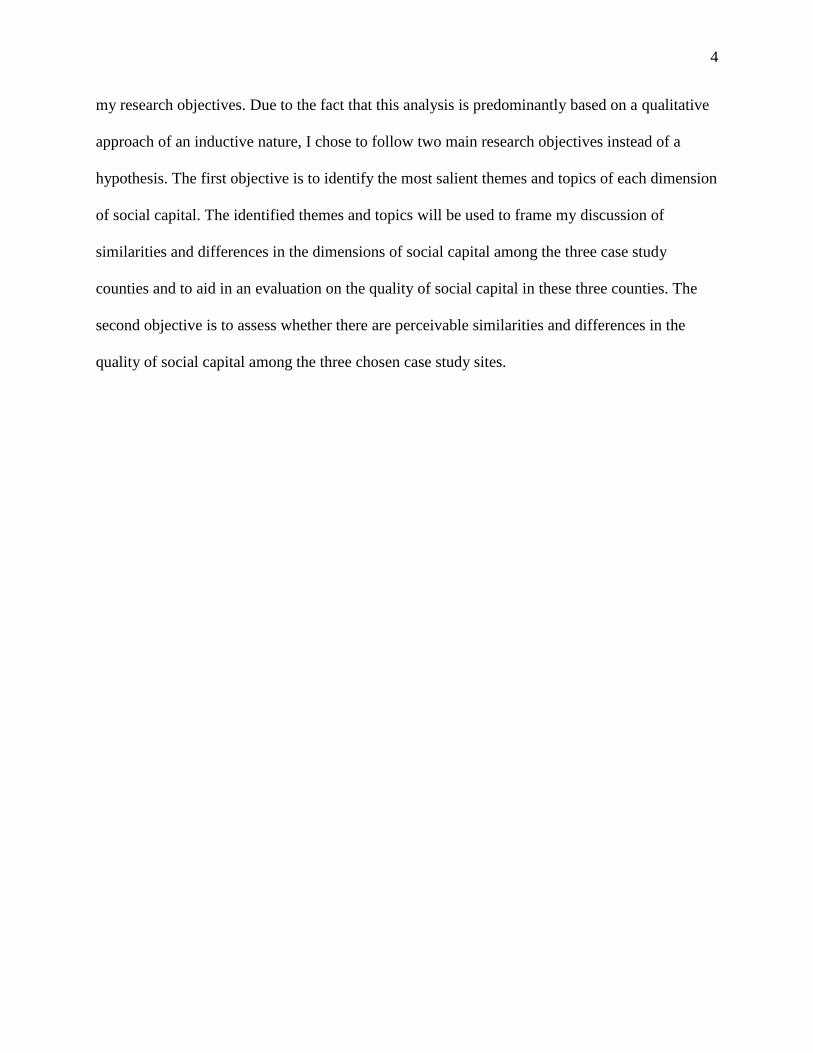
Figure 3: Location of the Case Study Sites, Source: Adapted from Wikimedia, 2006
Figure 4: Annual Estimates of the Resident Population 2005-2015, Source U.S. Census Bureau,
2017a
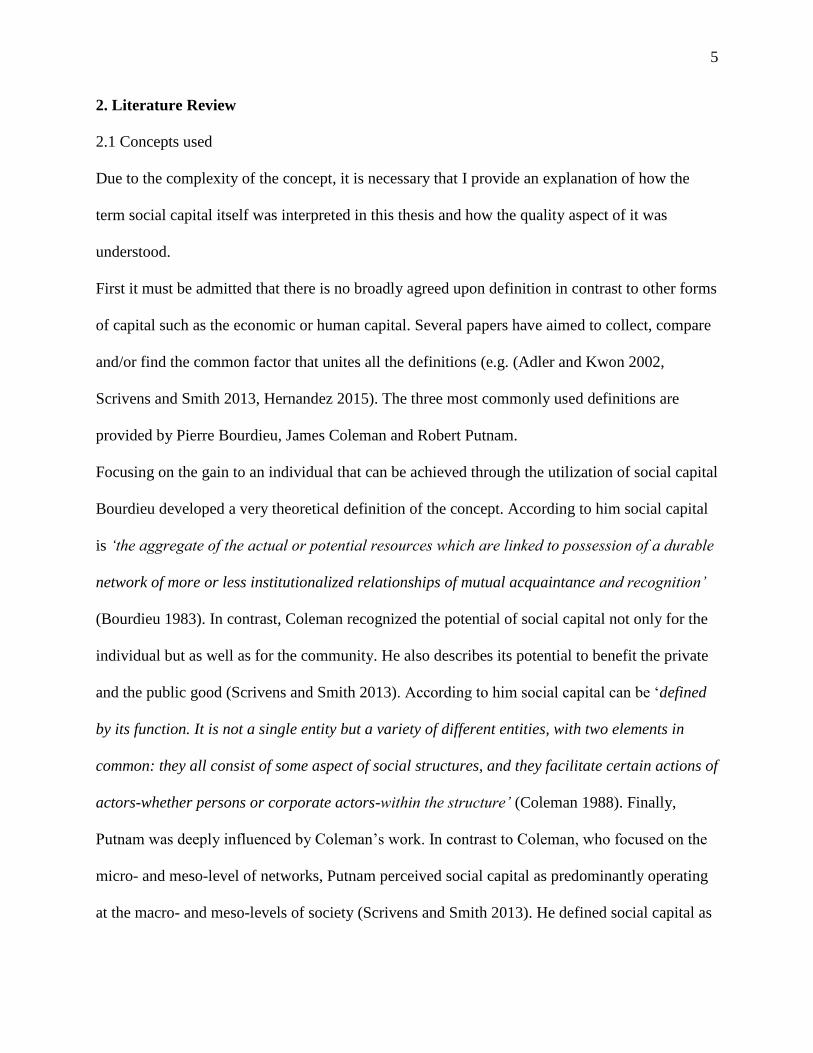
A 5year estimate from 2011-2015 showed a median household income of $32,312. This is below
the above mentioned state average and the lowest of all three counties (U.S. Census Bureau
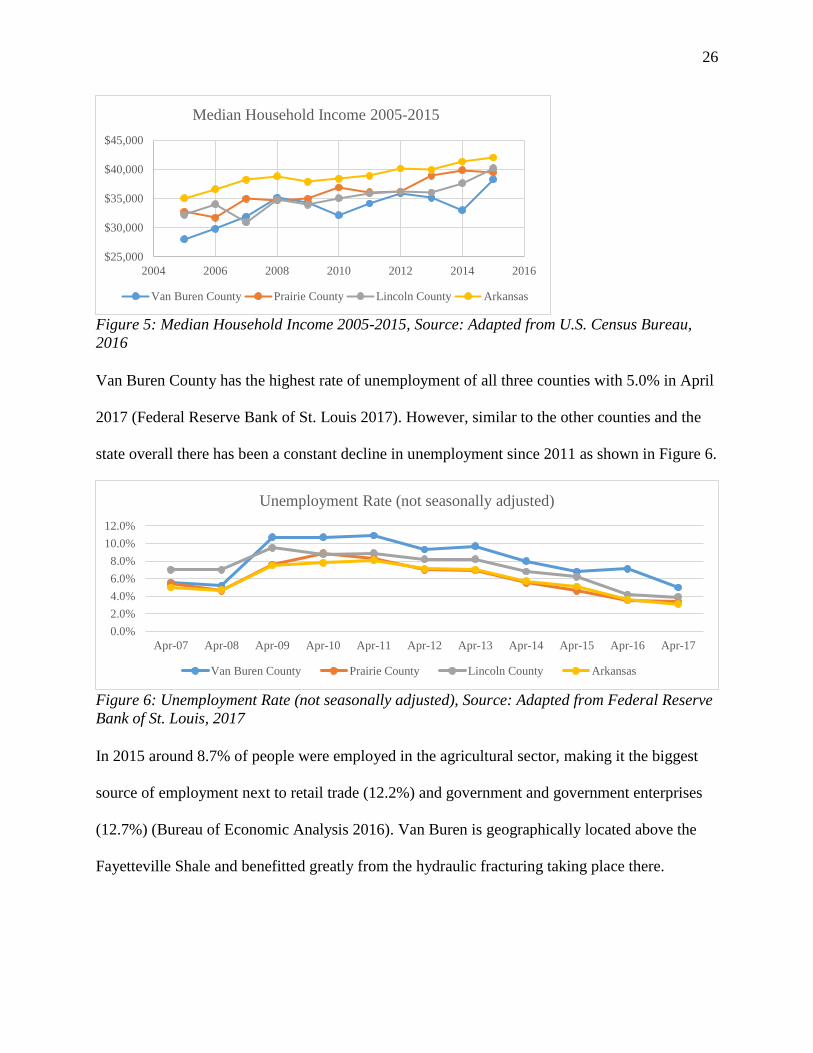
2017c). Figure 5 shows that over the last twelve years the median household income in all
counties has gradually increased with Van Buren County showing significant volatility.
6000
8000
10000
12000
14000
16000
18000
2004 2006 2008 2010 2012 2014 2016
Annual Estimates of the Resident Population
2005-2015
Van Buren County Prairie County Lincoln County
26
Figure 5: Median Household Income 2005-2015, Source: Adapted from U.S. Census Bureau,
2016
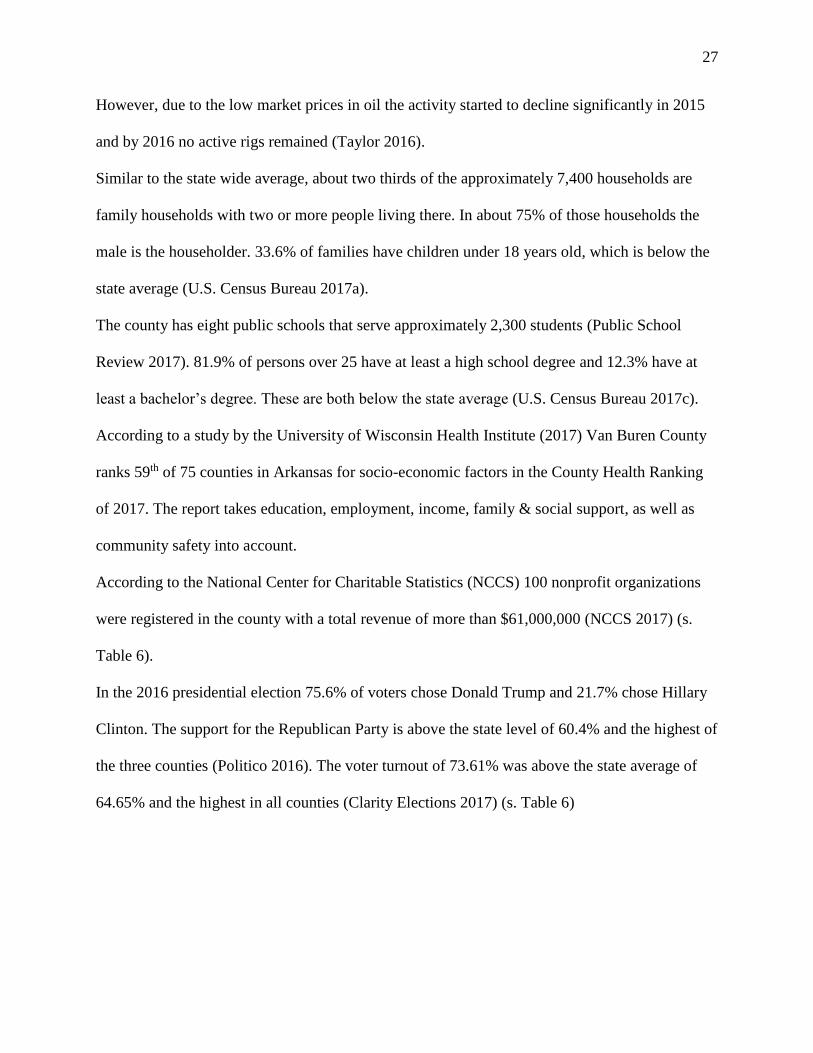
Van Buren County has the highest rate of unemployment of all three counties with 5.0% in April
2017 (Federal Reserve Bank of St. Louis 2017). However, similar to the other counties and the
state overall there has been a constant decline in unemployment since 2011 as shown in Figure 6.
Figure 6: Unemployment Rate (not seasonally adjusted), Source: Adapted from Federal Reserve
Bank of St. Louis, 2017
In 2015 around 8.7% of people were employed in the agricultural sector, making it the biggest
source of employment next to retail trade (12.2%) and government and government enterprises
(12.7%) (Bureau of Economic Analysis 2016). Van Buren is geographically located above the
Fayetteville Shale and benefitted greatly from the hydraulic fracturing taking place there.
$25,000
$30,000
$35,000
$40,000
$45,000
2004 2006 2008 2010 2012 2014 2016
Median Household Income 2005-2015
Van Buren County Prairie County Lincoln County Arkansas
0.0%
2.0%
4.0%
6.0%
8.0%
10.0%
12.0%
Apr-07 Apr-08 Apr-09 Apr-10 Apr-11 Apr-12 Apr-13 Apr-14 Apr-15 Apr-16 Apr-17
Unemployment Rate (not seasonally adjusted)
Van Buren County Prairie County Lincoln County Arkansas
27
However, due to the low market prices in oil the activity started to decline significantly in 2015
and by 2016 no active rigs remained (Taylor 2016).
Similar to the state wide average, about two thirds of the approximately 7,400 households are
family households with two or more people living there. In about 75% of those households the
male is the householder. 33.6% of families have children under 18 years old, which is below the
state average (U.S. Census Bureau 2017a).
The county has eight public schools that serve approximately 2,300 students (Public School
Review 2017). 81.9% of persons over 25 have at least a high school degree and 12.3% have at
least a bachelor’s degree. These are both below the state average (U.S. Census Bureau 2017c).
According to a study by the University of Wisconsin Health Institute (2017) Van Buren County
ranks 59th of 75 counties in Arkansas for socio-economic factors in the County Health Ranking
of 2017. The report takes education, employment, income, family & social support, as well as
community safety into account.
According to the National Center for Charitable Statistics (NCCS) 100 nonprofit organizations
were registered in the county with a total revenue of more than $61,000,000 (NCCS 2017) (s.
Table 6).
In the 2016 presidential election 75.6% of voters chose Donald Trump and 21.7% chose Hillary
Clinton. The support for the Republican Party is above the state level of 60.4% and the highest of
the three counties (Politico 2016). The voter turnout of 73.61% was above the state average of
64.65% and the highest in all counties (Clarity Elections 2017) (s. Table 6)
28
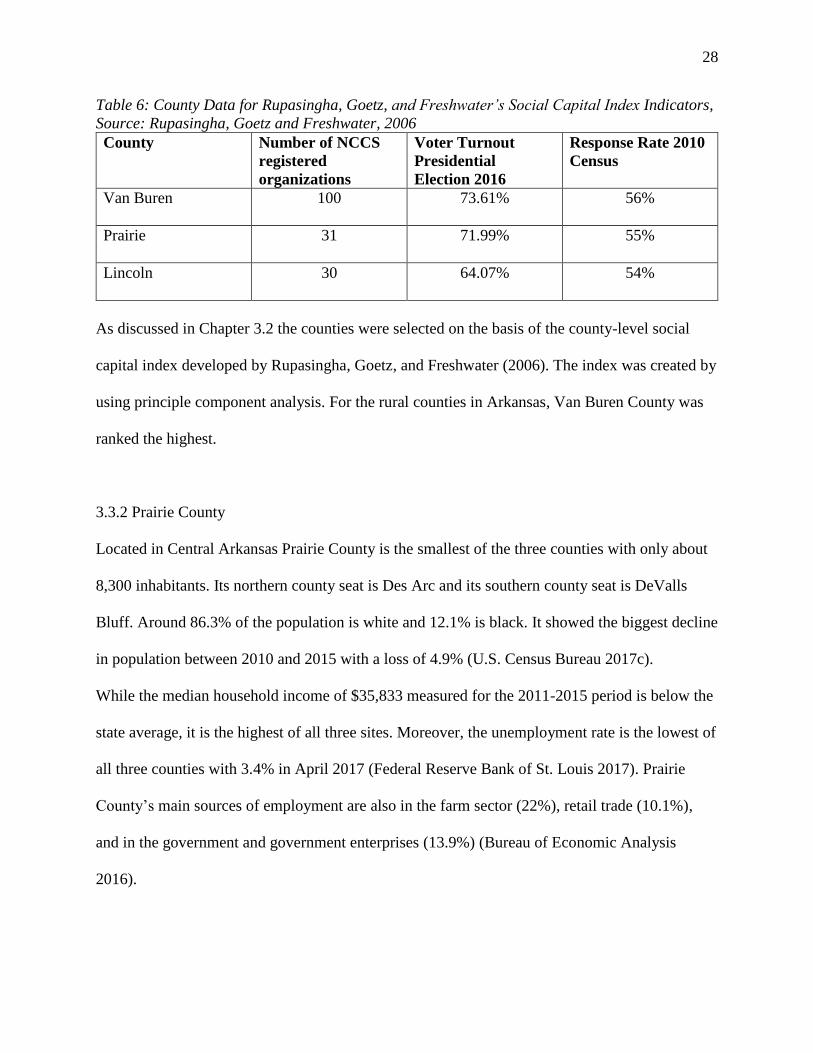
Table 6: County Data for Rupasingha, Goetz, and Freshwater’s Social Capital Index Indicators,
Source: Rupasingha, Goetz and Freshwater, 2006
County Number of NCCS
registered
organizations
Voter Turnout
Presidential
Election 2016
Response Rate 2010
Census
Van Buren 100 73.61% 56%
Prairie 31 71.99% 55%
Lincoln 30 64.07% 54%
As discussed in Chapter 3.2 the counties were selected on the basis of the county-level social
capital index developed by Rupasingha, Goetz, and Freshwater (2006). The index was created by
using principle component analysis. For the rural counties in Arkansas, Van Buren County was
ranked the highest.
3.3.2 Prairie County
Located in Central Arkansas Prairie County is the smallest of the three counties with only about
8,300 inhabitants. Its northern county seat is Des Arc and its southern county seat is DeValls
Bluff. Around 86.3% of the population is white and 12.1% is black. It showed the biggest decline
in population between 2010 and 2015 with a loss of 4.9% (U.S. Census Bureau 2017c).
While the median household income of $35,833 measured for the 2011-2015 period is below the
state average, it is the highest of all three sites. Moreover, the unemployment rate is the lowest of
all three counties with 3.4% in April 2017 (Federal Reserve Bank of St. Louis 2017). Prairie
County’s main sources of employment are also in the farm sector (22%), retail trade (10.1%),
and in the government and government enterprises (13.9%) (Bureau of Economic Analysis
2016).
29
In line with the state average, about two thirds of the almost 3,700 households are family
households with two or more people living in the household. In more than 75% of those the male
is the householder. Nearly 42% of families have children under 18 years old which is slightly
below the state average (U.S. Census Bureau 2017a). While smaller than Lincoln County, Prairie
County has four public schools that serve 1,257 students (Public School Review 2017). 79.3% of
persons over 25 have at least a high school degree and 10.3% have at least a bachelor’s degree
(U.S. Census Bureau 2017c).
Prairie County ranked the highest of all three counties in the 2017 County Health Rankings for
socio-economic factors, achieving rank 12 out of 75 (University of Wisconsin Population Health
Institute 2017).
While Prairie County had 31 registered nonprofit organizations their total revenue only
accumulated to about $360,000 (NCCS 2017). Van Buren County’s non-profit organizations
collect a majority of the revenue through the Ozark Medical Hospital and the Petit Jean Electric
Cooperative Corporation. In Lincoln County the C&L Electric Cooperative Corporation is
responsible for the lion’s share of revenue. In contrast to this, Prairie County does not have a big
cooperative or a hospital but rather a variety of smaller organizations.
Just like in the other two counties the support for the Republican Party is above the state average
with 72.8% of voters choosing Donald Trump (Politico 2016). As Table 6 shows the voter
turnout was 71.99% (Clarity Elections 2017).
Prairie County takes up the median for rural counties in Arkansas according to Rupasingha,
Goetz, and Freshwater’s (2006) index. The counties associational density is below that of Van
Buren County but above Lincoln County.
30
3.3.3 Lincoln County
Lincoln County is located in the Lower Delta of Arkansas (s. Figure 3). Its county seat is Star
city. 67.6% of the 13,820 residents are white and 30.3% are black. Similar to Van Buren County
the population declined between 2010 and 2015 by 2.2% (U.S. Census Bureau 2017c).
With a 2011-2015 average median household income of $32,580 the county falls below the state
average but is slightly above that of Van Buren County (U.S. Census Bureau 2017c). In April
2017 the county registered an unemployment level of 3.9% (Federal Reserve Bank of St. Louis
2017). Farm employment (13.4%) and the government and government enterprises (29.4%) are
the main sources of employment (Bureau of Economic Analysis 2016). The third most important
source is not retail trade, which ranks 4th with 6.3%, but manufacturing with 7.5% of total
employment.
There are about 4,200 households in the county, 72% of which are family households with two
or more people living there. The male is the main householder in more than two thirds of those
and almost half of the households have children over under 18 years old (U.S. Census Bureau
2017a).
Lincoln County has a total of three public schools, which together serve 1640 students (Public
School Review 2017). Less than 9% of the population over 25 has at least a bachelor’s degree
and 78.4% have at least a high school degree. This is both below the state average as well as the
lowest of all three case studies (U.S. Census Bureau, 2017).
With regards to socio-economic factors, the county ranked 49 of 75 in the study by the
University of Wisconsin Health Institute (2017).
According to the NCCS Lincoln county had 30 Non-profit organizations in 2016 that amassed a
total revenue of approximately $40,600,000 (NCCS 2017).
31
While the support for the Republican Party is above the state average with 64.2% of voters
voting for Donald Trump in the 2016 presidential election, it is the lowest of all three counties.
In addition, the voter turnout was also the lowest of all three counties with 64.07% (s. Table 6).
In Rupasingha, Goetz, and Freshwater’s (2006) study Lincoln County ranked the lowest of all
rural counties in the 2009 index.
32
4. Results
4.1 Results grouped by the six Dimensions
Based on the framework I used for the analysis I grouped the results by the six dimensions to
provide a better overview. While most results were assigned to one dimension they are often
connected to other dimensions and their results. I briefly explain some of the connections to
highlight complex connectivity between the dimensions. Finally a brief summary comparing the
different case study sites against one another is provided at the end of the chapter.
4.1.1 Groups and Networks
The first thing that became very apparent throughout the interviews was that a majority of people
joined their respective groups either through work or were appointed to their position. 16
participants from all counties stated that they got involved in at least one of their groups because
of their work or they were appointed to their position. Interestingly, nine of those participants
stated that they either limited the contact to other members to just the meetings of their groups or
organizations. If there was some form of socializing outside of the meetings it was focused on
work. Participant 10 described this as follows when I asked if she/he socializes with other
members outside of the meetings:
I would say to a certain extent. Work related, community related yes. And I like them a
lot. Do we go and have BBQs at each other’s houses? No! But I see them around town,
they come and I see them at my work place. Participant 10, Lincoln County
This might indicate that there is a more superficial quality to their involvement that is not fully
voluntary or guided by the desire or interest to contribute in a certain field.
However, another factor that needs to be taken into consideration is that every participant that I
interviewed was in at least one organization and on average a participant was in about five
33
organizations (s. Table 2). Considering that a majority of those organizations have monthly or
even weekly meetings it becomes apparent why some participants limit their level of
involvement in the groups to a required minimum. Eight participants reported that they are not
able to attend all meetings of the groups that they are involved in due to overlapping
commitments either with work, other groups or their private lives. Participant 12 from Van
Buren County who was involved in 13 groups and organizations, predominantly through work,
commented on this fact as follows:
For groups that meet weekly,
They kind of want you to attend those meetings, but every week meetings is kind of hard
with our job, with everything we do, our schedules and things. So I kind of backed off.
For groups that meet monthly,
And I try to make those monthly meetings. You know, there is some months that you know
you got something personally or something like that, or work related, so you cannot make
it. So you try to get it covered. Participant 12, Van Buren County
This could mean that participating in a high number of groups or organizations might
compromise both the quantity and quality of engagement in those groups.
Another interesting theme that emerged when I analyzed the results was that only two
participants did not consider that having a network of friends, family and acquaintances might be
important. In fact, 18 of the 30 participants stated that this is of highest importance. When I
asked if they utilize their network or have done so in the past, the most prevalent answer voiced
by 10 participants was that they use(d) it for job purposes. This is clearly a Bourdieu approach to
social capital in the sense that social capital is used to access resources for one self. Out of the 10
participants four were from Van Buren County, five from Prairie County and only one from
Lincoln County. This could be a possible explanation for differences in the measured quantity of
34
social capital. Being able to personally benefit from your network might cause an individual to
be more motivated to get more involved.
4.1.2 Trust and Solidarity
We are a small community, and […] basically everybody knows everybody. Participant
14, Prairie County.
Sentences similar to this were used by several interviewees to stress the level of intimacy that
rural communities generally have. However, when I asked about their relationship to people in
their group it became apparent that especially in Lincoln and Prairie County people
predominantly seemed to have a professional or superficial relationship with other members of
their groups. In contrast, of the five people who reported a very close relationship to their fellow
members three were from Van Buren County. When I asked whether they share serious or
personal matters with their network, seven people in Van Buren County and 6 people in Prairie
County responded that they feel comfortable to at least share such information with select
individuals in their circle if not the entire community. In contrast, five participants in Lincoln
County reported that they prefer to not discuss private or serious matters with others or people
outside their family. This indicates a lower level of trust among inhabitants of Lincoln County
compared to the other counties and can also be seen as another indicator showing a tighter
network among people in Van Buren and Prairie Counties. Referring back to the dimension of
Groups and Networks this might be one potential explanation why the inhabitants in Lincoln
County refrain from utilizing their network. With regards to social capital solidarity became very
apparent in all of the counties. A number of participants reported that either they or other people
in their community had an inert desire to serve, improve or help their respective communities.
They often do so in an altruistic fashion as this anecdote shows:
35
[O]ur city technically, has been bypassed by a new road. […] Off and on groups have
tried to get food and lodging signs on 530. We can’t, because technically we are not
bypassed, a road actually intersects with the highway. And there have been groups that
have taken up the banner from time to time. There is a group now that has kept their
shoulders to the plow. None of them have a business. They have really stepped forward to
try and get the food and guest lodging sign. They do it for the service of the people that
have a business. Participant 3, Lincoln County
This selfless attitude was also reflected in how they utilized their network. I mentioned above
that many participants took advantage of their network for their job. Yet, while it was to help
them, the requests that were made often served, taught or helped other people or the community
as a whole as the following quote shows:
Well because of my job […] there are a lot of times [when] we need things from the
community, whether it be donations for things, or donations of goods and services, that
sort of thing or we need someone to come in and speak to a class or that sort of thing. So
[…] I can call on the people in that network in this community and say ‘Hey I need this
or can you tell me where I find such and such’. They have been very good to us, they have
always been... the community has always been very generous, so having those
connections helps me to do my job better. Participant 20, Prairie County
4.1.3 Collective Action and Cooperation
A theme that was prevalent in all counties was that the groups and organizations struggled to
recruit new members or that there was a general lack of involvement among the general public.
[I]t seems like people are happy to participate and not take part. Just enjoy the work
everybody else has done and shy away from getting involved. And then they ask ‘Why
doesn’t the city do this and this?’ Why don’t you come to the meetings and get active?
Participant 12, Prairie County
However, as I discussed above many of the participants were in a variety of groups. Not being
able to enlist other people might compel engaged individuals to try and compensate for a lack of
members by being a part of many groups.
Especially younger citizens were pointed out by the participants as being the group that seems to
not be as heavily involved.
36
What has happened here and what I see around me and what I see in Northwest
Arkansas, what has happened here most of the young people that were here do not seem
to want to be involved in what we are talking about. There are exceptions to that […].
But young people seem to be more self-cantered or selfish and they are only concerned
with what they want. Participant 6, Lincoln County
So you always got a group that is active and will be involved in helping the community
and then you have a good number of people that is just not comfortable in doing things,
that doesn’t have time. Especially young people. It is hard to get young people, cause
they have their jobs, they have their families. It is just harder to get younger people
involved in those volunteer organizations than it is to get older people. That is
unfortunate but that is just the way it is. Participant 13, Prairie County
The second quote brings up another problem stated by several participants from both Prairie and
Lincoln County. While there is a variety of groups, there is not much variety in members and the
same people tend to be involved in the majority of groups.
If you are in one group...If you are on the city council, you will be or you probably have
been on the school board. If you have been on the Quorum Court you will be on the
others....In fact the people don’t really change, they just change seats. Participant 13,
Prairie County
Interestingly, as I noted in the dimension of Trust and Solidarity, the relationship with members
of the groups remained superficial despite the fact that many of them were in several groups
together.
Having the same people engaged in a majority of the groups creates two main problems that are
closely related to one another. As mentioned before the level of social capital in many studies
was determined by the number of groups or organizations in an area or the number of
participants. Though, if just one core group of people is involved in all those groups the number
of individual participants will be measured too high. Therefore, while the social capital might be
high among those people, it will not be representative for the rest of the population in this area.
Secondly, it limits the bridging social capital. Bridging social capital requires the interaction of

37
individuals that are in different groups (Larsen, et al. 2004). With the same members in most
groups the possibility bridging is limited.
Two thirds of the participants reported that the network they had built in their county was
reliable. This indicates a certain level of trust among them but also a high willingness to
cooperate with one another. This can be related back to the dimension of Trust and Solidarity.
The willingness to cooperate with one another is closely related to the desire of many of the
participants to improve the local community.
Something that was very apparent when interviewing participants from Van Buren County was
that the community had suffered a number of hardships in the last several years. Among other
things the county had experienced floods, a tornado, and the decline in oil prices. As I mentioned
in the case study description the county as well as the neighboring counties relied heavily on
natural gas royalty payments from the Fayetteville Shale as a source of income. The decline in
oil prices affected the economy adversely. Those adversities, however, have had a positive
influence on the social capital in the area. As described by Participant 26, adversities caused
people to expand their bridging, bonding and linking social capital in order to cope with the
consequences of negative events.
You know, this county has been faced with a lot of adversity over the last decade or so
[…]. We went through a major tornado. Went through some flooding. We have gone
through some loss of industry and things like that. And if the people and the government
here had not worked together. […] it could have been a lot different story. And then you
also go back to this community development committee and talking about meeting once a
month for a breakfast committee. It has municipalities from Clinton and Fairfield Bay. It
has county government involved. It has different organizations that themselves are
involved in that. And we come together and we talk about the things that happen in the
county and affect each of us and our organizations, but most of all what has affected the
people and the county and what can be done. That is surely something for a group in a
county. Not just the city, or a certain area, but a county-wide effort like that. And that is
what makes this place such a beautiful place to live. Cause I mean the people really make
efforts and strive to work together across the county. Participant 26, Van Buren County
38
The last aspect of a county-wide engagement is another point that is closely related to the
dimension of Social Cohesion and Inclusion. Overall the majority of groups and organizations
operated at a local level, especially in Lincoln County. In Van Buren however, a lot of groups
and organizations operated on at least a county-wide basis and collaborating with or helping the
surrounding counties was not uncommon, as the quote by Participant 22 shows.
A couple years ago, Faulkner County had a devastating tornado and there were 7
counties that went and helped for 2-3 weeks after that. And they would return gladly. And
we got paid eventually, but we did it because that was the right thing to do. Participant
22, Van Buren County
This again shows a more intense level of bridging social capital for Van Buren County that
exceeds that of the other two counties. This can be strongly linked to the dimension of Social
Cohesion and Inclusion, since it allows groups and organizations as well as the community as a
whole to be more inclusive.
4.1.4 Information and Communication
As mentioned above all counties struggled to recruit younger people for the different groups and
organizations, which with regard to diversity creates a problem since not all viewpoints are
incorporated in discussions. This in turn might negatively affect the quality of social capital.
While all counties did recognize this problem and a lot of groups and organizations did make an
effort to reach out, only Van Buren County utilized modern methods of communication in the
form of an up to date online and social media presence. Comparison of the content and detail of
the official county websites for Van Buren, Prairie and Lincoln confirm the quality differences
between Van Buren and the other two counties.
39
We have a website here in our county that you can visit anytime and it shows any meeting
that we have in our county. It shows everything that we discuss. Or if we done something
on the roads or whatever, they have those minutes in there and people can look. Same
thing with Quorum court notes. So there is a lot of information to it. They just go and
look at it. Same thing with the church; we have a website. Fire departments as well.
Everybody has gotten pretty much on board with websites and Facebook and stuff.
Participant 30, Van Buren County
The increased accessibility of information and the heightened level of communication positively
affects not only the quality of social capital in the dimension of Information and Communication,
but also extends further into other dimensions. In the dimension of Social Cohesion and
Inclusion it allows more members of the community and county to be informed and participate in
the operations of the different institutions and groups. In the dimension of Empowerment and
Political Action it allows people to have a better overview over the proceedings of the
government.
While modern methods of communication might not create a deep connection between members
and non-members of the groups and organizations in a county, the provision of information and
the ease of access are able to provide a solid foundation for a high quality of information
exchange and communication which are important cornerstones of social capital.
In each county at least half of the participants reported that the informal network in their county
was essential for receiving information and conducting business.
[T]he old story here is that if you do not know what you are doing here ask your
neighbor, he will know what you are doing. That is just small communities. But as far as
business and who is in financial trouble and needs to sell their farm or their land or their
equipment, or who is looking for cattle and will pay a good price for it, that information
passes through the feed store and I can tell you […] I have had over the years a couple of
clients that own feed stores. They don’t do it to make money by selling a bag of corn and
chicken feed, they do it so they can gather the information and so they know what is
going on in the community. That way they know who is selling and who is buying and
they pick up opportunity like that. Participant 27, Van Buren County
40
This shows that networking is a key element of the everyday life of the participants. Considering
that participants reported that everyone knows each other, the importance and influence of the
informal network in the daily proceedings of the communities is stressed even further.
Something that was mentioned several times by the participants was that this sets them apart
from non-rural communities in which this form of informal communication would not be that
important or customary. This could indicate that generally rural communities require a high
quality of their informal network since inhabitants heavily rely on the exchange of information
through it.
4.1.5 Social Cohesion and Inclusion
In each county, participants reported the efforts the different formal and informal institutions
make to engage or include others and particularly as potential members. While the institutions,
groups and organizations in Prairie County and Lincoln County mainly just put out official
notices, many in Van Buren County went a step further. In particular governmental officials were
very motivated to learn about the different opinions and tried to engage with as many people as
possible, for example by providing opinion boxes in public places and frequently attending
community events where they interacted with inhabitants of the county. As mentioned previously
this might be due to the superior quality of the bonding, bridging and linking social capital in the
county. It is also related to the generally stronger relationships of participants reported for Van
Buren County. Participant 22 was a member in 16 groups and organizations. Even though she/he
got involved in many of them through work she/he stated the following:
I guess I have been involved in most civic organizations wherever I was. I just try to stay
involved in that because it helps you to understand your community. Participant 22, Van
Buren County
41
Among other things the participant not only found a monthly breakfast club for local business
and community leaders to exchange information and strengthen the bond within the community,
she/he also put an emphasis on joining two local chapters of a national charitable organizations
since she/he is engaged in both communities. This additional effort that was put forward by not
only Participant 22, but also by other members of the different groups and organizations. This
might be another supporting reason for a higher level of social capital for Van Buren County as
measured by Rupasingha, Goetz, and Freshwater.
When I asked about whether there are any groups or individuals that stick out in being able to
influence the proceedings of the community, almost half of the participants reported that
especially certain individuals tend to have more influence than others. While only two
participants from Van Buren County reported this, five participants from Lincoln County and
seven from Prairie County emphasized this. The predominant reasons that were given for this
comparatively high influence of certain individuals were on one hand a stronger financial power
of those individuals and on the other hand their ardent engagement in the community and/or
certain groups. The latter indicates that a qualitatively and quantitatively high level of social
capital of an individual increases the influence that person has. This seems to be more important
than the collective influence a group or an organization has, as this quote by Participant 17
shows:
I would say that there are certain groups that have more influence. And the reason I
would say that is because they have some key power players… [they] are members of
their groups and the key power players are very involved and have a wide network
themselves. Participant 17, Prairie County
While one person in Lincoln County mentioned that his/her community was relatively closed off
to outsiders, three people in Prairie County stated that their respective communities tended to be
closed off to outsiders or even clannish.
42
Prairie County in general is very old families. You can’t survive, because a lot of what
we have is word of mouth. And sometimes it is really hard to get to know people because
they are more closed off to outsiders. Participant 11, Prairie County
This can be seen as a negative example for social capital as described in Chapter 2.2. The close
relationship the people have among them reduces their potential for building bridging social
capital and they therefore limit their social capital in addition to lowering the quality of the
existing social capital. Considering that participants reported to have the same people in a lot of
the groups while struggling to recruit new members, this behavior might be surprising. However,
since the engaged individuals hold considerable influence in this county, they might be reluctant
to share this influence.
4.1.6 Empowerment and political Action
While ethnic diversity is relatively low in Van Buren County as described in Chapter 3.3, it is
substantially more extensive in Prairie County and especially in Lincoln County. Rupasingha,
Goetz, and Freshwater (2006) found that a greater racial fragmentation causes a less socially
connected community. Their observations are limited to a period from 1980-1990 and another
period from 1990-1997 in which the statistical significance of the relationship declined.
Nevertheless, in none of the interviews I conducted did a participant mention race as a reason for
any differences in participation, influence or similar factors. A factor that was a lot more at the
center of attention for differences between community members were the different political party
associations of the inhabitants of the communities. Despite those differences, most participants
stated that there was only a very low or even no conflict about how decisions were made in the
groups and organizations and in the county governments. While there might be discussions about
43
differences in opinions there generally seemed to be no deep disagreement and the approach to
solve things was often very similar as shown in the quote by Participant 16.
When you go to a meeting it is kinda like everybody is on the same page. Everybody
kinda got the same thinking. They have a committee meeting about Des Arc and
everybody is just kinda on the same page. There is not much arguing. They try to hash
things and try to get things going. Participant 16, Prairie County
This could indicate that racial diversity for those communities is less important than a low
diversity in opinions. This might separate those rural areas from more urbanized areas with a
population that has a broader political and cultural spectrum. In addition, the familiarity between
the community members is greater as I discussed in the dimension of Trust and Solidarity. Being
aware of the situation of other community member might facilitate an easier discussion process
since the mutual understanding is greater. Especially for Prairie County and Lincoln County,
however, it needs to also be taken into consideration that the same people were engaged in many
of the group, which automatically creates a lower diversity in opinions.
As mentioned above, all of the participants were engaged in at least one group and on average in
five groups. While the level of commitment of the participants in their respective groups and
organizations differed, the will to help the community was strong in all the counties. Yet, the
level of poverty and the struggling economy was a factor that seemed to inhibit each of the
communities from reaching their full potential. The lack of funds limited the opportunities that
could be provided or accessed by the people.
There are a couple of counties down here that really have a problem with their tax base.
They have problems with enough revenue to, you know, do all the things that we really
want to do. So we really have to set goals and try to look at the future. Because we have
to work hard to make our budget work. Participant 6, Lincoln County
Poverty even limits the inclusion of certain parts of the population in activities.

44
I noticed here, and I struggled with that early on when I moved here, it’s the level of
poverty. I have never experienced that so strongly. In a rural area you will always find
more poverty. And the level of education. Opportunities for people, it is just…It affects
me at [my workplace] People tell me ‘I can’t come to town, I don’t have a car’ or ‘Mine
just broke and I can’t fix it’. How do I reach those people? […] An urban area might
have poverty, but this is just a poor area here. Participant 10, Lincoln County
The quote shows that poverty is an important factor that affects quality and quantity of
engagement. It limits the opportunities groups and organizations have in many areas, such as the
means to recruit new members. It might also be a possible explanation for the high willingness to
cooperate with one another and to better the community among the inhabitants. Bearing in mind
that the tax base is relatively weak, the private engagement of citizens allows to facilitate
improvements and events, which would not be possible otherwise.
4.2 Summary of Results
While some of the results are not county specific, I will briefly summarize the individual results
for the three counties in order to gain a better understanding of the three case study sites.
In Rupasingha, Goetz, and Freshwater’s (2006) index Van Buren County was ranked the highest
for rural counties in Arkansas. Throughout the analysis it became apparent that the county
demonstrated not only quantitatively high levels of social capital but also a high quality of many
aspects related to social capital.
Participants in the county reported to use and be able to use their personal networks for job
purposes. They also tended to have a closer relationship with other members of their group than
the participants in the other counties. Furthermore, the participants frequently displayed the
willingness to share information with other members of their network, indicating a deeper level
of trust and a tighter network among community members. One of the triggering factors might
have been the number of economic and natural hardships that the county had to face in recent
45
years. Having to work together with other community members and the surrounding counties
caused the bonding, bridging and linking social capital in the county to grow and deepen.
Additionally, many of the groups operated and collaborated on a county-wide basis in contrast to
a community bound basis indicating a more intense level of bridging social capital. In the
dimension of Information and Communication the county surpassed the other counties by
utilizing modern methods of communication to inform and include as many people as possible.
However, beyond providing online information, government officials in the county made an
effort to also personally reach out to understand the needs of the community. The combination of
a more personal and intimate interaction of the community members as wells as with
surrounding counties and the mutual efforts to include the opinions of as many people as
possible indicates a higher quality of social capital, which is in line with the measured quantity
differences.
Prairie County was the median for rural counties in Arkansas for the 2009 index of Rupasingha,
Goetz, and Freshwater (2006), but ranked 4th in the 2014 index which was published after I
already concluded the interviews. Similar to Van Buren County many of the participants tended
to use their personal network for job matters, however, their relationship to other members in
their network tended to be superficial. Nevertheless, more than half of the participants still felt
comfortable to share personal information with other community members. When it came to the
make-up of the groups in the county, the participants reported that the same members were active
in a majority of the groups. The problem that arises with this is among other things a reduced
bridging social capital since only a certain part of the population is represented. A majority of
participants in the county also reported that individuals that are either very involved or have
substantial financial power tended to have more influence than the different groups and
46
organizations of the county. Due to the fact that the communities in the county seemed to have a
tendency to be clannish or closed off to outsiders, the county reduced their potential for building
bridging social capital.
Rupasingha, Goetz, and Freshwater (2006) ranked Lincoln County the lowest of all rural
counties in Arkansas. The quality of social capital somewhat reflects the measured quantity of
social capital. In contrast to the other two counties, participants in Lincoln County were not
inclined to use their personal network for job purposes despite the fact that they reported it to be
essential for personal success. Similar to Prairie County the participants reported a superficial
relationship to other members of their groups. In contrast to Prairie County, the Lincoln County
participants preferred to not share private or serious matters with other people outside their
family. Maybe partially because the majority of organizations in Lincoln County operate at the
local basis, they have the same people engaged in a lot of groups, just like Prairie County. Also
like Prairie County, the most influence was held by financially empowered and involved
individuals.
My results for those counties indicate that the ranking of social capital from a qualitative
perspective is similar to the ranking of Rupasingha, Goetz, and Freshwater’s (2006) quantitative
index. This suggests that for the three counties qualitative observations align with the relative
quantitative rankings. Future research should explore the measures of social capital in both
qualitative and quantitative dimensions for a better understanding of the relationship between
these two aspects of social capital.
47
5. Discussion
5.1 Limitations of Study
While the results are important for the research on social capital quality, certain limitations
apply.
First, the case study was geographically limited to the State of Arkansas. As such, a range of
economic, social, and cultural specificities apply to it and limit any generalizations for
understanding qualitative dimensions of social capital. The comparably low median household
income and the high level of religiosity are two examples for factors that play an important role
in how people behave and what they value. Therefore, the results should not be applied to a
national context without further research, which allows for different circumstances.
In addition, the research was also conducted in only three of the sixteen rural counties in
Arkansas. For future research I recommend to extend the scope of the research to all rural
counties in order to obtain a more holistic understanding of the quality of social capital in rural
Arkansas. As described in Chapter 4.1.4, the participants compared their situation to non-rural
circumstances. It might be advisable that for future research this comparison is validated through
a more comprehensive study that includes urban counties.
Due to a constraint in time and resources the number of participants interviewed was relatively
small and does not necessarily reflect the general population of the counties.
All participants were over the age of 21 and the median age in each county was below that of the
sampled participants of those counties (s. Table 4). This difference is partially explained by the
fact that many of the younger people that were contacted for this study did not have the time to
participate, while older inhabitants had more time available.
48
A qualitative study in contrast to a quantitative study often requires fewer participants. I still
tried to reach out to a broad spectrum of professions and while I achieved a relatively good
coverage, participants from all professions were not represented.
Another possible short-coming of this study is the fact that each participant was a member in at
least one group and on average they were a member in about five groups. Since there is no data
available on the average memberships in groups in the counties, it is difficult to judge whether
this is above or below average.
Despite those limitations, this thesis still holds significance for the topic of social capital and
rural development. As one of the first studies of its kind to explore the quality of social capital,
valuable insights were gained for the field and for future research. The results of the case studies
provide an insight about the importance of taking qualitative factors into consideration when
discussing social capital.
5.2 Policy Implications
Sen. Mike Lee, the Vice Chairman of the United States Congress Joint Economic Committee,
recently brought social capital back to the center of political discussion, when the first of a series
of reports on social capital titled ‘What we do together – The State of Associational Life in
America’ (Joint Economic Committee 2017a) was published. In addition, a hearing on the same
topic was held in May 2017, which included testimonies by social capital experts, such as the
aforementioned Robert Putnam (Joint Economic Committee 2017b). However, neither the report
nor any of the speakers focused on rural communities. Moreover, concrete policy suggestions
were scarce. Putnam, as well as Yuval Levin, another expert giving testimony, stressed that
policies should be made on a local rather than on a federal basis (Levin 2017, Putnam 2017).
49
This is in line with Grootaert & Bastelaer’s (2001) findings. The researchers stress that levels of
social capital can vary significantly even on a local level. They do stress that results of other case
studies have shown that a supracommunal approach that connects different communities seems
promising in the creation of social capital. This is well in line with the results of my research.
Van Buren County’s quantitative level of social capital was ranked the highest in Rupasingha,
Goetz, and Freshwater’s (2006) study for rural counties in Arkansas. Also, the engagement in
supracommunal organizations of the participants exceeded that of the other counties. A
conclusion and recommendation is that future policy approaches should promote umbrella
organizations as described by Bebbington & Carroll (2000). Those organizations are in charge of
connecting local groups and networks. This way the bridging capital can also be expanded,
something that several of my results showed to be lacking. While I am hesitant about providing
specific policy suggestions, I will provide suggestions that might contribute to increasing the
quality of social capital. The results of the dimension Information and Communication suggest
that a responsible use of modern methods of communication can help to strengthen the link
between the government and the public. Moreover, it provides more people with the opportunity
to become informed and participate not only in formal, but also informal organizations. Using for
example social media platforms to appeal to a wider audience might also help to recruit more
members and encourage a greater participation. This is especially true for younger community
members. A survey by the Pew Research Center showed that at least 86% of 18-29 year old U.S.
citizens use at least one social media site in contrast to only 34% of people above the age of 65
(Pew Reseach Center 2017b). However, the access to broadband internet is lower in rural areas
(Whitcare 2016). Still 78% of people living in rural areas are online (Pew Research Center
2016). As mentioned in Chapter 4.1.3 groups in all counties struggled to recruit especially young
50
community members. In his testimony for the Senate Joint Economic Committee hearing Mario
Small stressed that early childhood education and childcare programs are a way for children as
well as for parents to build social capital (Small 2017). Going even further, I think that engaging
children in groups, organizations and the community early on in life will create a basis for more
engagement later on in life, as the answers of the participants have shown. Programs such as 4-H
and Future Farmers of America offered by the agricultural extension services in the counties are
a good cornerstone, yet they should if possible be complimented with programs in fields other
than agriculture, to accommodate for different interests. This is in line with Rainey et al. (2003),
who explain that the capacity of community-based organizations and the civic participation of all
residents needs to be encouraged by policies to address local development issues. While it is
difficult to suggest policy suggestions that function as a panacea in all counties, it is important to
create awareness about social capital and the importance of being engaged in one’s community.
51
6. Conclusion
Research on social capital has been conducted for several decades, and as I have noted in this
thesis there is still no consensus about a unifying definition or method to measure it. The
majority of studies focus on one dimension of the subject, in particular the dimension of Groups
and Networks. Taking the multidimensionality of the subject into account, this approach limits
the understanding of social capital and its complex causal network. Additionally, the majority of
indicators used to measure the level of social capital only provide an insight into quantitative
facets of it. In contrast to the typical quantitative approach, the World Bank researchers group
social capital into six interrelated dimensions in their guide on qualitative research on social
capital (Dudwick, et al. 2006). Among them, the dimensions of Groups & Networks, Trust &
Solidarity, Collective Action & Cooperation, Information & Communication, Social Cohesion &
Inclusion as well as Empowerment & Political Action acknowledge and encompass the
multidimensionality of the concept. I aimed for the interviews to provide insights on the quality
of each of the six dimensions of social capital in the three counties.
Beyond this I aimed to gather insights that would allow policy makers to develop more effective
programs to promote social capital.
My analysis rendered results that were related to one another beyond the limits of their
respective dimension.
With regards to the first dimension, my results showed that for the respective counties the
involvement and contact to other members of groups and organizations remained relatively
superficial if the involvement was not fully voluntary or guided by the desire or interest to
contribute in a certain field. An involvement in a large number of groups also seemed to be a
hampering factor in becoming involved on a deeper level. Yet, it became apparent that the
52
utilization of the personal network for job purposes was common in Van Buren County and
Prairie County.
Participants in all counties stated behavior that indicated high levels of solidarity for the
community and other members within the community. Nevertheless, the participants in Van
Buren and Prairie County showed more trust for their neighbors, which positively influenced the
social cohesion and the cooperation. They also tended to form deeper connections with other
community members compared to those in Lincoln County, which might be one possible
explanation why participants in this county were hesitant about utilizing their networks.
For the dimension of Collective Action and Cooperation it became apparent that Van Buren
County set itself apart from the other counties. Van Buren County expanded their bonding,
bridging, and linking social capital even beyond county borders partly due to the weather and
economic hardships experienced by the county in the past. This again is related to the dimension
of Social Cohesion and Inclusion since it facilitates the community as well as the groups and
organizations to be more inclusive.
Van Buren County also led the set in regards to providing information to the citizens by using
modern methods of communication such as social media. This positively influences the
dimensions of Social Cohesion and Inclusion and Empowerment and Political Action. While all
counties struggled to recruit new members, especially young people, participants in Prairie and
Lincoln County reported that they have the same people in all of the groups. The struggle to
recruit new members might be a reason why some individuals were engaged in a lot of groups,
despite the fact that is kept them from being involved on a deeper level. Not being able to enlist
other people might compel engaged individuals to try and compensate for a lack of members by
being a part of many groups. Furthermore, the government officials in Van Buren County were
53
very dedicated in understanding the pulse of their constituents and put a lot of effort in being
inclusive. This behavior can potentially be attributed to the superior quality of the bonding,
bridging and linking social capital in the county and a generally closer relationship among the
inhabitants. In contrast, participants in Prairie and Lincoln County more frequently stated that
certain individuals stood out in the community. Their influence was most often derived from
financial power or their devoted engagement in the community and/or certain groups.
Ethnicity was not an important barrier to social engagement and was not identified as a source
that results in potential conflicts. Instead, the counties seemed to all have a very low conflict
potential in their decisions. Political party differences were identified as an important barrier and
source of lack of cohesion. Yet, there generally seemed to be no deeper disagreement, and the
approach to solve things was often very similar. This again can be linked to the familiarity
among community members in a rural area.
I can conclude from those results that the different dimensions are closely related with one
another and form a complex web of social interaction and engagement. An analysis of social
capital and in particular the quality of social capital has to be guided by a multidimensional
approach in order to reflect this complexity. The results do not only suggest a positive
relationship between the quality and the quantity of social capital, but also a reciprocal
relationship among the different dimensions and therefore within the quality aspect itself.
Even though my results provide a deeper insight into the quality aspect of social capital, they
also made it apparent that general policies that act as a panacea to increase social capital are not
the right solution. Outside of early childhood education and raising awareness on the importance
of social capital, solutions have to be found on a local level. Supracommunal entities are
54
recommended to assist in creating and promoting bridging social capital but need to be created
according to the local environment.
My study has shown the importance of expanding the analysis of social capital to the qualitative
aspects in order to achieve a holistic assessment and conduct more accurate research. It also
allows to better understand the differences between the counties and hopefully be of assistance
when creating local policies.
55
7. References
Acar, E. 2011. "Effects of social capital on academic success: A narrative synthesis."
Educational Research and Reviews, Vol. 6, No. 6 456-461.
Adler, P.S., and S. Kwon. 2002. "Social Capital Prospects for a new concept." Academy of
Management Review, Vol. 27, No. 1 17-40.
Akçomak, I.S., and B. ter Weel. 2012. "The impact of social capital on crime: evidence from the
Netherlands." Regional Science and Urban Economics, No. 42 323-340.
Andriani, L. 2013. Social Capital: a Road Map of Theoretical Frameworks and Empirical
Limitations. London: Birbeck University of London.
Arrow, K.J. 1999. "Observations on Social Capital." In Social Capital - A Multifaceted
Perspective, by Partha Dasgupta and Ismail Serageldin, 3-5. Washington, D.C.: The
World Bank.
Babaei, H., N. Ahmad, and S.S. Gill. 2012. "Bonding, Bridging and Linking Social Capital and
Empowerment Among Squatter Settlements in Tehran, Iran." World Applied Sciences
Journal, Vol. 17 No. 1 119-126.
Baron, J.N., and M.T. Hannan. 1994. "The Impact of Economics on Contemporary Sociology."
Journal of Economic Literature, No. 32 1111-1146.
Bebbington, A.J., and T.F. Carroll. 2000. Induced Social Capital and Federations of the Rural
Poor. Washington, D.C.: The World Bank.
Beugelsdijk, S., and T. van Schaik. 2005. "Social capital and growth in European regions: an
empirical test." European Journal of Political Economy, No. 21 301-324.
Bhagavatula, S., T. Elfring, A. van Tilburg, and G.G. van de Bunt. 2010. "How social and human
capital influence opportunity recognition and resource mobilization in India's handloom
industry." Journal of Business Venturing 245-260.
Bjørnskov, C., and K.M. Sønderskov. 2013. "Is Social Capital a Good Concept?" Social
Indicators Research, Vol. 114, No. 3 1225-1242.
Botzen, K. 2016. "Social Capital and Economic Well-being in Germany’s Regions: An
Exploratory Spatial Data Analysis." Region, Vol. 3, No. 1 1-24.
Bourdieu, P. 1983. "Ökonomisches Kapital, kulturelles Kapital, soziales Kapital"." In Soziale
Ungleichheiten, by Reinhard Kreckel, 249. Goettingen: Otto Schartz & Co.
Bourdieu, P. 1986. "The forms of capital." In Handbook of Theory and Research for the
Sociology of Education, by J. Richardson, 241-258. Westport, CT: Greenwood.
Brown, T.T., R.M. Scheffler, S. Seo, and M. Reed. 2006. "The empirical relationship between
community social capital and the demand for cigarettes." Health Economics, Vol. 15
1159-1172. doi:10.1002/hec.1119.
56
Bureau of Economic Analysis. 2016. Regional Data - Total Full-Tine and Part-Time
Employment by Industry (CA25,Ca25N). November 17. Accessed April 10, 2017.
https://www.bea.gov/itable/iTable.cfm?ReqID=70&step=1#reqid=70&step=1&isuri=1.
Butler Flora, C., J.L. Flora, and S.P. Gasteyer. 2015. Rural Communities: Legacy + Change.
Boulder, CO: Westview Press.
Cambridge Dictionary. 2017. Quality. Edited by Cambridge University Press. Accessed March
06, 2017. http://dictionary.cambridge.org/us/dictionary/english/quality.
Cambridge Dictonary. 2017. Solidarity. Accessed May 31, 2017.
http://dictionary.cambridge.org/us/dictionary/english/solidarity.
Casey, T. 2004. "Social Capital and Regional Economies in Britain." Political Studies, No. 52
96-117.
Clarity Elections. 2017. 2016 General Election and Nonpartisan Runoff Election. Accessed
March 23, 2017.
http://results.enr.clarityelections.com/AR/63912/184685/Web01/en/summary.html.
Coleman, J.S. 1988. "Social Capital in the Creation of Human Capital." American Journal of
Sociology, Vol. 94, Supplement: Organizations and Institutions: Sociological and
Economic Approaches to the Analysis of Social Structure, 95-120.
Dudwick, N., K. Kuehnast, V.N. Jones, and M. Woolcock. 2006. Analyzing Social Capital in
Context - A guide to using Qualitative Methods and Data. Washington, D.C.: The World
Bank.
Fafchamps, M., and B. Minten. 1998. "Relationships and Traders in Madagascar." The Journal
of Development Studies, Vol. 35, No. 6 1-35.
Federal Reserve Bank of St. Louis. 2017. Arkansas. Accessed March 22, 2017.
https://fred.stlouisfed.org/categories/149.
Fine, B. 2002. "Workshop on Social Capital and Civic Involvement." Antipode, Vol. 34, No. 4
796-799.
Gallup. 2016. New Hampshire Now Least Religious State in U.S. February 04.
http://www.gallup.com/poll/189038/new-hampshire-least-religious-state.aspx.
Gerring, J. 1999. "What makes a concept good? A criterial framework for understanding concept
formation in the social sciences." Polity, Vol 31, No. 3 357-393.
Greenberg Quinlan Rosner Research. 2002. Perceptions of Rural America. Battle Creek, MI:
W.K. KELLOGG FOUNDATION.
Grootaert, C., and T. van Bastelaer. 2001. Understanding and Measuring Social Capital: A
Synthesis of Findings and Recommendations from the Social Capital Initiative.
Washington, D.C.: The World Bank.
57
Grootaert, C., D. Narayan, V. N. Jones, and M. Woolcock. 2004. Measuring Social Capital - An
integrated Questionnaire. Washington, D.C.: The World Bank.
Guiso, L., P. Sapienza, and L. Zingales. 2004. "The Role of Social Capital in Financial
Development." American Economic Review, Vol. 94, No. 3 526-556.
Hawkins, R.L., and K. Maurer. 2010. "Bonding, Bridging and Linking: How Social Capital
Operated in New Orleans following Hurricane Katrina." British Journal of Social Work,
Vol. 40 1777-1793.
Hernandez, C.J. 2015. "Defining the Same Concept? To What Extent the Definition of Social
Capital Matters to Explain Level of Production?" doi:10.13140/RG.2.1.1959.5684.
Hutchinson, P.J. 2006. "First Nation/State Relationships and First Nation Health: An exploratory
Analysis of Linkage Social Capital as a Determinant of Health." Pimatisiwin: A Journal
of Aboriginal and Indigenous Community Health, Vol. 4, No. 1 105-118.
Joint Economic Committee. 2017a. ‘What we do together – The State of Associational Life in
America’ SCP Report No. 1-17. Joint Economic Committee.
—. 2017b. "What We Do Together: The State of Social Capital in America Today." United
States Congress Hearing. Washington, D.C., May 17.
Knack, S., and P. Keefer. 1997. "Does Social Capital Have an Economic Payoff? A Cross-
Country Investigation." The Quarterly Journal of Economics, Vol. 112, No. 4 1251-1288.
Krishna, A., and N. Uphoff. 1999. Mapping and Measuring Social Capital: A Conceptual and
Empirical Study of Collective Action for Conserving and Developing Watersheds in
Rajasthan, India. Washington, D.C.: The World Bank.
Larsen, L., S.L. Harlan, B. Bolin, E.J. Hackett, D. Hope, A. Kirby, A. Nelson, T.R. Rex, and S.
Wolf. 2004. "Bonding and Bridging - Understanding the Relationship between Social
Capital and Civic Action." Journal of Planning Education and Research, No. 24 64-77.
doi:10.1177/0739456X04267181.
Lee, A. 2010. "The Quality of Social Capital and Political Participation in South Korea." Journal
of East Asian Studies, Vol. 10 483-505.
Lee, C., and D. Kim. 2013. "A Comparative Analysis of the Validity of US State- and County-
Level Social Capital Measures and Their Associations with Population Health." Soc Indic
Res., Vol. 111 No. 1 307-326. doi:10.1007/s11205-012-0007-y.
Levin, Y. 2017. "“The State of Social Capital in America Today” - Testimony before the Joint
Economic Committee of the United States Congress." Washington, D.C., May 17.
Merriam-Webster. 2017. Bible Belt. Accessed June 12, 2017. https://www.merriam-
webster.com/dictionary/Bible%20Belt.
Messely, L., E. Rogge, and J. Dessein. 2013. "Using the rural web in dialogue with regional
stakeholders." Journal of Rural Studies, Vol. 32 400-410.
58
Morrow, V. 1999. "Conceptualising social capital in relation to the well-being of children and
young people: a critical review." The Sociological Review 744-765.
National Archives and Records Administration. 2017. U.S. Electoral College. Accessed March
22, 2017. https://www.archives.gov/federal-register/electoral-
college/map/historic.html#2012.
NCCS. 2017. Geographic Search . Accessed April 3, 2017.
http://nccsweb.urban.org/PubApps/geoSearch2.php.
Nuzzo, G. 2006. "No. 11 - Un seconolo di statistiche sociali: persistenza o convergenza tra le
regioni italiane?" Quaderni dell’Ufficio Ricerche Storiche Banca d’Italia.
OECD. 2001. The Well-being of Nations - The Role of Human and Social Capital. Paris: OECD.
Pew Reseach Center. 2017a. Religious composition of adults in Arkansas. Accessed March 22,
2017. http://www.pewforum.org/religious-landscape-study/state/arkansas/.
—. 2017b. Social Media Fact Sheet. Accessed June 6, 2017. http://www.pewinternet.org/fact-
sheet/social-media/.
Pew Research Center. 2016. 13% of Americans don’t use the internet. Who are they? Accessed
July 24, 2017. http://www.pewresearch.org/fact-tank/2016/09/07/some-americans-dont-
use-the-internet-who-are-they/.
Politico. 2016. 2016 Arkansas Presidential Election Results. December 13. Accessed March 23,
2017. http://www.politico.com/2016-election/results/map/president/arkansas/.
Portes, A. 1998. "SOCIAL CAPITAL: Its Origins and Applications in Modern Sociology."
Annual Reviews of Sociology, No. 24 1-24.
Public School Review. 2017. Van Buren County Public Schools. Accessed March 22, 2017.
https://www.publicschoolreview.com/arkansas/van-buren-county.
Putnam, R.D. 1995. "Bowling Alone: America's Declining Social Capital." Journal of
Democracy, Vol. 6 No. 1 65-78.
—. 2000. Bowling Alone: The Collapse and Revival of American Community. New York: Simon
& Schuster.
—. 2017. "Hearing on the State of Social Capital in America." Washington, D.C., May 17.
Putnam, R.D., R. Leonardi, and R.Y. Nonetti. 1993. Making Democracy Work - Civic Traditions
in Modern Italy. Princeton, New Jersey: Princeton University Press.
QSR International Pty Ltd. 2015. "NVivo qualitative data analysis Software." Melbourne,
Australia.

59
Rainey, D.V., K.L. Robinson, I. Allen, and R.D. Christy. 2003. "Essential Public and Private
Capital for Sustainable Community Development." American Journal of Agricultural
Economics, Vol. 85, No. 3 708-715.
Reid, C., and L. Salmen. 2002. "Qualitative Analysis of Social Capital: The Case of Agricultural
Extension in Mali." Understanding and Measuring Social Capital: A Multidisciplinary
Tool for Practitioners. Edited by Christiaan Grootaert and Thierry van Bastelaer.
Washington, D.C.: The World Bank.
Robison, L.J., A.A. Schmid, and M.E. Siles. 2002. "Is Social Capital Really Capital?" Review of
Social Economy, Vol. 60, No. 1 1-21.
Rupasingha, A., S.J. Goetz, and D. Freshwater. 2000. "Social Capital and Economic Growth: A
County-Level Analysis." Journal of Agriculture and Applied Economics, No. 32 (3) 565-
572.
Rupasingha, A., S.J. Goetz, and D. Freshwater. 2006. "The production of social capital in US
counties." Journal of Socio-Economics, Vol. 35 83-101. doi:10.1016/j.socec.2005.11.001.
Sabatini, F. 2009. "Social capital as social networks: a new framework for measurement and an
empirical analysis of its determinants and consequences." The Journal of Socio-
Economics, Vol. 38 429-442.
Scrivens, K., and C. Smith. 2013. Four Interpretations Of Social Capital: An Agenda For
Measurement (No.2013/6). OECD Publishing.
Small, M. 2017. "“What We Do Together: The State of Social Capital in America Today” - Joint
Economic Committee." Washington, D.C., May 17.
Stam, W., S. Arzlanian, and T. Elfring. 2014. "Social capital of entrepreneurs and small firm
performance: A meta-analysis of contextual and methodological moderators." Journal of
Business Venturing, No. 29 152-173.
Szreter, S., and M. Woolcock. 2004. "Health by association? Social capital, social theory, and
the political economy of public health." International Journal of Epidemiology, No. 33
650-667.
Taylor, L. 2016. Fayetteville Shale. Accessed May 31, 2017.
http://www.encyclopediaofarkansas.net/encyclopedia/entry-detail.aspx?entryID=6011.
Tzanakis, M. 2013. "Social capital in Bourdieu’s, Coleman’s and Putnam’s theory: empirical
evidence and emergent measurement issues." Educate, Vol.13, No. 2 2-23.
U.S. Census Bureau. 2015a. 2010 Census Urban and Rural Classification and Urban Area
Criteria. February 15. Accessed March 22, 2017.
https://www.census.gov/geo/reference/ua/urban-rural-2010.html.
—. 2015b. "2010 Census Urban Lists Record Layouts." census.gov. 09 February. Accessed
March 29, 2017. https://www.census.gov/geo/reference/ua/ualists_layout.html.
60
—. 2017a. American Fact Finder. Accessed March 22, 2017.
https://factfinder.census.gov/faces/nav/jsf/pages/community_facts.xhtml.
—. 2006. "Arkansas Counties Map." commons.wikimedia.org. Accessed May 02, 2017.
https://commons.wikimedia.org/wiki/File:Arkansas_counties_map.png.
—. 2017b. Community facts. Accessed June 01, 2017.
https://factfinder.census.gov/faces/nav/jsf/pages/community_facts.xhtml?src=bkmk#.
—. 2016a. Median Household Income by State. Accessed June 02, 2017.
https://www.census.gov/search-
results.html?q=median+household+income&search.x=0&search.y=0&page=1&stateGeo
=none&searchtype=web.
—. 2017c. QuickFacts. Accessed April 15, 2017.
https://www.census.gov/quickfacts/table/PST045216/05117,05079,05141,0541000,05,00.
—. 2016b. "Small Area Income and Poverty Estimates." census.gov. Accessed June 02, 2017.
https://www.census.gov/did/www/saipe/data/statecounty/data/2015.html.
U.S. Department of Commerce. 2017. Regional Economic Accounts. February 2.
https://www.bea.gov/iTable/drilldown.cfm?reqid=70&stepnum=11&AreaTypeKeyGdp=
5&GeoFipsGdp=XX&ClassKeyGdp=NAICS&ComponentKey=200&IndustryKey=1&Y
earGdp=2015Q2&YearGdpBegin=-1&YearGdpEnd=-
1&UnitOfMeasureKeyGdp=Levels&RankKeyGdp=1&Drill=1&nRange=5.
U.S. Religion Census. 2012. " Religious Congregations and Membership Study, 2010 County
File." www.rcms2010.org. Accessed June 26, 2017.
http://www.rcms2010.org/compare.php.
University of Wisconsin Population Health Institute . 2017. County Health Rankings 2017.
Accessed March 29, 2017.
http://www.countyhealthrankings.org/app/arkansas/2017/overview.
Whitcare, Brian. 2016. "Technology is improving - why is rural broadband access still a
problem?" theconversation.com. Accessed July 24, 2017.
http://theconversation.com/technology-is-improving-why-is-rural-broadband-access-still-
a-problem-60423.
Woolcock, M. 1998. "Social capital and economic development: Toward a theoretical synthesis
and policy framework." Theory and Society, No. 27 151-208.
Woolcock, M., and D. Narayan. 2000. "Social Capital: Implications for Development Theory,
Research, and Policy." The WOTU Bank Research Observer, Vol. 15, No. 2 225-249.
61
8. Appendices
Appendix 1: Questions asked in Semi-structured Interview
● What organizations and/or groups are you affiliated with in __________ (name of
community)?
○ How would you describe your relationship with members of those groups/
members of your social networks?
● Do you discuss serious and personal matters with your network
○ If so, who do you confide in?
○ If not, why not?
● Do you feel it is important to have a network of acquaintances, relatives and friends to
succeed in this community?
○ Can you rely on the network that you have built?
■ In what way have you been able to or want to utilize this network or the
groups you are a member of?
● How would you describe your relationship to people outside of your inner circle?
● What individuals or groups are normally involved in major discussions and decisions
involving the future of the community?
○ What efforts are made to include viewpoints from those not in the main
discussion group?
● How does the community/group decide if they should act?
○ Is it a conflict prone process?
● How do you feel about the formal and informal institutions in this county fulfilling their
purpose?
○ How extensive is the influence you and your community have on formal and
informal institutions?
■ Would you say certain groups have more influence than others? If so, how
did that come about?
● Is there anything else you would like to share?
62
Appendix 2: Research Compliance Protocol Letter