Embed Size (px)
Citation preview
VISIT AND BUY. AN EMPIRICAL ANALYSIS ON TOURISM AND EXPORTS
Anna Maria Pinna
WORKING PAPERS
2 0 1 2 / 1 8
C O N T R I B U T I D I R I C E R C A C R E N O S
FISCALITÀ LOCALE E TURISMO LA PERCEZIONE DELL’IMPOSTA DI SOGGIORNO E DELLA
TUTELA AMBIENTALE A VILLASIMIUS
Carlo Perelli Giovanni Sistu Andrea Zara
QUADERNI DI LAVORO
2 0 1 1 / 0 1
T E M I E C O N O M I C I D E L L A S A R D E G N A
!"#!$
C E N T R O R I C E R C H E E C O N O M I C H E N O R D S U D
( C R E N O S ) U N I V E R S I T À D I C A G L I A R I U N I V E R S I T À D I S A S S A R I
C R E N O S w a s s e t u p i n 1 9 9 3 w i t h t h e p u r p o s e o f o r g a n i s i n g t h e j o i n t r e s e a r c h e f f o r t o f e c o n o m i s t s f r o m t h e t w o S a r d i n i a n u n i v e r s i t i e s ( C a g l i a r i a n d S a s s a r i ) i n v e s t i g a t i n g d u a l i s m a t t h e i n t e r n a t i o n a l a n d r e g i o n a l l e v e l . C R E N o S ’ p r i m a r y a i m i s t o i m p r o v e k n o w l e d g e o n t h e e c o n o m i c g a p b e t w e e n a r e a s a n d t o p r o v i d e u s e f u l i n f o r m a t i o n f o r p o l i c y i n t e r v e n t i o n . P a r t i c u l a r a t t e n t i o n i s p a i d t o t h e r o l e o f i n s t i t u t i o n s , t e c h n o l o g i c a l p r o g r e s s a n d d i f f u s i o n o f i n n o v a t i o n i n t h e p r o c e s s o f c o n v e r g e n c e o r d i v e r g e n c e b e t w e e n e c o n o m i c a r e a s . T o c a r r y o u t i t s r e s e a r c h , C R E N o S c o l l a b o r a t e s w i t h r e s e a r c h c e n t r e s a n d u n i v e r s i t i e s a t b o t h n a t i o n a l a n d i n t e r n a t i o n a l l e v e l . T h e c e n t r e i s a l s o a c t i v e i n t h e f i e l d o f s c i e n t i f i c d i s s e m i n a t i o n , o r g a n i z i n g c o n f e r e n c e s a n d w o r k s h o p s a l o n g w i t h o t h e r a c t i v i t i e s s u c h a s s e m i n a r s a n d s u m m e r s c h o o l s . C R E N o S c r e a t e s a n d m a n a g e s s e v e r a l d a t a b a s e s o f v a r i o u s s o c i o - e c o n o m i c v a r i a b l e s o n I t a l y a n d S a r d i n i a . A t t h e l o c a l l e v e l , C R E N o S p r o m o t e s a n d p a r t i c i p a t e s t o p r o j e c t s i m p a c t i n g o n t h e m o s t r e l e v a n t i s s u e s i n t h e S a r d i n i a n e c o n o m y , s u c h a s t o u r i s m , e n v i r o n m e n t , t r a n s p o r t s a n d m a c r o e c o n o m i c f o r e c a s t s . w w w . c r e n o s . i t i n f o @ c r e n o s . i t
C R E N O S – C A G L I A R I V I A S A N G I O R G I O 1 2 , I - 0 9 1 0 0 C A G L I A R I , I T A L I A
T E L . + 3 9 - 0 7 0 - 6 7 5 6 4 0 6 ; F A X + 3 9 - 0 7 0 - 6 7 5 6 4 0 2
C R E N O S - S A S S A R I V I A T O R R E T O N D A 3 4 , I - 0 7 1 0 0 S A S S A R I , I T A L I A
T E L . + 3 9 - 0 7 9 - 2 0 1 7 3 0 1 ; F A X + 3 9 - 0 7 9 - 2 0 1 7 3 1 2 T i t l e : V IS IT AND BUY . AN EMPIR ICAL ANALYS IS ON TOURISM AND EXPORTS I SBN: 978 88 84 67 771 6 F i r s t Ed i t i on : Ju l y 2012 - Second Ed i t i on : November 2012 © CUEC 2012 V i a I s M i r r i o n i s , 1 09123 C a g l i a r i T e l . / F a x 070 291201 w w w . c u e c . i t
1
Visit and Buy. An Empirical Analysis on Tourism and Exports
Anna Maria Pinna∗+
University of Cagliari and CRENoS
Abstract The impact of international tourism flows has been poorly studied within the international trade literature. In this paper I use disaggregated bilateral data on both movements of people and movements of goods in order to carry out a panel data analysis on how the two flows are linked. Rajan and Zingales (1998) methodology is applied in order to identify those products (experienced goods) which are more likely to be sampled by foreign visitors. I concentrate on 11 manufacturing industries whose products are ’local’ varieties and are likely to be part of the traveling experience. I compute an index of experienced good intensity and I use products which are not final consumption goods as a control group. The identifying strategy enables us to robustly assess the influence of total arrivals in a country on its exports. After considering 25 EU countries, it is found that tourism promotes exports and its effect is not negligible, particularly for the EU15 group, being of 3.5% for sectors at mean of the experienced good intensity distribution. Keywords: Trade, Tourism, Gravity JEL Classification: F14, F15
∗ Dipartimento di Economia, Università di Cagliari, viale S. Ignazio, 17. 09123 Cagliari, Italia. E-mail address: [email protected] + The author wishes to thank Rinaldo Brau, Fabiano Schivardi, Raffaele Paci and partic- ipants at the 2nd International Conference on Tourism Economics at the sixt International Economic conference and at the NARSC or their suggestions and comments to a previous version of the paper.
1. Introduction
Although revenues from inbound tourism can be considered equivalent to ex-ports, namely export of services in the balance of payments of the host country,scholars have surprisingly overlooked tourist flows within standard interna-tional trade models. From an intuitive point of view, the fact that tourismis likely to affect the nature and the size of commodity transactions betweencountries, should be self-evident. For example, tourism facilities and servicesare likely to involve the import of specific goods which are needed in order tosatisfy visitors’ needs.
On the exports’ side there are potentially two channels, distinct in time,whose possible interrelation deserves investigation. First of all there is theprovision of local products to tourists. They can be called exports at home.They are easier: they are not burdened by all the costs involved in crossing aborder. More, selling products at home to foreign visitors involves an exchangeof information with a dual content, on local products and on foreign tastes,which may foster traditional exports. This paper revolves around this sec-ond possibility: the direct contact between foreign visitors and local products,potentially, can activate an international demand once tourists come back totheir own countries.1
In this paper I examine data at the country level and I evaluate whethertourism may change consumers’ attitudes about foreign cultures, this way in-ducing a higher demand for foreign products. The issue is still undeveloped inthe literature. The study of the relationship between tourism and exports is notnew, but another perspective has been prevalent till now. Several works haveconsidered tourism and exports as joint determinants of growth and tried to de-tect long-run causal relationships (e.g.Balaguer and Cantavella-Jorda (2002);Dritsakis (2004); Durberry (2004))and Oh (2005)).
Identification is our issue. When linking people’s movements with goods’border crossing, a procedure consistent with the underlying intuition on howarrivals can favor new foreign sales has to be adopted. Theoretically, arrivalsto a country are a way for local firms to gain information on foreign costumers’tastes and, in the other direction, for foreign consumers to add local varietiesto their consumption bundle. If this is true then a proper methodology needsto be based on the identification of those cases where such information ex-change is likely to occur. I propose to test whether this is differently verifiedfor those goods which are sampled during the travel, with respect to the com-plete bundle of produced goods.
1The implication of exports at home is that also firms which do not operate in theinternational markets (the great majority) can get to know foreign tastes by selling totourists.
2
The focus is on exchanges within the EU. First of all, unlike existing stud-ies, I use bilateral data on both travel and exports. If the assumption to betested is that English people will know Italian products better, and hence buythem, if spending some time in Italy the use of bilateral data links in a preciseway a specific flow of people to the correspondent flow of commodities whoseexports could be stimulated. A paper in line with such approach is Quinn(2009), who finds some positive role of tourist visits on US exports using datafrom 19 countries. In another work, Fischer and Luis (2009) check for thepossibility that arrivals in Spain from Germany are a stimulus for exports ofSpanish wines to Germany).
The focus on wine in Fischer and Luis (2009) suggests that the movementof people across borders can be relevant for making some products betterknown to foreign consumers. The identifying strategy here used builds on asimilar reasoning.2 Rajan and Zingales (1998) methodology is applied in orderto identify those products which are more likely to be sampled (experienced)by foreign visitors. An indicator that proxies the experience good intensityfocusing on 11 manufacturing industries whose varieties are more apt to varywith the location, such as food, beverages and some light manufacturing, iscalculated. The assumption is that tourist will sample and taste ’local’ varietyas a part of tourist experience. Then, products which are similar to the previ-ous ones but are not going to be experienced by tourists are also needed as a’control group’. Commodities produced by the same industry but with a dif-ferent end of use (all products but consumption goods) enter the control group.
The identifying strategy here proposed enables to robustly assess the in-fluence of arrivals in a country on its exports. After considering 25 countriesbelonging to the European Union, we find that tourism has a positive effecton exports which ranges between 0 to 7% according to the sectoral intensity ofexperience good and the distinction between Old and New Europe economies.
The paper is structured as follows: section 2 will present the empirical issuesof our work. The proxy for the experience-goods intensity and its computationsare discussed in section 3. Section 4 describes the data. Results are illustratedin section 5. A test on our sectoral choices is presented in section 6, whichprovides a robustness check for our results. Conclusions follow.
2We also understand that the choice of the travel destination is motivated by specificcountry characteristics such as weather, average temperature and the quality of touristresources. But also the quality of the tourist experience can depend on the availability ofsome products. The possibility of drinking good wine plays some role in making Francea tourist destination. The argument of this paper is that the great reductions in air-fairsincreased the mobility of EU citizens as well as their awareness of products previouslyunknown outside national borders. In the case of French wine a visit to the Bordeaux regionis likely to promote the experience of new varieties (new producers) of the well known grape,in line with our findings.
3

2. Movements of people and movements of goods
Table 1 illustrates how the EU market has witnessed a quite dramatic increasemovements of people (regardless of their duration) here proxied by the num-ber of total passengers. The distinction by transport mode makes it clear thata strong push to movements across borders has been given by developmentsin the air transport market. The period considered (1998-2005) just followsthe first appearance of low-cost companies, which in 1995 started to establishthemselves at the EU level. At the beginning of the period the list of compa-nies flying above the EU skies was quite long with many companies competingin order to acquire a dominant position either at the route or country level.The passing of the years has seen two of them, Ryanair and EasyJet, endingto be the major low-cost players in the EU transport market already in 2005.
Table 1Percentage change in number of passengers 1995-2008, by mode
Period Cars Bus Rail Air Sea Total1995-2008 21.4 9.4 17 62 -8 22.5per year 1.5 0.7 1.2 3.8 -0.6 1.62000-2008 9.3 5.5 10 23 -1.9 10per year 1.1 0.7 1.2 2.6 -0.2 1.22007-2008 -0.7 0.9 3.5 -1.9 -0.2 -0.3* Energy and Transport in Figures, EU Commission
(2010)
Our main question is whether such an impulse given on the temporary bor-der crossing of people has had an impact on making different national productsbetter known to EU consumers, and has therefore stimulated trade. As figure(1) shows, the increase, in the same years, in the movement of goods withinEU borders has been strong and continuous. Volumes measured both in valuesand quantities give a similar picture. This paper revolves on the possibilitythat tourism has been a valid help for making local products better known toforeign tastes, within the EU. In order to evaluate on this claim, differentlyfrom existing studies on tourism, trade and growth, which use total arrivals ina country, origin-destination people’s movements are used.
2.1. A double-sided causality link
Arrivals correspond to international visitors to a country excluding same-daynon-resident visitors.3 The possibility that a short-term visit is motivated by
3The World Tourism Organization defines tourists as people who ”travel to and stay inplaces outside their usual environment for more than twenty-four (24) hours and not more
4
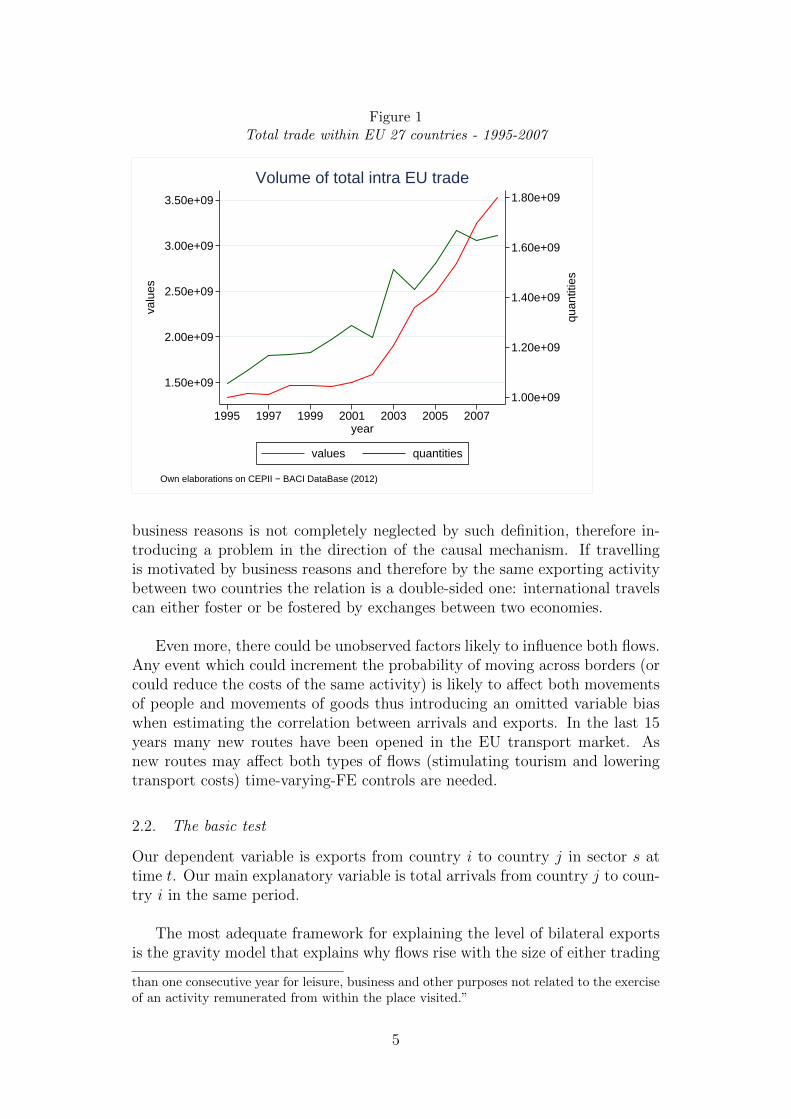
Figure 1Total trade within EU 27 countries - 1995-2007
1.00e+09
1.20e+09
1.40e+09
1.60e+09
1.80e+09
quan
titie
s
1.50e+09
2.00e+09
2.50e+09
3.00e+09
3.50e+09
valu
es
1995 1997 1999 2001 2003 2005 2007year
values quantities
Own elaborations on CEPII − BACI DataBase (2012)
Volume of total intra EU trade
business reasons is not completely neglected by such definition, therefore in-troducing a problem in the direction of the causal mechanism. If travellingis motivated by business reasons and therefore by the same exporting activitybetween two countries the relation is a double-sided one: international travelscan either foster or be fostered by exchanges between two economies.
Even more, there could be unobserved factors likely to influence both flows.Any event which could increment the probability of moving across borders (orcould reduce the costs of the same activity) is likely to affect both movementsof people and movements of goods thus introducing an omitted variable biaswhen estimating the correlation between arrivals and exports. In the last 15years many new routes have been opened in the EU transport market. Asnew routes may affect both types of flows (stimulating tourism and loweringtransport costs) time-varying-FE controls are needed.
2.2. The basic test
Our dependent variable is exports from country i to country j in sector s attime t. Our main explanatory variable is total arrivals from country j to coun-try i in the same period.
The most adequate framework for explaining the level of bilateral exportsis the gravity model that explains why flows rise with the size of either trading
than one consecutive year for leisure, business and other purposes not related to the exerciseof an activity remunerated from within the place visited.”
5
partners or when their distance (either geographical or cultural) is smaller.Furthermore the gravity equation also accounts for barriers significantly im-peding trade.
If we want to control for all factors stimulating traveling across country-pairs (such as changes in the route map), the classical variables entering agravity exercise (income of origin and destination and measures of distance)cannot be estimated. Also the main explanatory variable (arrivals j to i) hereinvestigated needs to have one more dimension of variability with respect tothe time-varying-pair FE. I will use the variance across industries in somedegree of exposure to foreign tastes in order to estimate a coefficient of thedifferential effect of total arrival.
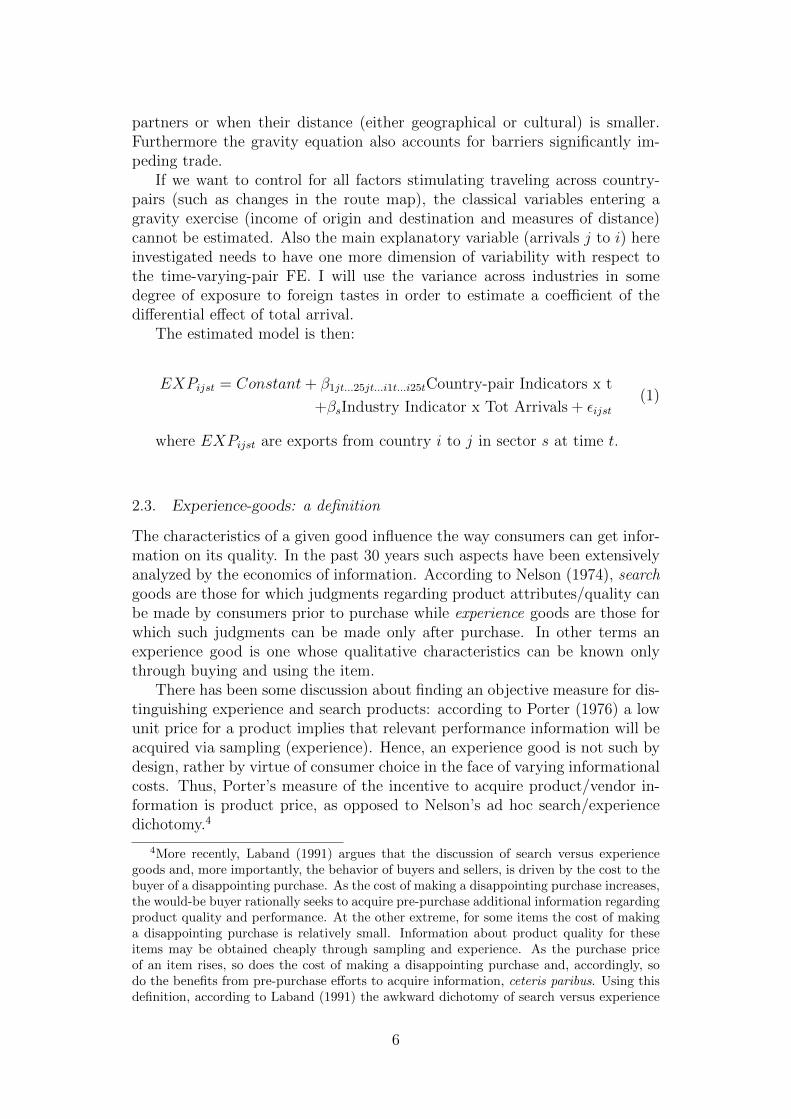
The estimated model is then:
EXPijst = Constant+ β1jt...25jt...i1t...i25tCountry-pair Indicators x t
+βsIndustry Indicator x Tot Arrivals + εijst(1)
where EXPijst are exports from country i to j in sector s at time t.
2.3. Experience-goods: a definition
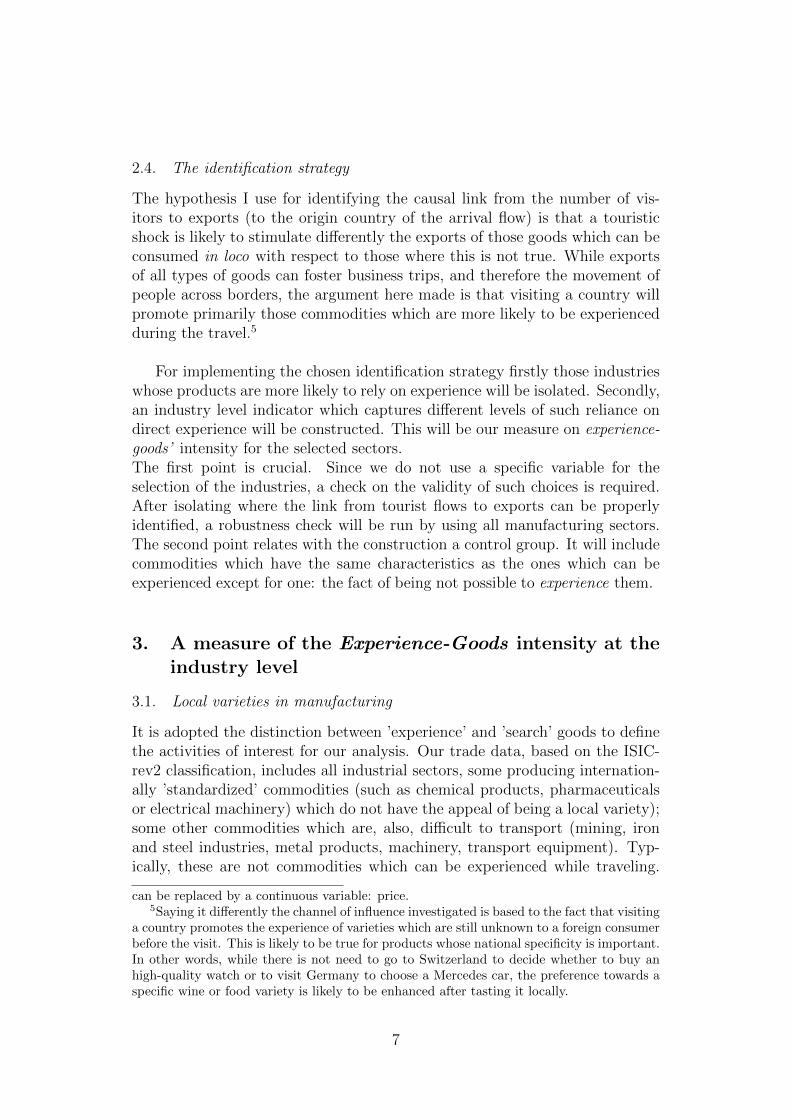
The characteristics of a given good influence the way consumers can get infor-mation on its quality. In the past 30 years such aspects have been extensivelyanalyzed by the economics of information. According to Nelson (1974), searchgoods are those for which judgments regarding product attributes/quality canbe made by consumers prior to purchase while experience goods are those forwhich such judgments can be made only after purchase. In other terms anexperience good is one whose qualitative characteristics can be known onlythrough buying and using the item.
There has been some discussion about finding an objective measure for dis-tinguishing experience and search products: according to Porter (1976) a lowunit price for a product implies that relevant performance information will beacquired via sampling (experience). Hence, an experience good is not such bydesign, rather by virtue of consumer choice in the face of varying informationalcosts. Thus, Porter’s measure of the incentive to acquire product/vendor in-formation is product price, as opposed to Nelson’s ad hoc search/experiencedichotomy.4
4More recently, Laband (1991) argues that the discussion of search versus experiencegoods and, more importantly, the behavior of buyers and sellers, is driven by the cost to thebuyer of a disappointing purchase. As the cost of making a disappointing purchase increases,the would-be buyer rationally seeks to acquire pre-purchase additional information regardingproduct quality and performance. At the other extreme, for some items the cost of makinga disappointing purchase is relatively small. Information about product quality for theseitems may be obtained cheaply through sampling and experience. As the purchase priceof an item rises, so does the cost of making a disappointing purchase and, accordingly, sodo the benefits from pre-purchase efforts to acquire information, ceteris paribus. Using thisdefinition, according to Laband (1991) the awkward dichotomy of search versus experience
6
2.4. The identification strategy
The hypothesis I use for identifying the causal link from the number of vis-itors to exports (to the origin country of the arrival flow) is that a touristicshock is likely to stimulate differently the exports of those goods which can beconsumed in loco with respect to those where this is not true. While exportsof all types of goods can foster business trips, and therefore the movement ofpeople across borders, the argument here made is that visiting a country willpromote primarily those commodities which are more likely to be experiencedduring the travel.5
For implementing the chosen identification strategy firstly those industrieswhose products are more likely to rely on experience will be isolated. Secondly,an industry level indicator which captures different levels of such reliance ondirect experience will be constructed. This will be our measure on experience-goods’ intensity for the selected sectors.The first point is crucial. Since we do not use a specific variable for theselection of the industries, a check on the validity of such choices is required.After isolating where the link from tourist flows to exports can be properlyidentified, a robustness check will be run by using all manufacturing sectors.The second point relates with the construction a control group. It will includecommodities which have the same characteristics as the ones which can beexperienced except for one: the fact of being not possible to experience them.
3. A measure of the Experience-Goods intensity at theindustry level
3.1. Local varieties in manufacturing
It is adopted the distinction between ’experience’ and ’search’ goods to definethe activities of interest for our analysis. Our trade data, based on the ISIC-rev2 classification, includes all industrial sectors, some producing internation-ally ’standardized’ commodities (such as chemical products, pharmaceuticalsor electrical machinery) which do not have the appeal of being a local variety);some other commodities which are, also, difficult to transport (mining, ironand steel industries, metal products, machinery, transport equipment). Typ-ically, these are not commodities which can be experienced while traveling.
can be replaced by a continuous variable: price.5Saying it differently the channel of influence investigated is based to the fact that visiting
a country promotes the experience of varieties which are still unknown to a foreign consumerbefore the visit. This is likely to be true for products whose national specificity is important.In other words, while there is not need to go to Switzerland to decide whether to buy anhigh-quality watch or to visit Germany to choose a Mercedes car, the preference towards aspecific wine or food variety is likely to be enhanced after tasting it locally.
7
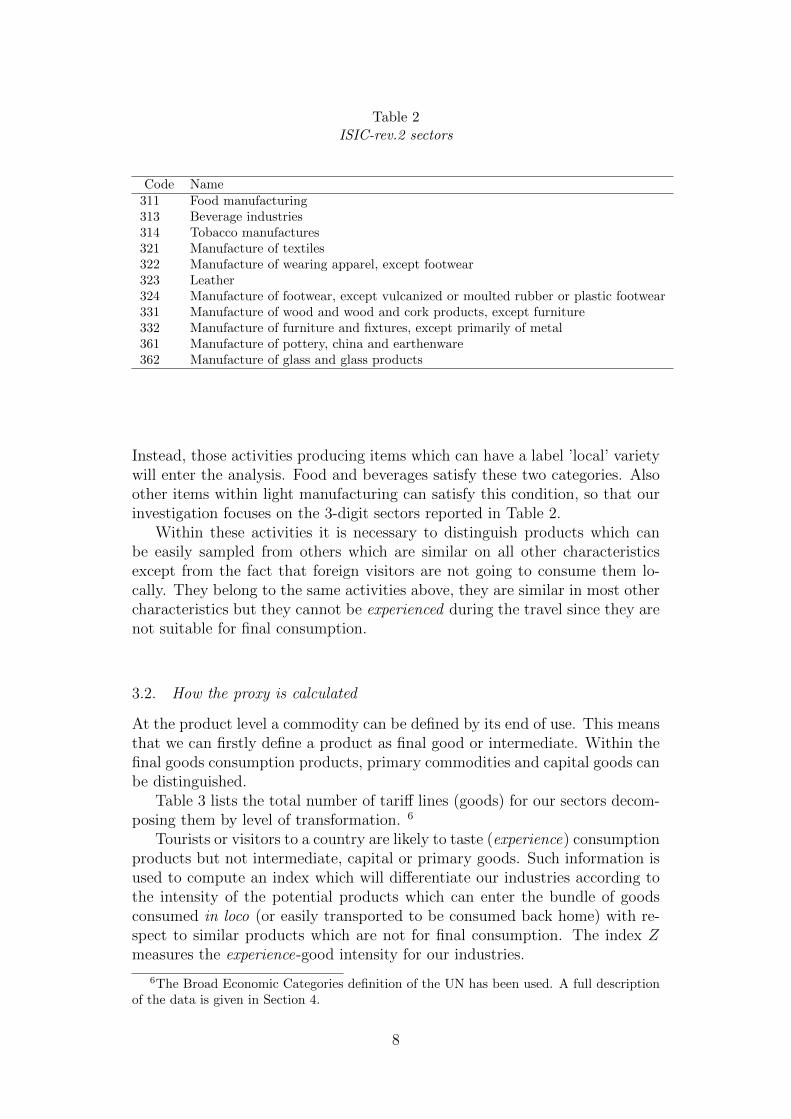
Table 2ISIC-rev.2 sectors
Code Name311 Food manufacturing313 Beverage industries314 Tobacco manufactures321 Manufacture of textiles322 Manufacture of wearing apparel, except footwear323 Leather324 Manufacture of footwear, except vulcanized or moulted rubber or plastic footwear331 Manufacture of wood and wood and cork products, except furniture332 Manufacture of furniture and fixtures, except primarily of metal361 Manufacture of pottery, china and earthenware362 Manufacture of glass and glass products
Instead, those activities producing items which can have a label ’local’ varietywill enter the analysis. Food and beverages satisfy these two categories. Alsoother items within light manufacturing can satisfy this condition, so that ourinvestigation focuses on the 3-digit sectors reported in Table 2.
Within these activities it is necessary to distinguish products which canbe easily sampled from others which are similar on all other characteristicsexcept from the fact that foreign visitors are not going to consume them lo-cally. They belong to the same activities above, they are similar in most othercharacteristics but they cannot be experienced during the travel since they arenot suitable for final consumption.
3.2. How the proxy is calculated
At the product level a commodity can be defined by its end of use. This meansthat we can firstly define a product as final good or intermediate. Within thefinal goods consumption products, primary commodities and capital goods canbe distinguished.
Table 3 lists the total number of tariff lines (goods) for our sectors decom-posing them by level of transformation. 6
Tourists or visitors to a country are likely to taste (experience) consumptionproducts but not intermediate, capital or primary goods. Such information isused to compute an index which will differentiate our industries according tothe intensity of the potential products which can enter the bundle of goodsconsumed in loco (or easily transported to be consumed back home) with re-spect to similar products which are not for final consumption. The index Zmeasures the experience-good intensity for our industries.
6The Broad Economic Categories definition of the UN has been used. A full descriptionof the data is given in Section 4.
8
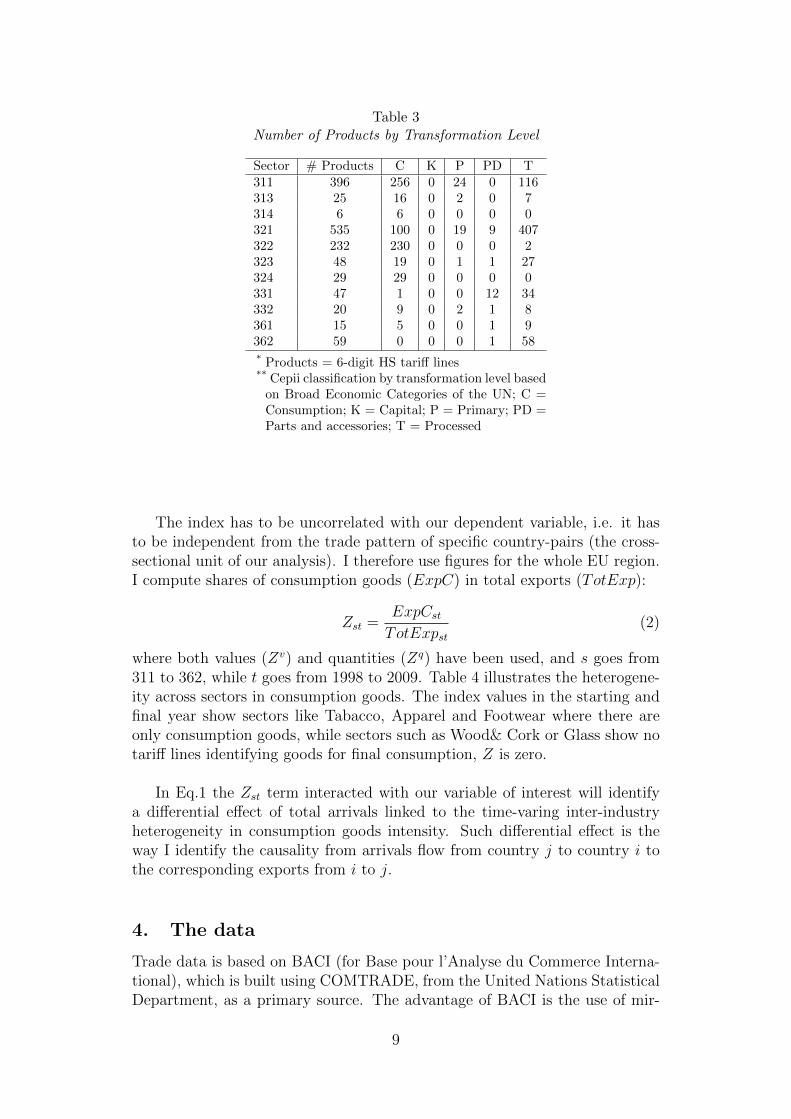
Table 3Number of Products by Transformation Level
Sector # Products C K P PD T311 396 256 0 24 0 116313 25 16 0 2 0 7314 6 6 0 0 0 0321 535 100 0 19 9 407322 232 230 0 0 0 2323 48 19 0 1 1 27324 29 29 0 0 0 0331 47 1 0 0 12 34332 20 9 0 2 1 8361 15 5 0 0 1 9362 59 0 0 0 1 58* Products = 6-digit HS tariff lines** Cepii classification by transformation level based
on Broad Economic Categories of the UN; C =Consumption; K = Capital; P = Primary; PD =Parts and accessories; T = Processed
The index has to be uncorrelated with our dependent variable, i.e. it hasto be independent from the trade pattern of specific country-pairs (the cross-sectional unit of our analysis). I therefore use figures for the whole EU region.I compute shares of consumption goods (ExpC) in total exports (TotExp):
Zst =ExpCst
TotExpst(2)
where both values (Zv) and quantities (Zq) have been used, and s goes from311 to 362, while t goes from 1998 to 2009. Table 4 illustrates the heterogene-ity across sectors in consumption goods. The index values in the starting andfinal year show sectors like Tabacco, Apparel and Footwear where there areonly consumption goods, while sectors such as Wood& Cork or Glass show notariff lines identifying goods for final consumption, Z is zero.
In Eq.1 the Zst term interacted with our variable of interest will identifya differential effect of total arrivals linked to the time-varing inter-industryheterogeneity in consumption goods intensity. Such differential effect is theway I identify the causality from arrivals flow from country j to country i tothe corresponding exports from i to j.
4. The data
Trade data is based on BACI (for Base pour l’Analyse du Commerce Interna-tional), which is built using COMTRADE, from the United Nations StatisticalDepartment, as a primary source. The advantage of BACI is the use of mir-
9
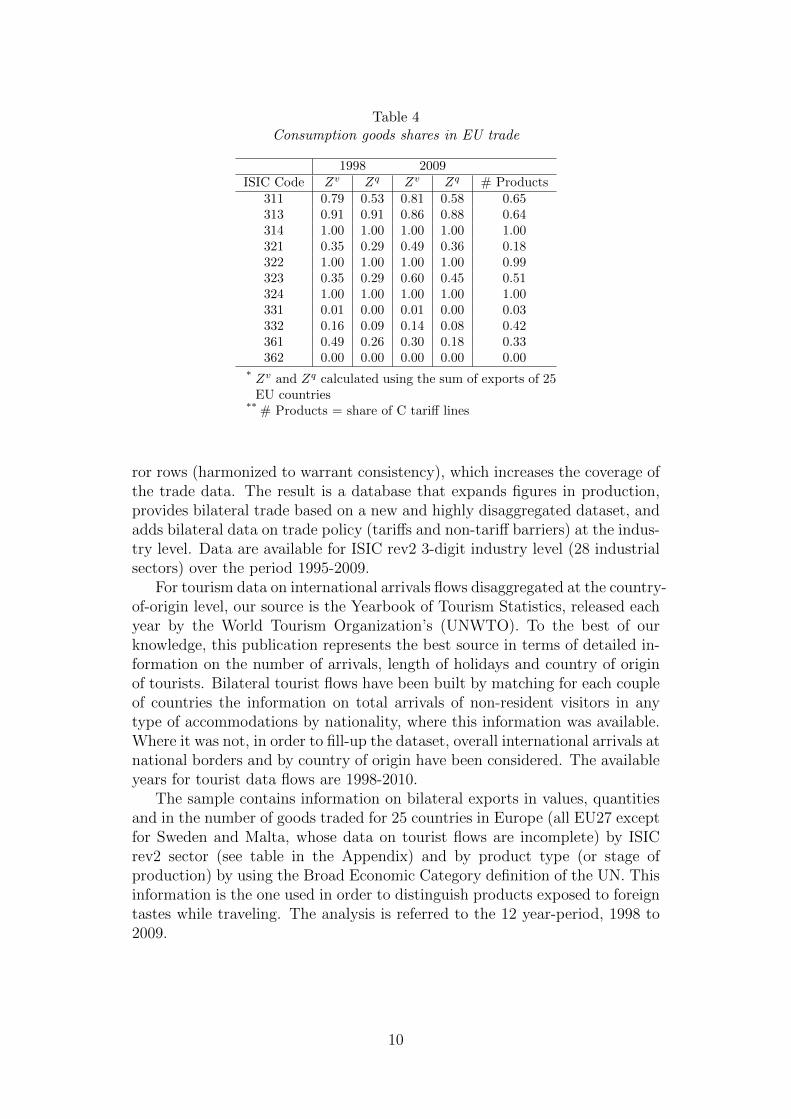
Table 4Consumption goods shares in EU trade
1998 2009ISIC Code Zv Zq Zv Zq # Products
311 0.79 0.53 0.81 0.58 0.65313 0.91 0.91 0.86 0.88 0.64314 1.00 1.00 1.00 1.00 1.00321 0.35 0.29 0.49 0.36 0.18322 1.00 1.00 1.00 1.00 0.99323 0.35 0.29 0.60 0.45 0.51324 1.00 1.00 1.00 1.00 1.00331 0.01 0.00 0.01 0.00 0.03332 0.16 0.09 0.14 0.08 0.42361 0.49 0.26 0.30 0.18 0.33362 0.00 0.00 0.00 0.00 0.00
* Zv and Zq calculated using the sum of exports of 25EU countries
** # Products = share of C tariff lines
ror rows (harmonized to warrant consistency), which increases the coverage ofthe trade data. The result is a database that expands figures in production,provides bilateral trade based on a new and highly disaggregated dataset, andadds bilateral data on trade policy (tariffs and non-tariff barriers) at the indus-try level. Data are available for ISIC rev2 3-digit industry level (28 industrialsectors) over the period 1995-2009.
For tourism data on international arrivals flows disaggregated at the country-of-origin level, our source is the Yearbook of Tourism Statistics, released eachyear by the World Tourism Organization’s (UNWTO). To the best of ourknowledge, this publication represents the best source in terms of detailed in-formation on the number of arrivals, length of holidays and country of originof tourists. Bilateral tourist flows have been built by matching for each coupleof countries the information on total arrivals of non-resident visitors in anytype of accommodations by nationality, where this information was available.Where it was not, in order to fill-up the dataset, overall international arrivals atnational borders and by country of origin have been considered. The availableyears for tourist data flows are 1998-2010.
The sample contains information on bilateral exports in values, quantitiesand in the number of goods traded for 25 countries in Europe (all EU27 exceptfor Sweden and Malta, whose data on tourist flows are incomplete) by ISICrev2 sector (see table in the Appendix) and by product type (or stage ofproduction) by using the Broad Economic Category definition of the UN. Thisinformation is the one used in order to distinguish products exposed to foreigntastes while traveling. The analysis is referred to the 12 year-period, 1998 to2009.
10

Table 5Arrivals and Exports - Difference in Difference Results
(1) (2) (3) (4) (5) (6)VARIABLES Log of Exports in value
ALL ALL ALL ALL EU15 Other
Zv x Log(Arr) 0.04*** 0.05*** 0.07*** 0.02***(0.002) (0.003) (0.003) (0.002)
Zq x Log(Arr) 0.03*** 0.03***(0.002) (0.003)
Constant 7.77*** 7.89*** 7.78*** 7.89*** 9.18*** 7.10***(0.011) (0.01) (0.011) (0.01) (0.02) (0.01)
Observations 51,676 51,676 51,676 51,676 17,029 34,647R2 between 0.43 0.45 0.35 0.40 0.35 0.19Number of FE 3,183 3,183Number of FE 5,108 5,108 1,573 3,535(1) (2) symmetric time varying country-pair FE (n(n− 1)t)(3) (4) (5) (6) asymmetric time varying country-pair FE (2n(n− 1)t)Robust standard errors in parentheses*** p<0.01, ** p<0.05, * p<0.1
5. Arrivals and Exports
5.1. Results from the Basic Regression
The results for the empirical model eq.1 are reported in Table 5. All four spec-ifications are estimated by an time-varying-FE model: controls in (1) and (2)are for the country-pair ij (CP) in the different t periods, and are symmetric,i.e. the imposed restriction is that the heterogeneity of the pair is identicalfor both exports from i to j and reverse. In (3) and (4) controls have beenconstructed in order to relax this restriction and to allow for a different impactfor the same couple depending on which is the exporting country between iand j. The causal link from arrivals to trade is identified by the interaction ofour variable of interest (total arrivals from j to i) with Zv or Zq, our proxy forisolating those products whose quality can be ascertained after sampling andthat varies across industries in time.
Coefficients are significantly different from zero in all equations and suggesta total effect of 5% when arrivals are doubled in those sectors which produceonly final consumption goods (Zv = 1, Zq = 1). This is true for Tobacco,Apparel and Footwear. Results from the quantity-based index suggests a sig-nificant but smaller effect: exports are stimulated by 3% when arrivals doublein the same sectors. The effect will be smaller in sectors with a smaller Zv
or Zq, such as Textiles, Leather, Furniture, Manufacture of china and glass.In this last sector the effect is null since it is impossible for the channel oftransmission (from experience to buy) to work.
I also split the sample in order to isolate the EU15 members (in eq. 5)
11
from all other trade flows (6). Results point for a bigger effect for the firstgroup of countries. Exports for the ’Old Europe’ increase of 7% with one unitincrease in arrivals. This is the maximum effect: it is recorded in those sectorswhere only consumption goods are produced. Sectors at the median of thedistribution will have an effect reduced to half, which is quite important interms of magnitude Flows which interest countries not in the monetary unionare still fostered by arrivals at 2% (in those sectors where Zv = 1).
6. Robustness Analysis
6.1. Arrivals in a standard Gravity specification
A first robustness control is to evaluate our measure in a gravity equation,where controls for the economic size of both trading partners are introduced.7
Gravity equations are highly suited for valuating the impact of trade costs.These are related to many aspects which impede international exchanges, andtherefore are proxied by different measures. Geography clearly contributes tothe cost of moving goods across economies and variables such as distance andadjacency refer to both the mutual or individual position of an economy inthe space (landlocked countries or islands are normally considered different).Costly aspects of trade are proxied also by cultural and institutional variables.Other controls often used include dummy variables indicating if both partnerand reporting countries are members of any free trade agreement (such as EU,CEFTA, and FTA).
In order to control for institutional changes at the European level, influ-encing both people and goods’ flows, I augment the standard gravity equationincluding standard gravity variables (see Anderson and van Wincoop (2003),Rose and van Wincoop (2001)) with dummies controlling for the entrance ofaccession countries to the EU, for the signing of the Schenghen Treaty and forthe introduction of the common currency (Euro). I estimated an FE specifica-tion with asymmetric country-pairs controls, which implies that the restrictionof a symmetric multilateral resistance is not imposed.
Results in Table 6 confirm size and significance of coefficients already dis-cussed in Table 5. Results on institutional variables indicate that entranceto the EU is the important regulative measure in stimulating trade inside theunion.
7Although gravity model has been long criticized for lacking theoretical foundations, itgained firm microfoundations long ago (Anderson (1979)). Further supporting theoreticalrefinements have been developed since then (Bergstrand (1985), Bergstrand (1989), Dear-dorff (1995), Eaton and Kortum (2001)). The success of the gravity equation stems fromthe ability to explain some simple trade patterns, namely: a) bilateral trade rises with thesize of either trading partner; b) countries further apart trade less; c) borders appear toimpede trade a lot.
12
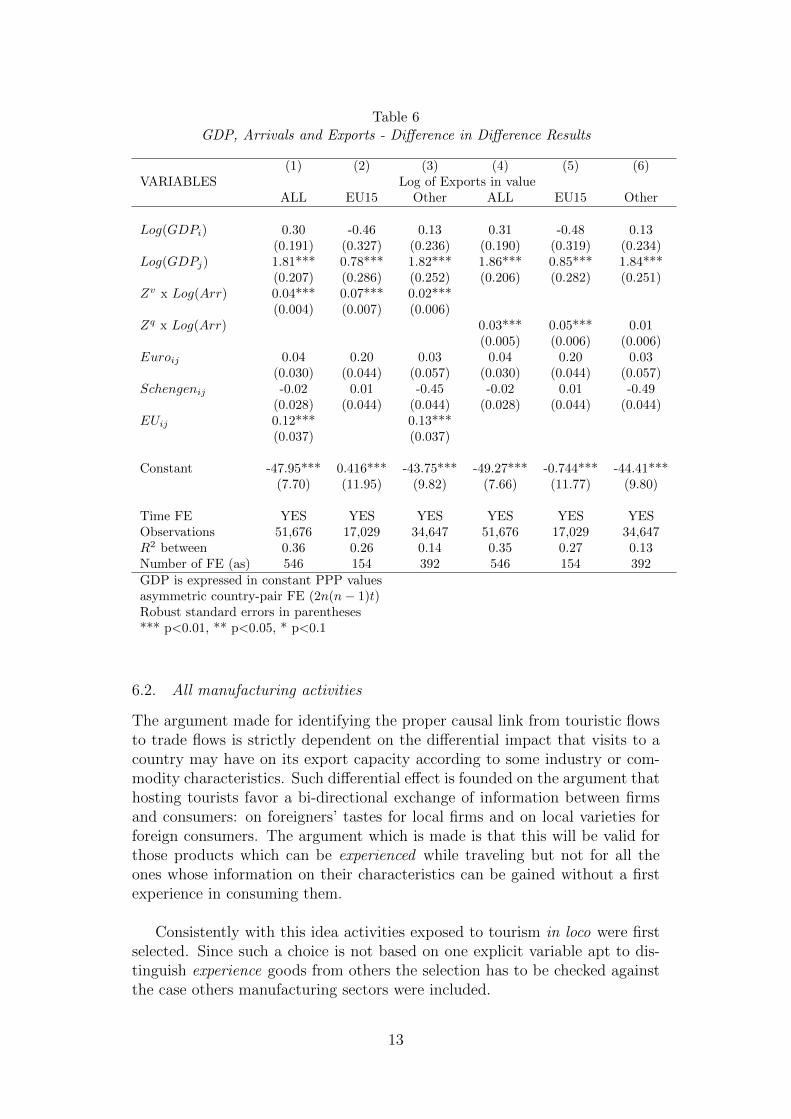
Table 6GDP, Arrivals and Exports - Difference in Difference Results
(1) (2) (3) (4) (5) (6)VARIABLES Log of Exports in value
ALL EU15 Other ALL EU15 Other
Log(GDPi) 0.30 -0.46 0.13 0.31 -0.48 0.13(0.191) (0.327) (0.236) (0.190) (0.319) (0.234)
Log(GDPj) 1.81*** 0.78*** 1.82*** 1.86*** 0.85*** 1.84***(0.207) (0.286) (0.252) (0.206) (0.282) (0.251)
Zv x Log(Arr) 0.04*** 0.07*** 0.02***(0.004) (0.007) (0.006)
Zq x Log(Arr) 0.03*** 0.05*** 0.01(0.005) (0.006) (0.006)
Euroij 0.04 0.20 0.03 0.04 0.20 0.03(0.030) (0.044) (0.057) (0.030) (0.044) (0.057)
Schengenij -0.02 0.01 -0.45 -0.02 0.01 -0.49(0.028) (0.044) (0.044) (0.028) (0.044) (0.044)
EUij 0.12*** 0.13***(0.037) (0.037)
Constant -47.95*** 0.416*** -43.75*** -49.27*** -0.744*** -44.41***(7.70) (11.95) (9.82) (7.66) (11.77) (9.80)
Time FE YES YES YES YES YES YESObservations 51,676 17,029 34,647 51,676 17,029 34,647R2 between 0.36 0.26 0.14 0.35 0.27 0.13Number of FE (as) 546 154 392 546 154 392GDP is expressed in constant PPP valuesasymmetric country-pair FE (2n(n− 1)t)Robust standard errors in parentheses*** p<0.01, ** p<0.05, * p<0.1
6.2. All manufacturing activities
The argument made for identifying the proper causal link from touristic flowsto trade flows is strictly dependent on the differential impact that visits to acountry may have on its export capacity according to some industry or com-modity characteristics. Such differential effect is founded on the argument thathosting tourists favor a bi-directional exchange of information between firmsand consumers: on foreigners’ tastes for local firms and on local varieties forforeign consumers. The argument which is made is that this will be valid forthose products which can be experienced while traveling but not for all theones whose information on their characteristics can be gained without a firstexperience in consuming them.
Consistently with this idea activities exposed to tourism in loco were firstselected. Since such a choice is not based on one explicit variable apt to dis-tinguish experience goods from others the selection has to be checked againstthe case others manufacturing sectors were included.
13
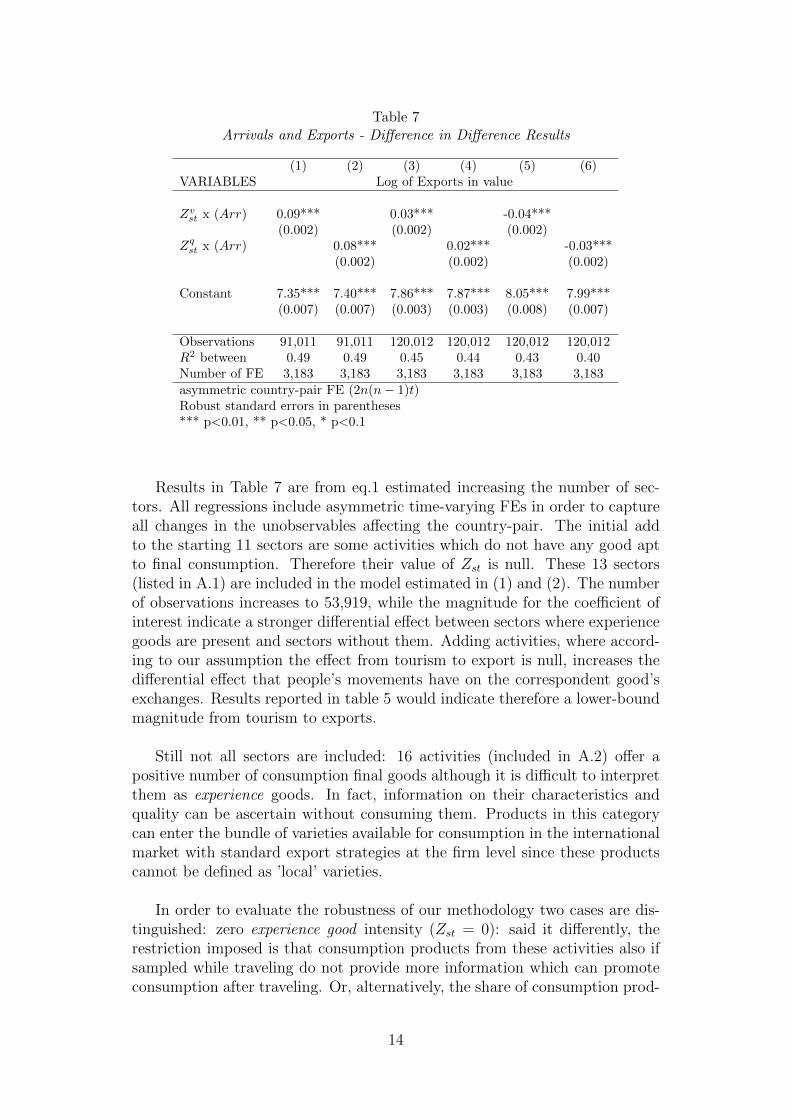
Table 7Arrivals and Exports - Difference in Difference Results
(1) (2) (3) (4) (5) (6)VARIABLES Log of Exports in value
Zvst x (Arr) 0.09*** 0.03*** -0.04***
(0.002) (0.002) (0.002)Zqst x (Arr) 0.08*** 0.02*** -0.03***
(0.002) (0.002) (0.002)
Constant 7.35*** 7.40*** 7.86*** 7.87*** 8.05*** 7.99***(0.007) (0.007) (0.003) (0.003) (0.008) (0.007)
Observations 91,011 91,011 120,012 120,012 120,012 120,012R2 between 0.49 0.49 0.45 0.44 0.43 0.40Number of FE 3,183 3,183 3,183 3,183 3,183 3,183asymmetric country-pair FE (2n(n− 1)t)Robust standard errors in parentheses*** p<0.01, ** p<0.05, * p<0.1
Results in Table 7 are from eq.1 estimated increasing the number of sec-tors. All regressions include asymmetric time-varying FEs in order to captureall changes in the unobservables affecting the country-pair. The initial addto the starting 11 sectors are some activities which do not have any good aptto final consumption. Therefore their value of Zst is null. These 13 sectors(listed in A.1) are included in the model estimated in (1) and (2). The numberof observations increases to 53,919, while the magnitude for the coefficient ofinterest indicate a stronger differential effect between sectors where experiencegoods are present and sectors without them. Adding activities, where accord-ing to our assumption the effect from tourism to export is null, increases thedifferential effect that people’s movements have on the correspondent good’sexchanges. Results reported in table 5 would indicate therefore a lower-boundmagnitude from tourism to exports.
Still not all sectors are included: 16 activities (included in A.2) offer apositive number of consumption final goods although it is difficult to interpretthem as experience goods. In fact, information on their characteristics andquality can be ascertain without consuming them. Products in this categorycan enter the bundle of varieties available for consumption in the internationalmarket with standard export strategies at the firm level since these productscannot be defined as ’local’ varieties.
In order to evaluate the robustness of our methodology two cases are dis-tinguished: zero experience good intensity (Zst = 0): said it differently, therestriction imposed is that consumption products from these activities also ifsampled while traveling do not provide more information which can promoteconsumption after traveling. Or, alternatively, the share of consumption prod-
14
ucts (either in value or in quantity) help to identify products whose exportscan be triggered by arrivals to a country also for these activities.
Results in (3) and (4) include those sectors by imputing a null value for Zst.In this case the values for the Zv or Zq indicate a smaller differential effectsfor our 11 sectors of interest but still of the expected sign and still significantat the 1%. In (5) and (6) the value of our indicator Zst is instead greaterthan 0 both in our 10 sectors (except sector 362) and in the 16 activities lastadded. The sign of our coefficients of interest turns now negative, indicating anegative differential impact with sectors which do not produce goods apt forfinal consumption.In our interpretation, the result is indicating that the chosen identificationstrategy is not working any more. The reason is that, for these industries, theshare of consumption goods for activities listed in A.2 cannot be used as ameasure of experience-goods intensity of their total production, and thereforecannot be interpreted in the same way as in our initial sectors. It is nota measure of exposure to foreign demand by tourist. While giving a 0 tothe industry experience-goods index of such activities, consistently with thedefinition used in the paper, does not alter our results, in the latter case theindicator is not able to identify, any more, those activities where people’snew arrivals may favor firms’s capability to get their product known in theinternational market.
7. Conclusions
The paper proposes a novel method to identify a causal link from travels toexports. In theory foreign arrivals to a country can be thought as a way thatlocal firms have to gain information on foreign costumers’ tastes. On the otherhand, during a travel consumers have the possibility to add local varieties totheir consumption bundle. Both factors will potentially increase countries’ ex-changes which take place once traveling. The hypothesis here tested is thatvisits a country receives can after foster its exports differently for those goodswhich are sampled during the travel.
Rajan and Zingales (1998) methodology is applied in order to identify thoseproducts which are more likely to be sampled (experienced) in their origincountry by foreign visitors. Firstly, an index to proxy the experienced -goodintensity for 11 manufacturing industries, whose products can be labeled ’lo-cal’ varieties, is constructed. It is assumed such characteristic to be crucialfor having a product sampled by foreign visitors. Then, information on com-modities which belong to the same sector but which are not final consumptiongoods (they are either capital, primary or intermediate products) is used todefine a control group.
The identifying strategy enables to robustly assess the influence of total ar-
15

rivals in a country on its exports. Our data on 25 European countries indicatethat tourism promotes exports, with a differential sectoral effect ranging from5% (for sectors where only consumption goods are produced) to 2.5% calcu-lated at the mean of the industry distribution when all countries are included.The number rises to 3.5% for exports of the ’Old Europe’. It is lower, but stillsignificant, for the new countries.
16
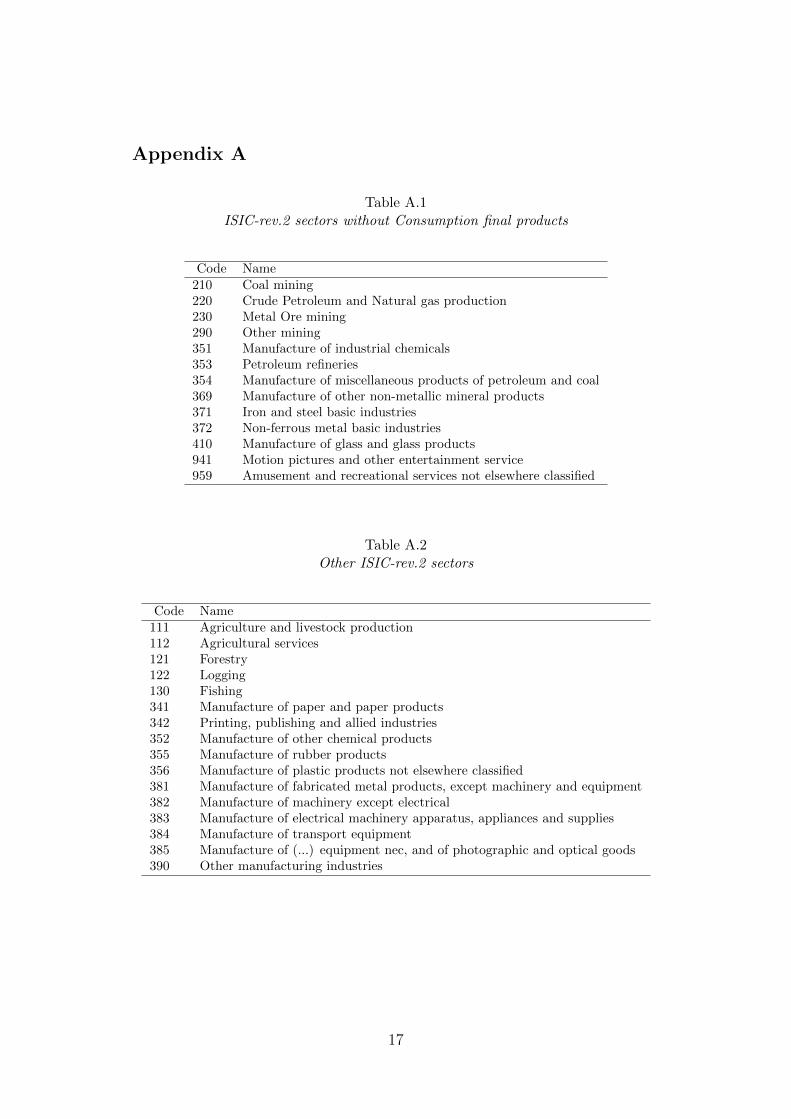
Appendix A
Table A.1ISIC-rev.2 sectors without Consumption final products
Code Name210 Coal mining220 Crude Petroleum and Natural gas production230 Metal Ore mining290 Other mining351 Manufacture of industrial chemicals353 Petroleum refineries354 Manufacture of miscellaneous products of petroleum and coal369 Manufacture of other non-metallic mineral products371 Iron and steel basic industries372 Non-ferrous metal basic industries410 Manufacture of glass and glass products941 Motion pictures and other entertainment service959 Amusement and recreational services not elsewhere classified
Table A.2Other ISIC-rev.2 sectors
Code Name111 Agriculture and livestock production112 Agricultural services121 Forestry122 Logging130 Fishing341 Manufacture of paper and paper products342 Printing, publishing and allied industries352 Manufacture of other chemical products355 Manufacture of rubber products356 Manufacture of plastic products not elsewhere classified381 Manufacture of fabricated metal products, except machinery and equipment382 Manufacture of machinery except electrical383 Manufacture of electrical machinery apparatus, appliances and supplies384 Manufacture of transport equipment385 Manufacture of (...) equipment nec, and of photographic and optical goods390 Other manufacturing industries
17
References
Anderson, J. E. (1979). ‘A theoretical foundation for the gravity equation’.American Economic Review, vol. 69(1), pp. 106–16.
Anderson, J. E. and van Wincoop, E. (2003). ‘Gravity with gravitas: A solutionto the border puzzle’. American Economic Review, vol. 93(1), pp. 170–192.
Balaguer, J. and Cantavella-Jorda, M. (2002). ‘Tourism as a long-run economicgrowth factor: The spanish case’. Applied Economics, vol. 34(7), pp. 877–84.
Bergstrand, J. H. (1985). ‘The gravity equation in international trade: Somemicroeconomic foundations and empirical evidence’. The Review of Eco-nomics and Statistics, vol. 67(3), pp. 474–81.
Bergstrand, J. H. (1989). ‘The generalized gravity equation, monopolisticcompetition, and the factor-proportions theory in international trade’. TheReview of Economics and Statistics, vol. 71(1), pp. 143–53.
Deardorff, A. V. (1995). ‘Determinants of bilateral trade: Does gravity workin a neoclassical world?’. NBER Working Papers 5377, National Bureau ofEconomic Research, Inc.
Dritsakis, N. (2004). ‘Tourism as a long-run economic growth factor: An em-pirical investigation for greece using causality analysis’. Tourism Economics,vol. 10, pp. 305–316.
Durberry, R. (2004). ‘Tourism and economic growth: The case of mauritius’.Tourism Economics, vol. 10, pp. 389–401.
Eaton, J. and Kortum, S. (2001). ‘Technology, trade, and growth: A unifiedframework’. European Economic Review, vol. 45(4-6), pp. 742–755.
Fischer, C. and Luis, G.-A. (2009). ‘The nature of the relationship betweeninternational tourism and international trade: the case of german importsof spanish wine’. Applied Economics, vol. 41, pp. 1345–1359.
Laband, D. N. (1991). ‘An objective measure of search versus experiencegoods’. Economic Inquiry, vol. 29(3), pp. 497–509.
Nelson, P. (1974). ‘Advertising as information’. Journal of Political Economy,vol. 82(4), pp. 729–54.
Oh, C. (2005). ‘The contribution of tourism development to economic growthin the korean economy’. Tourism Management, vol. 26, pp. 39–44.
Porter, M. L. (1976). Interbrand Choice, Strategy and Bilateral Market Power.Cambridge MA, Harvard University Press.
Quinn, M. (2009). ‘Movies and the mystery of the missing trade: Is hollywoodgood for u.s. exporters?’. The International Trade Journal, vol. 23, pp. 231–254.
Rajan, R. G. and Zingales, L. (1998). ‘Financial dependence and growth’.American Economic Review, vol. 88(3), pp. 559–86.
Rose, A. K. and van Wincoop, E. (2001). ‘National money as a barrier tointernational trade: The real case for currency union’. American EconomicReview, vol. 91(2), pp. 386–390.
18
Ultimi Contributi di Ricerca CRENoS I Paper sono disponibili in: Uhttp://www.crenos.itU
12/17 Edoardo Ot ran to , “Spi l lover Effects in the Vola t i l i ty of F inanc ia l Markets”
12/16 Manue la De idda , Adr iana Di Lib e r t o , Mar ta Fodd i , Giovann i Su l i s , “Employment Subs id ies , Informal Economy and Women’s Trans i t ion into Work in a Depressed Area : Evidence f rom a Matching Approach”
12/15 A. Debón , S . Habe rman , F . Mont e s , Edoardo Ot ran t o , “Model ef fect on pro jected morta l i ty ind icators”
12/14 Ahmed A.A. Kha l i f a , Shawkat Hammoudeh , Edoardo Ot ran to , San jay Ramchande r , “Volat i l i ty Transmiss ion across Currency , Commodity and Equi ty Markets under Mul t i -Cha in Reg ime Switch ing : Impl ica t ions for Hedging and Portfo l io Al locat ion”
12/13 Raf fa e l e Pa c i , Emanue la Marro cu , “Knowledge assets and reg iona l performance”
12/12 Luc iano Mauro , Ce sa r e Bu ia t t i , Gae tano Carme c i , “The Orig ins of the Sovere ign Debt of I ta ly : a Common Pool Issue?”
12/11 Robe r t o Bas i l e , S t e f ano Usa i , “Analys i s of reg iona l endogenous growth”
12/10 Emanue la Marro cu , Ra f f e l e Pa c i , “Different tour i s ts to d i f ferent dest inat ions . Evidence f rom spat ia l in teract ion models”
12/09 Ahmed A.A. Kha l i f a , Shawkat Hammoudeh , Edoardo Ot ran to , “Vola t i l i ty Sp i l lover , Interdependence , Comovements across GCC, Oi l and U.S . Markets and Port fo l io Management Stra teg ies in a Reg ime-Changing Environment”
12/08 Mario Mac i s , Fab iano S ch i va rd i , “Exports and Wages : Rent Shar ing , Workforce Composi t ion or Returns to Sk i l l s ?”
12/07 Anna Bus su , C laud i o De to t t o , Val e r i o S t e rz i , “Socia l conformity and su ic ide”
12/06 Luca G. De idda , Dimi t r i Pao l in i , “Educat ion race , supply of sk i l l s and the wage sk i l l premium”
12/05 Giampi e r o M. Ga l l o , Edoardo Ot ran to , “The Markov Switch ing Asymmetr ic Mul t ip l ica t ive Error Model”
12/04 Oliv i e r o Carbon i , “A Spat ia l Ana lys i s of R&D: the Role of Industry Prox imity”
12/03 Juan Gabr i e l Br ida , Ni co là s Garr ido , Fran c e s c o Mureddu , “Club performance dynamics a t I ta l i an reg iona l leve l”
12/02 Emanue la Marro cu , Ra f fa e l e Pa c i , “Regiona l Deve lopment and Creat iv i ty”
12/01 Bianca B iag i , Mar ia Giovanna Brandano , C laud i o De to t t o , “The effect of tour ism on cr ime in I ta ly : a dynamic pane l approach”
11/23 Rina ldo Brau , Anna Mar ia P inna , Movements of People for Movements of Goods?”
11/22 Giorg i o Garau , Giovann i Mandra s , Luc ia S ch i r ru , “A Sta t i s t ica l Informat ion System support ing Environmenta l Pol ic ies”
11/21 Emanue la Marro cu , Ra f fa e l e Pa c i , S t e f ano Usa i , “The complementary ef fects of prox imity d imens ions on knowledge sp i l lovers”

Finito di stampare nel mese di Dicembre 2012 Presso Copy…Right! studio grafico & stampa digitale Via Turritana 3/B – Tel. 079.200395 – Fax 079.4360444
07100 Sassari

www.crenos.it