Embed Size (px)
Citation preview
1
May 17, 2016
Prepared for the: Fish and Wildlife Compensation Program Prepared by: Robyn Irvine, Ph.D., R.P. Bio. Poisson Consulting Ltd. 4216 Shasheen Road Nelson, British Columbia, V1L 6X1
Gerry Nellestijn The Confluence Approach Box 718, Salmo, BC V0G 1Z0
Prepared with financial support of the Fish and Wildlife Compensation Program on behalf of its program partners BC Hydro, the Province of BC, Fisheries and Oceans Canada, First Nations and public stakeholders.
QUA AND CURTIS CREEKS CRYSTAL GREEN NUTRIENT RESTORATION PREPARATION PROJECT F-‐F16-‐15
FINAL REPORT

Qua and Curtis Creeks Crystal Green Nutrient Restoration Preparation Project
i
Executive Summary
During the 2015 growing season, Curtis and Qua Creeks in the Salmo River watershed were sampled for water chemistry to assess trophic status, periphyton growth to assess primary productivity, invertebrate diversity to assess secondary productivity and fish abundance and condition. The motivation for this assessment of the overall productivity of these two creeks was to determine if either creek was suitable for nutrient restoration with the addition of Crystal Green pelletized fertilizer in future years to augment juvenile Bull and Rainbow Trout as a restoration action within the priority Salmo watershed. The set-‐up of the study would allow the usage of a Before-‐After-‐Control-‐Impact-‐Paired experimental and analytic design going forward.
Key results and observations from the first year of the study included the fact that there was suitable juvenile rearing habitat in each stream in a relatively dry year (2015) so it is likely there will be habitat present in most average flow years. Also of significance as a result was that the main chemistry, primary productivity, secondary productivity and fish metrics were quite similar between the two selected creeks meaning that they would be suitable replicates for a Before-‐After-‐Control-‐Impact analysis as was proposed.
TN:TP ratios ranged from a low of 12.9 to a high of 53 in Curtis Creek and between 15.2 and 31.5 in Qua Creek over the two sampling periods in July and September. Peak chlorophyll a densities were assessed as an index of primary productivity and in Curtis Creek peaked at 15.6 ug on a 25mm sample of the growth substrate and in Qua Creek peaked at 15.4ug. Benthic macroinvertebrates from both creeks were largely early instar and very small in size. This disallowed the use of weight to estimate overall invertebrate biomass since they could not be successfully separated from the fine detritus also sampled in the kick net sampling. Invertebrate diversity as measured by the Shannon diversity indices ranged between 1.5 – 2.2 in both creeks. The fish sampling sites assessed garnered only juvenile Rainbow Trout this year. Their condition was similar between creeks and lineal density was slightly higher in Qua Creek and there was a broader range of fish sizes sampled in Qua Creek as well with both larger and smaller fish captured there than in Curtis. Temperatures in both creeks were appropriate for Bull Trout rearing with temperatures less than cutoffs for Bull Trout presence found in other systems and were also appropriate for Rainbow Trout rearing. Depending upon the temperature variability from year to year, some of the habitat within the two creeks may be preferential to Rainbow Trout success.
The access to mid-‐ and upper-‐Qua creek in particular was by hiking or helicopter only and the access road to upper Curtis creek was decommissioned with large boulder placements by forestry late in the 2015 field season so is now only accessible by foot or mountain or trail bike.
The two creeks are suitable for a fertilization amendment after further baseline data are collected should a compensation option in the watershed be desired. Since Rainbow Trout are currently the only known salmonid rearing in the streams, it is recommended that a survey of literature on Rainbow Trout fertilization projects be completed as well as looking into options for translocating adult Bull Trout into the Salmo to bolster the very low numbers of Bull Trout

Qua and Curtis Creeks Crystal Green Nutrient Restoration Preparation Project
ii
spawning in the Salmo watershed and potentially to eventually seed these creeks with juvenile Bull Trout through increasing spawner density and utilization.
Qua and Curtis Creeks Crystal Green Nutrient Restoration Preparation Project
iii
Table of Contents
EXECUTIVE SUMMARY .......................................................................................................................... I
LIST OF TABLES .................................................................................................................................... IV
LIST OF APPENDICES ........................................................................................................................... IV
INTRODUCTION ................................................................................................................................... 5
GOALS AND OBJECTIVES ...................................................................................................................... 6
STUDY AREA ........................................................................................................................................ 7
METHODS .......................................................................................................................................... 11 WATER CHEMISTRY .................................................................................................................................... 11 PERIPHYTON GROWTH ................................................................................................................................ 11 INVERTEBRATE DIVERSITY AND BIOMASS ........................................................................................................ 11 FISH ABUNDANCE AND CONDITION ............................................................................................................... 12 WATER TEMPERATURE ............................................................................................................................... 12 HABITAT SURVEYS ...................................................................................................................................... 13 ANALYSIS .................................................................................................................................................. 13
RESULTS ............................................................................................................................................. 13 WATER CHEMISTRY .................................................................................................................................... 13 PERIPHYTON GROWTH ................................................................................................................................ 17 INVERTEBRATE DIVERSITY AND BIOMASS ........................................................................................................ 18 FISH ABUNDANCE AND CONDITION ............................................................................................................... 19 WATER TEMPERATURE ............................................................................................................................... 21 HABITAT SURVEYS ...................................................................................................................................... 22
DISCUSSION ....................................................................................................................................... 27
RECOMMENDATIONS ......................................................................................................................... 28
CLOSURE ............................................................................................................................................ 30
REFERENCES ....................................................................................................................................... 31
LIST OF FIGURES FIGURE 1 OVERVIEW MAP SHOWING THE LOCATIONS OF CURTIS AND QUA CREEKS IN THE CONTEXT OF THE SALMO AND PEND
D’OREILLE RIVER WATERSHEDS. .................................................................................................................................. 8 FIGURE 2 SAMPLING SITES FOR WATER TEMPERATURE, PERIPHYTON, FISH AND INVERTEBRATES FROM CURTIS CREEK. ..................... 9 FIGURE 3 SAMPLING SITES FOR WATER TEMPERATURE, PERIPHYTON, FISH AND INVERTEBRATES FROM QUA CREEK. ....................... 10 FIGURE 4 TOTAL NITROGEN AND PHOSPHORUS (AS P) CONCENTRATIONS BY CREEK, MONTH AND LOCATION. .............................. 14 FIGURE 5 MICROGRAMS OF CHLOROPHYLL-‐A THROUGH TIME FOR TWO, SIX-‐WEEK GROWTH PERIODS IN CURTIS AND QUA CREEKS,
2015. 18 FIGURE 6 NUMBER OF EPHEMEROPTERA, PLECOPTERA AND TRICHOPTERA (EPT) FROM THREE-‐MINUTE STANDARD KICK SAMPLE BY
CREEK AND LOCATION. ............................................................................................................................................ 19 FIGURE 7 SHANNON DIVERSITY INDEX FOR INVERTEBRATES BY CREEK AND SAMPLING SITE. ....................................................... 19

Qua and Curtis Creeks Crystal Green Nutrient Restoration Preparation Project
iv
FIGURE 8 LENGTH FREQUENCY FOR ELECTROFISHED RAINBOW TROUT BY CREEK AND ELECTROFISHING SITE. ................................ 20 FIGURE 9 BODY MASS BY FORK LENGTH FOR ELECTROFISHED RAINBOW TROUT BY CREEK AND SAMPLING SITE. ............................. 20 FIGURE 10 LINEAL DENSITY OF RAINBOW TROUT (ALL AGES POOLED) WITH A FORK LENGTH GREATER THAN 50 MM BY CREEK AND
LOCATION. ERROR BARS REPRESENT 95% CREDIBLE INTERVALS. ....................................................................................... 21 FIGURE 11 CAPTURE EFFICIENCY OF RAINBOW TROUT WITH A FORK LENGTH GREATER THAN 50 MM BY CREEK. ........................... 21 FIGURE 12 WATER TEMPERATURE FOR UPPER AND LOWER STATIONS ON CURTIS AND QUA CREEKS. THE BLUE HORIZONTAL LINES
MARK 9°C AND 12°C. ............................................................................................................................................ 22 FIGURE 13 HABITAT REACH BREAKS AND PROBABLE BULL TROUT PASSAGE BARRIER FOR CURTIS CREEK. ..................................... 24 FIGURE 14 HABITAT BREAKS AND PROBABLE BULL TROUT PASSAGE BARRIER FOR QUA CREEK. .................................................. 26
List of Tables TABLE 1 WATER CHEMISTRY RESULTS FOR NUTRIENT ANALYSES INCLUDING PH, CONDUCTIVITY, ALKALINITY AND NITROGEN AND
PHOSPHORUS FOR CURTIS AND QUA CREEKS FOR JULY (MONTH=7)AND SEPTEMBER (MONTH=9), 2015. .............................. 15 TABLE 2 WATER CHEMISTRY RESULTS FOR RECOVERABLE METALS FOR CURTIS AND QUA CREEKS FOR JULY (MONTH=7) AND
SEPTEMBER (MONTH=9), 2015. ALL BOLDED ITEMS ARE HIGHER THAN DETECTION LIMITS FOR THAT SPECIES. ......................... 16 TABLE 3 SAMPLING DATES FOR PERIPHYTON GROWTH STUDY BY SERIES AND CREEK. THE LAST SAMPLING DATE FOR SERIES ONE WAS
THE FIRST DAY (OR ZERO VALUE) FOR SERIES TWO. ........................................................................................................ 17 TABLE 4 NATURAL HABITAT BREAKS USED TO DETERMINE BROAD HABITAT CLASSIFICATION OF CURTIS CREEK. ............................. 23 TABLE 5 AVERAGE PERCENT HABITAT TYPE FOR EACH HABITAT UNIT OF CURTIS CREEK. ............................................................ 23 TABLE 6 AVERAGE PERCENT HABITAT TYPE FOR EACH HABITAT UNIT OF QUA CREEK. ............................................................... 25 TABLE 7 AVERAGE PERCENT HABITAT TYPE FOR EACH HABITAT UNIT OF QUA CREEK. ............................................................... 25
List of Appendices
Appendix A Photographic Plates
Qua and Curtis Creeks Crystal Green Nutrient Restoration Preparation Project
5
Introduction
The Salmo River is the only major tributary of the Pend d’Oreille watershed in Canada or the United States that supports a population of Bull Trout (Salvelinus confluentus). Bull Trout are blue-‐listed in the province of B.C. and within the Salmo are considered to have a C1 or high risk conservation status due to the severity, scope and immediacy of the threats and the low spawner numbers. Redd count numbers through time (1998-‐2009) ranged from 38-‐109 in the Salmo and spawner abundance is approaching less than 50 spawners (Hagen and Decker 2011). Since 2007 only two years have shown adult spawner escapement exceeding 100, there were 54 redds enumerated in 2010 and 53 in 2015 indicating a population of 108 and 106 respectively based on a multiplier of 2.0 (Hagen and Decker 2011). The decline of Bull Trout in this system has multiple causes, likely including entrainment losses through Seven Mile Dam, restricted migration relative to historical availability due to dams, the loss of anadromous salmonid populations and their attendant nutrient influxes into the watershed, the presence of invasive Brook Trout (Salvelinus fontinalis) populations in the Salmo mainstem, water temperature increases through time which are negatively correlated with Bull Trout abundance (Parkinson and Haas 1996), lack of a robust prey fish base, and habitat losses of riverine habitat at the watershed scale (Hagen 2008, Decker 2010, Hagen and Decker 2011). Rainbow Trout are also a focal species of interest to the compensation program that are present in the Salmo River watershed. When surveyed in 2004, less than 200 adults (fish >400mm) were enumerated in the mainstem of the Salmo River (Hagen and Baxter 2004) so this species is also of conservation concern and is considered a key indicator species for increasing Ecosystem Health in the Salmo watershed by the Watershed Planning Team (WPT). When the Salmo Watershed Streamkeepers Society (SWSS) and the Fish and Wildlife Compensation Program (FWCP) reconvened the WPT, a trans boundary (Canada/US) multi-‐stakeholder collaborative group of Stewardship interests, First Nations, industry, and government agencies from both nations worked to build an action-‐based plan. The plan re-‐evaluated restoration, research, monitoring and educational status of their watershed-‐based Fish Sustainability Plan, both Rainbow and Bull Trout were included as indicators to provide performance measures for improving ecosystem health. The Qua, Curtis Crystal Green Restoration Preparation Project (QCRP) was unanimously endorsed by the WPT. The QCRP was motivated by the need to explore and implement restoration options within the watershed to preserve and enhance the populations of Bull and Rainbow Trout. In order to do this, the two headwater creeks of focus within the Salmo watershed have begun to be assessed for their viability to support nutrient restoration projects. Qua and Curtis Creeks are headwater tributaries of the Clearwater and Sheep Creek respectively. The Clearwater and Sheep Creeks flow into the Salmo River. The creeks’ viability to support nutrient restoration was assessed by measuring: the trophic status of each creek with water chemistry, the primary productivity by assessing periphyton growth, the benthic macroinvertebrate diversity and the density and size of Rainbow Trout and Bull Trout.

Qua and Curtis Creeks Crystal Green Nutrient Restoration Preparation Project
6
In order to assess the effectiveness of any restoration, pre-‐restoration data are a critical part of the monitoring and evaluation process and are often neglected in the rush to ‘do good’ for the species of concern. This project is a proposed three-‐year endeavor that aims to scientifically assess the baseline productivity of the streams to allow assessment in future if restoration options are implemented in the creeks. Stream fertilization is one restoration and compensation option for ecosystems that have been impacted by hydro-‐electric development to partially address the loss of productivity from the deprivation of marine nutrients brought in by anadromous fish to the system. Findings thus far on the use of pelletized fertilizers have pointed to the efficacy and ease of application of Crystal Green pellets in flowing water systems to raise nitrogen and phosphorus levels sufficiently to have a biologically and statistically significant effect. They are particularly well suited to remote systems such as Curtis and Qua Creeks since they have a slow dissolution rate and can therefore be hiked in or helicopter or quad dropped only once or twice per season. We are proposing to fertilize one of the two study creeks with Crystal Green after adequate baseline data on water chemistry, productivity and fish densities are obtained. Qua Creek and Curtis Creek were selected for this study because they are ideally suited for a paired statistical design where one creek is restored with nutrient addition and the other is retained as a control. In the Salmo watershed, the nutrient addition project on Sheep Creek project has demonstrated to increase fish production, through both gains in size and in abundance depending upon species and life stage as well as increasing primary productivity up to four times greater than unfertilized levels and increasing density of benthic macroinvertebrates (Decker 2010). These effects were obtained with the addition of liquid fertilizer in the Sheep Creek BACI study, but have also resulted from the addition of Crystal Green pellet fertilizer (5-‐27-‐0 N-‐P-‐K) in Vancouver Island Streams (Pellett 2011).
Goals and Objectives
The overall objective of the Qua and Curtis Nutrient Restoration Preparation Project is to assess baseline productivity and to evaluate the streams as candidates for nutrient restoration using Crystal Green pellet solid fertilizer (produced using Ostara Technologies) for augmenting fry growth and abundance and productivity in the stream’s algal and invertebrate communities. This first year of the project was designed to obtain the necessary geographic and monitoring data on primary productivity and fish abundance and condition prior to potential fertilization. The study is designed as a Before-‐After-‐Control-‐Impact (BACI) study to allow the determination of any net effects of future restoration in a statistically robust way.
The objectives for this program are as follows:
1) Determine the access options for each creek taking into consideration the potential to bring in 10kg bags of pellet fertilizer in the future.
2) Set up three, long-‐term monitoring sites for algal productivity in each creek near the confluence, midway along the length of the accessible creek and near the upper end of the accessible creek.
3) Obtain baseline water chemistry and primary productivity data from each creek to compare to other creeks in which fertilization has been successful at augmenting fish
Qua and Curtis Creeks Crystal Green Nutrient Restoration Preparation Project
7
production and to provide a ‘before’ data series to allow statistical comparison if fertilization occurs.
4) Obtain invertebrate community diversity (to the family level) and biomass estimates for each creek.
5) Determine that Bull Trout spawn and rear in Curtis and Qua Creeks through backpack electrofishing sampling of the creeks. Gather relative abundance and condition data on fish captured through backpack electrofishing methods at four sites within each creek
6) Provide a basic habitat overview of the two creeks within the surveyed section to estimate spawning and rearing potential.
7) Install water temperature loggers near the confluence of each creek and in the most upstream accessible site to track the physical habitat suitability for Bull Trout in each tributary.
Study Area
The Salmo River is a 5th order system rising from the Selkirk Mountains 12 km southeast of Nelson, BC. (Figure 1). The river progresses in a southerly direction for approximately 60 km from its origin to the confluence with the Pend d’Oreille River (Seven Mile Reservoir) and the area of its catchment is 123,000ha.
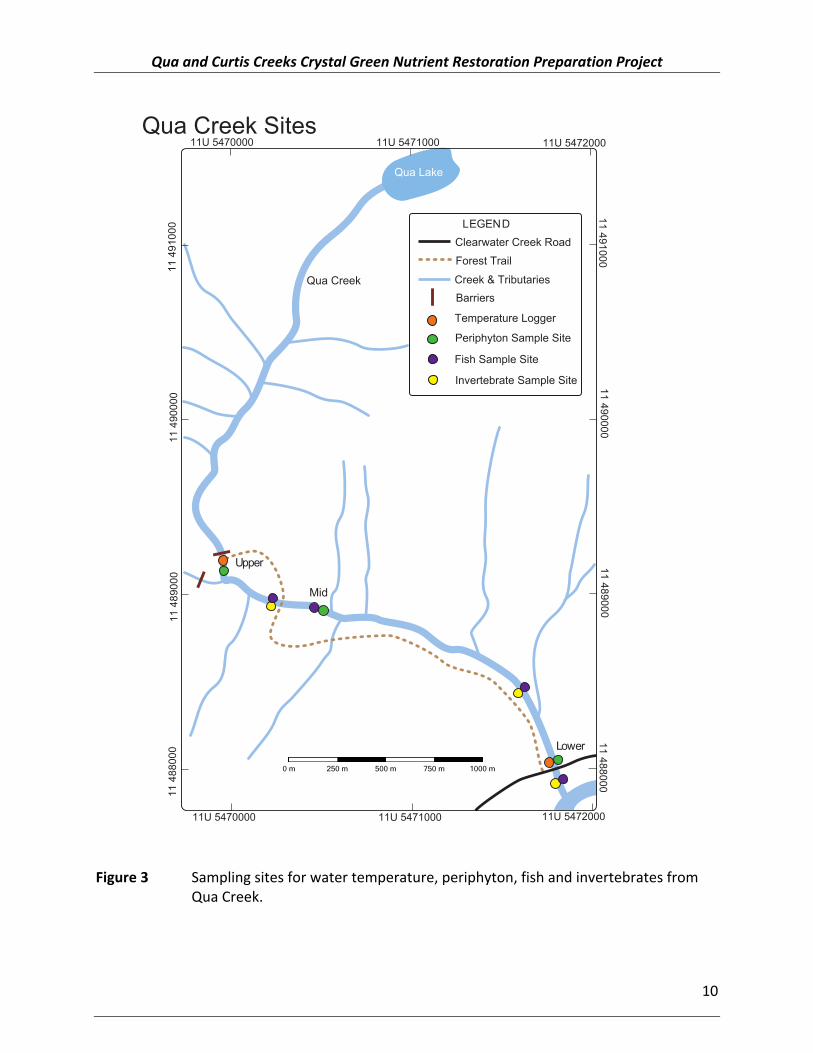
Elevation in the basin ranges from 564 metres above sea level (masl) at its confluence to 2,343 masl at the height of land. Within this elevation range, the system comprises two biogeoclimatic zones (Braumandl and Curran 1992). At lower elevations, the valley lies within the Interior Cedar-‐Hemlock (ICH) zone, while areas in the higher elevations are found within the Englemann Spruce-‐Subalpine Fire (ESSF) zone. The Salmo River has a total of ten 2nd and 3rd order tributaries (including Curtis and Qua Creeks, Apex Creek, Clearwater Creek, Hall Creek, Barrett Creek, Ymir Creek, Porcupine Creek, Erie Creek, and Hidden Creek) and two 4th order tributaries (Sheep Creek and the South Salmo River) (Figure 1). The Water Survey of Canada maintains a gauging station on the Salmo River near the town of Salmo (Anonymous 1977). Mean annual discharge in the Salmo River (1949-‐1976) was 32.5 m3·∙sec-‐1, with mean monthly minimum and maximum values of 7,5 and 128.6 m3·∙sec-‐1, respectively. Runoff reaches a peak in May, with the highest flows between April and July each year. All field study components were completed within Curtis and Qua Creeks in the Salmo River watershed (Figure 1). Curtis Creek is a 2nd order, lake-‐headed stream with strong year round flow that meets Sheep Creek approximately 200 m downstream of a known Bull Trout passage barrier on the Sheep. The elevation at Curtis at its source is ~1860 masl. and it drops about 670 m to an elevation of 1190 masl at its confluence over its 5.9 km length (Figure 2). Qua Creek is a 2nd order, lake-‐headed stream that drops approximately 600 m over a 5.2 km distance from 1720 masl to 1120 masl where it meets Clearwater Creek (Figure 3).

Qua and Curtis Creeks Crystal Green Nutrient Restoration Preparation Project
8
Figure 1 Overview map showing the locations of Curtis and Qua Creeks in the context of the Salmo and Pend d’Oreille River watersheds.
00 km Kilometer Marker
Highway
Surveyed
Bull Trout Barriers
River & Tributaries
Legend
3
CQua Creeklear
ater Cree k
Apex
Creek
Hall Creek
Barrett Creek
Ymir Cr
eek
P
Quartz Creek
orcupine Cree k
Hidden Creek
L
Curtis Creek
ost Creek
Stagle
ap Creek
Erie Creek
Boulder Creek
Swift Creek
McCorm
ick Creek
Hellroaring C
reek
PEND D’OREILLE RIVER
Seven Mile Reservoir
South Salmo River
SALMO SA
LM
O R
I VE
R
YMIR
HALL
15km10km
SCALE 1:250 000
5km0km
To Creston
To USA
To Trail
To Castlegar
To Nelson
BRITISHCOLUMBIA
3
3
6
36
6
0 km
0 km
5 km
5 km
5 km
10 km
35 km
40 km
45 km
50 km
15 km
Burnt out Bridge
10 km
15 km
20 km
25 km5 k
m
10 km
15 km
20 km
25 km
30 km
0 km
30 km
55 km
10 km
Sheep Creek
w
Cle

Qua and Curtis Creeks Crystal Green Nutrient Restoration Preparation Project
9
Figure 2 Sampling sites for water temperature, periphyton, fish and invertebrates from Curtis Creek.
Qua and Curtis Creeks Crystal Green Nutrient Restoration Preparation Project
10
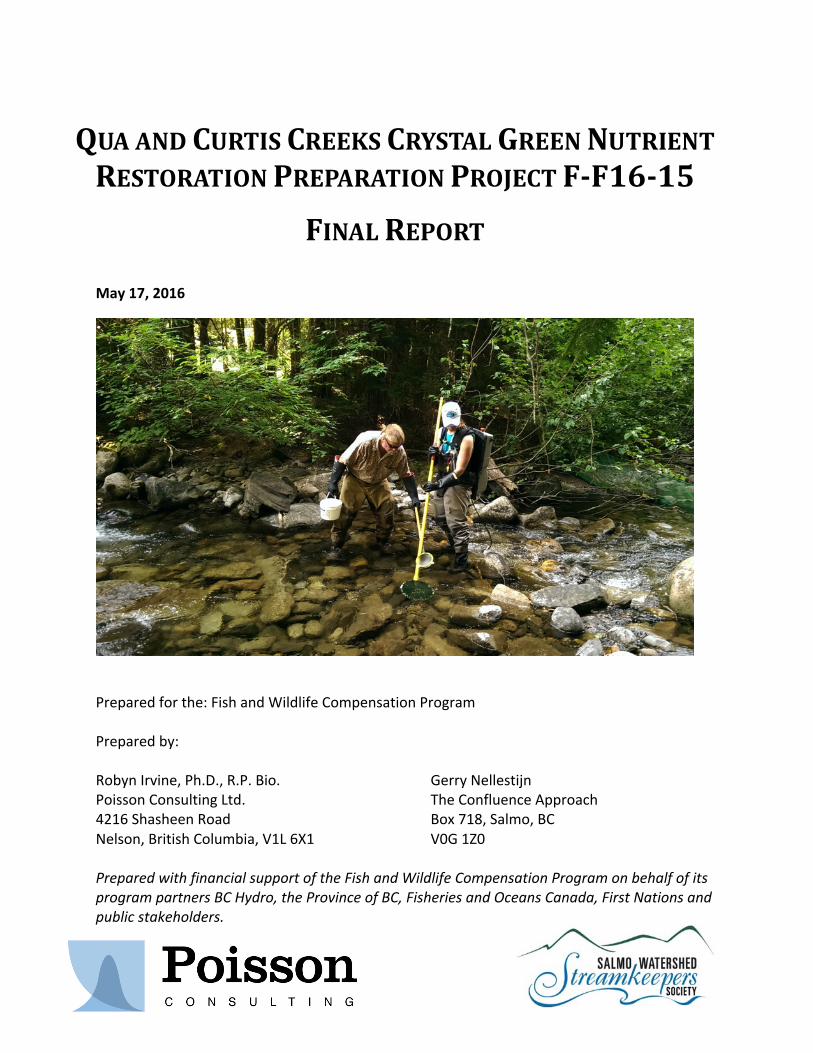
Figure 3 Sampling sites for water temperature, periphyton, fish and invertebrates from Qua Creek.
Qua Creek Sites
Upper
Mid
Lower
Clearwater Creek RoadForest Trail
Creek D TributariesBarriers
Temperature Logger
Periphyton Sample Site
Fish Sample Site
Invertebrate Sample Site
LEGEND
Qua Lake
Qua Creek
11 48800011 489000
11 49000011 491000
11 4
8800
011
489
000
11 4
9000
011
491
000
11U 5471000 11U 547200011U 5470000
11U 5471000 11U 547200011U 5470000
1000 m750 m500 m250 m0 m
Qua and Curtis Creeks Crystal Green Nutrient Restoration Preparation Project
11
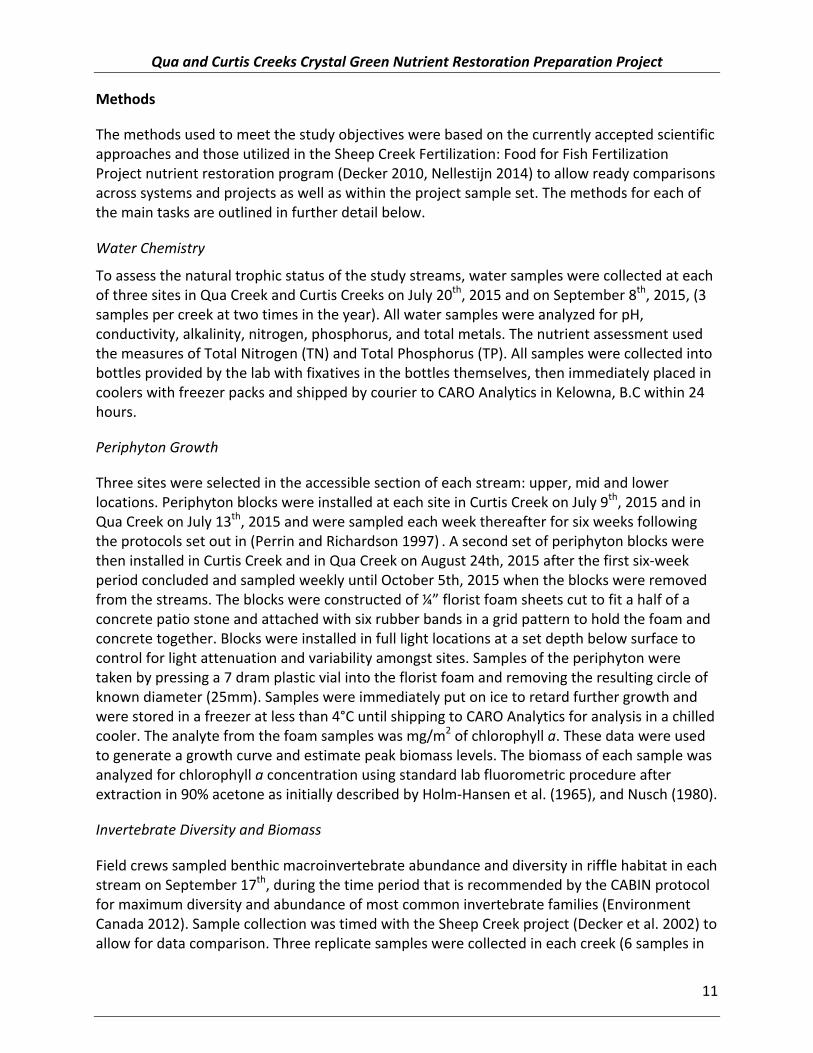
Methods
The methods used to meet the study objectives were based on the currently accepted scientific approaches and those utilized in the Sheep Creek Fertilization: Food for Fish Fertilization Project nutrient restoration program (Decker 2010, Nellestijn 2014) to allow ready comparisons across systems and projects as well as within the project sample set. The methods for each of the main tasks are outlined in further detail below.
Water Chemistry
To assess the natural trophic status of the study streams, water samples were collected at each of three sites in Qua Creek and Curtis Creeks on July 20th, 2015 and on September 8th, 2015, (3 samples per creek at two times in the year). All water samples were analyzed for pH, conductivity, alkalinity, nitrogen, phosphorus, and total metals. The nutrient assessment used the measures of Total Nitrogen (TN) and Total Phosphorus (TP). All samples were collected into bottles provided by the lab with fixatives in the bottles themselves, then immediately placed in coolers with freezer packs and shipped by courier to CARO Analytics in Kelowna, B.C within 24 hours.
Periphyton Growth
Three sites were selected in the accessible section of each stream: upper, mid and lower locations. Periphyton blocks were installed at each site in Curtis Creek on July 9th, 2015 and in Qua Creek on July 13th, 2015 and were sampled each week thereafter for six weeks following the protocols set out in (Perrin and Richardson 1997) . A second set of periphyton blocks were then installed in Curtis Creek and in Qua Creek on August 24th, 2015 after the first six-‐week period concluded and sampled weekly until October 5th, 2015 when the blocks were removed from the streams. The blocks were constructed of ¼” florist foam sheets cut to fit a half of a concrete patio stone and attached with six rubber bands in a grid pattern to hold the foam and concrete together. Blocks were installed in full light locations at a set depth below surface to control for light attenuation and variability amongst sites. Samples of the periphyton were taken by pressing a 7 dram plastic vial into the florist foam and removing the resulting circle of known diameter (25mm). Samples were immediately put on ice to retard further growth and were stored in a freezer at less than 4°C until shipping to CARO Analytics for analysis in a chilled cooler. The analyte from the foam samples was mg/m2 of chlorophyll a. These data were used to generate a growth curve and estimate peak biomass levels. The biomass of each sample was analyzed for chlorophyll a concentration using standard lab fluorometric procedure after extraction in 90% acetone as initially described by Holm-‐Hansen et al. (1965), and Nusch (1980).
Invertebrate Diversity and Biomass
Field crews sampled benthic macroinvertebrate abundance and diversity in riffle habitat in each stream on September 17th, during the time period that is recommended by the CABIN protocol for maximum diversity and abundance of most common invertebrate families (Environment Canada 2012). Sample collection was timed with the Sheep Creek project (Decker et al. 2002) to allow for data comparison. Three replicate samples were collected in each creek (6 samples in
Qua and Curtis Creeks Crystal Green Nutrient Restoration Preparation Project
12
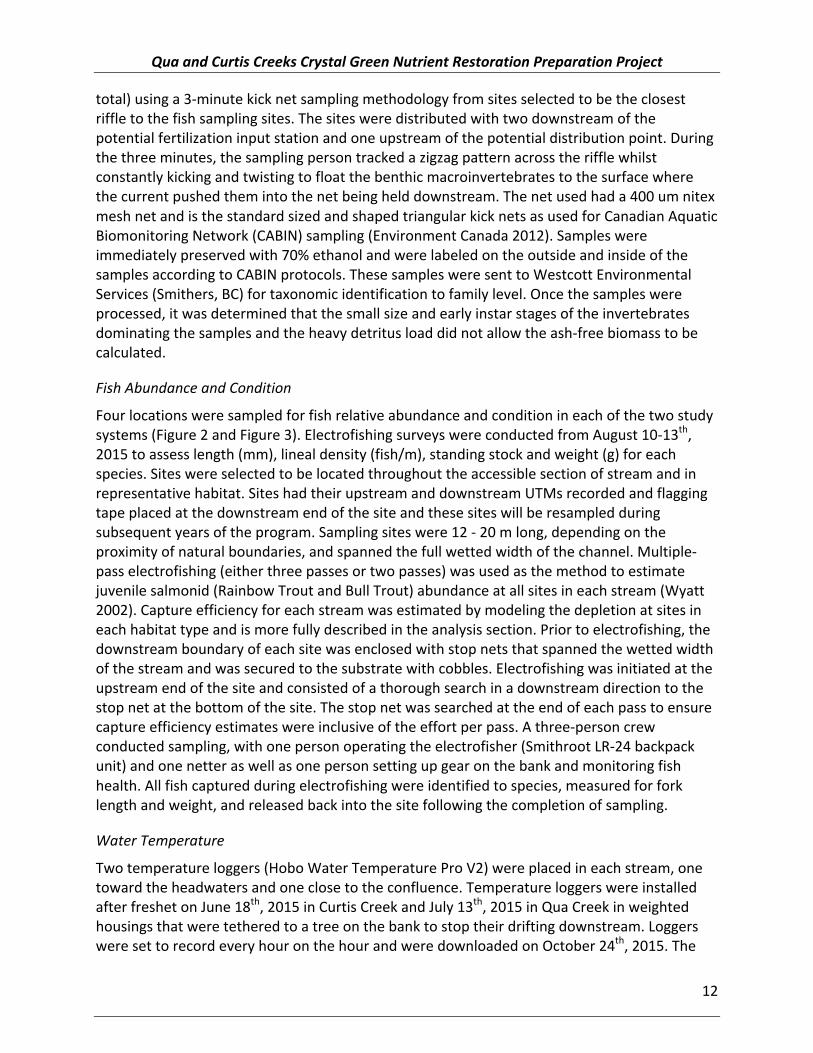
total) using a 3-‐minute kick net sampling methodology from sites selected to be the closest riffle to the fish sampling sites. The sites were distributed with two downstream of the potential fertilization input station and one upstream of the potential distribution point. During the three minutes, the sampling person tracked a zigzag pattern across the riffle whilst constantly kicking and twisting to float the benthic macroinvertebrates to the surface where the current pushed them into the net being held downstream. The net used had a 400 um nitex mesh net and is the standard sized and shaped triangular kick nets as used for Canadian Aquatic Biomonitoring Network (CABIN) sampling (Environment Canada 2012). Samples were immediately preserved with 70% ethanol and were labeled on the outside and inside of the samples according to CABIN protocols. These samples were sent to Westcott Environmental Services (Smithers, BC) for taxonomic identification to family level. Once the samples were processed, it was determined that the small size and early instar stages of the invertebrates dominating the samples and the heavy detritus load did not allow the ash-‐free biomass to be calculated.
Fish Abundance and Condition
Four locations were sampled for fish relative abundance and condition in each of the two study systems (Figure 2 and Figure 3). Electrofishing surveys were conducted from August 10-‐13th, 2015 to assess length (mm), lineal density (fish/m), standing stock and weight (g) for each species. Sites were selected to be located throughout the accessible section of stream and in representative habitat. Sites had their upstream and downstream UTMs recorded and flagging tape placed at the downstream end of the site and these sites will be resampled during subsequent years of the program. Sampling sites were 12 -‐ 20 m long, depending on the proximity of natural boundaries, and spanned the full wetted width of the channel. Multiple-‐pass electrofishing (either three passes or two passes) was used as the method to estimate juvenile salmonid (Rainbow Trout and Bull Trout) abundance at all sites in each stream (Wyatt 2002). Capture efficiency for each stream was estimated by modeling the depletion at sites in each habitat type and is more fully described in the analysis section. Prior to electrofishing, the downstream boundary of each site was enclosed with stop nets that spanned the wetted width of the stream and was secured to the substrate with cobbles. Electrofishing was initiated at the upstream end of the site and consisted of a thorough search in a downstream direction to the stop net at the bottom of the site. The stop net was searched at the end of each pass to ensure capture efficiency estimates were inclusive of the effort per pass. A three-‐person crew conducted sampling, with one person operating the electrofisher (Smithroot LR-‐24 backpack unit) and one netter as well as one person setting up gear on the bank and monitoring fish health. All fish captured during electrofishing were identified to species, measured for fork length and weight, and released back into the site following the completion of sampling.
Water Temperature
Two temperature loggers (Hobo Water Temperature Pro V2) were placed in each stream, one toward the headwaters and one close to the confluence. Temperature loggers were installed after freshet on June 18th, 2015 in Curtis Creek and July 13th, 2015 in Qua Creek in weighted housings that were tethered to a tree on the bank to stop their drifting downstream. Loggers were set to record every hour on the hour and were downloaded on October 24th, 2015. The

Qua and Curtis Creeks Crystal Green Nutrient Restoration Preparation Project
13
loggers were returned to the streams to record late fall and winter temperatures.
Habitat Surveys
Broad physical habitat categories of each creek were examined during the fall Bull Trout spawner and habitat survey conducted as part of another study project in the watershed. Habitat breaks, Bull Trout passage barriers were identified and mapped. As well, the percentage of riffle, cascade, pool and glide within the surveyed area were estimated. Within each electrofishing site, the percentage of each habitat type was also visually estimated and the dominant substrate type was also determined. The stream width was measured in three locations (lower, mid, upper site) in each electrofishing site as well and photos taken upstream, downstream and across each site (Appendix A).
Analysis
After completion of data collection, all data were entered into comma-‐delimited spreadsheets and were then collated into a customized SQLLite (Access compatible) database. The analytic software R 3.2.3 (R Core Team 2015) then executed SQL commands that ran validation tests on the data and extracted datasets for subsequent analysis. This approach not only eliminates any possible confusion associated with multiple datasets, but also allows reports to be generated and analyses rerun immediately following data entry or data correction. All entered data were plotted extensively to look for errors and outliers.
Juvenile fish estimates of density were obtained from the electrofishing by implementing a depletion model in a Bayesian context to obtain the capture efficiency and then by dividing the total catches by the estimates of capture efficiency (Kéry and Schaub 2011). The periphyton growth was plotted to assess growth rates and absolute levels of primary productivity at each site within each creek. Water chemistry and macroinvertebrate diversity and biomass were databased and presented in plots to enable understanding of trends and patterns.
The data were queried from the database and analysed using hierarchical Bayesian methods. The analyses were performed using R 3.2.3 (R Core Team 2015), JAGS >= 3.3.0 (Plummer 2003) and the jaggernaut >= 0.1.6 R package (Thorley 2013). Plots were produced using the ggplot2 >= 0.9.3 R package (Wickham 2009). The model descriptions, parameter definitions and estimates can be found in the analytic online report at: http://www.poissonconsulting.ca/temporary-‐hidden-‐link/234261667/curtis-‐qua-‐productivity-‐15/
Results
Water Chemistry
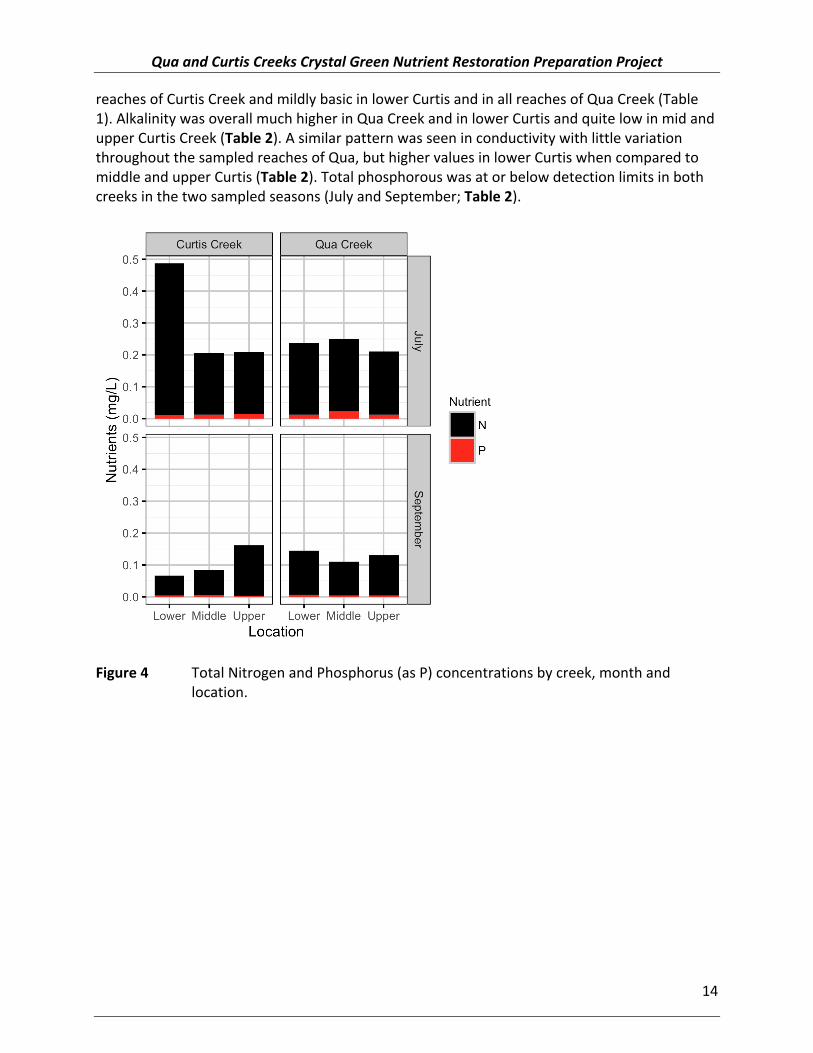
The analyses of the two seasonal water samples showed approximately double the Total Nitrogen (TN) in July as compared to September and low levels of Total Phosphorus (TP) in both seasonal samples (Table 1, Figure 4). The TN: TP ratios ranged from 12.9 – 53 in Curtis Creek and from 15.2 – 31.5 in Qua Creek (Table 2). The pH was mildly acidic in the middle and upper
Qua and Curtis Creeks Crystal Green Nutrient Restoration Preparation Project
14
reaches of Curtis Creek and mildly basic in lower Curtis and in all reaches of Qua Creek (Table 1). Alkalinity was overall much higher in Qua Creek and in lower Curtis and quite low in mid and upper Curtis Creek (Table 2). A similar pattern was seen in conductivity with little variation throughout the sampled reaches of Qua, but higher values in lower Curtis when compared to middle and upper Curtis (Table 2). Total phosphorous was at or below detection limits in both creeks in the two sampled seasons (July and September; Table 2).
Figure 4 Total Nitrogen and Phosphorus (as P) concentrations by creek, month and location.

Qua and Curtis Creeks Crystal Green Nutrient Restoration Preparation Project
15
Table 1 Water chemistry results for nutrient analyses including pH, conductivity, alkalinity and nitrogen and phosphorus for Curtis and Qua Creeks for July (month=7)and September (month=9), 2015.
Analyte Units Month
Curtis1Creek131Lower
Curtis1Creek131Middle
Curtis1Creek131Upper
Qua1Creek131Lower
Qua1Creek131Middle
Qua1Creek131Upper
Alkalinity,*Total*as*CaCO3 mg/L 7 22 4 5 27 23 27Alkalinity,*Total*as*CaCO3 mg/L 9 16 5 7 25 21 25Conductivity*(EC) uS/cm 7 52 22 28 60 49 55Conductivity*(EC) uS/cm 9 45 23 21 59 48 56Nitrate*as*N mg/L 7 0.325 0.054 0.052 0.072 0.052 0.074Nitrate*as*N mg/L 9 <0.01 <0.01 <0.01 0.025 0.031 0.039Nitrate+Nitrite*as*N mg/L 7 0.325 0.054 0.052 0.072 0.052 0.074Nitrate+Nitrite*as*N mg/L 9 <0.01 <0.01 <0.01 0.025 0.031 0.039Nitrite*as*N mg/L 7 <0.01 <0.01 <0.01 <0.01 <0.01 <0.01Nitrite*as*N mg/L 9 <0.01 <0.01 <0.01 <0.01 <0.01 <0.01Nitrogen,*Dissolved*Kjeldahl mg/L 7 0.09 0.09 0.14 0.1 0.17 0.12Nitrogen,*Dissolved*Kjeldahl mg/L 9 0.06 0.08 0.14 0.09 0.07 0.08Nitrogen,*Total mg/L 7 0.475 0.193 0.194 0.224 0.226 0.198Nitrogen,*Total mg/L 9 0.063 0.078 0.159 0.139 0.106 0.126Nitrogen,*Total*Dissolved mg/L 7 0.419 0.148 0.191 0.17 0.226 0.192Nitrogen,*Total*Dissolved mg/L 9 0.06 0.084 0.137 0.117 0.105 0.123Nitrogen,*Total*Kjeldahl* mg/L 7 0.15 0.14 0.14 0.15 0.17 0.12Nitrogen,*Total*Kjeldahl* mg/L 9 0.06 0.08 0.16 0.11 0.08 0.09pH pH*units 7 7.51 6.86 6.68 7.56 7.39 7.42pH pH*units 9 7.23 6.93 6.95 7.46 7.34 7.47Phosphorus,*total mg/L 7 <0.2 <0.2 <0.2 <0.2 <0.2 <0.2Phosphorus,*total mg/L 9 <0.2 <0.2 <0.2 <0.2 <0.2 <0.2Phosphorus,*Total*as*P mg/L 7 0.012 0.013 0.015 0.013 0.023 0.013Phosphorus,*Total*as*P mg/L 9 0.004 0.005 0.003 0.006 0.004 0.004DIN(Nitrate+nitrite+ammonia) mg/L 7 0.056 0.046 0.001 0.052 T0.004 0.002DIN(Nitrate+nitrite+ammonia) mg/L 9 0.01 0.006 0.033 0.018 0.006 0.006
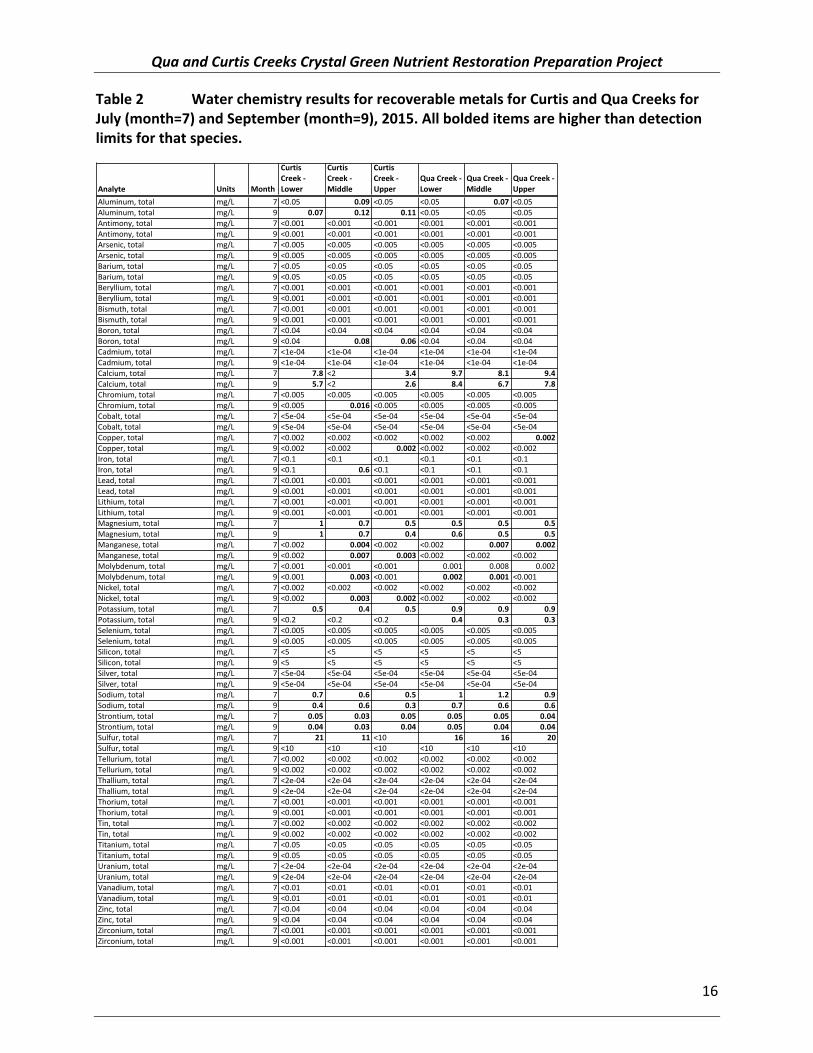
Total recoverable metals were assessed for the three sites on each creek in July and September, 2015. Most species of metals were at or below detection limit (Table 2) though certain recoverable metals were higher than detection. Magnesium was higher in both creeks at all locations in both seasons. Aluminum was greater than detection limits in Curtis creek in September only. Sulphur was above detection in lower Curtis and upper Qua Creeks in July but had dropped below detection limits by September. Both creeks were high in calcium at most sites throughout the seasons. Other metal species that were above detection at some sites at either or both of the sampling periods included boron, iron, copper, manganese, molybdenum, nickel, potassium, sodium and strontium (Table 2).
Qua and Curtis Creeks Crystal Green Nutrient Restoration Preparation Project
16
Table 2 Water chemistry results for recoverable metals for Curtis and Qua Creeks for July (month=7) and September (month=9), 2015. All bolded items are higher than detection limits for that species.
Analyte Units Month
Curtis1Creek131Lower
Curtis1Creek131Middle
Curtis1Creek131Upper
Qua1Creek131Lower
Qua1Creek131Middle
Qua1Creek131Upper
Aluminum,(total mg/L 7 <0.05 0.09 <0.05 <0.05 0.07 <0.05Aluminum,(total mg/L 9 0.07 0.12 0.11 <0.05 <0.05 <0.05Antimony,(total mg/L 7 <0.001 <0.001 <0.001 <0.001 <0.001 <0.001Antimony,(total mg/L 9 <0.001 <0.001 <0.001 <0.001 <0.001 <0.001Arsenic,(total mg/L 7 <0.005 <0.005 <0.005 <0.005 <0.005 <0.005Arsenic,(total mg/L 9 <0.005 <0.005 <0.005 <0.005 <0.005 <0.005Barium,(total mg/L 7 <0.05 <0.05 <0.05 <0.05 <0.05 <0.05Barium,(total mg/L 9 <0.05 <0.05 <0.05 <0.05 <0.05 <0.05Beryllium,(total mg/L 7 <0.001 <0.001 <0.001 <0.001 <0.001 <0.001Beryllium,(total mg/L 9 <0.001 <0.001 <0.001 <0.001 <0.001 <0.001Bismuth,(total mg/L 7 <0.001 <0.001 <0.001 <0.001 <0.001 <0.001Bismuth,(total mg/L 9 <0.001 <0.001 <0.001 <0.001 <0.001 <0.001Boron,(total mg/L 7 <0.04 <0.04 <0.04 <0.04 <0.04 <0.04Boron,(total mg/L 9 <0.04 0.08 0.06 <0.04 <0.04 <0.04Cadmium,(total mg/L 7 <1e@04 <1e@04 <1e@04 <1e@04 <1e@04 <1e@04Cadmium,(total mg/L 9 <1e@04 <1e@04 <1e@04 <1e@04 <1e@04 <1e@04Calcium,(total mg/L 7 7.8 <2 3.4 9.7 8.1 9.4Calcium,(total mg/L 9 5.7 <2 2.6 8.4 6.7 7.8Chromium,(total mg/L 7 <0.005 <0.005 <0.005 <0.005 <0.005 <0.005Chromium,(total mg/L 9 <0.005 0.016 <0.005 <0.005 <0.005 <0.005Cobalt,(total mg/L 7 <5e@04 <5e@04 <5e@04 <5e@04 <5e@04 <5e@04Cobalt,(total mg/L 9 <5e@04 <5e@04 <5e@04 <5e@04 <5e@04 <5e@04Copper,(total mg/L 7 <0.002 <0.002 <0.002 <0.002 <0.002 0.002Copper,(total mg/L 9 <0.002 <0.002 0.002 <0.002 <0.002 <0.002Iron,(total mg/L 7 <0.1 <0.1 <0.1 <0.1 <0.1 <0.1Iron,(total mg/L 9 <0.1 0.6 <0.1 <0.1 <0.1 <0.1Lead,(total mg/L 7 <0.001 <0.001 <0.001 <0.001 <0.001 <0.001Lead,(total mg/L 9 <0.001 <0.001 <0.001 <0.001 <0.001 <0.001Lithium,(total mg/L 7 <0.001 <0.001 <0.001 <0.001 <0.001 <0.001Lithium,(total mg/L 9 <0.001 <0.001 <0.001 <0.001 <0.001 <0.001Magnesium,(total mg/L 7 1 0.7 0.5 0.5 0.5 0.5Magnesium,(total mg/L 9 1 0.7 0.4 0.6 0.5 0.5Manganese,(total mg/L 7 <0.002 0.004 <0.002 <0.002 0.007 0.002Manganese,(total mg/L 9 <0.002 0.007 0.003 <0.002 <0.002 <0.002Molybdenum,(total mg/L 7 <0.001 <0.001 <0.001 0.001 0.008 0.002Molybdenum,(total mg/L 9 <0.001 0.003 <0.001 0.002 0.001 <0.001Nickel,(total mg/L 7 <0.002 <0.002 <0.002 <0.002 <0.002 <0.002Nickel,(total mg/L 9 <0.002 0.003 0.002 <0.002 <0.002 <0.002Potassium,(total mg/L 7 0.5 0.4 0.5 0.9 0.9 0.9Potassium,(total mg/L 9 <0.2 <0.2 <0.2 0.4 0.3 0.3Selenium,(total mg/L 7 <0.005 <0.005 <0.005 <0.005 <0.005 <0.005Selenium,(total mg/L 9 <0.005 <0.005 <0.005 <0.005 <0.005 <0.005Silicon,(total mg/L 7 <5 <5 <5 <5 <5 <5Silicon,(total mg/L 9 <5 <5 <5 <5 <5 <5Silver,(total mg/L 7 <5e@04 <5e@04 <5e@04 <5e@04 <5e@04 <5e@04Silver,(total mg/L 9 <5e@04 <5e@04 <5e@04 <5e@04 <5e@04 <5e@04Sodium,(total mg/L 7 0.7 0.6 0.5 1 1.2 0.9Sodium,(total mg/L 9 0.4 0.6 0.3 0.7 0.6 0.6Strontium,(total mg/L 7 0.05 0.03 0.05 0.05 0.05 0.04Strontium,(total mg/L 9 0.04 0.03 0.04 0.05 0.04 0.04Sulfur,(total mg/L 7 21 11 <10 16 16 20Sulfur,(total mg/L 9 <10 <10 <10 <10 <10 <10Tellurium,(total mg/L 7 <0.002 <0.002 <0.002 <0.002 <0.002 <0.002Tellurium,(total mg/L 9 <0.002 <0.002 <0.002 <0.002 <0.002 <0.002Thallium,(total mg/L 7 <2e@04 <2e@04 <2e@04 <2e@04 <2e@04 <2e@04Thallium,(total mg/L 9 <2e@04 <2e@04 <2e@04 <2e@04 <2e@04 <2e@04Thorium,(total mg/L 7 <0.001 <0.001 <0.001 <0.001 <0.001 <0.001Thorium,(total mg/L 9 <0.001 <0.001 <0.001 <0.001 <0.001 <0.001Tin,(total mg/L 7 <0.002 <0.002 <0.002 <0.002 <0.002 <0.002Tin,(total mg/L 9 <0.002 <0.002 <0.002 <0.002 <0.002 <0.002Titanium,(total mg/L 7 <0.05 <0.05 <0.05 <0.05 <0.05 <0.05Titanium,(total mg/L 9 <0.05 <0.05 <0.05 <0.05 <0.05 <0.05Uranium,(total mg/L 7 <2e@04 <2e@04 <2e@04 <2e@04 <2e@04 <2e@04Uranium,(total mg/L 9 <2e@04 <2e@04 <2e@04 <2e@04 <2e@04 <2e@04Vanadium,(total mg/L 7 <0.01 <0.01 <0.01 <0.01 <0.01 <0.01Vanadium,(total mg/L 9 <0.01 <0.01 <0.01 <0.01 <0.01 <0.01Zinc,(total mg/L 7 <0.04 <0.04 <0.04 <0.04 <0.04 <0.04Zinc,(total mg/L 9 <0.04 <0.04 <0.04 <0.04 <0.04 <0.04Zirconium,(total mg/L 7 <0.001 <0.001 <0.001 <0.001 <0.001 <0.001Zirconium,(total mg/L 9 <0.001 <0.001 <0.001 <0.001 <0.001 <0.001

Qua and Curtis Creeks Crystal Green Nutrient Restoration Preparation Project
17
Periphyton Growth
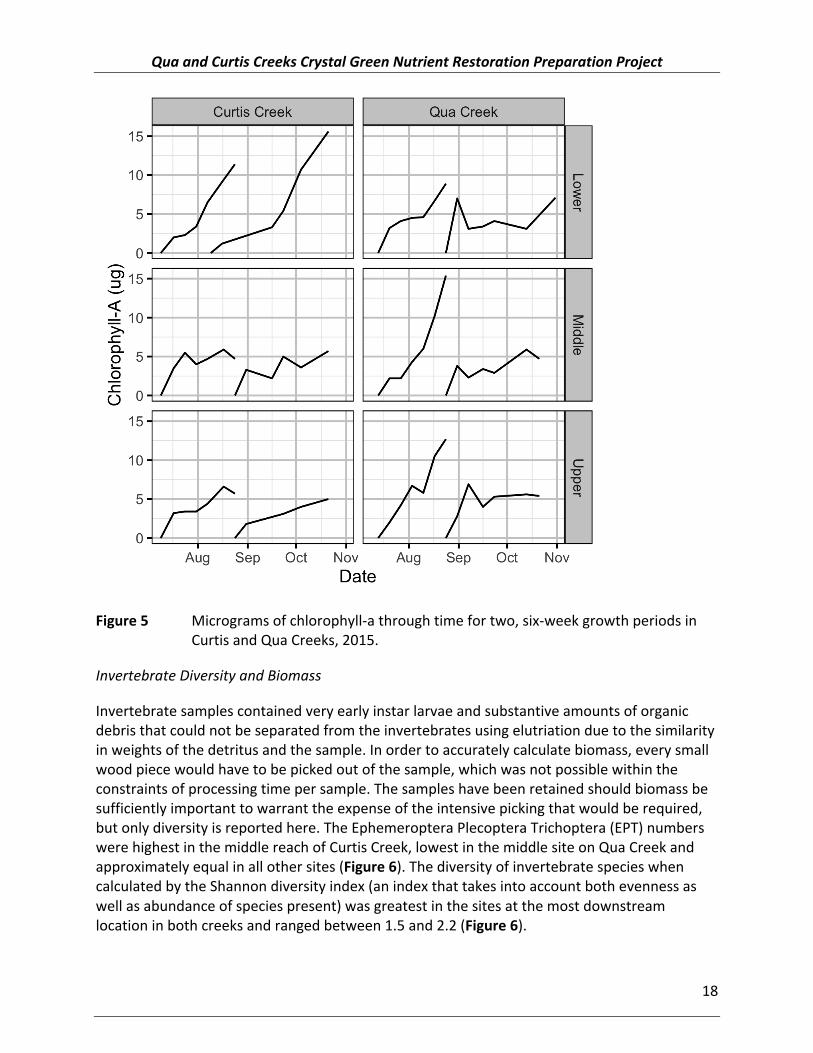
Periphyton values are plotted in absolute micrograms per sample and the samples were extracted from a standardized 25mm (0.07854 m2) diameter punch of the florist’s foam growth substrate. The blocks were sampled on an approximately weekly basis (Table 1). The growth was most rapid in lower Curtis and in all sites in Qua creek during the first growth series period of six weeks (Figure 5). Rates of growth as indicated by the steepness of the slope between measured points was generally less in the second growth series in Qua Creek as would be expected due to diminished daylight hours as well as cooling water temperatures into the fall (Figure 5). However, growth rates were quite similar between the two series in Curtis creek. The maximum chlorophyll-‐a accrual in Curtis Creek was 15.6 ug at the lower site and was 15.4 ug at the middle Qua site (Figure 5).
Table 3 Sampling dates for periphyton growth study by series and creek. The last sampling date for series one was the first day (or zero value) for series two.
Sampling Dates for Curtis Creek
Sampling Dates for Qua Creek
Growth Series
July 9 July 13 1
July 17 July 20 1
July 24 July 27 1
July 31 August 3 1
August 7 August 10 1
August 16/17 August 17 1
August 24 August 24 1/2
August 31 August 31 2
September 16 September 7 2
September 23 September 16 2
October 4 September 23
ss
2
October 10 October 13 2
October 21 October 21 2
Qua and Curtis Creeks Crystal Green Nutrient Restoration Preparation Project
18
Figure 5 Micrograms of chlorophyll-‐a through time for two, six-‐week growth periods in Curtis and Qua Creeks, 2015.
Invertebrate Diversity and Biomass
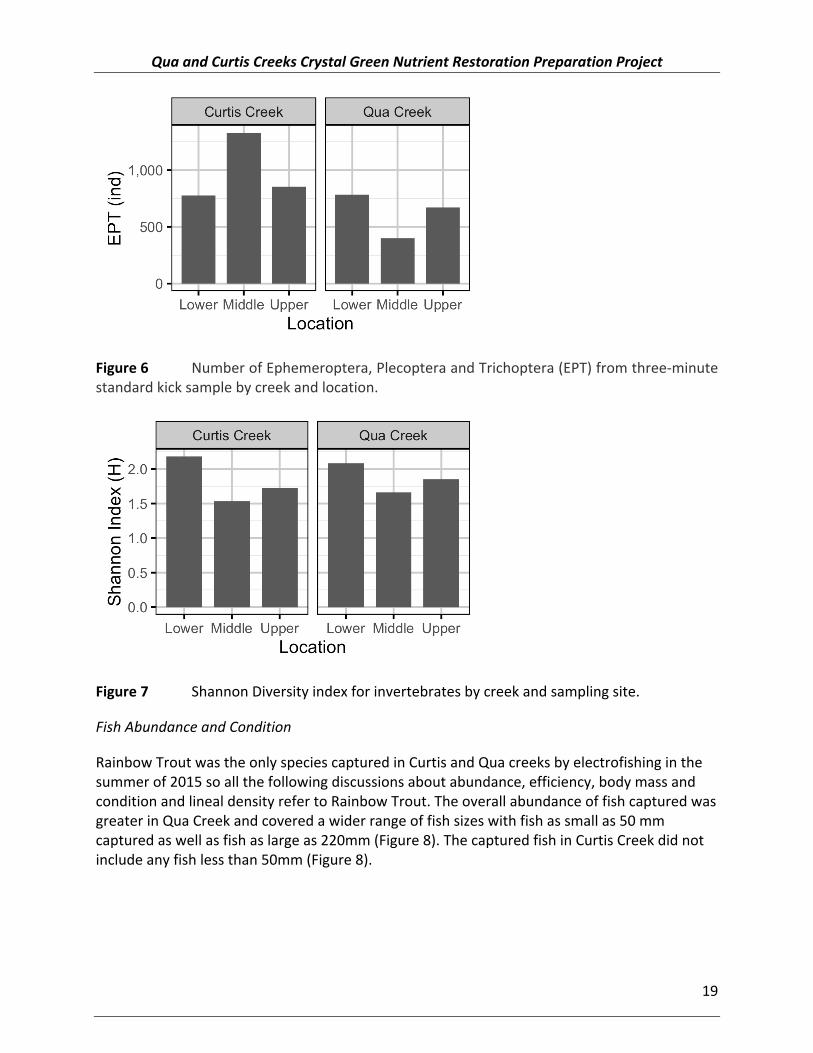
Invertebrate samples contained very early instar larvae and substantive amounts of organic debris that could not be separated from the invertebrates using elutriation due to the similarity in weights of the detritus and the sample. In order to accurately calculate biomass, every small wood piece would have to be picked out of the sample, which was not possible within the constraints of processing time per sample. The samples have been retained should biomass be sufficiently important to warrant the expense of the intensive picking that would be required, but only diversity is reported here. The Ephemeroptera Plecoptera Trichoptera (EPT) numbers were highest in the middle reach of Curtis Creek, lowest in the middle site on Qua Creek and approximately equal in all other sites (Figure 6). The diversity of invertebrate species when calculated by the Shannon diversity index (an index that takes into account both evenness as well as abundance of species present) was greatest in the sites at the most downstream location in both creeks and ranged between 1.5 and 2.2 (Figure 6).
Qua and Curtis Creeks Crystal Green Nutrient Restoration Preparation Project
19
Figure 6 Number of Ephemeroptera, Plecoptera and Trichoptera (EPT) from three-‐minute standard kick sample by creek and location.
Figure 7 Shannon Diversity index for invertebrates by creek and sampling site.
Fish Abundance and Condition
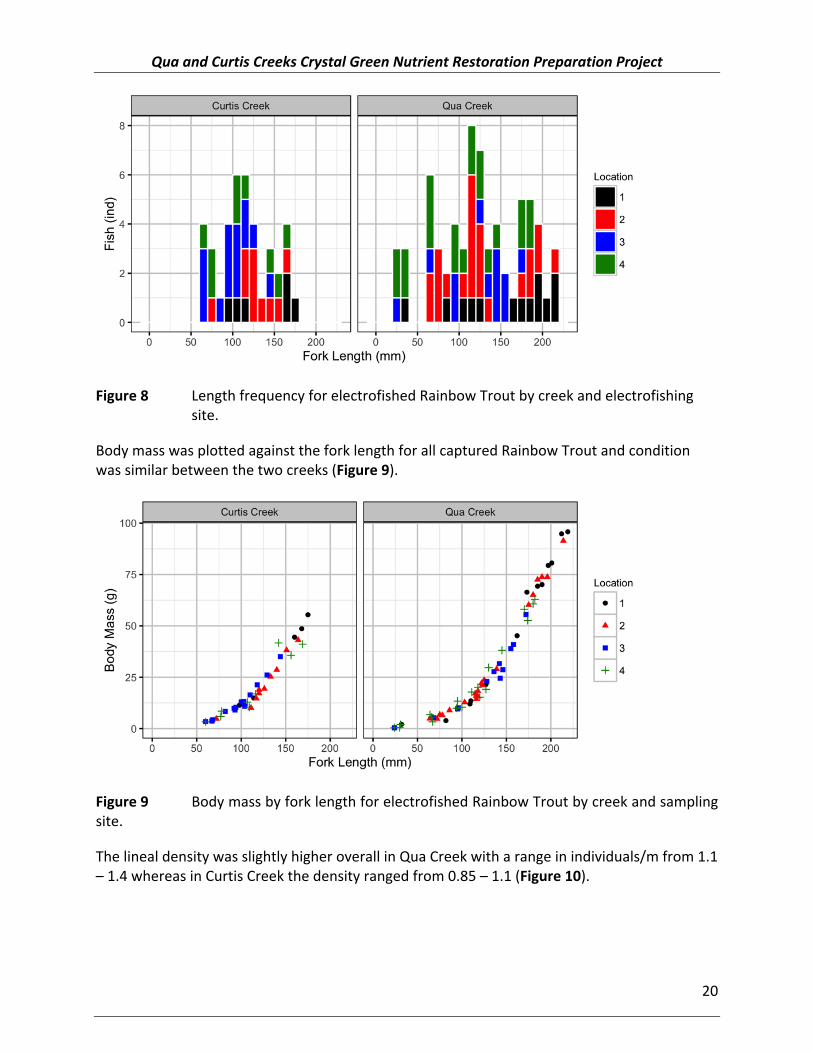
Rainbow Trout was the only species captured in Curtis and Qua creeks by electrofishing in the summer of 2015 so all the following discussions about abundance, efficiency, body mass and condition and lineal density refer to Rainbow Trout. The overall abundance of fish captured was greater in Qua Creek and covered a wider range of fish sizes with fish as small as 50 mm captured as well as fish as large as 220mm (Figure 8). The captured fish in Curtis Creek did not include any fish less than 50mm (Figure 8).
Qua and Curtis Creeks Crystal Green Nutrient Restoration Preparation Project
20
Figure 8 Length frequency for electrofished Rainbow Trout by creek and electrofishing site.
Body mass was plotted against the fork length for all captured Rainbow Trout and condition was similar between the two creeks (Figure 9).
Figure 9 Body mass by fork length for electrofished Rainbow Trout by creek and sampling site.
The lineal density was slightly higher overall in Qua Creek with a range in individuals/m from 1.1 – 1.4 whereas in Curtis Creek the density ranged from 0.85 – 1.1 (Figure 10).

Qua and Curtis Creeks Crystal Green Nutrient Restoration Preparation Project
21
Figure 10 Lineal density of Rainbow Trout (all ages pooled) with a fork length greater than 50 mm by creek and location. Error bars represent 95% credible intervals.
The capture efficiency for Curtis Creek was 60% (95% CRI 30-‐82%) and for Qua Creek was 61% (95% CRI 43-‐75%) (Figure 11).
Figure 11 Capture efficiency of Rainbow Trout with a fork length greater than 50 mm by creek.
Water Temperature
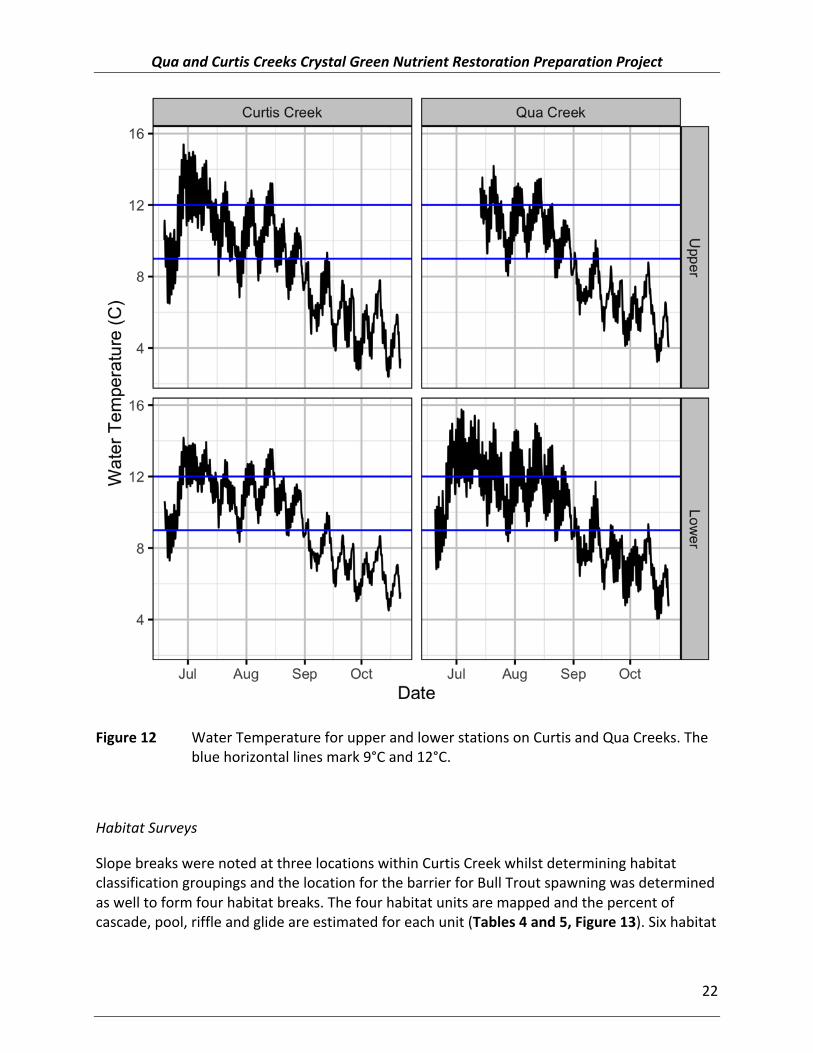
These creeks are cool, headwater creeks with overall temperatures in the summer less than 16°C with upper Qua and lower Curtis showing the coolest average temperatures of the four sites. All measured sites for water temperature rest within the suitable range for Bull Trout spawning and for salmonid rearing and incubation (Figure 12).
Qua and Curtis Creeks Crystal Green Nutrient Restoration Preparation Project
22
Figure 12 Water Temperature for upper and lower stations on Curtis and Qua Creeks. The blue horizontal lines mark 9°C and 12°C.
Habitat Surveys
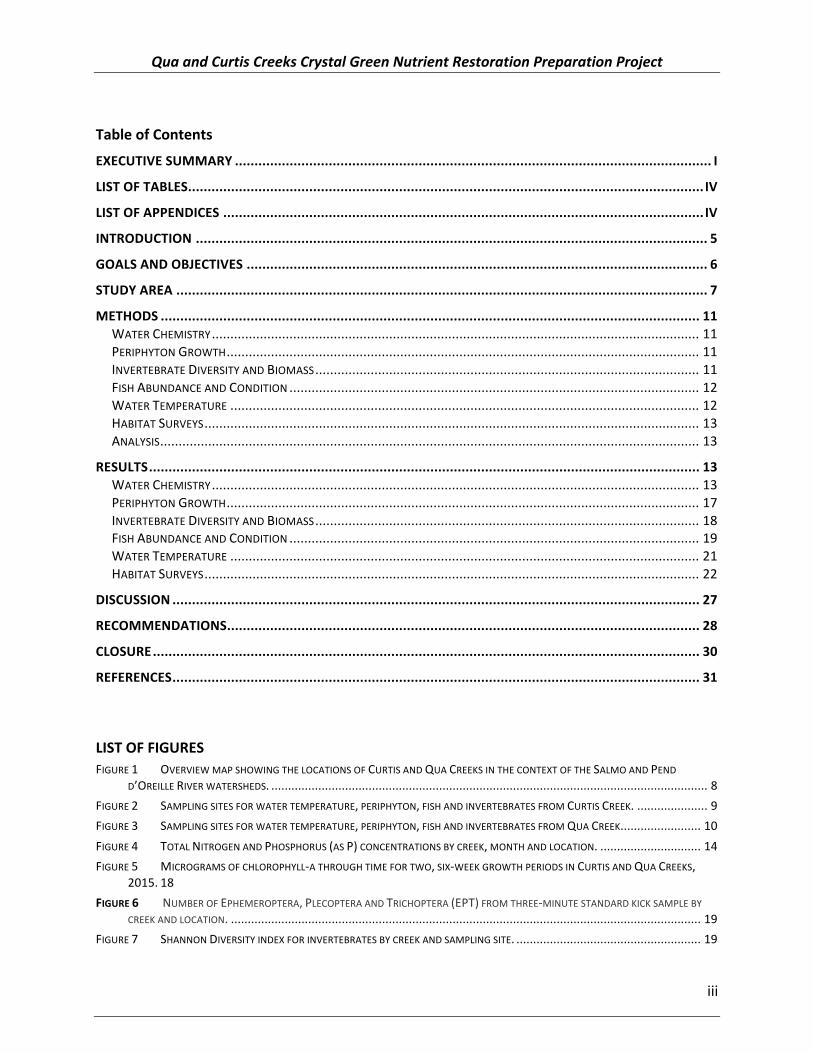
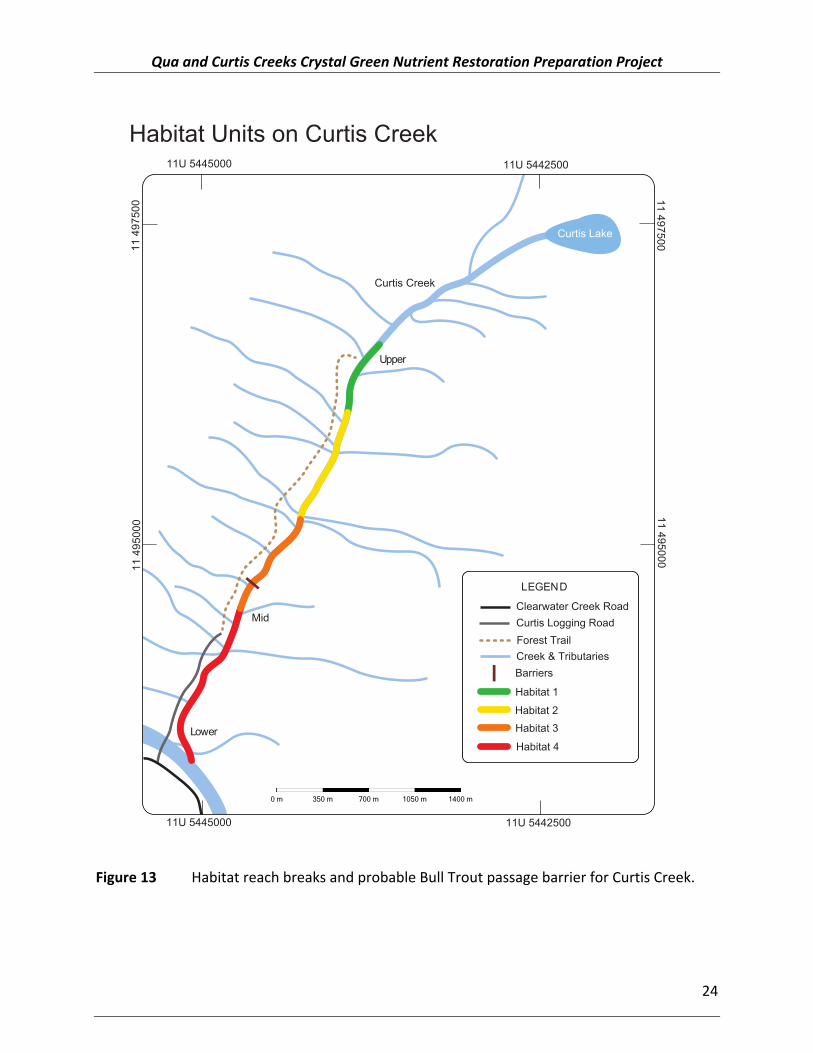
Slope breaks were noted at three locations within Curtis Creek whilst determining habitat classification groupings and the location for the barrier for Bull Trout spawning was determined as well to form four habitat breaks. The four habitat units are mapped and the percent of cascade, pool, riffle and glide are estimated for each unit (Tables 4 and 5, Figure 13). Six habitat

Qua and Curtis Creeks Crystal Green Nutrient Restoration Preparation Project
23
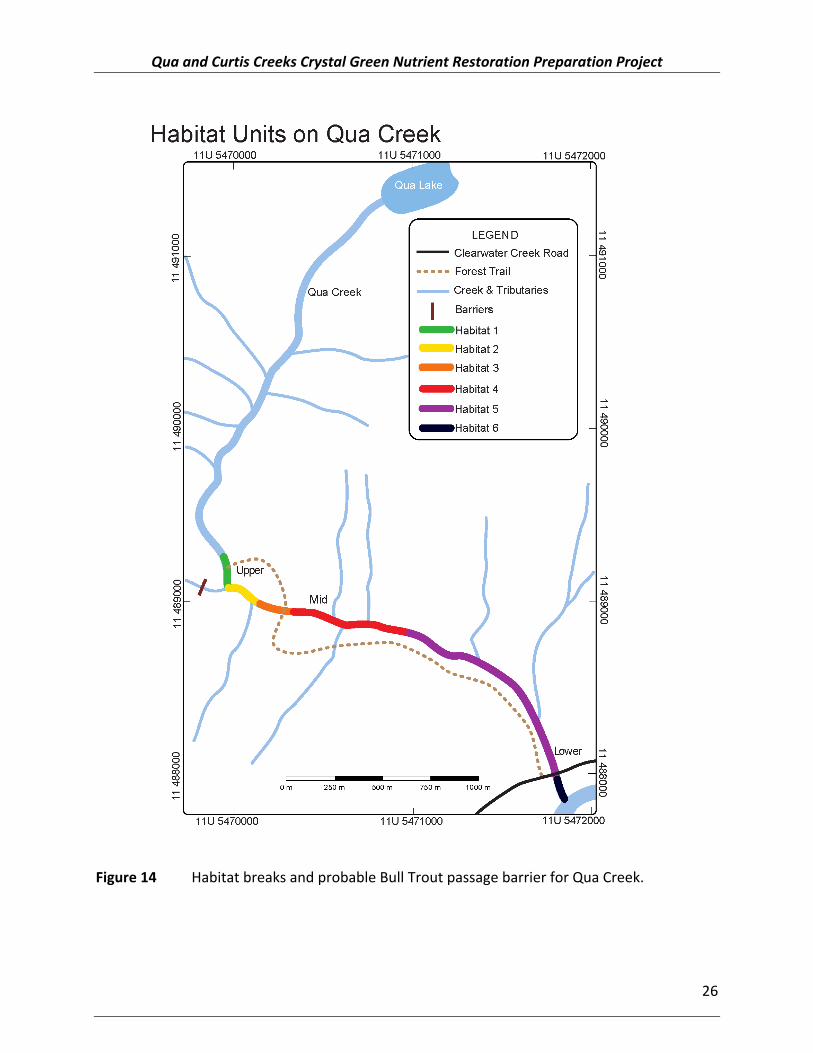
breaks were determined to exist in Qua Creek and the habitat units for each are mapped and the percentage of each habitat type were estimated (Tables 6 and 7; Figure 14).
Table 4 Natural habitat breaks used to determine broad habitat classification of Curtis Creek.
Type of break Elevation (m) UTM Coordinates (Zone
11U) Easting Northing
Slope break 1538 496450 5443570 Slope break 1502 496014 5443683 Slope break 1470 495714 5443792 Barrier 1357 494629 5444444
Table 5 Average percent habitat type for each habitat unit of Curtis Creek.
Habitat Unit Interval Cascade Pool Riffle Glide
1 Slope break to slope break 60 11 25 4 2 Slope break to slope break 10 10 75 5 3 Slope break to slope break 43 32 21 5 4 Slope break to barrier 70 15 13 3
Qua and Curtis Creeks Crystal Green Nutrient Restoration Preparation Project
24
Figure 13 Habitat reach breaks and probable Bull Trout passage barrier for Curtis Creek.
Habitat Units on Curtis Creek
Curtis Creek
Upper
Mid
Lower
Lower
Curtis Lake
11 4
9500
011
497
500
11U 544250011U 5445000
11U 5445000 11U 544250011 497500
11 495000
1400 m1050 m700 m350 m0 m
Clearwater Creek Road
Forest TrailCurtis Logging Road
Creek N TributariesBarriers
Habitat 1
Habitat 2Habitat 3
Habitat 4
LEGEND

Qua and Curtis Creeks Crystal Green Nutrient Restoration Preparation Project
25
Table 6 Average percent habitat type for each habitat unit of Qua Creek.
Type of break Elevation (m) UTM Coordinates (Zone
11U) Easting Northing
Barrier 1314 489238 5472067 Confluence 1286 488950 5471770 Braiding 1291 488962 5471729
End of braiding 1281 488946 5471661 Cascades 1242 488837 5470984 Log jam 1114 487841 5470236
Table 7 Average percent habitat type for each habitat unit of Qua Creek.
Habitat Unit Interval Cascade Pool Riffle Glide 1 Barrier to confluence 60 14 32 1 2 Confluence to braiding 13 43 43 0 3 Braiding to end of braiding 3 36 43 19 4 End of braiding to cascade 22 19 41 18 5 Cascades to log jam 40 15 45 1 6 Log jam to creek mouth 14 28 56 2
Qua and Curtis Creeks Crystal Green Nutrient Restoration Preparation Project
26
Figure 14 Habitat breaks and probable Bull Trout passage barrier for Qua Creek.
Qua and Curtis Creeks Crystal Green Nutrient Restoration Preparation Project
27
Discussion
The performance measures of this project match with several priority actions identified in the Species of Interest and Rivers/Streams Action plans. These measures include: 1) conducting the assessment and inventory of focal species in order to enable future habitat restoration and conservation efforts and wise management for sustainable use of this traditional First Nations and recreational resource, and 2) conducting monitoring to enable habitat restoration or enhancement.
The discussion is structured to follow the goals from the proposal. The field work, databasing, plotting and analysis aided in determining the access options, set up long term monitoring sites for periphyton productivity within the accessible reaches, and obtained baseline water chemistry, primary productivity, benthic invertebrate and fish data throughout the growing season. With regards to all of these goals, the pilot year for the Curtis and Qua Creeks Nutrient Restoration Preparation Project was a success.
1) Determine the access options for each creek taking into consideration the potential to bring in 10kg bags of pellet fertilizer in the future.
The access was considerably more difficult for Qua creek than anticipated. The assumptions of access were based on anecdotal information and were either outdated or incorrect. Although a good forest trail roughly parallels the creek in the middle reaches, it still takes approximately 1.75 hours to hike in the electrofishing unit or any gear needed for sampling to the upper site. Access with small truck or ATV is not possible for this creek with the current low level of development in the upper watershed. If Crystal Green were to be used, helicopter drops into small openings in the upper watershed would be the easiest (depending on volume) or humans or pack animals could pack in the fertilizer. Curtis Creek had reasonable access with a logging road that became a poorly defined ATV/small truck track just before the mid-‐Curtis site. However, near the end of the field season, the ATV track was blockaded with rocks by a logging licensee meaning only foot access or mountain biking is now possible into the upper sections of Curtis Creek. These significant access constraints made the field work much more time consuming than was assumed at proposal time when it was thought that both creeks could be sampled in a single day. This issue will persist into future years of the study program given the undeveloped nature of the watersheds.
2) Set up three, long-‐term monitoring sites for algal productivity in each creek near the confluence, midway along the length of the accessible creek and near the upper end of the accessible creek.
The long term monitoring sites for primary productivity were set up in the 2015 season in order to cover the range of habitats within each creek and to balance access and representative sampling. The upper end of Qua Creek was not possible to access in a repeated way throughout the growing season as is needed for a project like this without helicopter usage so a compromise was made. The selected sites worked well for the growth study in 2015 as evidenced by the periphyton accrual during the two, 6-‐week experimental periods.

Qua and Curtis Creeks Crystal Green Nutrient Restoration Preparation Project
28
3) Obtain baseline water chemistry and primary productivity data from each creek to compare to other creeks in which fertilization has been successful at augmenting fish production and to provide a ‘before’ data series to allow statistical comparison if fertilization occurs.
Baseline water chemistry and primary productivity data were obtained which will allow comparison to other creeks that have these data in order to assess what impact the fertilization may have on Curtis and Qua Creeks should that compensation option be further explored. Once an additional (2nd) year of baseline data are collected, the nitrogen: phosphorus ratios can be assessed in comparison to other creeks in which successful mitigations using fertilizer addition, and in particular, Crystal Green addition, have been completed.
4) Obtain invertebrate community diversity (to the family level) and biomass estimates for each creek.
The Shannon diversity index ranged from 1.5 -‐ 2.2 in the two creeks and the data obtained will allow the comparison of diversity at the family level for benthic macroinvertebrates between these creeks to others in the watershed and elsewhere in the Columbia basin once additional baseline data are obtained.
5) Verify or refute the anecdotal evidence and assumption that Bull Trout spawn and rear in Curtis and Qua Creeks through backpack electrofishing sampling of the creeks. Gather relative abundance and condition data on fish captured through backpack electrofishing methods at four sites within each creek
The backpack electrofishing data show no evidence of Bull Trout spawning since only Rainbow Trout were captured in the four sites per creek that were sampled in 2015. Historically, Bull Trout may have spawned in these creeks, but it is unknown.
Recommendations
This field program was predicated on the pressing need to improve the status of Bull Trout in the Salmo River watershed and sound anecdotal evidence from biologist Pat Field that Bull Trout spawned in Qua Creek and were suspected to also spawn in Curtis Creek based on its temperature, location, and steepness. However, the backpack electrofishing program only captured one species of fish in either creek – Rainbow Trout. Although the focus of the enhancement project was on both Rainbow Trout and Bull Trout, we did not capture any Bull Trout fry or juvenile fish. It should be noted, that during the habitat analysis a series of three very mature log jams were located approximately 80 meters upstream of the Qua/Clearwater confluence that clearly would prevent Bull Trout migration into the upper reaches of Qua Creek. It also was not necessarily a surprise given the very low numbers of Bull Trout spawners in the system over the past several years; low spawner density likely means that not all spawning habitat is being utilized, so historically, these may have been Bull Trout spawning and rearing systems as would be inferred by the water temperature ranges and the type of habitat available. Water temperature is an important variable in predicting the continued success of Bull Trout and Rainbow Trout in a system and was rated as the primary indicator of physical

Qua and Curtis Creeks Crystal Green Nutrient Restoration Preparation Project
29
habitat suitability for Bull Trout in the BC Bull Trout population status report (Hagen and Decker 2011).
Recommendations emerging after the first year of this project include:
• Continue the project for 2 additional years as planned in order to obtain an assessment of variability in the productivity metrics.
• Complete a literature review of the status of the Rainbow Trout population in the Salmo River watershed and the efficacy of fertilization on enhancing Rainbow Trout populations in similar systems to ensure that the program is targeted appropriately to the species currently present.
• Investigate the potential of translocation of spawning adults or transplantation of Bull Trout eggs into suitable rearing streams which would include a review of completed genetic analyses (if any) on Bull Trout within the Columbia Basin and an assessment of potential capture and transport methods for adult Bull Trout should appropriate translocation stock be located

Qua and Curtis Creeks Crystal Green Nutrient Restoration Preparation Project
30
Acknowledgements
The authors gratefully acknowledge the financial support of the Fish and Wildlife Compensation Program that made this study possible.
The authors gratefully acknowledge the financial and field support of the Salmo Watershed Streamkeepers Society and in particular the field assistance of Tanya Chi Tran who was extremely valuable to the successful completion of this project.
Alice Nellestijn for providing safety check-‐in and field support to the project.
Garry Quist of Frank Communications Inc. provided graphic design services.
Lynn Westcott of Westcott Environmental Services for taxonomic identification of the benthic macroinvertebrates.
CARO Analytic for exemplary service in providing water chemistry and periphyton analysis.
Dr. Joe Thorley for his clear and timely analysis and plotting of periphyton and fish data and discussions of study design.
Closure
We are pleased to submit this final report for FWCP’s consideration and in completion of the project requirements.
Dr. Robyn Irvine, R.P.Bio., Fisheries Ecologist, Poisson Consulting Ltd.
Mr. Gerry Nellestijn, Fisheries Technologist, The Confluence Approach
Qua and Curtis Creeks Crystal Green Nutrient Restoration Preparation Project
31
References
Decker, S. 2010. Sheep Creek Nutrient Addition Study 2001-‐2009. A Decker and Associates Report prepared for BC Hydro, BC Hydro, Castlegar, B.C.
Environment Canada. 2012. Canadian Aquatic Biomonitoring Network Field Manual Wadeable Streams. An Environment Canada report, Dartmouth, NS.
Hagen, J. 2008. Impacts of dam construction in the upper Columbia Basin, British Columbia, on bull trout (Salvelinus confluentus) production, fisheries, and conservation status. Fish and Wildlife Compensation Program, Nelson, BC.
Hagen, J., and Baxter, J. 2004. Conservation status of Salmo River Rainbow Trout: Radio Telemetry Investigations of Habitat Use and Abundance. B.C. Hydro, Nelson, B.C.
Hagen, J., and Decker, S. 2011. The status of Bull Trout in British Columbia: A synthesis of Available Distribution, Abundance, Trend and Threat Information. Ministry of Environment, Ecosystem Protection & Sustainability Branch, Aquatic Conservation Science Section, Victoria, B.C.
Holm-‐Hansen, O., Lorenzen, C.J., Holmes, R.W., and Strickland, J.D.H. 1965. Fluorometric determination of chlorophyll. J. Cons. Int. Explor. Mer. 30: 3–15.
Kéry, M., and Schaub, M. 2011. Bayesian population analysis using WinBUGS : a hierarchical perspective. Academic Press, Boston. Available from http://www.vogelwarte.ch/bpa.html.
Nellestijn, G. 2014. Sheep Creek Fertilization Project 2013. Fish and Wildlife Compensation Program, Castlegar, B.C.
Nusch, E.A. 1980. A comparison of different methods for chlorophyll and pheopigment analysis. Ergeb. Limnol. 14: 14–36.
Parkinson, E.A., and Haas, G.R. 1996. The role of macrohabitat variables and temperature in defining the range of Bull Trout. Province of British Columbia, Vancouver, B.C.
Pellett, K. 2011. A review of twenty years of nutrient enrichment in the Salmon River watershed, Vancouver Island (1989-‐2010). Fish and Wildlife Compensation Program -‐ Coastal Region, Nanaimo, BC.
Perrin, C.J., and Richardson, J.S. 1997. N and P limitation of benthos abundance in the Nechako River, British Columbia. Canadian Journal of Fisheries and Aquatic Sciences 54(11): 2574–2583.
Plummer, M. 2003. JAGS: a program for analysis of Bayesian graphical models using Gibbs sampling. In Proceedings of the 3rd International Workshop on Distributed Statistical Computing (DSC 2003). Edited by K. Hornik, F. Leisch, and A. Zeileis. Vienna, Austria.

Qua and Curtis Creeks Crystal Green Nutrient Restoration Preparation Project
32
R Core Team. 2015. R: A Language and Environment for Statistical Computing. R Foundation for Statistical Computing, Vienna, Austria. Available from http://www.R-‐project.org/.
Thorley, J.L. 2013. jaggernaut: an R package to facilitate Bayesian analyses using JAGS (Just Another Gibbs Sampler). Poisson Consulting Ltd., Nelson, B.C. Available from https://github.com/poissonconsulting/jaggernaut.
Wickham, H. 2009. ggplot2: Elegant Graphics for Data Analysis. Springer, New York.
Wyatt, R.J. 2002. Estimating riverine fish population size from single-‐ and multiple-‐pass removal sampling using a hierarchical model. Canadian Journal of Fisheries and Aquatic Sciences 59(4): 695–706. doi:10.1139/f02-‐041.

Qua and Curtis Creeks Crystal Green Nutrient Restoration Preparation Project
33
Appendix A
Photos of Field Sites