Embed Size (px)
Citation preview

QTUG™ CASE STUDY: INDEPENDENT LIVING/SHELTERED HOUSING VERSION 2.1
DISCLAIMER - This document and all intellectual property herein is the
property of Kinesis Health Technologies and should not be copied,
reproduced or distributed without the authors permission

QTUG™ Case Study
2 Kinesis Confidential
Executive summary 16 older adults were assessed at the Circle housing facility in Tonbridge (Kent, U.K.), using the Kinesis
QTUG™ mobility and falls risk assessment tool.
QTUG™ was used to assess each patient’s risk of falls as well as to identify any mobility or gait
impairments (as compared to average values for patient’s age and gender).
Summary results for the patient cohort are provided as well as individual patient case studies.
Individual case studies highlight patients with falls risk not currently identified by current methods as
well as patients with specific mobility impairment that might suggest a propensity to fall. A suggested
falls prevention care pathway incorporating QTUG™ is also provided.
About Kinesis Founded in 2013, Kinesis Health Technologies is an award-winning Irish health technology start-up
company. Kinesis is a spin-out of University College Dublin and a large ageing research centre, the
Technology Research for Independent Living (TRIL) Centre. Its proprietary technology has been
validated as part of an extensive programme of top-tier internationally peer-reviewed research in Falls
Prevention over the past seven years.
Kinesis QTUG™, a patent protected Mobility and Falls Risk Assessment technology, is based on the
Timed Up and Go (TUG) test. Patients are instrumented with body-worn sensors to provide a
quantitative assessment of mobility. The technology provides an objective assessment of mobility, a
statistical estimate of falls risk as well as identification of mobility impairment by comparison against
a large reference population of older adults.
QTUG™ is a Class I medical device in the EU, US and Canada. It is intended for use by a range of
healthcare professionals assessing or managing falls in older people across primary, secondary and
residential care. www.kinesis.ie.

QTUG™ Case Study
3 Kinesis Confidential
Contents Executive summary ................................................................................................................................. 2
About Kinesis........................................................................................................................................... 2
Introduction ............................................................................................................................................ 3
QTUG™ case study .................................................................................................................................. 4
Results - Mobility assessment ................................................................................................................. 5
Falls risk estimate ................................................................................................................................ 5
Frailty estimate ................................................................................................................................... 5
Comparison to reference data ............................................................................................................ 6
Case studies ............................................................................................................................................ 7
Patient ID: 101 .................................................................................................................................... 7
Patient ID: 113 .................................................................................................................................... 8
Patient ID: 112 .................................................................................................................................... 8
Patient ID: 104 .................................................................................................................................. 10
Patient ID: 110 .................................................................................................................................. 10
Patient ID: 117 .................................................................................................................................. 10
QTUG™ falls care pathway .................................................................................................................... 11
Summary ............................................................................................................................................... 13
References ............................................................................................................................................ 16
Introduction Falls are the most common cause of injury and hospitalization and one of the principal causes of death
and disability in older adults worldwide8, 10. Accurate identification of patients at risk of falls could lead
to timely medical intervention, reducing the incidence of falls related injuries along with associated
costs.
Gait and mobility and one of the most prevalent falls risk factors2. Crucially gait and mobility are
modifiable risk factors in that appropriate to appropriate therapy. Studies have shown that falls
prevention intervention programmes can reduce the incidence of falls by 30-40% 2, 3. Currently there
is no fast, reliable and accurate method to assess risk of falls.
Kinesis QTUG™ can identify patients at risk of falls as well as identifying gait and mobility impairments.
QTUG™ Case Study
4 Kinesis Confidential
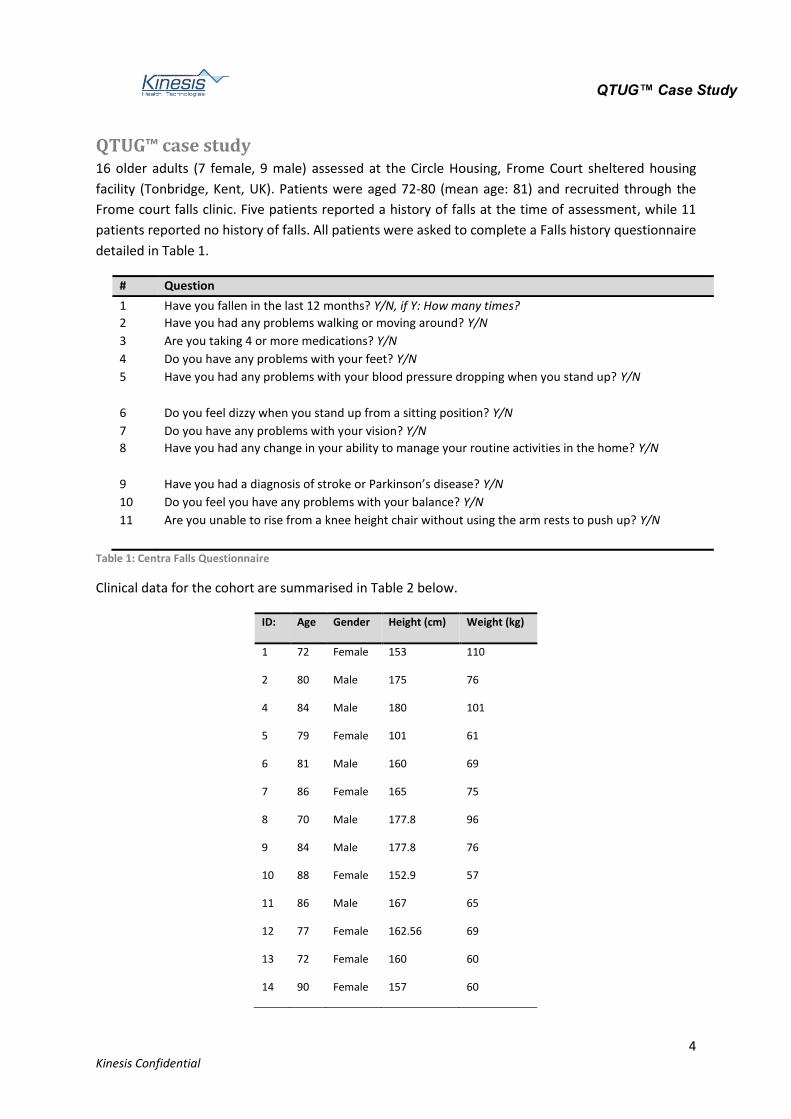
QTUG™ case study 16 older adults (7 female, 9 male) assessed at the Circle Housing, Frome Court sheltered housing
facility (Tonbridge, Kent, UK). Patients were aged 72-80 (mean age: 81) and recruited through the
Frome court falls clinic. Five patients reported a history of falls at the time of assessment, while 11
patients reported no history of falls. All patients were asked to complete a Falls history questionnaire
detailed in Table 1.
# Question
1 Have you fallen in the last 12 months? Y/N, if Y: How many times?
2 Have you had any problems walking or moving around? Y/N
3 Are you taking 4 or more medications? Y/N
4 Do you have any problems with your feet? Y/N
5 Have you had any problems with your blood pressure dropping when you stand up? Y/N
6 Do you feel dizzy when you stand up from a sitting position? Y/N
7 Do you have any problems with your vision? Y/N
8 Have you had any change in your ability to manage your routine activities in the home? Y/N
9 Have you had a diagnosis of stroke or Parkinson’s disease? Y/N
10 Do you feel you have any problems with your balance? Y/N
11 Are you unable to rise from a knee height chair without using the arm rests to push up? Y/N
Table 1: Centra Falls Questionnaire
Clinical data for the cohort are summarised in Table 2 below.
ID: Age Gender Height (cm) Weight (kg)
1 72 Female 153 110
2 80 Male 175 76
4 84 Male 180 101
5 79 Female 101 61
6 81 Male 160 69
7 86 Female 165 75
8 70 Male 177.8 96
9 84 Male 177.8 76
10 88 Female 152.9 57
11 86 Male 167 65
12 77 Female 162.56 69
13 72 Female 160 60
14 90 Female 157 60

QTUG™ Case Study
5 Kinesis Confidential
115 83 Male 182.88 69
116 84 Male 177.8 88
117 80 Male 177.8 63
Table 2: Clinical data for Frome court trial.
Results - Mobility assessment All patients were assessed using Kinesis QTUG™ falls and mobility assessment technology. Body-worn
sensors were applied to the left and right shin of each patient as they performed a Timed Up and Go
(TUG) test. The TUG test is standard mobility assessment and contains standing, walking and turning
phases9. Each patient stood from a chair, walked 3 metres, turned around, walked and to the chair
and sat back down.
The Kinesis QTUG™ technology provides a detailed assessment of patient’s standing, walking and
turning performance. An estimate of patients’ risk of having a fall as well as a comparison against a
large reference population is also provided. If the optional falls questionnaire is selected, QTUG™ will
use these data to produce an additional falls risk score. QTUG™ also produces an estimate of a patients
frailty state1, 6. The comparison against reference data is used to determine if patients have mobility
or gait impairment.
Falls risk estimate Figure 1 details how falls risk estimate (FRE) scores produced by QTUG™ should be interpreted4-6.
QTUG Falls risk estimate scores:Low risk: 0-49%Medium: 50-69%High: 70-90%Very high: >90%
QTUG Falls risk estimate scores:Low risk: 0-49%Medium: 50-69%High: 70-90%Very high: >90%
Figure 1: Interpretation of falls risk estimate scores
A suggested falls prevention care pathway based on this interpretation is provided in section “QTUG™
falls care pathway” below. Further information can be found in the Kinesis QTUG™ results
interpretation and guidance document.
The Frailty score for each patient should be interpreted in the same manner as the FRE (using Fig .1).
Frailty estimate Figure 2 details how frailty scores produced by QTUG™ should be interpreted.
QTUG™ Case Study
6 Kinesis Confidential
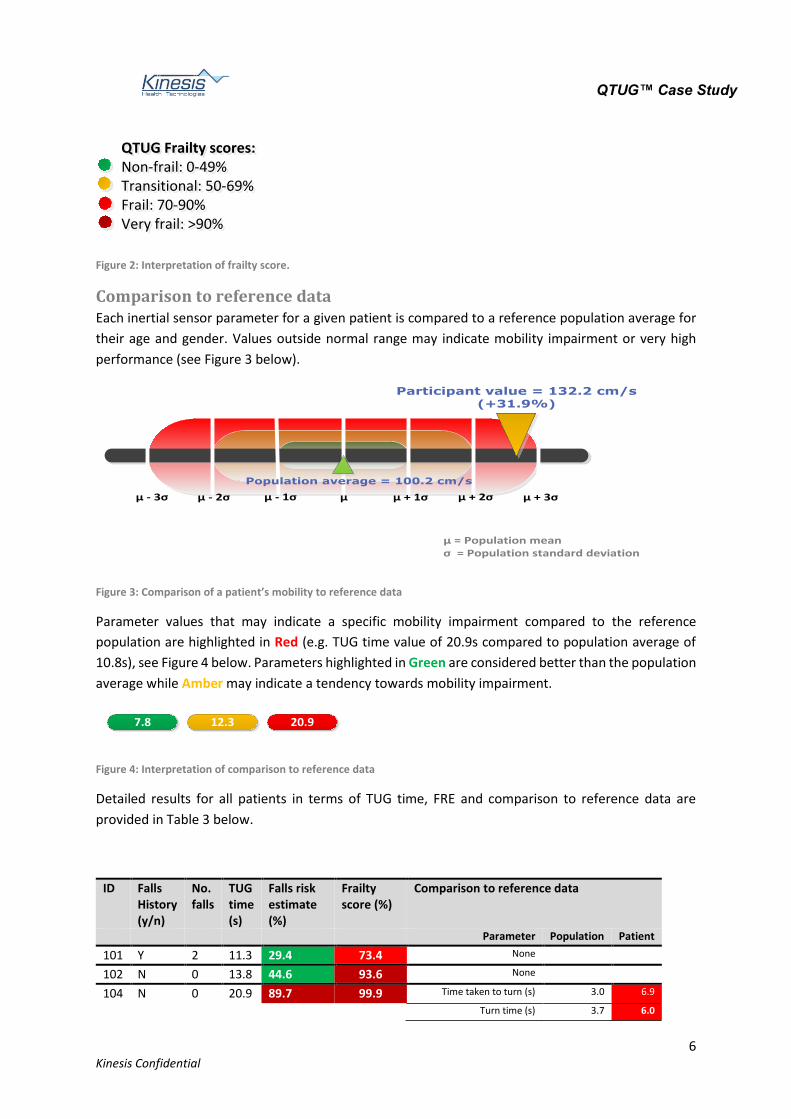
QTUG Frailty scores:Non-frail: 0-49%Transitional: 50-69%Frail: 70-90%Very frail: >90%
QTUG Frailty scores:Non-frail: 0-49%Transitional: 50-69%Frail: 70-90%Very frail: >90%
Figure 2: Interpretation of frailty score.
Comparison to reference data Each inertial sensor parameter for a given patient is compared to a reference population average for
their age and gender. Values outside normal range may indicate mobility impairment or very high
performance (see Figure 3 below).
Population average = 100.2 cm/s
Participant value = 132.2 cm/s (+31.9%)
µ = Population meanσ = Population standard deviation
µ µ + 1σ µ + 2σ µ - 2σ µ - 1σ µ - 3σ µ + 3σ
Figure 3: Comparison of a patient’s mobility to reference data
Parameter values that may indicate a specific mobility impairment compared to the reference
population are highlighted in Red (e.g. TUG time value of 20.9s compared to population average of
10.8s), see Figure 4 below. Parameters highlighted in Green are considered better than the population
average while Amber may indicate a tendency towards mobility impairment.
Figure 4: Interpretation of comparison to reference data
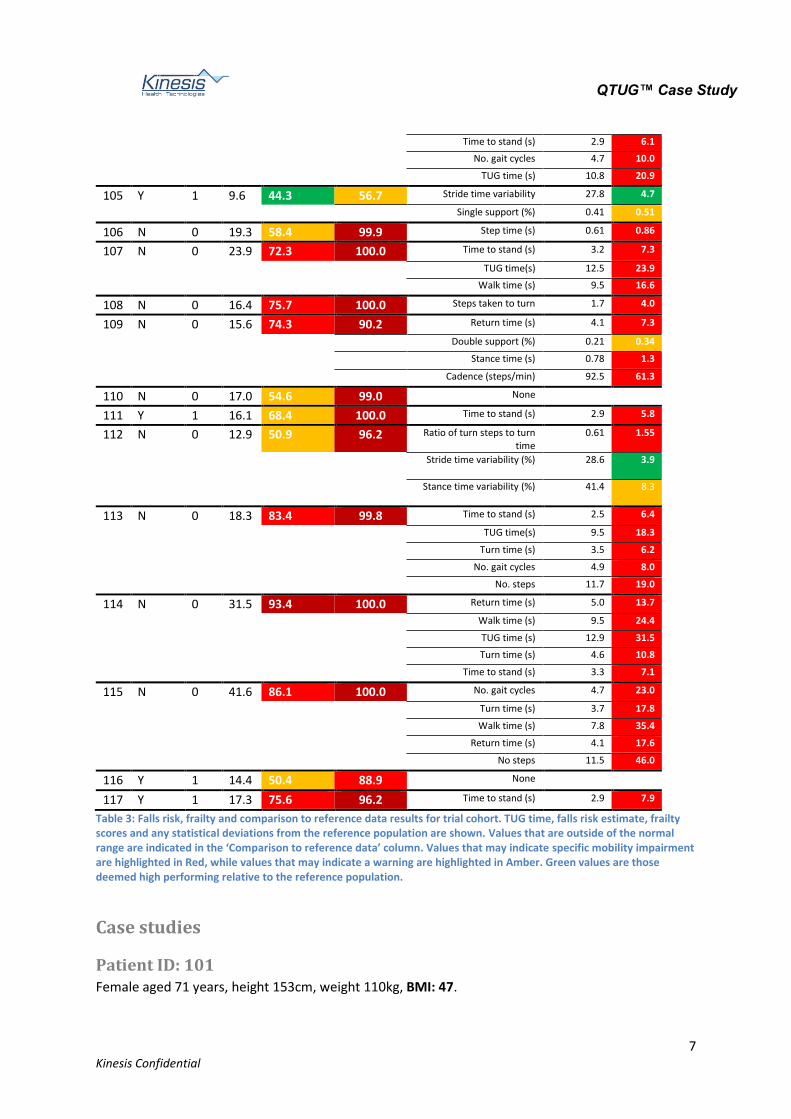
Detailed results for all patients in terms of TUG time, FRE and comparison to reference data are
provided in Table 3 below.
ID Falls History (y/n)
No. falls
TUG time (s)
Falls risk estimate (%)
Frailty score (%)
Comparison to reference data
Parameter Population Patient
101 Y 2 11.3 29.4 73.4 None
102 N 0 13.8 44.6 93.6 None
104 N 0 20.9 89.7 99.9 Time taken to turn (s) 3.0 6.9
Turn time (s) 3.7 6.0
7.8
12.3
20.9
QTUG™ Case Study
7 Kinesis Confidential
Time to stand (s) 2.9 6.1
No. gait cycles 4.7 10.0
TUG time (s) 10.8 20.9
105 Y 1 9.6 44.3 56.7 Stride time variability 27.8 4.7
Single support (%) 0.41 0.51
106 N 0 19.3 58.4 99.9 Step time (s) 0.61 0.86
107 N 0 23.9 72.3 100.0 Time to stand (s) 3.2 7.3
TUG time(s) 12.5 23.9
Walk time (s) 9.5 16.6
108 N 0 16.4 75.7 100.0 Steps taken to turn 1.7 4.0
109 N 0 15.6 74.3 90.2 Return time (s) 4.1 7.3
Double support (%) 0.21 0.34
Stance time (s) 0.78 1.3
Cadence (steps/min) 92.5 61.3
110 N 0 17.0 54.6 99.0 None
111 Y 1 16.1 68.4 100.0 Time to stand (s) 2.9 5.8
112 N 0 12.9 50.9 96.2 Ratio of turn steps to turn time
0.61 1.55
Stride time variability (%) 28.6 3.9
Stance time variability (%) 41.4 8.3
113 N 0 18.3 83.4 99.8 Time to stand (s) 2.5 6.4
TUG time(s) 9.5 18.3
Turn time (s) 3.5 6.2
No. gait cycles 4.9 8.0
No. steps 11.7 19.0
114 N 0 31.5 93.4 100.0 Return time (s) 5.0 13.7
Walk time (s) 9.5 24.4
TUG time (s) 12.9 31.5
Turn time (s) 4.6 10.8
Time to stand (s) 3.3 7.1
115 N 0 41.6 86.1 100.0 No. gait cycles 4.7 23.0
Turn time (s) 3.7 17.8
Walk time (s) 7.8 35.4
Return time (s) 4.1 17.6
No steps 11.5 46.0
116 Y 1 14.4 50.4 88.9 None
117 Y 1 17.3 75.6 96.2 Time to stand (s) 2.9 7.9
Table 3: Falls risk, frailty and comparison to reference data results for trial cohort. TUG time, falls risk estimate, frailty scores and any statistical deviations from the reference population are shown. Values that are outside of the normal range are indicated in the ‘Comparison to reference data’ column. Values that may indicate specific mobility impairment are highlighted in Red, while values that may indicate a warning are highlighted in Amber. Green values are those deemed high performing relative to the reference population.
Case studies
Patient ID: 101 Female aged 71 years, height 153cm, weight 110kg, BMI: 47.

QTUG™ Case Study
8 Kinesis Confidential
ID Falls History (y/n)
No. falls
TUG time (s)
Falls risk estimate (%)
Frailty score (%) Comparison to reference data
Parameter Population Patient
101 Y 2 11.3 29.4 73.4 None
Patient reports two falls in the past year. Patient’s TUG time is normal for age and gender. Assessment
with QTUG™ reports patient has a low falls risk and does not exhibit any mobility differences when
compared to the reference population. Patient is considered frail based on frailty score.
The results indicates that patients previous falls history does not arise from problems with gait and
mobility. Patient falls may also arise from other intrinsic factors such as cardiovascular issues (patients
has an abnormally high BMI of 47, indicating obesity and potential cardio-pulmonary issues). Patient
indicated polypharmacy (three or more prescribed medications, a known falls risk) and vision issues
(also a known falls risk).
Patient ID: 113 Female, aged 72. Height 160cm, weight 60kg.
ID Falls History (y/n)
No. falls
TUG time (s)
Falls risk estimate (%)
Frailty score (%)
Comparison to reference data
Parameter Population Patient
113 N 0 18.3 83.4 99.8 Time to stand (s) 2.5 6.4
TUG time(s) 9.5 18.3
Turn time (s) 3.5 6.2
No. gait cycles 4.9 8.0
No. steps 11.7 19.0
Patient reported no history of falls in the past year. QTUG™ reported patient as having a 83.4% risk of
fall, this is considered high falls risk. Patient was also found to be very frail. Patient was found to have
significant mobility impairment, in particular QTUG™ identified the TUG test time (TUG time) of 18.3s
(compared to population average for age and gender of 9.5. Patients’ “Time to stand” was also highly
abnormal (6.4s compared to population average of 2.5s). High “Time to Stand” values may indicate
poor lower limb strength which is a surrogate measure for core strength.
Patient ID: 112 Female aged 77. Height 162.56cm, weight 69kg. Patient reported no history of falls in the past 12
months.
ID Falls History (y/n)
No. falls
TUG time (s)
Falls risk estimate (%)
Frailty score (%)
Comparison to reference data
Parameter Population Patient
112 N 0 12.9 50.9 96.2 Ratio of turn steps to turn time
0.61 1.55
Stride time variability (%) 28.6 3.9

QTUG™ Case Study
9 Kinesis Confidential
Stance time variability (%) 41.4 8.3
QTUG reported patient’s falls risk as 50.9%, which is considered medium risk. Patient is considered to
be very frail. Patent exhibited low “stride time variability” (high stride time variability is associated
with falls7) and suggests patient walks carefully and precisely. Patient exhibited a high ratio of the
number of steps taken to turn to the time taken to turn, which may indicate problems turning. Turning
problems with otherwise normal gait may be indicative of vestibular or balance issues or lack of
confidence in turning.

QTUG™ Case Study
10 Kinesis Confidential
Patient ID: 104 Male, aged 84, height 180cm, weight 101kg.
ID Falls History (y/n)
No. falls
TUG time (s)
Falls risk estimate (%)
Frailty score (%)
Comparison to reference data
Parameter Population Patient
104 N 0 20.9 89.7 99.9 Time taken to turn (s) 3.0 6.9
Turn time (s) 3.7 6.0
Time to stand (s) 2.9 6.1
No. gait cycles 4.7 10.0
TUG time (s) 10.8 20.9
Patient reported no history of falls in the past 12 months but was deemed to be at high risk of falls by
QTUG (falls risk estimate 89.7%) and to be very frail (frailty score 99.9%). Patient exhibited difficulties
standing (Time to stand 6.1s compared to population average of 2.9s), walking (very large number of
gait cycles, 10.0 compared to population average of 4.7) and general mobility (very slow TUG test
time, 20.9s compared to average for gender of 10.8s). These results in addition to the patients
reported polypharmacy and Parkinson’s indicate the patient is extremely frail and heavily at risk of
falls, despite no previous history of falls.
Patient ID: 110 Female, aged 88, height 152.9cm, weight 57kg. Patient reported no history of falls in the past 12
months and did not report any other medical falls risk.
ID Falls History (y/n)
No. falls
TUG time (s)
Falls risk estimate (%)
Frailty score (%)
Comparison to reference data
Parameter Population Patient
110 N 0 17.0 54.6 99.0 None
QTUG™ reported patient as being at medium risk of falls (falls risk estimate: 54.6%) and very frail.
QTUG™ did not observe any potential mobility impairment (when compared to average values for age
and gender).
Patient ID: 117 Male, aged 90, weight 63kg, height 178cm. Patient reported a history of falls in the past 12 months.
ID Falls History (y/n)
No. falls
TUG time (s)
Falls risk estimate (%)
Frailty score (%)
Comparison to reference data
Parameter Population Patient
117 Y 1 17.3 75.6 96.2 Time to stand (s) 2.9 7.9

QTUG™ Case Study
11 Kinesis Confidential
QTUG™ reported patient’s risk of falls as 75.6% which is considered high. Similarly, frailty score is
96.2% which is considered very high. Patients’ “Time to stand” was 7.9s, compared to a population
average of 2.9s, indicating poor lower limb strength. Patients TUG time was 17.3s, which is also very
high. These data in addition to patients low body weight, indicate this patient is very frail, could benefit
from strength and balance training.
QTUG™ falls care pathway Figure 4 below illustrates a suggest falls prevention care pathway integrating QTUG™. The care
pathway ranges from education and recommended exercise programmes for patients considered at
low risk of falls to one-on-one assessment, tailored physiotherapy programmes as well as
home/personal monitoring for patients deemed at high risk and very high risk. Patients deemed at
medium risk receive falls prevention education as well as group exercise classes (exercise
interventions have been proven to reduce incidences falls by 30-40%3) and personal emergency
response (PERS) monitoring.

QTUG™ Case Study
12 Kinesis Confidential
All clinical personnel routinely enquire about falls
Patients assessed with QTUG by trained staff
Manage Falls risk in the community Manage Falls risk in a falls clinic
No home monitoring
No home monitoring
PERS montoring
Home monitoring
PERS montoring
Home monitoring
PERS montoring
Home/environmental safety review
Home/environmental safety review
QTUG Falls risk estimate scores:Low risk: 0-49%Medium: 50-69%High: 70-90%Very high: >90%
QTUG Falls risk estimate scores:Low risk: 0-49%Medium: 50-69%High: 70-90%Very high: >90%
QTUG comparison to reference data:· Patient value compared to population
average· Parameter values within one standard
deviation: normal· Values within two standard deviation:
within normal range· Values outside three standard
deviations: outside normal range· Values outside normal range may
indicate mobility impairment or very high performance
Sample reference data:Average TUG test time: 10.8s Average gait speed: 101.2cm/s Average number of steps in turn: 1.9 Average cadence: 95.8 steps/min
Sample reference data:Average TUG test time: 10.8s Average gait speed: 101.2cm/s Average number of steps in turn: 1.9 Average cadence: 95.8 steps/min
Population average = 100.2 cm/s
Participant value = 132.2 cm/s (+31.9%)
µ = Population meanσ = Population standard deviation
µ µ + 1σ µ + 2σ µ - 2σ µ - 1σ µ - 3σ µ + 3σ
Group strength and balance training
Medium riskLow risk
Falls prevention Education
Periodic re-assessment with
QTUG
Falls prevention Education
Periodic re-assessment with
QTUG
Prescribed Exercise programme
Prescribed Exercise programme
Vision test
Medication review
Vision test
Medication review
High risk
Falls prevention Education
Periodic re-assessment with
QTUGMulti-factorial falls
risk assessment
Vision test
Medication review
Individual strength and balance training
Prescribed Exercise programme
Very high risk
Falls prevention Education
Periodic re-assessment with
QTUGMulti-factorial falls
risk assessment
Vision test
Medication review
Individual strength and balance training
Prescribed Exercise programme
Post intervention re-assessment with
QTUG
Post intervention re-assessment with
QTUG
Figure 5: Falls prevention care pathway with Kinesis QTUG™.
QTUG™ Case Study
13 Kinesis Confidential
Summary 16 patients from a sheltered housing facility were assessed using Kinesis QTUG™ as part of a falls
prevention clinic. QTUG™ identified falls risk and mobility impairments in patients with no previous
history of falls or obvious falls risk. QTUG™ determined that all patients were clinically frail (according
to Fried’s phenotype). Taken in conjunction with a standard clinical falls risk assessment (to include a
falls questionnaire, vision test, polypharmacy etc), QTUG™ may provide greater insights into patient
falls.
QTUG™ Case Study
14 Kinesis Confidential
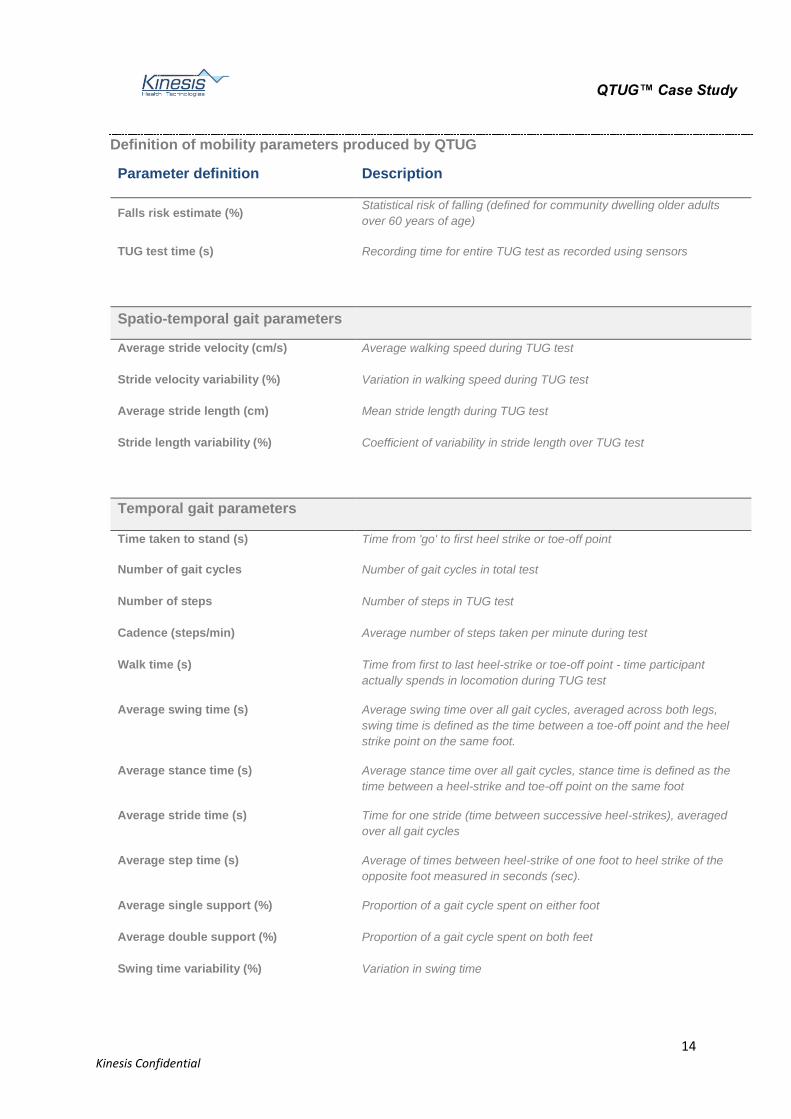
Definition of mobility parameters produced by QTUG
Parameter definition Description
Falls risk estimate (%) Statistical risk of falling (defined for community dwelling older adults
over 60 years of age)
TUG test time (s) Recording time for entire TUG test as recorded using sensors
Spatio-temporal gait parameters
Average stride velocity (cm/s) Average walking speed during TUG test
Stride velocity variability (%) Variation in walking speed during TUG test
Average stride length (cm) Mean stride length during TUG test
Stride length variability (%) Coefficient of variability in stride length over TUG test
Temporal gait parameters
Time taken to stand (s) Time from 'go' to first heel strike or toe-off point
Number of gait cycles Number of gait cycles in total test
Number of steps Number of steps in TUG test
Cadence (steps/min) Average number of steps taken per minute during test
Walk time (s) Time from first to last heel-strike or toe-off point - time participant
actually spends in locomotion during TUG test
Average swing time (s) Average swing time over all gait cycles, averaged across both legs,
swing time is defined as the time between a toe-off point and the heel
strike point on the same foot.
Average stance time (s) Average stance time over all gait cycles, stance time is defined as the
time between a heel-strike and toe-off point on the same foot
Average stride time (s) Time for one stride (time between successive heel-strikes), averaged
over all gait cycles
Average step time (s) Average of times between heel-strike of one foot to heel strike of the
opposite foot measured in seconds (sec).
Average single support (%) Proportion of a gait cycle spent on either foot
Average double support (%) Proportion of a gait cycle spent on both feet
Swing time variability (%) Variation in swing time
QTUG™ Case Study
15 Kinesis Confidential
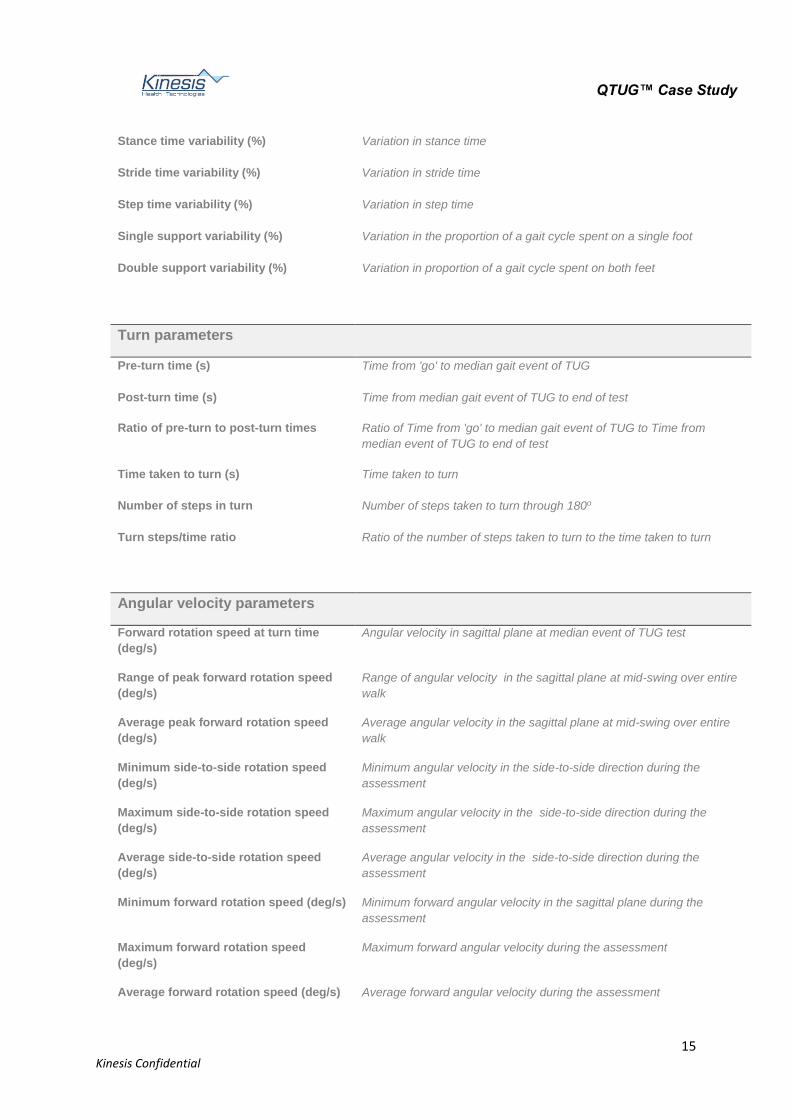
Stance time variability (%) Variation in stance time
Stride time variability (%) Variation in stride time
Step time variability (%) Variation in step time
Single support variability (%) Variation in the proportion of a gait cycle spent on a single foot
Double support variability (%) Variation in proportion of a gait cycle spent on both feet
Turn parameters
Pre-turn time (s) Time from 'go' to median gait event of TUG
Post-turn time (s) Time from median gait event of TUG to end of test
Ratio of pre-turn to post-turn times Ratio of Time from 'go' to median gait event of TUG to Time from
median event of TUG to end of test
Time taken to turn (s) Time taken to turn
Number of steps in turn Number of steps taken to turn through 180o
Turn steps/time ratio Ratio of the number of steps taken to turn to the time taken to turn
Angular velocity parameters
Forward rotation speed at turn time
(deg/s)
Angular velocity in sagittal plane at median event of TUG test
Range of peak forward rotation speed
(deg/s)
Range of angular velocity in the sagittal plane at mid-swing over entire
walk
Average peak forward rotation speed
(deg/s)
Average angular velocity in the sagittal plane at mid-swing over entire
walk
Minimum side-to-side rotation speed
(deg/s)
Minimum angular velocity in the side-to-side direction during the
assessment
Maximum side-to-side rotation speed
(deg/s)
Maximum angular velocity in the side-to-side direction during the
assessment
Average side-to-side rotation speed
(deg/s)
Average angular velocity in the side-to-side direction during the
assessment
Minimum forward rotation speed (deg/s) Minimum forward angular velocity in the sagittal plane during the
assessment
Maximum forward rotation speed
(deg/s)
Maximum forward angular velocity during the assessment
Average forward rotation speed (deg/s) Average forward angular velocity during the assessment
QTUG™ Case Study
16 Kinesis Confidential
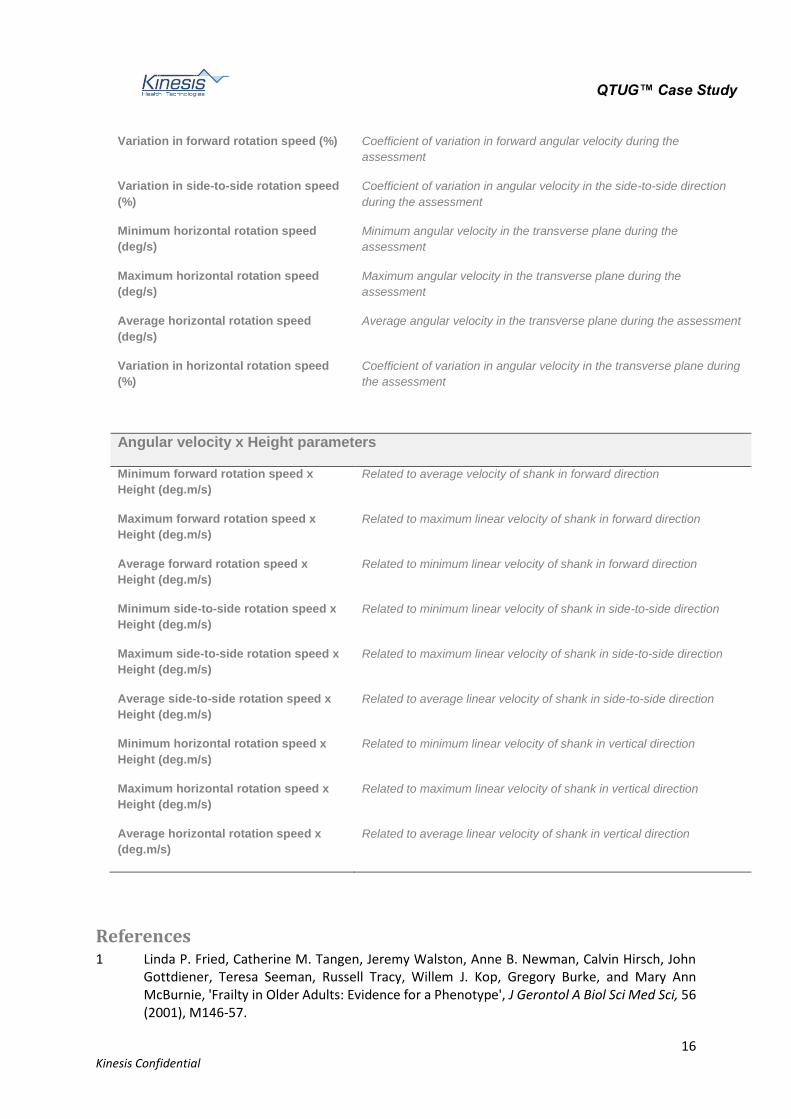
Variation in forward rotation speed (%) Coefficient of variation in forward angular velocity during the
assessment
Variation in side-to-side rotation speed
(%)
Coefficient of variation in angular velocity in the side-to-side direction
during the assessment
Minimum horizontal rotation speed
(deg/s)
Minimum angular velocity in the transverse plane during the
assessment
Maximum horizontal rotation speed
(deg/s)
Maximum angular velocity in the transverse plane during the
assessment
Average horizontal rotation speed
(deg/s)
Average angular velocity in the transverse plane during the assessment
Variation in horizontal rotation speed
(%)
Coefficient of variation in angular velocity in the transverse plane during
the assessment
Angular velocity x Height parameters
Minimum forward rotation speed x
Height (deg.m/s)
Related to average velocity of shank in forward direction
Maximum forward rotation speed x
Height (deg.m/s)
Related to maximum linear velocity of shank in forward direction
Average forward rotation speed x
Height (deg.m/s)
Related to minimum linear velocity of shank in forward direction
Minimum side-to-side rotation speed x
Height (deg.m/s)
Related to minimum linear velocity of shank in side-to-side direction
Maximum side-to-side rotation speed x
Height (deg.m/s)
Related to maximum linear velocity of shank in side-to-side direction
Average side-to-side rotation speed x
Height (deg.m/s)
Related to average linear velocity of shank in side-to-side direction
Minimum horizontal rotation speed x
Height (deg.m/s)
Related to minimum linear velocity of shank in vertical direction
Maximum horizontal rotation speed x
Height (deg.m/s)
Related to maximum linear velocity of shank in vertical direction
Average horizontal rotation speed x
(deg.m/s)
Related to average linear velocity of shank in vertical direction
References 1 Linda P. Fried, Catherine M. Tangen, Jeremy Walston, Anne B. Newman, Calvin Hirsch, John
Gottdiener, Teresa Seeman, Russell Tracy, Willem J. Kop, Gregory Burke, and Mary Ann McBurnie, 'Frailty in Older Adults: Evidence for a Phenotype', J Gerontol A Biol Sci Med Sci, 56 (2001), M146-57.

QTUG™ Case Study
17 Kinesis Confidential
2 LD Gillespie, WJ Gillespie, R Cumming, SE Lamb, and BH Rowe, 'American Geriatrics Society; British Geriatrics Society; American Academy of Orthopaedic Surgeons Panel on Falls Prevention. Guideline for the Prevention of Falls in Older Persons Interventions for Preventing Falls in the Elderly', J Am Geriatr Soc, 49 (2001), 664 - 72.
3 Robertson MC Gillespie LD, Gillespie WJ, Lamb SE, Gates S, Cumming RG, Rowe BH. , 'Interventions for Preventing Falls in Older People Living in the Community', Cochrane Database of Systematic reviews, CD007146 (2009).
4 B. R. Greene, D. McGrath, and B. Caulfield, 'A Comparison of Cross-Sectional and Prospective Algorithms for Falls Risk Assessment', in IEEE Engineering in Medicine & Biology Conference (2014), pp. 4527 - 30.
5 Barry R. Greene, Emer P. Doheny, Cathal Walsh, Clodagh Cunningham, Lisa Crosby, and Rose A. Kenny, 'Evaluation of Falls Risk in Community-Dwelling Older Adults Using Body-Worn Sensors ', Gerontology, 58 (2012), 472-80.
6 Barry R. Greene, Emer P. Doheny, Aisling O’Halloran, and Rose A. Kenny, 'Frailty Status Can Be Accurately Assessed Using Inertial Sensors and the Tug Test', Age and Ageing, 43 (2014), 406-11.
7 J. Hausdorff, D.A. Rios, and H.K. Edelberg, 'Gait Variability and Fall Risk in Community Living Older Adults: A 1-Year Prospective Study', Archives of Physical Medicine and Rehabilitation, 82 (2001), 1050-56.
8 T. Masud, and R.O. Morris, 'Epidemiology of Falls', Age Ageing, 30 (2001), 3-7. 9 D Podsiadlo, and S Richardson, 'The Timed "up & Go": A Test of Basic Functional Mobility for
Frail Elderly Persons', J Am Geriatr Soc, 39 (1991), 142-48. 10 WHO, 'Who Global Report on Falls Prevention in Older Age. ', WHO Department of Ageing and
Life Course 2007.