Embed Size (px)
Citation preview
IOSR Journal of Business and Management (IOSR-JBM)
e-ISSN: 2278-487X, p-ISSN: 2319-7668. Volume 22, Issue 10. Ser. I (October 2020), PP 12-33
www.iosrjournals.org
DOI: 10.9790/487X-2210011233 www.iosrjournals.org 14 | Page
QSR Consumer’s Essence: a cluster analysis approach
Atul Narang Title Research Scholar & Assistant Professor
Institute /Organization Research Scholar at Department of Business Administration
Faculty of Management Studies & Research Aligarh Muslim University, Aligarh- (UP) INDIA
& Dean (Student welfare) Anand Engineering College, Agra
Abstract The rise in demand of quick foods has made it a competitive ground for many players, especially several
multinational companies paved the way for their entry into several countries of the world, Schlosser, (2001).
The thought of the same was difficult in India where fresh and home cooked food is preferred and cultural
differences have been observed in response of consumers vertically as well as horizontally. But some
multinational organizations with deep pockets kept their patience for the pertinent environment, infrastructure
and studied the cultural and societal notions for such types of fast foods. To be able to meet the taste and choice
of such a diverse population was a real daunting task but greater research work and in depth knowledge paved
the way for several multinationals towards becoming the favorite taste for Indian consumers. Thus, the present
study aims at finding the preference of dimensions of service quality and level of satisfaction about QSR,
clustering techniques are used in mapping consumer’s preference with their Demographic and psychographic
profiles and have been used to segment the consumers of QSRs of Delhi and NCR through purposive and
convenience sampling of 400 consumers of which only 316 were usable. The results have led to the formation of
twelve such clusters with subtle differences in the preference of consumers. Cluster 1, 7 and 10 consists of such
respondents who are looking for tangibility factors as cues to judge the quality of QSR. Cluster 2 comprises of
consumers for which assurance or commitment to assurance is the utmost priority that QSR would be committed
to deliver perceived services. Cluster 3, 8 and 11 consumers look at the level of satisfaction more than anything
else, if they get satisfaction, they would be happier. Cluster 4 and 12 consumers get more attracted to
responsiveness at first: that is they are interested in best services. Cluster 5, 6 and 9 consumers are looking for
more reliability so that in their repeat visits same level of service quality is sure to receive.
Keywords-QSR industry, Cluster analysis, Consumer satisfaction, service quality determinants, Fast Food
Restaurants
----------------------------------------------------------------------------------------------------------------------------- ----------
Date of Submission: 25-09-2020 Date of Acceptance: 08-10-2020
----------------------------------------------------------------------------------------------------------------------------- ----------
I. Introduction In recent times there has been an increase in the outlets serving quick food and every cluster of retail
market is seen with the opening up of fast food joints in organized form or in unorganized form. Both forms of
fast foods are occupied fully in the snack time especially in the evenings. This has been witnessed in almost all
retail markets of Delhi and NCR where all such outlets formal or informal are attracting large number of
customers. All forms of fast foods are on menu and customers are availing the benefits of it either by enjoying it
there or by taking home. This trend is visually a soothing scene in metropolitan cities and catching up fast by
Tier2 cities also, serving the needs and tastes to pallets of not just urban and semi urban customers but rural
customers are also not lagging behind in setting the trends of eating out of the home and eating fast foods
(Kaynak&Marandu, 2006). The change in paradigm at national, urban, semi-urban and rural can be attributed to
lack of time as women at most of the places are also coming up for jobs and shouldering the responsibility of
partner in meeting out the expenses of the house. This can also be traced back to the betterment in the level of
education to girls and women and empowerment to women has made them stand confident with men at the
workplace. Thus the change is forced upon them to deal with things in faster manner and life has become faster
for them (Platania,&Privitera, 2005). Due to the busy life schedule and both partners working, less time is
available for cooking meals and having sumptuous breakfast (Atkins, & Bowler (2001). Easy replacement is
provided by fast foods, for working professionals as they can easily find places accessible near their office
locations, for children as they love to have different tastes along with variety and above all, affordable to all the
segments of customers. Thus many youngsters do not like to cook for long for fine dining or they don‟t like
cooking to be a regular long time activity and wanted to find a shortcut which has easily been provided by these
fast foods.

QSR Consumer’s Essence: a cluster analysis approach
DOI: 10.9790/487X-2210011233 www.iosrjournals.org 15 | Page
In our country cooking meal and serving it to the family is considered to be the prime responsibility of
lady of the house and generally a willful prohibited area for men. But with the passing of time and necessity of
both partner working culture, more men are coming to assist women at this household work and at the same
time, more often the families are opting to go for eating out, since both partners are working now, so financial
status have also improved and affordability for such choice have made its place in Indian families. So studying
this trend in urban and semi urban culture will give deeper knowledge and insights into the pulse of the
consumer and such a study will benefit marketers as well.
Trail (1994) and Key note, (2003), has pointed out on the sustaining increase in demand of quick foods
from several years globally. The rise in demand of quick foods made it a competitive ground to play for many
players into fast food sector; especially several multinational companies paved the way for their entry into
several countries of the world, Schlosser, (2001). It was tough in India where cultural resistances occur when
prepared food is consumed after so many days. To prepare to meet the taste and choice of such a diverse
population was a real daunting task but greater research work and in depth knowledge paved the way for several
multinationals towards occupying the favorite place for Indian consumers. How has all this been achieved
creates the need for such a study. Thus, current study is being conducted to find out the determinants of service
quality that customers pay attention in QSRs and to segment QSRs customers demographically and
psychographically.
II. Literature review Fast food industry is on rise constantly globally, so it has become imperative to find the factors
responsible for such growth of fast food industry. Fast food has made its entry in our country even after such a
great cultural and social diversity (Gilbert, Veloutsou, Groode&Moutinho, 2004). Globalization has made the
path of fast food easy in India and paved the way to reach to all nooks and corner of the diverse culture and
sectors of economy. Kara, et al. (1997) points out that fast foods are not restricted to geographical boundaries of
any particular country but invaded every country across the globe. Changing life style, affordability and
changing preferences of the customers are the main reasons for the growth of quick food restaurants industry
(Davies & Smith, 2004). Like in other parts of the world, QSRs industry captured the ground fast and it became
one of the growing industries in our country (Arshad M., Shamoon S., Tehseen S., Nousheen A., 2012).
Fast food is defined as foods with limited menu which is modified through technology and supply
chain close association, products such as hamburgers, pizzas, chicken or sandwiches are example in this
category,(Bender and Bender, 1995). What is the opinion of people towards fast foods whether they have
knowledge about nutritional content or not, has been the matter of study by several researchers. Perception of
fast foods in country like USA can be traced as people believe that it saves time and money and Koreans
consider fast foods as reliable source of food, Lee and Ulgado (1997). Fast foods are consumed by all age
people but it appeals most attractive to youngsters and children, Australian Division of General Practice (2003).
Pettigrew & Roberts, (2006) studied that to attract children towards the fast food, marketers have used several
techniques which not just lured the children, through providing free toys to them, also ensured the footfall
through using the influencing power of children, Raymond (2000). Reasons for the exceptionally high
acceptance and growth of fast food sector, as researched by some authors, can be the structure (franchisee
model) through which organizational entry of fast food organizations have taken place Liu and Chen (2000) and
also on development of simulation software which has increased the operational efficiency which has led to
better production and such service delivery systems which can effectively reduce the time taken in operations,
thus improving the service delivery, Church, Newman, (2000). Early growth of the segment was majorly the
effects of initial trials and lack of awareness of the methods used to prepare fast foods and what is the effect of
fast foods on the health of customers, all these factors were overlooked. But later on, more such research started
to reveal the ills effects of fast food on the health of customers. Goyal and Singh (2007) pointed out that over a
period of time people started talking about nutritional content of the fast food. They wanted more information
on the contents of the food, its nutritional value and raised their hygiene concerns towards fast foods. More and
more people getting alert on what goes inside and what makes this segment so appealing from service point of
view also. So, Min (2011) introduced this point in discussion among fast food researchers that service features
are especially critical in fast-food restaurant and customers. Demographic factors like age and gender were also
studied by Fanning, Marsh and Stiegert (2010) to find out their impact on the growth of fast food segment.
Whether the attraction of fast food is to younger generation or not, has also been the subject matter of study in
Kobayashi (2009), he also studied and found out if there is any kind of relationship exists between academic
performance of the students consuming fast food of America and Japan.
Kara et al., (1995) has formed the opinion that young American fast food consumers get attracted to it
due to features like affordable price, variety and accessibility to them, whereas he observed that Canadian
consumers are more interested in prices and new variety offered to consumers. Elderly aged consumers of fast
food get attracted to QSRs due to other features of cleanliness, quality and taste of food, whether it is prepared
QSR Consumer’s Essence: a cluster analysis approach
DOI: 10.9790/487X-2210011233 www.iosrjournals.org 16 | Page
and served hygienically or not, what are the nutritional contents which are present in this food. Canadian
consumers are more concerned with nutritional value, of course, but they are more interested in enjoying it in
nice ambience, so they are particularly looking for good seating capacity. Similar study has been taken up by
Brown et al., (2000) where he has focused that young consumer of fast food should be made aware of the
nutritional content in fast food, so that he must make informed decisions about his choice of fast foods.
Richardson and Aguir, (2003) have emphasized that the growth in this segment is mainly because of change in
tastes of consumers and globalization of taste since consumers overseas travel has increased and since these
organizations have also introduced ethnic diversity in their tastes and preferences, take away is the next reason
which has made this segment more popular. Locational advantages are the key to the success of these quick
serve foods as they choose to remain available at such convenient locations like near office places, along the
roadside outside the school, college or university, on the bus terminals, between the shopping markets, outside
the famous parks etc.(Platania and Donatella, 2003).
Nine such factors have been identified in the study made by Keynote (2003) which are contributing
towards growth of fast food joints, five such factors are from macro environment such as social development,
political growth, economic capabilities of populations, technological developments which have made this
industry to work effectively and efficiently in such a short span of time to meet the expectation of consumers,
credit goes to technological advancements to a large extent, that has made supply chain to be more responsive
and efficient, then there are such factors like ecological awareness which are making people conscious towards
their environment. Other microenvironment factors include demands from the market, influence of reference
groups, paying capacity of consumers and regulatory framework of any area.
2.1 QSR industry in India
Cullen (1994) mentioned in his study that in American culture of eating out led to the increase in
consumption of fast food along with convenience that it offered. Shetty (2002) supported the point stating that
increase in fast food consumption in India particularly is the result of choice of youngsters called demographic
dividends and improved economic status of consumers and more of females becoming empowered and
independent. Huang &Howarth (1996) study has supported that there has been structural changes, economic
changes and massive urbanization, which is the main reason for increase in the fast foods in Asian countries and
the same will be continued for more numbers of years till the time this movement is continued. Similar studies
have been conducted in Asian countries and results are also same which are showing growing trends of fast food
in India and making their ways into college and school canteens also.
Study on the growth of fast foods in India is conducted by Harsh Kumar, RajdeepPalaha and
AmandeepKaur, (2013), they worked on the fast food habits of the hostlers and also checked whether the
consumer is taking fast food with the sufficient knowledge of those fast food. Role of parents and
advertisements in promotion of fast foods was also studied. The trend of indulging in fast food consumption are
available in every level of generation and income category, the evidences of which have been observed in Asian
countries also.
2.2 Service Quality in Fast Food Restaurants Service quality variables are different in different service industries, as propagated by Cronin and
Taylor (1992) also, where he has mentioned that if high contact service industry is taken then measuring
variables are different as compared to variables under consideration in low contact services. Thus, such
literature review is taken into consideration which is concentrated on researches done in fast food context.
Lot of research studies are focusing Service quality in fast food restaurants in recent years (Min & Min,
2011). These have focused on perceived quality and customer satisfaction, in some studies behavior intention
and the interrelationships among them are discussed, (Qin &Prybutok, 2008) are of the view that previous
literature about fast food restaurants has emphasized. Brady, Robertson, & Cronin (2001) have studies customer
perceptions and their relationship to cultural differences. Kwun (2011) has considered campus dining. Ladharia,
Bruna, & Morales (2008) have talked about determinants of customer satisfaction. Michael, 2000; Min & Min
(2011) research was aimed at examining perceived quality and its relation with different forms of fast food joint
management forms, such as franchising.
Min and Min (2011) studied the service quality of fast food franchised restaurants in the United States.
It was revealed that service delivery process in fast food restaurant can be checked at several points during
service-delivery process. In that study customers perceived the taste of the food at the topmost priority attribute
of service quality in fast food restaurants. This study also worked out a correlation between the overall customer
satisfaction and a restaurant‟s word-of-mouth reputation, it comes out to be a positive correlation between the
quality of the service provided and the reputation of the restaurant or word of mouth popularity. Min & Min
(2011, p. 294) thus came out that active benchmarking as an effective way of sustaining service excellence.

QSR Consumer’s Essence: a cluster analysis approach
DOI: 10.9790/487X-2210011233 www.iosrjournals.org 17 | Page
The study of Qin and Prybutok (2008) concluded that food quality is an important factor is customer
satisfaction. This was done by using a modified SERVPERF instrument on college students of a university. The
results of this study has brought several factors of food quality and service quality in lime light, which every
marketer should pay attention. Previous studies of Kim et al. (2009), Min & Min (2011) and Qin &Prybutok
(2008) in fast food restaurants literature emphasize upon parameters such as the food quality. Service quality has
been emphasized by Heung et al.(2000), Kim et al.(2009) and Qin &Prybutok (2008). Kim et al(2009) and Qin
&Prybutok (2008) all have concluded with fact on the determinants of the perceived quality and what is its
relation with customer satisfaction, repurchase and word-of-mouth. The differences that exist between fast food
restaurants and fine dine restaurants are categorized into prompt service and low price.
Consumer satisfaction is defined by Oliver (1997) as the how fulfilled a customer is, which a consumer
is able to tell only after the consumption and deciding by the customer when he gets contented with the service.
Another author Boshoff and Gray (2004) have defined Satisfaction that it does not come with product or service,
but it depends on the customer's perceptions of the features of the product or service. Hence for the same level
of services different consumers will encounter different amount of satisfaction. Hence varying levels of
satisfaction is observed among consumers of fast food segment for the same experience (Ueltschy et al, 2007).
2.3 Need for the study Since QSR segment is characterized by presence of several players and there are very less points of
demarcation among various options in product in fast food category. This has made the industry highly
competitive and players have indulged in cut-throat competition among themselves. They are trying unique
value addition tactics to differentiate the product and services from each other. The battle is so fierce that it is
eating out the chunk of margin also in many of the fast foods products. It, thus, becomes imperative to segregate
the cluster of consumers and segment them into specific variations on basis of consumer‟spreferences so that
QSRs customers get product and service in an effective and efficient manner leading to the moments of truth for
them. This is not just going to influence the loyalty of the consumers but would also assist in maintaining long
term relationship with customers.
2.4 Objectives of the Study The objective of the study is“To identify the factors underlying service quality and consumer
satisfaction”. To segment the QSR consumers on demographic and psychographic basis through cluster analysis.
Also interpret several possible clusters in QSR industry and draw implications for marketers. Hence, the study
involves application of cluster analysis to segment the customers on the basis of the differences in their
preferences of QSRs service quality features towards the determinants of satisfaction.
III. Research Methods Research methods includes adoption of self- administered questionnaire to find out the responses of
the customers towards the determinants of quick serve food, through purposive and convenient sampling.
Research Design: Exploratory research design method is followed for the research. The data collection is
completed through Survey method. Primary data was collected through non probability sampling method,
purposive and convenient sampling was conducted for the purpose of collection of data from sampling units,
who were consumers of service at any branded QSR outlets Delhi NCR. Tool used for collecting data was
questionnaire which was being filled by researcher by asking questions to consumers face to face or sometimes
handed to consumers to fill it by themselves. A structured questionnaire consisting of demographic data in initial
questions and then 25 statements were presented to consumers on 1-5 Likert type scaleshowing variation from
strongly disagree to strongly agree. The questionnaire type was undisguised.
IV. Results and Discussions The questionnaire was administered to a total of 400 respondents who were adequately informed of the
purpose of the research and assured that their responses would be treated confidentially and only for the purpose
of academic research. In all, 316 respondents constituting 79.67 per cent of the total responded to the questions
asked and others showed no interest in filling or showed missing values in it.The study approach is quite similar
to the one adopted by Goyal and Singh (2007) where respondents who are willing to answer voluntarily were
invited to participate. Respondents included all aged customers of quick serve food offered by QSRs. The
questionnaire was divided into two parts, first to capture the demographic and psychographic profile of the
respondents and other part of the questionnaire was consisting of 25 statements on service quality and customer
satisfaction
4.1Reliability: Cronbach's Alpha method was used to check reliability scale which came out to be 0.9, which is
a good indicator of selection of questions in questionnaire. Reliability of the 25 measures used for the study is
QSR Consumer’s Essence: a cluster analysis approach
DOI: 10.9790/487X-2210011233 www.iosrjournals.org 18 | Page
0.959, which are clear indication that measures are highly reliable and consistent. Secondly, the 14 variables
were analyzed through principal components analysis (PCA) with varimax rotation. It was observed that factor
loadings are being explained upto 70% and then factors were named according to the variables where they are
showing the highest loadings. All the 25 statements related to service quality and customer satisfaction are put
into factor analysis through SPSS. The results of factor analysis showed that 25 statements could be collated to 6
factors. The results of factor analysis were taken to Hierarchical cluster .analysis
Reliability Statistics
Cronbach's Alpha N of Items
0.959 25
Table 4.1: Reliability Measure:Cronbach’s Alpha Score
4.2Kaiser – Meyer – Olkin Measures of Sampling Adequacy and Bartlett‟s Test of Sphericity, results are
shown in the table 4.2.
KMO and Bartlett's Test
Kaiser-Meyer-Olkin Measure of Sampling Adequacy. 0.962
Bartlett's Test of Sphericity Approx. Chi-Square 16003.143
Df 300
Sig. 0.000
Table 4.2: Kaiser – Meyer – OlkinTest Score
Kaiser – Meyer – Olkin Test is applied to check the normality of data and whether the data is adequate
for application of quantitative statistical measures or not. Chawlaand Sondhi, (2011) has suggested that if the
value of KMO lies between 0.5 to 1 then it can be said that data is normally distributed,the table 4.2 shows that
the measure have value greater than the 0.5 hence it can be concluded that data is adequate and can be used as
input for factor analysis.
Whether item-to-item correlation matrix was an identity matrix was checked through null hypotheses
through application of Bartlett‟s Test of Sphericity (Roy, 2017). Chi- Square test is applied to test the
hypothesis,the value of Chi- Square test for service quality and customer satisfaction (16003.143) is found to be
significant at 0% level of significance.
4.3Factor Analysis: Principle component factor analysis with varimax rotation was applied to find out the
underlying factors of the questionnaire. The factor analysis for service quality resulted in 5 factors of service
quality and one factor of customer satisfaction and thus a total of 6 factors were obtained. The details about
factors of service quality and customer satisfaction, Eigen value andfactor loadings and Rotated sums of square
loadings are shown in Table 4.3, which shows that there are six factors with Eigen value more than one. Eigen
values are used to explain the % of variance explained. As there are 25 variables, total variance equal to 77%
and variance shown by each factor is also represented in Table 4.3 where factor one represents 50% of variance,
factor 2 and 3 are responsible for 6 and 5% variance respectively. Factor 4, 5 and 6 are contributing 5, 4 and 4 %
of variance.
Total Variance Explained
Component
Initial Eigenvalues Extraction Sums of Squared Loadings Rotation Sums of Squared
Loadings
Total
% of
Variance
Cumulative
% Total
% of
Variance
Cumulative
% Total
% of
Variance
Cumulative
%
1 12.614 50.457 50.457 12.614 50.457 50.457 3.675 14.702 14.702
2 1.628 6.514 56.970 1.628 6.514 56.970 3.633 14.531 29.233
3 1.422 5.689 62.659 1.422 5.689 62.659 3.276 13.106 42.339
4 1.313 5.250 67.910 1.313 5.250 67.910 3.236 12.946 55.284
5 1.182 4.730 72.639 1.182 4.730 72.639 3.069 12.276 67.560
6 1.059 4.237 76.877 1.059 4.237 76.877 2.329 9.316 76.877
7 0.465 1.859 78.736
8 0.430 1.719 80.455
9 0.409 1.636 82.090

QSR Consumer’s Essence: a cluster analysis approach
DOI: 10.9790/487X-2210011233 www.iosrjournals.org 19 | Page
Table 4.3 Principal Component Analysis
Communalities an indicator of how much of each variable is accounted for by the underlying factors
taken together. It is said to be a measure of percentage of variable‟s variation that is explained by the factors.
When there a comparatively high value of communality it is an indicator that there is not much of variable is left
over after whatever the factors represent has already taken into consideration. The table of communalities is
presented in Table 4.4 in Annexure-3. The table shows that no measure is less than 0.6 communality, which
means not much of the measure valueis left over after taking this much into account in factors.
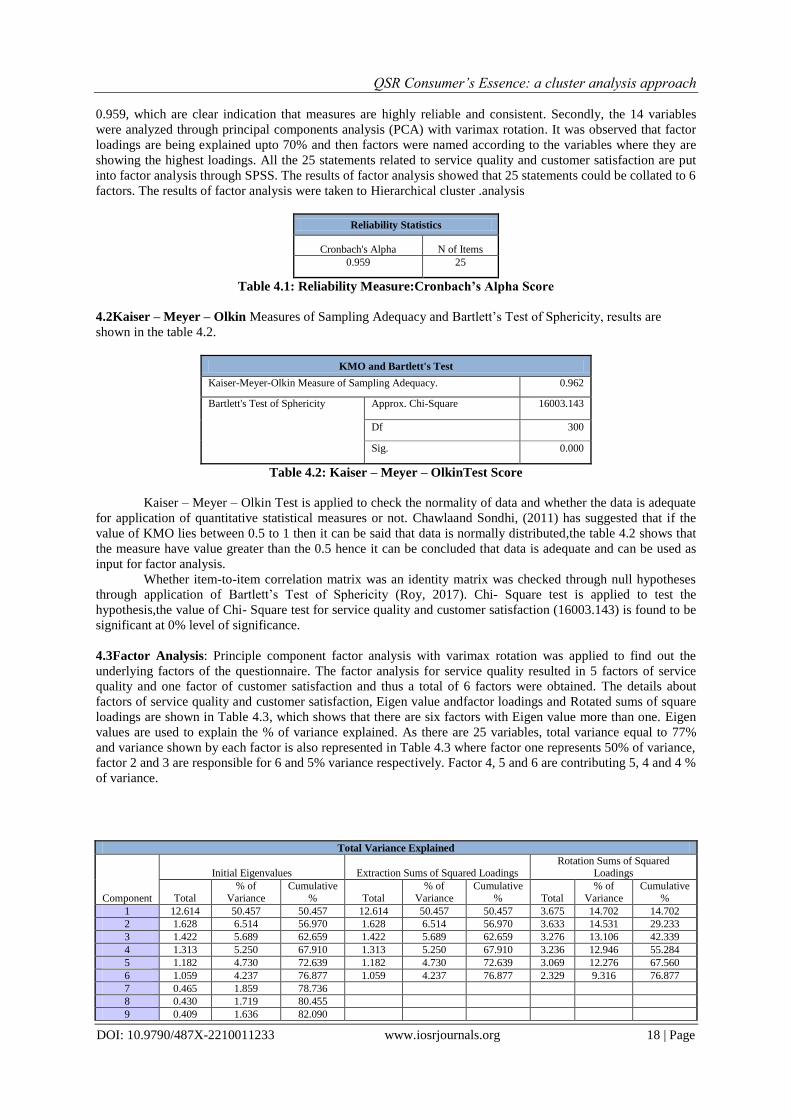
Factor rotation is the approach which is undertaken to interpret factor loading matrix called component
matrix. The first factor comprising of statements of empathy, second factor is resulted from measures of
reliability, similarly, third factor is the outcome of measures of responsiveness, fourth factor has measures from
assurance, fifth factor consists of measures of tangibility and sixth one is from customer satisfaction.Value of
0.6 is taken as cut off point, the results of rotated component matrix are depicted in table 4.5, which is
representing high factor loading of Empathy on Factor one. Factor two has high loadings for Reliability and
Factor three has high loadings for Responsiveness. Similarly, Factor four, five and six has high loadings for
variables assurance, Tangibility and customer satisfaction respectively.
Rotated Component Matrixa
Component
1 2 3
4 5 6
QSR employees are able to provide individual
attention
EM
PA
TH
Y
0.79
Customers get individual attention in this QSR 0.79
QSRs staff understands the need of their customers 0.74
QSR employees are bale to serve customers „best
interest at heart‟
0.72
QSR has convenient operating hours 0.67
QSR provides service at the promised time
RE
LIA
BIL
ITY
0.76
QSR staff serves food on promised time 0.76
QSR has always given dependable and consistent
timely service
0.72
QSR has error free service order 0.69
QSR staff is sympathetic and reassuring on every
demand of customer
0.69
QSR staff is always willing to help customers
RE
SP
ON
SIV
EN
ES
S
0.81
QSR staff conveys the customer exactly when
services will be provided
0.81
QSR provides the prompt service 0.75
QSR staff is never too busy to respond to customer
request promptly
0.74
Staff gets adequate support from QSR to do their job well AS
S
UR
A
NC
E
0.79
10 0.383 1.531 83.621
11 0.370 1.480 85.101
12 0.349 1.398 86.499
13 0.334 1.337 87.837
14 0.314 1.255 89.091
15 0.299 1.196 90.287
16 0.294 1.177 91.464
17 0.273 1.092 92.556
18 0.262 1.050 93.606
19 0.256 1.025 94.630
20 0.252 1.010 95.640
21 0.233 0.931 96.571
22 0.230 0.919 97.490
23 0.227 0.909 98.399
24 0.212 0.849 99.248
25 0.188 0.752 100.000
Extraction Method: Principal Component Analysis.
QSR Consumer’s Essence: a cluster analysis approach
DOI: 10.9790/487X-2210011233 www.iosrjournals.org 20 | Page
QSR is able to pass on the feeling of being safe 0.78
QSR is able to provide comfortable and confident
feeling
0.78
QSR staff is very polite and courteous 0.77
QSR has visually appealing physical facilities
TA
NG
IBIL
ITY
0.79
QSR has décor and materials associated with best
services
0.76
QSR has visually attractive dining area with modern
and up to date facilities
0.74
QSR staff is neat well dresses and visually appealing 0.72
This QSR is always my first choice
CU
ST
OM
ER
SA
TIS
FA
CT
ION
0.77
Overall I am satisfied with the quality of services
provided at this QSR
0.77
I would certainly recommend this QSR to my friend 0.75
Extraction Method: Principal Component Analysis. Rotation Method: Varimax with Kaiser Normalization.
Table 4.5 Rotated Component matrix
Labeling or naming the factors is not a tedious task here as most of factors have clear cut loadings of
same measures which were used in standardized form by Cronin (2000), which include Empathy, Tangibility,
Reliability, Responsiveness and Assurance and sixth factor is loaded with variable of customer satisfaction.
4.4 Cluster Analysis
The results which came from factor analysis were taken into consideration for their use as inputs in the
hierarchical cluster analysis. This helps in judgingthe number of expected clusters by the use of average linkage
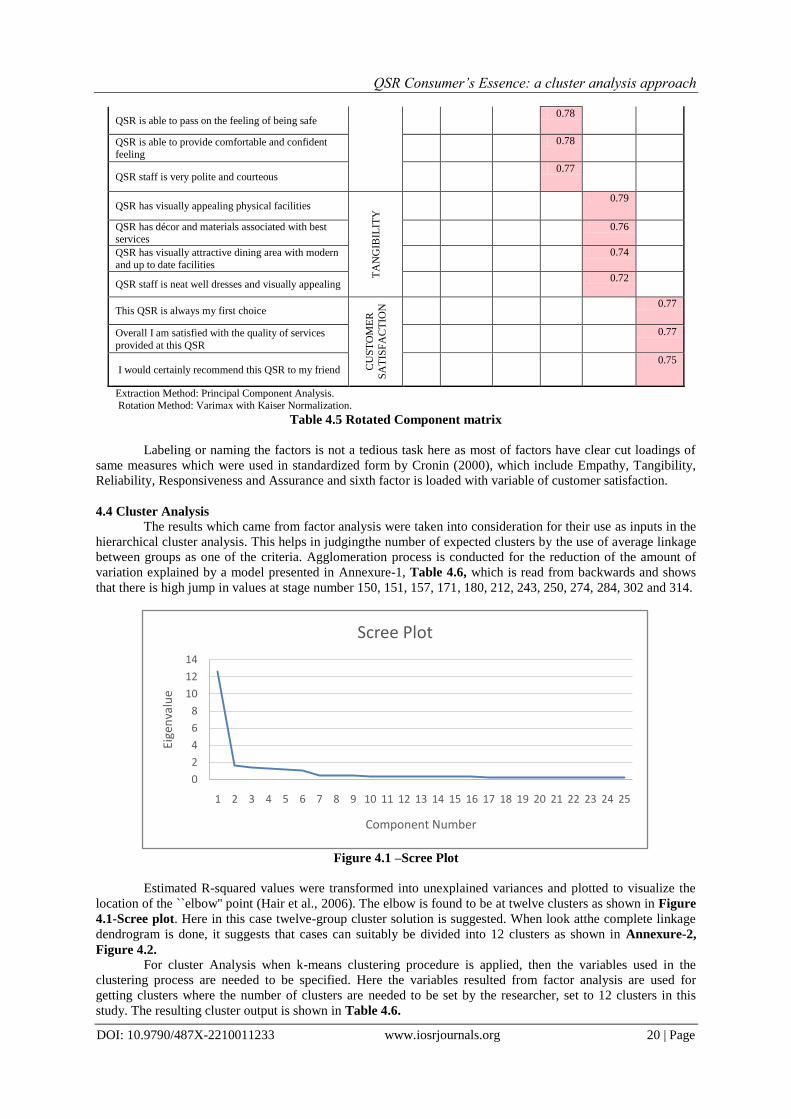
between groups as one of the criteria. Agglomeration process is conducted for the reduction of the amount of
variation explained by a model presented in Annexure-1, Table 4.6, which is read from backwards and shows
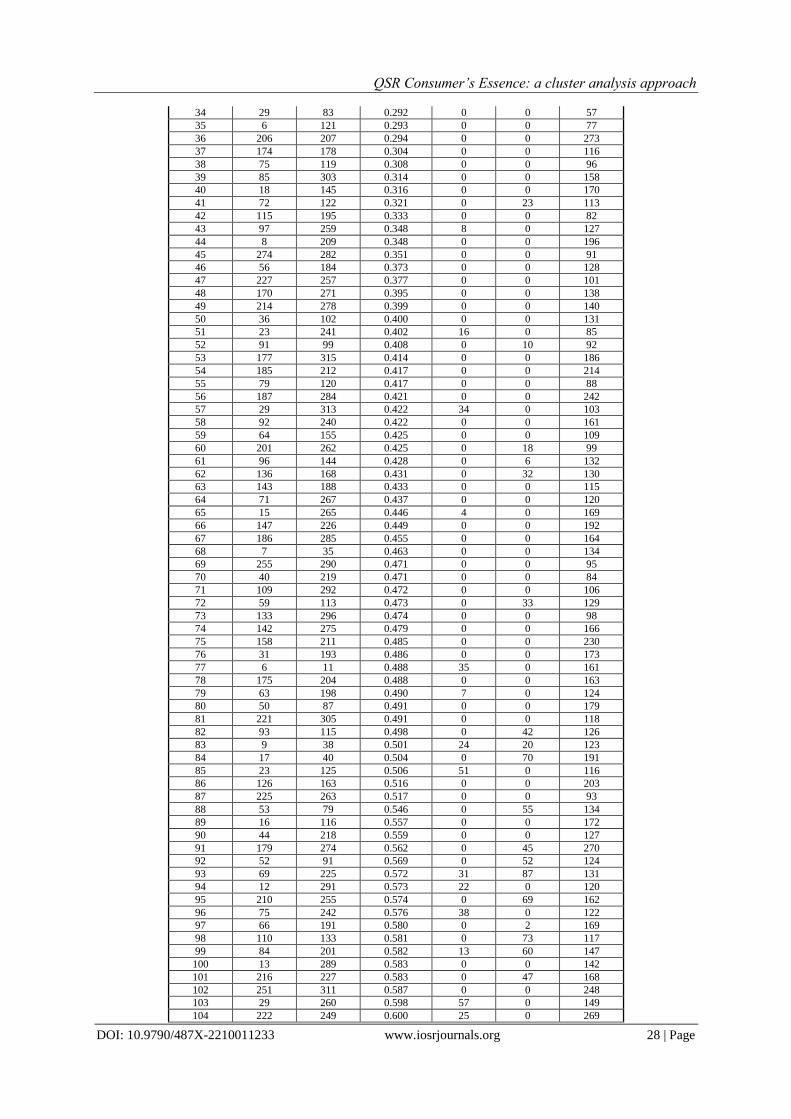
that there is high jump in values at stage number 150, 151, 157, 171, 180, 212, 243, 250, 274, 284, 302 and 314.
Figure 4.1 –Scree Plot
Estimated R-squared values were transformed into unexplained variances and plotted to visualize the
location of the ``elbow'' point (Hair et al., 2006). The elbow is found to be at twelve clusters as shown in Figure
4.1-Scree plot. Here in this case twelve-group cluster solution is suggested. When look atthe complete linkage
dendrogram is done, it suggests that cases can suitably be divided into 12 clusters as shown in Annexure-2,
Figure 4.2.
For cluster Analysis when k-means clustering procedure is applied, then the variables used in the
clustering process are needed to be specified. Here the variables resulted from factor analysis are used for
getting clusters where the number of clusters are needed to be set by the researcher, set to 12 clusters in this
study. The resulting cluster output is shown in Table 4.6.
0
2
4
6
8
10
12
14
1 2 3 4 5 6 7 8 9 10 11 12 13 14 15 16 17 18 19 20 21 22 23 24 25
Eige
nva
lue
Component Number
Scree Plot
QSR Consumer’s Essence: a cluster analysis approach
DOI: 10.9790/487X-2210011233 www.iosrjournals.org 21 | Page
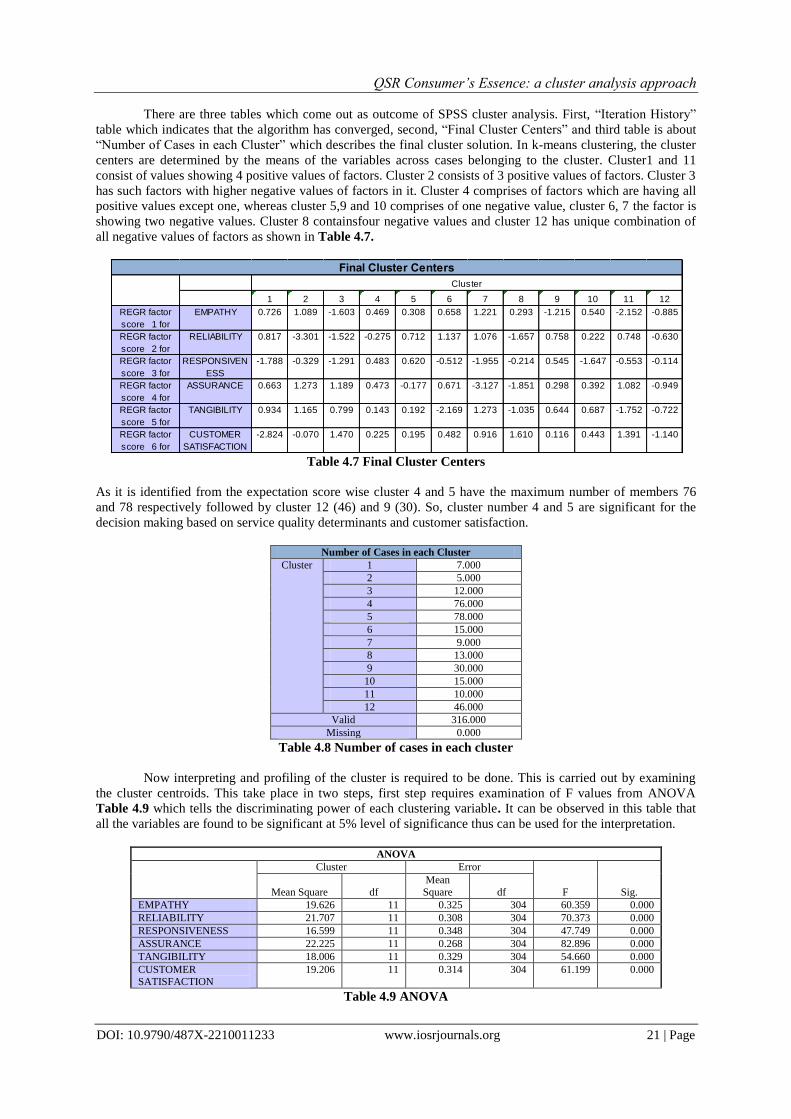
There are three tables which come out as outcome of SPSS cluster analysis. First, “Iteration History”
table which indicates that the algorithm has converged, second, “Final Cluster Centers” and third table is about
“Number of Cases in each Cluster” which describes the final cluster solution. In k-means clustering, the cluster
centers are determined by the means of the variables across cases belonging to the cluster. Cluster1 and 11
consist of values showing 4 positive values of factors. Cluster 2 consists of 3 positive values of factors. Cluster 3
has such factors with higher negative values of factors in it. Cluster 4 comprises of factors which are having all
positive values except one, whereas cluster 5,9 and 10 comprises of one negative value, cluster 6, 7 the factor is
showing two negative values. Cluster 8 containsfour negative values and cluster 12 has unique combination of
all negative values of factors as shown in Table 4.7.
Table 4.7 Final Cluster Centers
As it is identified from the expectation score wise cluster 4 and 5 have the maximum number of members 76
and 78 respectively followed by cluster 12 (46) and 9 (30). So, cluster number 4 and 5 are significant for the
decision making based on service quality determinants and customer satisfaction.
Number of Cases in each Cluster
Cluster 1 7.000
2 5.000
3 12.000
4 76.000
5 78.000
6 15.000
7 9.000
8 13.000
9 30.000
10 15.000
11 10.000
12 46.000
Valid 316.000
Missing 0.000
Table 4.8 Number of cases in each cluster
Now interpreting and profiling of the cluster is required to be done. This is carried out by examining
the cluster centroids. This take place in two steps, first step requires examination of F values from ANOVA
Table 4.9 which tells the discriminating power of each clustering variable. It can be observed in this table that
all the variables are found to be significant at 5% level of significance thus can be used for the interpretation.
ANOVA
Cluster Error
F Sig. Mean Square df
Mean
Square df
EMPATHY 19.626 11 0.325 304 60.359 0.000
RELIABILITY 21.707 11 0.308 304 70.373 0.000
RESPONSIVENESS 16.599 11 0.348 304 47.749 0.000
ASSURANCE 22.225 11 0.268 304 82.896 0.000
TANGIBILITY 18.006 11 0.329 304 54.660 0.000
CUSTOMER SATISFACTION
19.206 11 0.314 304 61.199 0.000
Table 4.9 ANOVA
1 2 3 4 5 6 7 8 9 10 11 12
REGR factor
score 1 for
EMPATHY 0.726 1.089 -1.603 0.469 0.308 0.658 1.221 0.293 -1.215 0.540 -2.152 -0.885
REGR factor
score 2 for
RELIABILITY 0.817 -3.301 -1.522 -0.275 0.712 1.137 1.076 -1.657 0.758 0.222 0.748 -0.630
REGR factor
score 3 for
RESPONSIVEN
ESS
-1.788 -0.329 -1.291 0.483 0.620 -0.512 -1.955 -0.214 0.545 -1.647 -0.553 -0.114
REGR factor
score 4 for
ASSURANCE 0.663 1.273 1.189 0.473 -0.177 0.671 -3.127 -1.851 0.298 0.392 1.082 -0.949
REGR factor
score 5 for
TANGIBILITY 0.934 1.165 0.799 0.143 0.192 -2.169 1.273 -1.035 0.644 0.687 -1.752 -0.722
REGR factor
score 6 for
analysis 1
CUSTOMER
SATISFACTION
-2.824 -0.070 1.470 0.225 0.195 0.482 0.916 1.610 0.116 0.443 1.391 -1.140
Final Cluster Centers
Cluster

QSR Consumer’s Essence: a cluster analysis approach
DOI: 10.9790/487X-2210011233 www.iosrjournals.org 22 | Page
In the next step each cluster is to be looked for the values which are higher in it which are presented in Table
4.10 Cluster
number
Factor
numbers
Specifications of segment Description
1 5, 2,1 Tangibility, Reliability, Empahty Tangible Cues about quality of QSR, Repeat
visitand care seeker
2 4,5,2 Assurance, Reliability and Tangibility Commitment from QSR staff, attractive QSR, regular commitment, tangible cues and repeat visit
seeker
3 6,4,5 Customer satisfaction, assurance and
Tangibility
Satisfaction seeking, commitment from QSR staff,
Tangible cues seeker
4 3,4,1 Responsiveness, Assurance and
Empathy
Responsive service expectation, trust in transection,
commitment and care seeker
5 2,3,1 Reliability, Tangibility and
Responsiveness
Reliability, Responsiveness and Empathy,Regular,
good service and care seeker
6 2,1,4 Reliability, Empathy and Assurance Regular visit, care and trust seeker
7 5,1,2 Tangibility, Empathy and Reliability Good ambience as cues, care seeker and regular
visitor
8 6,1 Customer satisfaction and empathy Satisfaction through care giving nature
9 2,5,3 Reliability, Tangibility and
Responsiveness
Repeat going, Cues Believing and response seeking
10 5,1,6 Tangibility, Empathy and customer
satisfaction
Cues, concern and satisfaction seeker
11 6,4,2 Satisfaction, Assurance and Reliability Satisfaction, Commitment and Repeat seeker
12 3 Responsiveness Quick Response seeker
Table 10 Descriptions of clusters
QSR industry is characterized to serve customers quickly, which has evolved over time due to the
efficient utilization of technology and its up gradation from time to time to take best use of it in reducing the
preparation time, serving time and this has assisted in standardization of several tasks in QSR. Robust supply
chain, technology based infrastructure in storing half cooked and half-baked foods, minimum human
intervention, trained manpower and optimal service process has made QSR industry to flourish and multiply
exponentially. QSR offer not many barriers to entry, hence so many multinational companies and Indian
companies have also jumped into bandwagon making the battle all the fiercer. There is not much differentiation
that can be offered to product and services offered with quick serve foods are bare optimum. Thus, segmenting
the customers is the primary objective for all the marketers in quick serve industry. This study is an attempt to
identify demographic and psychographic factors that have crucial effect on the customer satisfaction for quick
food segment. Hence, the attempt to first identify which measures of service quality are most influential in quick
serve food and then clustering the cases of customers on the basis of identified measures, has resulted in twelve
varied clusters of customers with minor differences in their choice of service quality measures. Clusters have
also been framed on the basis of demography and psychographic of consumers, the primary step for doing such
cluster analysis, is first to create the clusters and then visualize that these can be developed in a way so that they
can be considered as market segments. In this study to meet this purpose, expectation wise the entire set of
consumers are divided into twelve clusters. The name of the psychographic segments are as follows:Cues,
Repeat and care seeker, Commitment, cues and repeat seeker, Satisfaction, commitment and cues seeker,
Service, commitment and care seeker, Regular, service and care seeker, Regular, care and trust seeker, Cues,
care and repeat seeker, Satisfaction through care giving nature, Repeat going, Cues and response seeking, Cues,
concern and satisfaction seeker, Satisfaction, Commitment and Repeat seeker and Quick Response seeker.
Members of each of these clusters are also identified in the research. It is also proved in the research
that ―there is significant association between clusters based on expectation of the customers and with some of
the demographic factors like ―Household monthly income and ―Gender of the respondents. So it can be
conclude that there are twelve psychographic segments in QSR quality service expectations in Delhi and NCR
and these psychographic segments have significant association with some of the demographic segments, namely
―Age, Education, Monthly household income, occupation, Marital Status, Gender, Visit frequency.
4.5 Demographic and psychographic segmentation
The respondents were from different age groups as show in Figure-4.3, young students below 20 years
of age, office going males and females of age group 21-30, middle aged consumers with age groups 31-40, and
there were consumers above 40 years of age, thus falling in more than 40 categories. Profiling of consumers can
be done on the basis of demographic and psychographic clustering, which shows that in cluster 4 and 5 highest
number of consumers are of 21-30 years of age who don‟t have time and they are actually seeking faster service

QSR Consumer’s Essence: a cluster analysis approach
DOI: 10.9790/487X-2210011233 www.iosrjournals.org 23 | Page
and commitment by service provider that same type of faster service should be there at every time. They are also
expecting concern of service providers towards taking care of customers and paying attention to their needs in
personalized way.
Figure 4.3 Cluster Profile Age
Respondents with graduation as their education background are majorly a part of cluster number 4 and
5, same applies with cluster number 9 and 12 respondents also. Similar trends are observed in post graduate
respondents also where high concentration is observed of 4, 5, 9 and 12 cluster respondents for which
Responsiveness, Assurance and Empathy and Reliability, Tangibility and Responsiveness is the order of
priority.
Figure 4.4 Cluster Profile Education Status
The representation of males and females is there in every cluster in in more or less equal proportion but
here again cluster 4 and 5 whose characteristics are those individuals who don‟t have time and they are actually
seeking faster service and commitment by service provider that same type of faster service should be there at
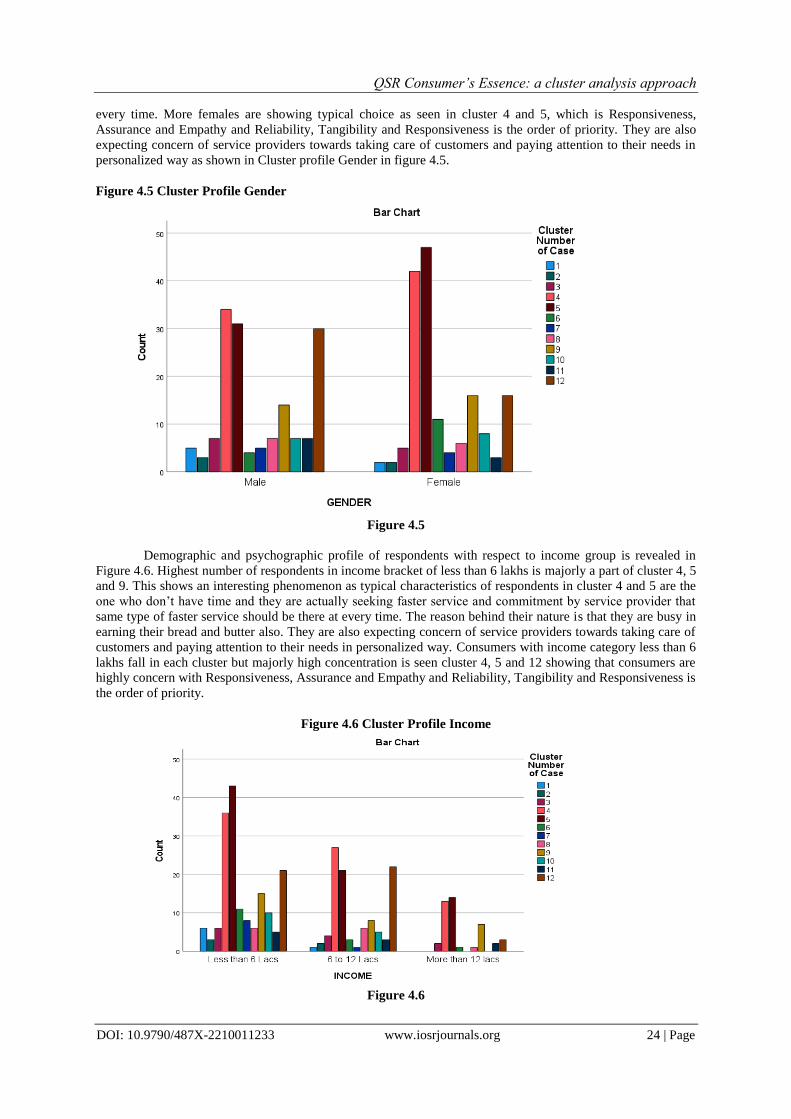
QSR Consumer’s Essence: a cluster analysis approach
DOI: 10.9790/487X-2210011233 www.iosrjournals.org 24 | Page
every time. More females are showing typical choice as seen in cluster 4 and 5, which is Responsiveness,
Assurance and Empathy and Reliability, Tangibility and Responsiveness is the order of priority. They are also
expecting concern of service providers towards taking care of customers and paying attention to their needs in
personalized way as shown in Cluster profile Gender in figure 4.5.
Figure 4.5 Cluster Profile Gender
Figure 4.5
Demographic and psychographic profile of respondents with respect to income group is revealed in
Figure 4.6. Highest number of respondents in income bracket of less than 6 lakhs is majorly a part of cluster 4, 5
and 9. This shows an interesting phenomenon as typical characteristics of respondents in cluster 4 and 5 are the
one who don‟t have time and they are actually seeking faster service and commitment by service provider that
same type of faster service should be there at every time. The reason behind their nature is that they are busy in
earning their bread and butter also. They are also expecting concern of service providers towards taking care of
customers and paying attention to their needs in personalized way. Consumers with income category less than 6
lakhs fall in each cluster but majorly high concentration is seen cluster 4, 5 and 12 showing that consumers are
highly concern with Responsiveness, Assurance and Empathy and Reliability, Tangibility and Responsiveness is
the order of priority.
Figure 4.6 Cluster Profile Income
Figure 4.6

QSR Consumer’s Essence: a cluster analysis approach
DOI: 10.9790/487X-2210011233 www.iosrjournals.org 25 | Page
Segmentation of consumers on the basis of frequency of visit reveals that frequent visitors to QSR are
present in every cluster but again cluster number 4 and 5 comprise of more of such type of people who are more
frequently going for eating out in QSR as shown in figure 4.7.Visit frequency of respondents show high
concentration towards 2 and 4 days in a month, here also cluster number 4 and 5 have shown typical behavior as
captured in figure 4.7.
Figure 4.7
Marital status of the respondents when compared with customer satisfaction, it was found that
respondents have proportionate spread in all the clusters in both married and Unmarried category but specially
cluster 4 and 5 and 12 are typically consisting of large chunk of unmarried respondents as shown in figure 4.8.
Figure 4.8
The respondents are showing wide spread among all clusters but peaks in all different type of
profession is seen in cluster number 4 and 5 followed by cluster number 12 among students. Respondents in
government service show resemblance to cluster 4, 5, 9 and 12. Respondents in private service typically show
resemblance to cluster 4, 5, 9, 10 and 12 and business professionals again show resemblance to 4,5,8,9 and 12
clusters. Professional consumers are generally a part of cluster 4 and 5 type of groups as shown in Figure 4.9.

QSR Consumer’s Essence: a cluster analysis approach
DOI: 10.9790/487X-2210011233 www.iosrjournals.org 26 | Page
Figure 4.9
V. Conclusion and managerial implications Quick serve restaurants consumers can be classified into twelve different types with some major and
some minor differences among them. These have also been grouped into demographic and psychographic
segments. It is also found that these demographic and psychographic segments have significant association with
clustered consumer characteristics.
This study can provide important direction to the players planning to enter in quick serve segment and
to those who are already a player in this market. The market appears to be attractive for outside marketers as it
appears to offer good margin on the products with minimal amount of services but it is very complicated in
terms of understanding the expectation of the customers, meeting out their expectation with limited amount of
time and extending feeling of personalized services, which has become very critical with more and more players
entering into the segment.
References [1]. Atkins, P., & Bowler, I. (2001). Food Habits, Beliefs and Taboos. Food in Society: Economy, Culture, Geography, 296-310.
[2]. Australian general practice. Australian Family Physician, 32(3), 180. [3]. Bender, W. R., Gruhl, D., & Morimoto, N. (1995, March). Techniques for data hiding. In Storage and Retrieval for Image and
Video Databases III (Vol. 2420, pp. 164-173). International Society for Optics and Photonics.
[4]. Blades, M., & Kobayashi, F. (2009). Academic achievement, BMI, and fast food intake of American and Japanese college students. Nutrition & Food Science.
[5]. Boshoff, C., and Gray, B. (2004). The Relationships between Service Quality, Customer Satisfaction and Buying Intentions In the
Private Hospital Industry. South African Journal of Business Management, 35(4), 27–37. [6]. Brady, M. K., Robertson, C. J., & Cronin, J. J. (2001). Managing behavioral intentions in diverse cultural environments: An
investigation of service quality, service value, and satisfaction for American and Ecuadorian fast-food customers. Journal of
International Management, 7(2), 129-149. [7]. Brown, K., McIlveen, H., &Strugnell, C. (2000). Nutritional awareness and food preferences of young consumers. Nutrition &
Food Science.
[8]. Chawla, D., &Sodhi, N. (2011). Research methodology: Concepts and cases. Vikas Publishing House. [9]. Church, I., & Newman, A. J. (2000). Using simulations in the optimisation of fast food service delivery. British Food Journal.
[10]. Crawford, B., Byun, R., Mitchell, E., Thompson, S., Jalaludin, B., &Torvaldsen, S. (2017). Socioeconomic differences in the cost,
availability and quality of healthy food in Sydney. Australian and New Zealand journal of public health, 41(6), 567-571. [11]. Cronin Jr, J. J., & Taylor, S. A. (1992). Measuring service quality: a reexamination and extension. Journal of marketing, 56(3), 55-
68.
[12]. Cronin, J. J., Brady, M. K., and Hult, G. (2000). Assessing the Effects of Quality, Value, and Customer Satisfaction on Consumer Behavioral Intentions in Service Environments. Journal of Retailing, 76(2), 193–218.
[13]. Cullen, P. (1994). Time, tastes and technology: the economic evolution of eating out. British Food Journal.
[14]. Fanning, J., Marsh, T., &Stiegert, K. (2010). Determinants of US fast food consumption 1994‐1998. British Food Journal. [15]. Gilbert, D. (2003), Retail Marketing Management, 2nd ed., Pearson Education Ltd, Harlow. [16]. Goyal, A., & Singh, N. P. (2007). Consumer perception about fast food in India: an exploratory study. British Food Journal.
[17]. Hair, J., Black, B., Babin, R., Anderson, R., Tatham, R., 2006. Multivariate Data Analysis, 6th ed. Prentice Hall, New York.
[18]. Heung, V.C.S., Wong, M.Y. and Qu, H. (2000), “Airport-restaurant service quality in Hong Kong: an application of SERVQUAL”, Cornell Hotel & Restaurant Administration Quarterly, Vol. 41 No. 3, pp. 86-96.
[19]. Huang, T. T. K., Howarth, N. C., Lin, B. H., Roberts, S. B., &McCrory, M. A. (2004). Energy intake and meal portions:
associations with BMI percentile in US children. Obesity research, 12(11), 1875-1885.

QSR Consumer’s Essence: a cluster analysis approach
DOI: 10.9790/487X-2210011233 www.iosrjournals.org 27 | Page
[20]. Kara, A., Kaynak, E., &Kucukemiroglu, O. (1997). Marketing strategies for fast-food restaurants: a customer view. British Food
Journal, 99(9), 318-324.
[21]. Kaynak, E., &Marandu, E. E. (2006). Tourism market potential analysis in Botswana: a Delphi study. Journal of Travel Research, 45(2), 227-237.
[22]. Keynote (2003), Fast Food and Home Delivery Outlets, Market Intelligence Report, Keynote, London, April.
[23]. Kumar, H., Palaha, R., &Kaur, A. (2013). Study of consumption, behavior and awareness of fast food among university hostlers. Asian journal of clinical Nutrition, 5(1), 1.
[24]. Kwun, D. J. W. (2011). Effects of campus foodservice attributes on perceived value, satisfaction, and consumer attitude: A gender-
difference approach. International Journal of Hospitality Management, 30(2), 252-261.
[25]. Lee, M., &Ulgado, F. M. (1997). Consumer evaluations of fast‐food services: a cross‐national comparison. Journal of Services
Marketing. [26]. Liu, C. M., & Chen, K. J. (2000). A look at fastfood competition in the Philippines. British Food Journal.
[27]. Min, H., & Min, H. (2011). Benchmarking the service quality of fast‐food restaurant franchises in the USA. Benchmarking: An International Journal.
[28]. Oliva, T.A., Oliver, R.L. and McMillan, I.C. (1992), “A catastrophe model for developing service satisfaction strategies”, Journal of Marketing, Vol. 56 No. 3, pp. 83-95.
[29]. Omid, A. M., Amoozesh, N., Majumder, T. H., Rahman, M. M., Rahman, M. M., Abid, T.,&Ahmadinia, H. (2012). School of
Doctoral Studies European Union. [30]. Pettigrew, S., & Roberts, M. (2006). Mothers' attitudes towards toys as fast food premiums. Young Consumers: Insight and Ideas
for Responsible Marketers, 7(4), 60-67.
[31]. Platania, M., &Privitera, D. (2005). ICT and Typical Products: An Analysis of Italian Farms (No. 724-2016-49284). [32]. Platania, M., &Privitera, D. (2006). Typical products and consumer preferences: the “soppressata” case. British Food Journal.
[33]. Richardson, J., &Aguir, L. K. (2003). Consumer change in fast food preference. British Food Journal, 11(3), 77-85.
[34]. Schlosser, E. (2012). Fast food nation: The dark side of the all-American meal. Houghton Mifflin Harcourt. [35]. Stamoulis, K. G., Pingali, P. L., &Shetty, P. (2004). Emerging challenges for food and nutrition policy in developing
countries. eJADE: electronic Journal of Agricultural and Development Economics, 1(853-2016-56107), 154-167.
[36]. Traill, B. (1994), New Food Consumption Patterns and Product Quality in Europe and Adaptation of Agricultural Production, Food and Agriculture Organisation of the United Nations, Rome
[37]. Ueltschy, L.C., Laroche, M., Tamilia, R.D. and Yannopoulos, P. (2004), “Cross-cultural invariance of measures of satisfaction and
service quality”, Journal of Business Research, Vol. 7, pp. 901-12. [38]. Wilson, R. G., & Rogers, R. W. (1982). U.S. Patent No. 4,343,985. Washington, DC: U.S. Patent and Trademark Office.
Annexure-1
Table-4.6 agglomeration Schedule Agglomeration Schedule
Stage
Cluster Combined
Coefficients
Stage Cluster First Appears
Next Stage Cluster 1 Cluster 2 Cluster 1 Cluster 2
1 139 160 0.129 0 0 178
2 191 309 0.138 0 0 97
3 152 203 0.140 0 0 110
4 15 90 0.140 0 0 65
5 173 180 0.156 0 0 16
6 144 151 0.160 0 0 61
7 63 100 0.170 0 0 79
8 97 272 0.175 0 0 43
9 103 208 0.177 0 0 31
10 99 254 0.181 0 0 52
11 77 156 0.188 0 0 141
12 182 190 0.196 0 0 152
13 84 288 0.200 0 0 99
14 220 258 0.202 0 0 129
15 233 268 0.206 0 0 122
16 23 173 0.212 0 5 51
17 238 246 0.215 0 0 111
18 262 264 0.217 0 0 60
19 37 250 0.218 0 0 110
20 38 135 0.226 0 0 83
21 10 30 0.239 0 0 189
22 12 47 0.249 0 0 94
23 122 194 0.253 0 0 41
24 9 189 0.257 0 0 83
25 222 223 0.261 0 0 104
26 82 239 0.262 0 0 128
27 95 287 0.263 0 0 108
28 181 300 0.267 0 0 107
29 1 153 0.271 0 0 198
30 2 273 0.272 0 0 112
31 69 103 0.275 0 9 93
32 168 243 0.276 0 0 62
33 113 202 0.281 0 0 72
QSR Consumer’s Essence: a cluster analysis approach
DOI: 10.9790/487X-2210011233 www.iosrjournals.org 28 | Page
34 29 83 0.292 0 0 57
35 6 121 0.293 0 0 77
36 206 207 0.294 0 0 273
37 174 178 0.304 0 0 116
38 75 119 0.308 0 0 96
39 85 303 0.314 0 0 158
40 18 145 0.316 0 0 170
41 72 122 0.321 0 23 113
42 115 195 0.333 0 0 82
43 97 259 0.348 8 0 127
44 8 209 0.348 0 0 196
45 274 282 0.351 0 0 91
46 56 184 0.373 0 0 128
47 227 257 0.377 0 0 101
48 170 271 0.395 0 0 138
49 214 278 0.399 0 0 140
50 36 102 0.400 0 0 131
51 23 241 0.402 16 0 85
52 91 99 0.408 0 10 92
53 177 315 0.414 0 0 186
54 185 212 0.417 0 0 214
55 79 120 0.417 0 0 88
56 187 284 0.421 0 0 242
57 29 313 0.422 34 0 103
58 92 240 0.422 0 0 161
59 64 155 0.425 0 0 109
60 201 262 0.425 0 18 99
61 96 144 0.428 0 6 132
62 136 168 0.431 0 32 130
63 143 188 0.433 0 0 115
64 71 267 0.437 0 0 120
65 15 265 0.446 4 0 169
66 147 226 0.449 0 0 192
67 186 285 0.455 0 0 164
68 7 35 0.463 0 0 134
69 255 290 0.471 0 0 95
70 40 219 0.471 0 0 84
71 109 292 0.472 0 0 106
72 59 113 0.473 0 33 129
73 133 296 0.474 0 0 98
74 142 275 0.479 0 0 166
75 158 211 0.485 0 0 230
76 31 193 0.486 0 0 173
77 6 11 0.488 35 0 161
78 175 204 0.488 0 0 163
79 63 198 0.490 7 0 124
80 50 87 0.491 0 0 179
81 221 305 0.491 0 0 118
82 93 115 0.498 0 42 126
83 9 38 0.501 24 20 123
84 17 40 0.504 0 70 191
85 23 125 0.506 51 0 116
86 126 163 0.516 0 0 203
87 225 263 0.517 0 0 93
88 53 79 0.546 0 55 134
89 16 116 0.557 0 0 172
90 44 218 0.559 0 0 127
91 179 274 0.562 0 45 270
92 52 91 0.569 0 52 124
93 69 225 0.572 31 87 131
94 12 291 0.573 22 0 120
95 210 255 0.574 0 69 162
96 75 242 0.576 38 0 122
97 66 191 0.580 0 2 169
98 110 133 0.581 0 73 117
99 84 201 0.582 13 60 147
100 13 289 0.583 0 0 142
101 216 227 0.583 0 47 168
102 251 311 0.587 0 0 248
103 29 260 0.598 57 0 149
104 222 249 0.600 25 0 269

QSR Consumer’s Essence: a cluster analysis approach
DOI: 10.9790/487X-2210011233 www.iosrjournals.org 29 | Page
105 124 295 0.601 0 0 154
106 108 109 0.602 0 71 205
107 86 181 0.607 0 28 181
108 95 301 0.610 27 0 132
109 64 128 0.616 59 0 166
110 37 152 0.619 19 3 197
111 213 238 0.621 0 17 176
112 2 34 0.625 30 0 177
113 72 252 0.628 41 0 167
114 39 302 0.659 0 0 135
115 130 143 0.659 0 63 159
116 23 174 0.663 85 37 187
117 110 280 0.664 98 0 174
118 221 283 0.665 81 0 210
119 104 244 0.670 0 0 251
120 12 71 0.679 94 64 173
121 49 101 0.682 0 0 212
122 75 233 0.694 96 15 143
123 9 88 0.718 83 0 185
124 52 63 0.719 92 79 147
125 14 21 0.719 0 0 187
126 93 131 0.728 82 0 152
127 44 97 0.742 90 43 144
128 56 82 0.742 46 26 150
129 59 220 0.745 72 14 200
130 136 256 0.753 62 0 208
131 36 69 0.759 50 93 141
132 95 96 0.770 108 61 179
133 33 94 0.770 0 0 160
134 7 53 0.790 68 88 213
135 39 65 0.806 114 0 165
136 106 132 0.810 0 0 224
137 41 67 0.820 0 0 222
138 170 235 0.836 48 0 171
139 166 308 0.852 0 0 254
140 214 230 0.854 49 0 182
141 36 77 0.867 131 11 162
142 13 127 0.868 100 0 227
143 75 304 0.870 122 0 167
144 44 234 0.870 127 0 220
145 4 20 0.875 0 0 213
146 176 297 0.877 0 0 221
147 52 84 0.879 124 99 200
148 192 232 0.879 0 0 206
149 29 253 0.885 103 0 171
150 5 56 0.900 0 128 232
151 43 299 0.919 0 0 237
152 93 182 0.920 126 12 209
153 46 245 0.936 0 0 265
154 22 124 0.952 0 105 259
155 68 183 0.953 0 0 202
156 138 197 0.983 0 0 219
157 55 107 1.012 0 0 214
158 85 224 1.013 39 0 211
159 130 148 1.016 115 0 185
160 33 117 1.020 133 0 239
161 6 92 1.024 77 58 188
162 36 210 1.031 141 95 188
163 175 229 1.036 78 0 234
164 186 312 1.039 67 0 175
165 39 277 1.055 135 0 218
166 64 142 1.074 109 74 207
167 72 75 1.081 113 143 216
168 24 216 1.088 0 101 201
169 15 66 1.092 65 97 226
170 18 51 1.092 40 0 217
171 29 170 1.122 149 138 208
172 16 149 1.125 89 0 212
173 12 31 1.129 120 76 209
174 110 215 1.135 117 0 182
175 154 186 1.156 0 164 228

QSR Consumer’s Essence: a cluster analysis approach
DOI: 10.9790/487X-2210011233 www.iosrjournals.org 30 | Page
176 213 217 1.179 111 0 239
177 2 199 1.181 112 0 310
178 139 279 1.183 1 0 231
179 50 95 1.190 80 132 196
180 28 57 1.210 0 0 215
181 58 86 1.214 0 107 202
182 110 214 1.216 174 140 241
183 45 73 1.229 0 0 280
184 112 228 1.229 0 0 246
185 9 130 1.230 123 159 216
186 177 205 1.250 53 0 233
187 14 23 1.278 125 116 236
188 6 36 1.299 161 162 223
189 10 307 1.303 21 0 282
190 19 70 1.306 0 0 260
191 17 172 1.310 84 0 274
192 118 147 1.314 0 66 205
193 3 165 1.337 0 0 275
194 261 314 1.348 0 0 220
195 105 236 1.362 0 0 219
196 8 50 1.371 44 179 223
197 37 81 1.392 110 0 224
198 1 76 1.400 29 0 263
199 129 164 1.412 0 0 235
200 52 59 1.424 147 129 225
201 24 150 1.427 168 0 232
202 58 68 1.435 181 155 226
203 32 126 1.439 0 86 245
204 60 270 1.487 0 0 260
205 108 118 1.518 106 192 229
206 192 316 1.530 148 0 296
207 64 171 1.535 166 0 240
208 29 136 1.536 171 130 228
209 12 93 1.546 173 152 229
210 80 221 1.548 0 118 237
211 85 248 1.581 158 0 258
212 16 49 1.634 172 121 238
213 4 7 1.670 145 134 271
214 55 185 1.709 157 54 236
215 28 74 1.714 180 0 261
216 9 72 1.716 185 167 225
217 18 310 1.769 170 0 277
218 39 48 1.770 165 0 252
219 105 138 1.788 195 156 266
220 44 261 1.822 144 194 240
221 169 176 1.823 0 146 252
222 41 111 1.825 137 0 275
223 6 8 1.848 188 196 243
224 37 106 1.856 197 136 245
225 9 52 1.929 216 200 243
226 15 58 1.960 169 202 257
227 13 114 1.986 142 0 246
228 29 154 1.999 208 175 247
229 12 108 2.001 209 205 238
230 25 158 2.014 0 75 301
231 89 139 2.032 0 178 256
232 5 24 2.047 150 201 273
233 134 177 2.071 0 186 281
234 157 175 2.097 0 163 249
235 129 200 2.101 199 0 270
236 14 55 2.112 187 214 251
237 43 80 2.150 151 210 250
238 12 16 2.151 229 212 257
239 33 213 2.152 160 176 255
240 44 64 2.189 220 207 247
241 110 293 2.231 182 0 294
242 26 187 2.253 0 56 250
243 6 9 2.303 223 225 255
244 231 294 2.311 0 0 278
245 32 37 2.320 203 224 284
246 13 112 2.392 227 184 277

QSR Consumer’s Essence: a cluster analysis approach
DOI: 10.9790/487X-2210011233 www.iosrjournals.org 31 | Page
247 29 44 2.428 228 240 261
248 251 269 2.438 102 0 278
249 146 157 2.459 0 234 287
250 26 43 2.594 242 237 279
251 14 104 2.595 236 119 267
252 39 169 2.620 218 221 274
253 54 167 2.638 0 0 266
254 166 276 2.668 139 0 264
255 6 33 2.727 243 239 262
256 89 161 2.800 231 0 268
257 12 15 2.801 238 226 262
258 85 137 3.001 211 0 279
259 22 159 3.013 154 0 264
260 19 60 3.047 190 204 285
261 28 29 3.049 215 247 286
262 6 12 3.060 255 257 267
263 1 27 3.100 198 0 282
264 22 166 3.275 259 254 295
265 46 141 3.330 153 0 269
266 54 105 3.388 253 219 291
267 6 14 3.395 262 251 285
268 62 89 3.479 0 256 299
269 46 222 3.488 265 104 305
270 129 179 3.535 235 91 306
271 4 61 3.560 213 0 304
272 237 266 3.578 0 0 288
273 5 206 3.608 232 36 284
274 17 39 3.701 191 252 286
275 3 41 3.749 193 222 298
276 162 286 3.789 0 0 283
277 13 18 3.802 246 217 305
278 231 251 3.803 244 248 288
279 26 85 3.856 250 258 292
280 45 98 3.866 183 0 298
281 134 281 3.954 233 0 300
282 1 10 4.125 263 189 291
283 162 298 4.260 276 0 300
284 5 32 4.431 273 245 287
285 6 19 4.444 267 260 289
286 17 28 4.447 274 261 303
287 5 146 4.562 284 249 289
288 231 237 4.699 278 272 308
289 5 6 4.745 287 285 295
290 123 140 4.772 0 0 294
291 1 54 4.931 282 266 302
292 26 42 5.167 279 0 296
293 196 306 5.775 0 0 304
294 110 123 5.944 241 290 301
295 5 22 6.075 289 264 297
296 26 192 6.211 292 206 297
297 5 26 6.460 295 296 299
298 3 45 7.275 275 280 306
299 5 62 7.778 297 268 302
300 134 162 7.882 281 283 307
301 25 110 7.912 230 294 309
302 1 5 9.898 291 299 303
303 1 17 10.265 302 286 308
304 4 196 10.991 271 293 315
305 13 46 11.500 277 269 311
306 3 129 11.890 298 270 312
307 78 134 12.917 0 300 313
308 1 231 13.318 303 288 309
309 1 25 15.652 308 301 311
310 2 247 17.349 177 0 314
311 1 13 17.789 309 305 312
312 1 3 19.010 311 306 313
313 1 78 21.357 312 307 314
314 1 2 24.279 313 310 315
315 1 4 25.666 314 304 0

QSR Consumer’s Essence: a cluster analysis approach
DOI: 10.9790/487X-2210011233 www.iosrjournals.org 32 | Page
Annexure-2
Figure 4.2- Dendogram

QSR Consumer’s Essence: a cluster analysis approach
DOI: 10.9790/487X-2210011233 www.iosrjournals.org 33 | Page
Annexure-3, Table-4.4 Communalities
Communalities
Initial Extraction
Tan1 1.000 0.772
Tan2 1.000 0.753
Tan3 1.000 0.779
Tan4 1.000 0.729
Rel1 1.000 0.752
Rel2 1.000 0.697
Rel3 1.000 0.732
Rel4 1.000 0.779
Rel5 1.000 0.671
Res1 1.000 0.792
Res2 1.000 0.747
Res3 1.000 0.810
Res4 1.000 0.738
Assu11 1.000 0.798
Assu22 1.000 0.787
Assu33 1.000 0.811
Assu44 1.000 0.763
Emp1 1.000 0.770
Emp2 1.000 0.710
Emp3 1.000 0.772
Emp4 1.000 0.733
Emp5 1.000 0.776
CS1 1.000 0.849
CS2 1.000 0.839
CS3 1.000 0.858
Extraction Method: Principal Component Analysis.