Embed Size (px)
Citation preview
QRS -Osteo-Study 2001
Randomized Double Blind Study with the QRS Magnetic Field Therapy (Model: Salut 1) with 71 Osteoarthritis Patients from 02.11.2000 – 25.01.2001 at the General Hospital Maribor/Slovenia
Study conducted by: Lecturer Dr. Z. Turk (Maribor), Prof. Dr. G. Fischer (University Graz); Statistics: W. Kobinger (Graz)
Report on the Biometrics (re) Analysis On the basis of patient data and short reports by G. Fischer and W. Kobinger
Rainer B. Pelka1
Munich, 16th June 2001 1 Univ. Prof. Dr. Phil. Rainer B. Pelka, Chair in Applied Statistics, especially Biometry at the Armed Forces University Munich,Werner-Heisenberg-Weg 39, D-85579 Neubiberg/Munich
Contents
QRS -Osteo-Study 2001 Randomized double blind study with QRS magnetic field therapy (appliance: Salut 1) with 71 osteoarthritis patients from 02.11.00 until 25.01.01 in Maribor/Slovenia Page No. 0 Summary 1 1 Formulation of Problems and Objective of Study 2
1.1 Formulation of Problems 2 1.2 Objective of Study 3
2 Trial Planning and Trial Participants 4
2.1 Trial Planning 4
2.1.1 Design of the Study 4 2.2 Criteria and Predictors 5 2.3 Patient Selection and Conduct of Study 6 2.4 Biometrics Evaluation 6 2.5 Statistical Procedure of Analysis 7 2.6 Patient Collective 7
3 Results of the Biometrics Analysis 9
3.1 Compliance and Go od Tolerance, UE’s 9 3.2 Effectiveness 10
3.2.1 Effect on Knee Assessment (KSS) 10 3.2.2 Effect on the General Pain and Sensitivity Situation 17 3.2.3 Effect on Laboratory and Vital Parameter 23
4 Discussion 30 5 References 31 • Keywords
Therapy with pulsed low frequency magnetic fields (System QRS – Salut 1) ♦ pain reduction and improvement of function in cases of osteoarthritis ♦ randomized double blind study with 71 osteoarthritis patients ♦
1
QRS -OSTEO-Study 2001 Biometrics Analysis of a Randomized Double Blind Study in Cases of Osteoarthritis
(Rainer B. Pelka) Keywords: Therapy with pulsed, low frequency magnetic fields (System: QRS – Salut 1) ♦ pain reduction and improvement of function in cases of osteoarthritis ♦ randomized double blind study with 71 osteoarthritis patients ♦ 0 Summary Formulation of Problems: Osteoarthritis of the knee joint is a disseminated degenerative disease, especially in adults, which mostly develops due to an imbalance of use and constitutional capacity of the joint tissues. Clinical symptoms are stiffness and pain, and in long term cases also knee joint instability. The standard therapy up to now is rather symptomatic than causal, mostly physical therapy and analgesic medicines. Objective: This controlled study examines three important theories: 1. QRS reduces pain in cases of osteoarthritis and the ability to function is improved. 2. The advantage of QRS therapy decreases in the follow-up of non-QRS therapy, but not to
the initial position. 3. The laboratory parameters accompanying the inflammation process are improved where
necessary towards the norm with QRS. Design: Testing Equipment and Dosage: Testing equipment was a QRS Salut 1 device with a patented function, which activates the metabolism, especially of the cells, through the so-called ion transport. Study Model and Extent of Random Survey: There was a control (placebo) group of 36 and an active group with 35 participants in this randomized double blind study. The check duration was a daily application of 16 minutes for 6 weeks, then a follow-up of 4 weeks. Check times after commencement were 0,4,6,10 weeks. Criteria: The effectiveness of QRS therapy was judged by several, classical criteria, amongst those being knee joint rating with the KSS (knee society score) and pain with several indicators (theory 1 and 2). The CRP, the P-fibrinogen and the BSG recorded the inflammation parameter (theory 3). Trial Participants: Of the 71 patients (all from the Maribor General Hospital), 28% were male, the average age was 60 +/- 10 years. With a Broca of >1.2, about 35% of patients were clearly overweight. In 83% of the collective, both knees were affected, in a further 14% only the right knee and in 3% only the left knee was affected. Over 70% had one or more diagnoses, often also in the spinal/joint area. Over 50% had been suffering from the disease for more than 5 years. The general condition (GC) of the patients was mostly satisfactory, only in 25% was it (very) bad. Effectiveness: The KSS: Knee evaluation (Zwisu) improved significantly only in cases of the active group (P<0.01) compared to the placebo group (P<0.05). The same applies to KSS - knee pain. Also the knee function (P<0.01) and the walking ability (P<0.05) improved significantly, with a short “dip” after 6 weeks. Pain and Sensitivity: The sensitivity to pain was reduced in both groups, but significantly more so in the active group (P<0.01). Similarly this applies to GC and the subjective sense of well being. The initial (not significantly) higher dose of medicine in the active group finally falls even under the dose of the placebo group in the follow-up (effect has to be checked with a longer trial). Laboratory Parameter: After 6 weeks P-fibrinogen is reduced highly significantly in the active group compared to the placebo group. Following this trend it also applies to C-reactive protein and for
2
sedimentation of blood (BSG). The systolic blood pressure also improved significantly after 6 weeks and remained (compared to placebo) stable for a further 4 weeks without therapy. Side Effects: The analysis of the numerous study results supports the assumption that there are no unpleasant side effects with QRS. Discussion: This study clearly supports the 3 theories. It shows that QRS can be used effectively if “osteoarthritis” is diagnosed. The effects exceed the common, rather symptomatic therapy by far. The relatively good values in the follow-up point to a stabilized imp rovement. However the optimum is surely not achieved with a 6-week therapy. Therefore the study should be repeated with a longer duration (therapy 3 months, follow-up 3 months) and be completed with health economic parameters.
1 Formulation of Problems and Objective 1.1 Formulation of Problems Osteoarthritis of the knee joint is a disseminated degenerative disease, especially in adults. It mostly develops due to an imbalance of use and constitutional capacity of the joint tissues. The soundness of the joint capsule is significant. Typical causes especially in cases of knee osteoarthritis (gonarthritis) are joint dysplasia (malformations) and dysostosis (= bone growth disorders), but also damage due to trauma or inflammation. Lifestyle, as in all diseases caused by today’s lifestyle is very important, especially in regard to nutrition and exercise (Pschyrembel 1996, Roche Medicine 1995). In the beginning a feeling of tension and stiffness in the knee joint and later initial pain, load pain and finally continuous pain are considered the most important clinical symptoms. In long lasting diseases an instability of the joint develops in the form of contractures, rarer are malpositions or muscular atrophies. The standard therapy up to now is rather symptomatic than causal. Main treatments are physical therapy as well as suitable medicines especially against pain. Health Economic Importance: Analgesics, the most common therapy also in cases of the above-mentioned diagnosis, belong to the most bought and overall mo st expensive medicines in Central Europe. Steroids often have undesired side effects and especially the so-called antirheumatics are not only expensive, but because of their sometimes severe side effects are very problematic. Within the frame of a future study many directly and indirectly occurring costs/savings per patient should be registered as well, in order to be able to conduct an efficiency calculation (benefits minus costs). By now numerous results in literature show that the therapeutic and also the preventative effect of QRS – independently of the special diagnosis – is primarily in its long term application2. This can also be seen in a customer field study on the therapeutic effects of QRS when applied for an average of 12 months (s. Pelka 2000). 1.2 Objective of Study About the Therapy: This study had the purpose to prove the advantage of QRS as an adjuvant therapy in a shorter time frame. This had already been assumed due to theoretical considerations, experimental results and repeated experiences in individual cases. It was planned to use QRS as an
2 Regarding experimental and clinical results of QRS see: Bassett 1989; Becker 1999; Bondemark 1994; GE Fischer 1996;, G. Fischer 2001; Gaube 1999; Pelka 2000; regarding fundamental works on the effectiveness of magnetic fields and especially QRS see: GE Fischer 1996; G Fischer 1994, 1996; Grohmann 1996a, 1996b, 1999b, 2001; Jacobsen 1995; Konig 1986; Kokoschinegg 1996; Krauss 1997, 2001; Kyriakoulis 1997; Marino 1997; Schauff 1993; Turk 1992; Wagner 1995.
3
adjuvant therapy therefore we tried to keep the primary therapy (see analgesics) standardized and to define it in advance. Due to the pilot character of the study well-standardized therapy concepts were used for the active and the control group. A therapy duration of 2 months is recommended due to the latest findings (Krauss 1999). The control duration should be 3 months. The control phase should include a preliminary phase as well as a follow-up of 14 days. The examination of the therapeutic effect of QRS refers to parameters, which are relevant in the context of the symptoms of osteoarthritis. The following claims formed the core theory. Theory 1: • The use of QRS in cases of osteoarthrit is reduces pain and is followed by improved ability to
function. Theory 2: • The advantage of QRS therapy is slightly reduced in the follow-up (no QRS therapy), but
not as far as the initial situation. Theory 3: • The use of QRS results in a partial improvement of the typical (deviating from the norm)
laboratory parameters3 for this disease. Theoretically these theories, see also Theory 1, are substantiated by the effects of QRS on the improved exchange of ions, which was proven in experiments (see e.g. Fischer G.E., 1996). Empirical results of the positive effects of magnetic fields, especially QRS, in cases of the examined disease are also available. • In the late ‘80s Turk propagated the adjuvant treatment of diseases of the locomotive system
because of positive clinical results (Turk et al, 1990). • P. Kokoschinegg (Salzburg) and G. Fischer (Graz) reported in 1991-1992 (report
Kokoschinegg 1996) about a randomized study with 15 Hz-Elf-waves in connection with conventional treatment methods in cases of rheumatic diseases. Amongst the analyzed 78 patients (39 placebo, 39 active) were cases of myalgia, cervical syndrome, sponylogenous neuralgia and even a few cases of coxarthrosis (degenerative hip joint disease) and osteoarthritis (degenerative knee joint disease). The results (slightly significant, P<0,1) showed the therapeutic advantage of magnetic field therapy.
• In a positive report of experiences of 16 patients with diseases of the locomotive system (frequency individual 2-24Hz, field strength 2.52-8.82 µT) there were two cases of osteoarthritis, which were positively treated (only magnetic field therapy, no analgesics; pain reduction on the dole scale by 9 or 8 points {=good therapy success, =improved}; see Wagner et al, 1995).
All this, together with the related empirical findings and theoretical models and in combination with the latest experimental results, can be enlisted to present the above-mentioned theories that are well founded.
2 Trial Planning and Trial Participants 2.1 Trial Planning Testing Equipment and Dosage: The testing equipment was a QRS Salut 1 device with a patented function, which activates the metabolism, especially of the cells, with the so-called ion transport. In regard to details refer to literature (e.g. Fischer GE 1996).
3 According to Turk et al (2001) this relates mainly to: C-reactive protein (very selective inflammation parameter for joint pain and rheumatism) and BSG and P-fibronigen (slightly less specific inflammation parameter).
4
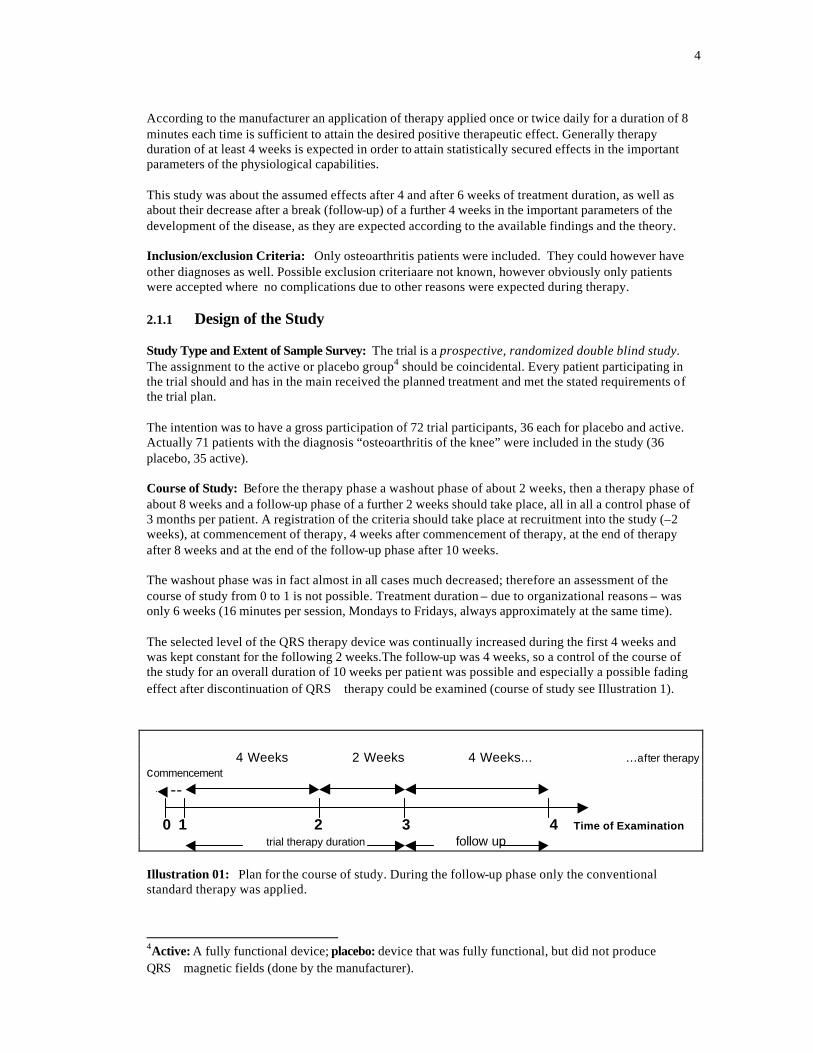
According to the manufacturer an application of therapy applied once or twice daily for a duration of 8 minutes each time is sufficient to attain the desired positive therapeutic effect. Generally therapy duration of at least 4 weeks is expected in order to attain statistically secured effects in the important parameters of the physiological capabilities. This study was about the assumed effects after 4 and after 6 weeks of treatment duration, as well as about their decrease after a break (follow-up) of a further 4 weeks in the important parameters of the development of the disease, as they are expected according to the available findings and the theory. Inclusion/exclusion Criteria: Only osteoarthritis patients were included. They could however have other diagnoses as well. Possible exclusion criteriaare not known, however obviously only patients were accepted where no complications due to other reasons were expected during therapy. 2.1.1 Design of the Study Study Type and Extent of Sample Survey: The trial is a prospective, randomized double blind study. The assignment to the active or placebo group4 should be coincidental. Every patient participating in the trial should and has in the main received the planned treatment and met the stated requirements of the trial plan. The intention was to have a gross participation of 72 trial participants, 36 each for placebo and active. Actually 71 patients with the diagnosis “osteoarthritis of the knee” were included in the study (36 placebo, 35 active). Course of Study: Before the therapy phase a washout phase of about 2 weeks, then a therapy phase of about 8 weeks and a follow-up phase of a further 2 weeks should take place, all in all a control phase of 3 months per patient. A registration of the criteria should take place at recruitment into the study (–2 weeks), at commencement of therapy, 4 weeks after commencement of therapy, at the end of therapy after 8 weeks and at the end of the follow-up phase after 10 weeks. The washout phase was in fact almost in all cases much decreased; therefore an assessment of the course of study from 0 to 1 is not possible. Treatment duration – due to organizational reasons – was only 6 weeks (16 minutes per session, Mondays to Fridays, always approximately at the same time). The selected level of the QRS therapy device was continually increased during the first 4 weeks and was kept constant for the following 2 weeks.The follow-up was 4 weeks, so a control of the course of the study for an overall duration of 10 weeks per patient was possible and especially a possible fading effect after discontinuation of QRS therapy could be examined (course of study see Illustration 1). 4 Weeks 2 Weeks 4 Weeks... ...after therapy commencement -- 0 1 2 3 4 Time of Examination trial therapy duration follow up Illustration 01: Plan for the course of study. During the follow-up phase only the conventional standard therapy was applied.
4Active: A fully functional device; placebo: device that was fully functional, but did not produce QRS magnetic fields (done by the manufacturer).
5
2.2 Criteria and Predictors Primary Target Parameters Pain: The numerical analog scale (NAS) in connection with the verbal rating scale was used for assessment. In addition the affective rating scale was used. Knee joint rating: The standardized KSS (Knee Society Score) was used, which carries out (separately for each knee) a knee assessment (pain, mobility, stability, deficits [see sample test sheet, appendix]: values 0 = worst case, 100 = no complaints), as well as an evaluation of function (walking ability, climbing stairs, walking support: values 0 = worst case, 100 = no complaints). Secondary Target Parameters Laboratory (blood) parameters: CRP (C-reactive protein) is considered a specific and BSG (blood decrease) and P-fibrinogen as a slightly less specific inflammation parameter for joint pain and rheumatism. In addition important parameters of the differential haemogram were recorded: leucocytes, erythrocytes, neutrophil granulocytes, staff cell leucocytes, segmented leucocytes and especially lymphocytes, monocytes, eosinophiles and basophiles. Blood pressure as a circulation parameter: Fischer (Graz) suggested oxygen partial pressure assessment by means of joint puncture as an objective measure for the subjective pain parameter. Unfortunately it could not be used. Medicines: A useful semi objective parameter is the taking of medicines i.e. medicines taken. • Type ([0: none, 1: analgesics, 2: steroids, 3: not clear, 4: antirheumatics, 5: combination, 9: no
details])5, • Extent (=frequency [0: never, 1: rarely, 2: 1x per week, 3: 2-3 x per week, 4: every day]), • Dosage (0: not at all, 1: low [1 tablet], 2: medium [2 tablets], 3: high [3 tablets], 4: very high
[>3 tablets per day]). Contrary to the initial planning, this information was not recorded by the patients but only by the doctor for the previous period of 4 (or 2) weeks. Tertiary Target Parameters In coordination with medicine, characteristics like the recording (as possible) of radiological findings (interarticular space control), as well as general findings like height, weight, blood pressure, breathing, general condition, general state of health and references to other degenerative joint findings are included. Occurrence of Undesired Events (UEs) (as a reference to possible problems while using QRS). This should be recorded with great care, as it is useful for the checking of possible, even though not expected , side effects of QRS therapy. Overall, however, one can assume that judging by available findings, no strong side effects were expected. The ones responsible for the study against initial plans – drew up no separate sample test sheet. 2.3 Patient Selection and Conduct of Study Patient Selection (actual extent of sample survey): The actual sample survey consisted of 71 trial participants (36 placebo, 35 active), all of whom had osteoarthritis and often at least one more diagnosis. The method of selection is not known. It can however be assumed that it is a typical collective for the General Hospital Maribor. Conduct of Study: For reasons unknown, during the conduct of the study the following difficulties arose: in all 4 trial participants were so-called latecomers (placebo and active). From the study 5 This variable was recorded alpha numerically; therefore corresponding recoding had to be made.
6
documents the extent of the delay is not discernible, as only in the case of one patient the initial data is missing. There were dropouts in all 6 of the trial participants. From the data protocol this affected the measurements 2 and 3 only in 2 cases (1 placebo, 1 active), the other 4 cases (3 placebo, 1 active) were only affected in the follow-up, so after 10 weeks there were still the measurements of 64 patients (30 placebo, 34 active) available. However at the end of therapy after 6 weeks there were still 69 patients (34 placebo, 35 active). The reasons of the study dropouts are not known. Study Duration: The study was conducted relatively fast over 14 weeks (according to plan) and was finalized on 25 January, 2001. The admission of the 71 patients took place over a period of less than 4 weeks. This was only possible, as a large number of osteoarthritis patients were available almost simultaneously. 2.4 Biometrics Evaluation Data Evaluation: Prof. Fischer and Mr. Kobinger (Graz) initially took responsibility for data management and statistical analysis. Mr. Turk took medical responsibility and Mr. Barovic took responsibility for the actual therapy, examination control and data recording6. Only the second more ext ensive data analysis (on the basis of available patient data and two short reports) and the drawing up of the report on hand was conducted by the Bureau for New Technologies (BNT) under the scientific consultation of Prof. Dr. R.B. Pelka, Armed Forces University Munich. The hardware used was a PC with sufficient capacity (Pentium PC), for software SPSS (Windows Version 10) was used. Data Coding and Control The basis for data coding in cases of undesired events is WHO adverse reaction dictionary. Data is entered by means of independent entry repetition. Entries are checked in advance for logical consistency and plausibility. For later auditing suitable data listings were drawn up. I do not know which procedure was used to guarantee that consistent and reliable data was available for the following statistical analysis. Analysis Population: One differentiates between two analysis populations: Intent-to-treat: (ITT analysis): This population includes all patients, who were allocated to one of the two treatment (age) groups and who had at least one measurement taken (n=71: 36 placebo, 35 active). Per-protocol: (PPT analysis): This population includes all above mentioned patients except those where one or more of the following criteria exist: • patient breaches inclusion or exclusion criteria, - deviates from protocol/guidelines during
study, - drops out of the study prematurely (as the follow-up question is only discussed descriptively, the dropouts during this phase could remain in the PPT analysis (n=63: 34 placebo, 30 active).
Analysis based on the intent-to-treat population would utilize the LOCF procedure (LOCF= last observation carried forward) for estimation of missing data. This however does not apply for analysis based on per-protocol population, which was the basis for this course of analysis. Baseline Comparison: Group specific statistics serve the purpose to show up possible existing imbalances between the comparative groups, while global statistics serve the purpose to characterize the reference population – also in respect to demographic characteristics. A significance test to examine
6 This is my present level of knowledge derived from the documents and informal informat ion. The results of this analysis, which are known to me are a 3 page document on hand about the most important significancies and a 1 page document about the most important laboratory changes from a sample survey.
7
the baseline equivalence was not generally conducted, but simply in individual cases. There were however no significant differences between placebo and active in regard to important parameters. Data Analysis: The important ascertained primary parameters according to the examination design were illustrated for their frequency distribution in tabular form and/or graphically. The secondary and tertiary target parameters were calculated according to the examination design as well, and illustrated in tabular form or graphically. Furthermore the suitable statistical tests were utilized for examination of theories. Data Quality: About the quality of the data I cannot say anything, but due to my own plausibility contro, I can assume that the data is at least acceptable, but is most probably of good quality, therefore the so derived statements can be considered reliable. 2.5 Statistical Analysis Procedure As a statistical analysis procedure especially the t-test for independent sample surveys, as well as variance and trend analysis was used, besides the explained illustration (Chow 1998, Fischer 1993, Rao 1991). Where useful or indicated by the measuring theoretical preconditioning, the non-parametric procedures like the chi-quadrate-test, the U-test of Mann-Whittney or the Wilcoxon-test (Bortz 1990, Fischer 1993) and methods for handling missing data were used (Schafer 1997). 2.6 Patient Collective The details in this section relate to the ITT analysis and refer to the total collective of 71 patients. Sex: In the overall sample survey out of 71 participants: 28% were male and 72% were female (no missing values). Obviously it is a typical female ailment. This becomes even clearer if the Broca index or the BMI are enlisted. With a Broca of > 1.2 about 35% of the patients were clearly overweight (mean value = 1.23; statistical deviation = 0.22)7. In reference to females only this was 33 (=65%). There was no significant difference between active and placebo in regard to sex or Broca index or BMI (body mass index). Age Group: The mean value was 60 +/-10 years (+/- standard deviation). The youngest patient was 36, the oldest 80 years old. Placebo (mean value 62 +/-9 years) and active (mean value 58 +/- 11 years) were significantly different (P<0.05)8. About one third of the collective was 65 years old or older. Diagnoses: In 83% of the collective both knees were affected, in 14% only the right knee and in merely 3% (=2 patients) only the left knee. For this reason it made sense to select, at therapy commencement, the “worst” affected knee from the available findings right or left and to compare it’s status during the course9. Further Diagnoses: Only 20 (=28% of the total collective, 31% of the active group) had no further diagnoses. Of the others 33 (=47%) suffered from one more, 12 (=17%) two more and 6 (=8%) three or more chronic diseases. Specifically 67% of all patients had further diseases of the joints or bones.
7Broca = weight/(height – 100). A Broca of 0.9 (0.85 for women) is ideal, of 1 is normal weight. A Broca above 1.2 is considered overweight (risk factor). The calculation for the BMI (=body mass index) is: BMI=weight/(height/100)2. 8This corresponds to partly different initial values in both examination groups. In my estimation this however does not at any point lead to a qualification of the found, statistically guaranteed statements. 9Here I deviated from the procedure of the study group in Graz, who in their separate analysis of both knees (without reaching fundamentally different results), could only enlist 86% or 97% of the collective and were also forced to use a less clear illustration.
8
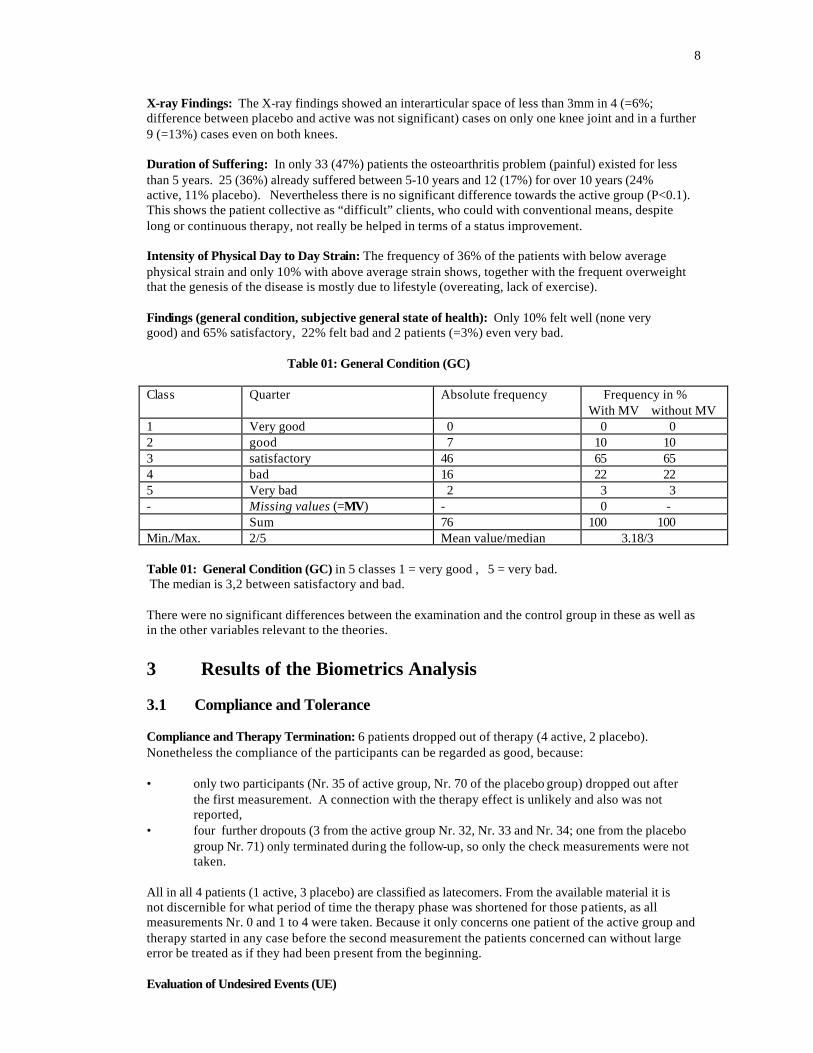
X-ray Findings: The X-ray findings showed an interarticular space of less than 3mm in 4 (=6%; difference between placebo and active was not significant) cases on only one knee joint and in a further 9 (=13%) cases even on both knees. Duration of Suffering: In only 33 (47%) patients the osteoarthritis problem (painful) existed for less than 5 years. 25 (36%) already suffered between 5-10 years and 12 (17%) for over 10 years (24% active, 11% placebo). Nevertheless there is no significant difference towards the active group (P<0.1). This shows the patient collective as “difficult” clients, who could with conventional means, despite long or continuous therapy, not really be helped in terms of a status improvement. Intensity of Physical Day to Day Strain: The frequency of 36% of the patients with below average physical strain and only 10% with above average strain shows, together with the frequent overweight that the genesis of the disease is mostly due to lifestyle (overeating, lack of exercise). Findings (general condition, subjective general state of health): Only 10% felt well (none very good) and 65% satisfactory, 22% felt bad and 2 patients (=3%) even very bad. Table 01: General Condition (GC) Class Quarter Absolute frequency Frequency in %
With MV without MV 1 Very good 0 0 0 2 good 7 10 10 3 satisfactory 46 65 65 4 bad 16 22 22 5 Very bad 2 3 3 - Missing values (=MV) - 0 - Sum 76 100 100 Min./Max. 2/5 Mean value/median 3.18/3 Table 01: General Condition (GC) in 5 classes 1 = very good , 5 = very bad. The median is 3,2 between satisfactory and bad. There were no significant differences between the examination and the control group in these as well as in the other variables relevant to the theories.
3 Results of the Biometrics Analysis 3.1 Compliance and Tolerance Compliance and Therapy Termination: 6 patients dropped out of therapy (4 active, 2 placebo). Nonetheless the compliance of the participants can be regarded as good, because: • only two participants (Nr. 35 of active group, Nr. 70 of the placebo group) dropped out after
the first measurement. A connection with the therapy effect is unlikely and also was not reported,
• four further dropouts (3 from the active group Nr. 32, Nr. 33 and Nr. 34; one from the placebo group Nr. 71) only terminated during the follow-up, so only the check measurements were not taken.
All in all 4 patients (1 active, 3 placebo) are classified as latecomers. From the available material it is not discernible for what period of time the therapy phase was shortened for those patients, as all measurements Nr. 0 and 1 to 4 were taken. Because it only concerns one patient of the active group and therapy started in any case before the second measurement the patients concerned can without large error be treated as if they had been present from the beginning. Evaluation of Undesired Events (UE)
9
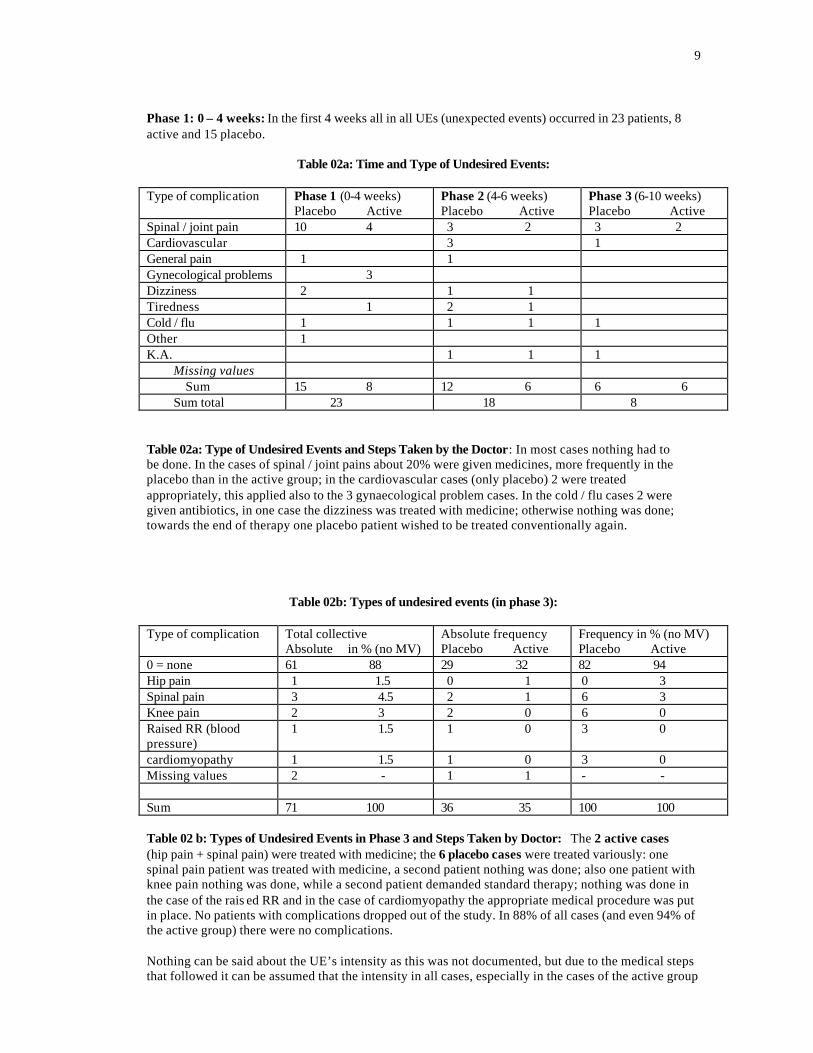
Phase 1: 0 – 4 weeks: In the first 4 weeks all in all UEs (unexpected events) occurred in 23 patients, 8 active and 15 placebo.
Table 02a: Time and Type of Undesired Events:
Type of complication Phase 1 (0-4 weeks)
Placebo Active Phase 2 (4-6 weeks) Placebo Active
Phase 3 (6-10 weeks) Placebo Active
Spinal / joint pain 10 4 3 2 3 2 Cardiovascular 3 1 General pain 1 1 Gynecological problems 3 Dizziness 2 1 1 Tiredness 1 2 1 Cold / flu 1 1 1 1 Other 1 K.A. 1 1 1 Missing values Sum 15 8 12 6 6 6 Sum total 23 18 8 Table 02a: Type of Undesired Events and Steps Taken by the Doctor: In most cases nothing had to be done. In the cases of spinal / joint pains about 20% were given medicines, more frequently in the placebo than in the active group; in the cardiovascular cases (only placebo) 2 were treated appropriately, this applied also to the 3 gynaecological problem cases. In the cold / flu cases 2 were given antibiotics, in one case the dizziness was treated with medicine; otherwise nothing was done; towards the end of therapy one placebo patient wished to be treated conventionally again.
Table 02b: Types of undesired events (in phase 3): Type of complication Total collective
Absolute in % (no MV) Absolute frequency Placebo Active
Frequency in % (no MV) Placebo Active
0 = none 61 88 29 32 82 94 Hip pain 1 1.5 0 1 0 3 Spinal pain 3 4.5 2 1 6 3 Knee pain 2 3 2 0 6 0 Raised RR (blood pressure)
1 1.5 1 0 3 0
cardiomyopathy 1 1.5 1 0 3 0 Missing values 2 - 1 1 - - Sum 71 100 36 35 100 100 Table 02 b: Types of Undesired Events in Phase 3 and Steps Taken by Doctor: The 2 active cases (hip pain + spinal pain) were treated with medicine; the 6 placebo cases were treated variously: one spinal pain patient was treated with medicine, a second patient nothing was done; also one patient with knee pain nothing was done, while a second patient demanded standard therapy; nothing was done in the case of the rais ed RR and in the case of cardiomyopathy the appropriate medical procedure was put in place. No patients with complications dropped out of the study. In 88% of all cases (and even 94% of the active group) there were no complications. Nothing can be said about the UE’s intensity as this was not documented, but due to the medical steps that followed it can be assumed that the intensity in all cases, especially in the cases of the active group
10
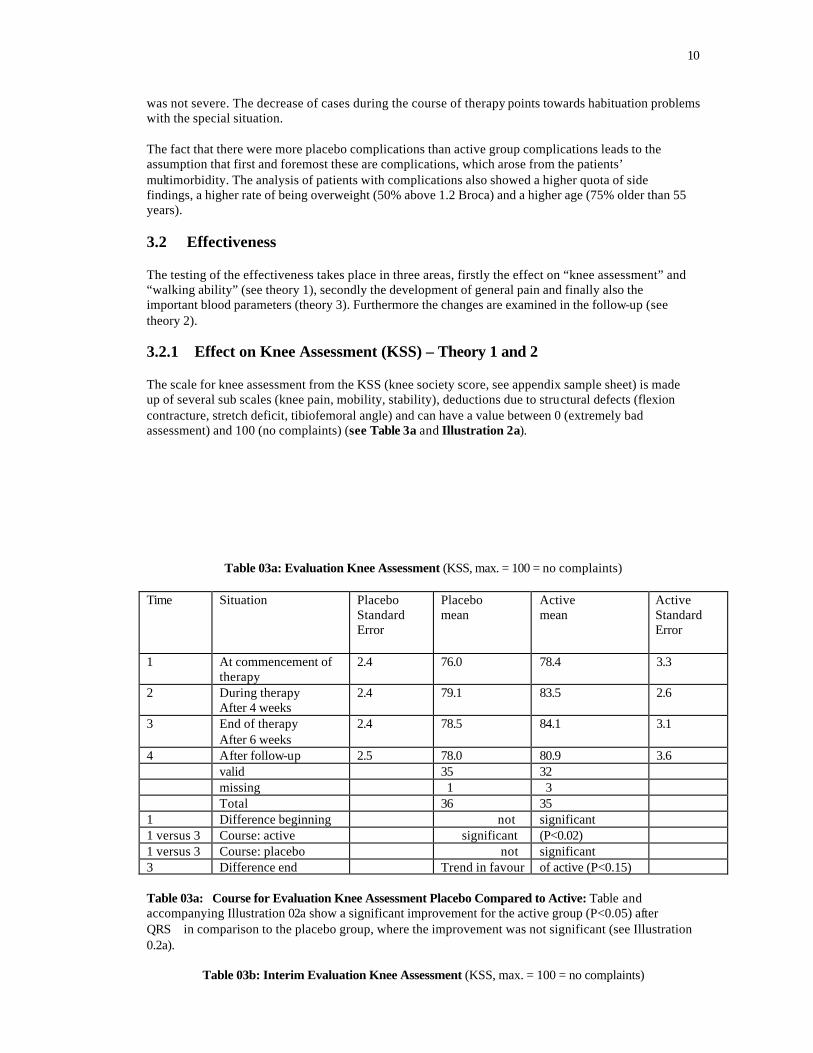
was not severe. The decrease of cases during the course of therapy points towards habituation problems with the special situation. The fact that there were more placebo complications than active group complications leads to the assumption that first and foremost these are complications, which arose from the patients’ multimorbidity. The analysis of patients with complications also showed a higher quota of side findings, a higher rate of being overweight (50% above 1.2 Broca) and a higher age (75% older than 55 years). 3.2 Effectiveness The testing of the effectiveness takes place in three areas, firstly the effect on “knee assessment” and “walking ability” (see theory 1), secondly the development of general pain and finally also the important blood parameters (theory 3). Furthermore the changes are examined in the follow-up (see theory 2). 3.2.1 Effect on Knee Assessment (KSS) – Theory 1 and 2 The scale for knee assessment from the KSS (knee society score, see appendix sample sheet) is made up of several sub scales (knee pain, mobility, stability), deductions due to structural defects (flexion contracture, stretch deficit, tibiofemoral angle) and can have a value between 0 (extremely bad assessment) and 100 (no complaints) (see Table 3a and Illustration 2a).
Table 03a: Evaluation Knee Assessment (KSS, max. = 100 = no complaints) Time Situation Placebo
Standard Error
Placebo mean
Active mean
Active Standard Error
1 At commencement of therapy
2.4 76.0 78.4 3.3
2 During therapy After 4 weeks
2.4 79.1 83.5 2.6
3 End of therapy After 6 weeks
2.4 78.5 84.1 3.1
4 After follow-up 2.5 78.0 80.9 3.6 valid 35 32 missing 1 3 Total 36 35 1 Difference beginning not significant 1 versus 3 Course: active significant (P<0.02) 1 versus 3 Course: placebo not significant 3 Difference end Trend in favour of active (P<0.15) Table 03a: Course for Evaluation Knee Assessment Placebo Compared to Active: Table and accompanying Illustration 02a show a significant improvement for the active group (P<0.05) after QRS in comparison to the placebo group, where the improvement was not significant (see Illustration 0.2a).
Table 03b: Interim Evaluation Knee Assessment (KSS, max. = 100 = no complaints)
11
Time Situation Placebo Standard Error
Placebo mean
Active mean
Active Standard Error
1 At therapy commencement
2.2 77.6 80.6 2.6
2 During therapy After 4 weeks
2.3 80.2 85.5 2.2
3 End of therapy After 6 weeks
2.4 79.8 86.9 2.4
4 After follow-up After 10 weeks
2.4 79.5 83.4 2.7
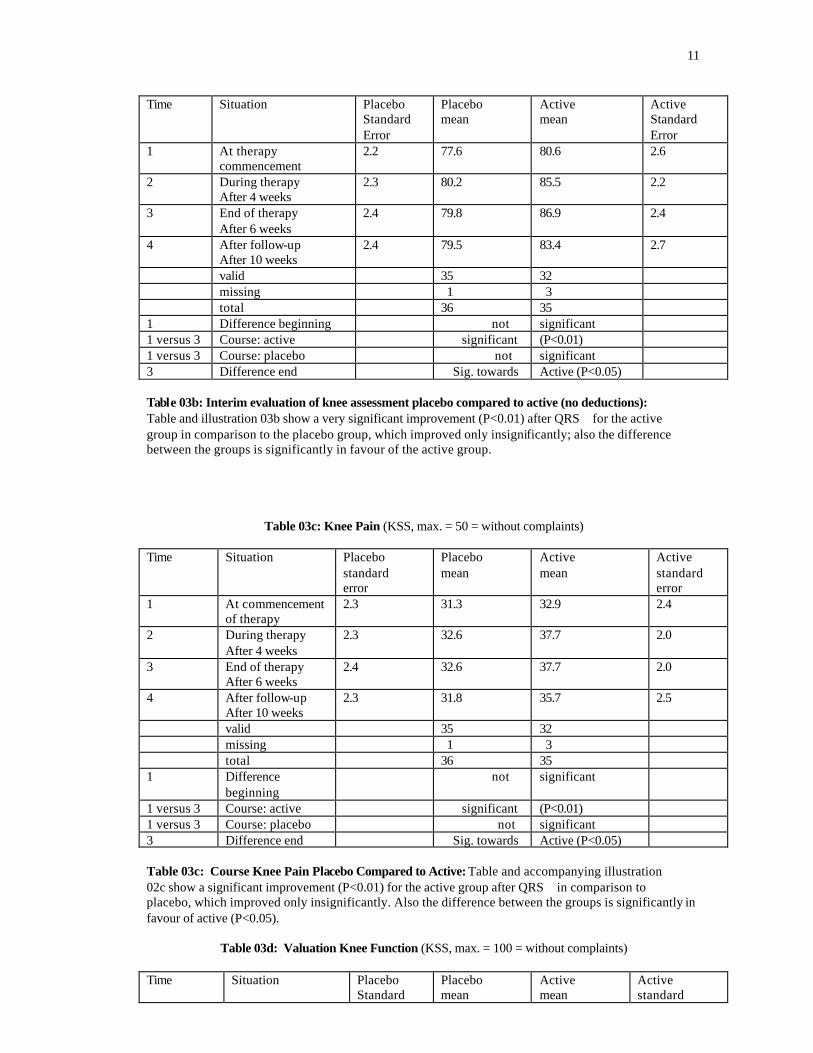
valid 35 32 missing 1 3 total 36 35 1 Difference beginning not significant 1 versus 3 Course: active significant (P<0.01) 1 versus 3 Course: placebo not significant 3 Difference end Sig. towards Active (P<0.05) Table 03b: Interim evaluation of knee assessment placebo compared to active (no deductions): Table and illustration 03b show a very significant improvement (P<0.01) after QRS for the active group in comparison to the placebo group, which improved only insignificantly; also the difference between the groups is significantly in favour of the active group.
Table 03c: Knee Pain (KSS, max. = 50 = without complaints) Time Situation Placebo
standard error
Placebo mean
Active mean
Active standard error
1 At commencement of therapy
2.3 31.3 32.9 2.4
2 During therapy After 4 weeks
2.3 32.6 37.7 2.0
3 End of therapy After 6 weeks
2.4 32.6 37.7 2.0
4 After follow-up After 10 weeks
2.3 31.8 35.7 2.5
valid 35 32 missing 1 3 total 36 35 1 Difference
beginning not significant
1 versus 3 Course: active significant (P<0.01) 1 versus 3 Course: placebo not significant 3 Difference end Sig. towards Active (P<0.05) Table 03c: Course Knee Pain Placebo Compared to Active: Table and accompanying illustration 02c show a significant improvement (P<0.01) for the active group after QRS in comparison to placebo, which improved only insignificantly. Also the difference between the groups is significantly in favour of active (P<0.05).
Table 03d: Valuation Knee Function (KSS, max. = 100 = without complaints) Time Situation Placebo
Standard Placebo mean
Active mean
Active standard
12
error error 1 At commencement
of therapy 2.2 66.9 73.4 2.5
2 During therapy After 4 weeks
2.9 66.5 76.3 2.8
3 End of therapy After 6 weeks
2.5 69.4 74.7 2.7
4 After follow-up After 10 weeks
2.8 66.8 75.7 3.0
valid 33 34 missing 3 1 total 36 35 1 Difference
beginning Slightly
significant (P<0.1)
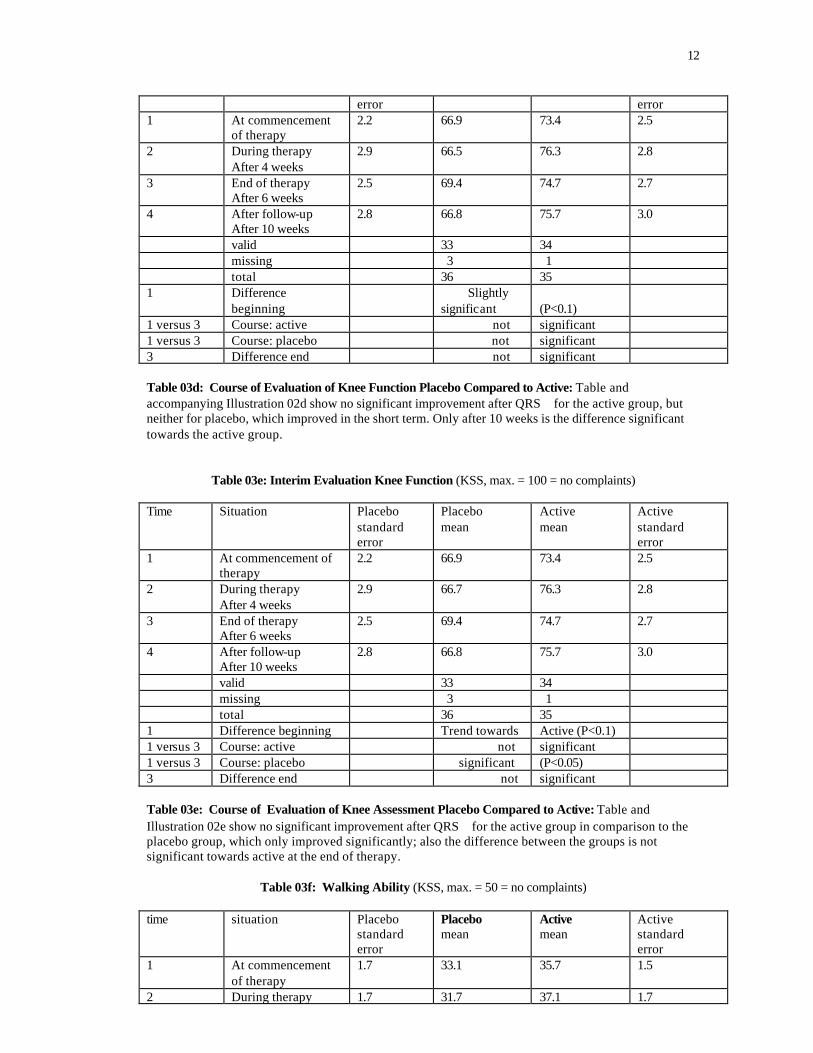
1 versus 3 Course: active not significant 1 versus 3 Course: placebo not significant 3 Difference end not significant Table 03d: Course of Evaluation of Knee Function Placebo Compared to Active: Table and accompanying Illustration 02d show no significant improvement after QRS for the active group, but neither for placebo, which improved in the short term. Only after 10 weeks is the difference significant towards the active group.
Table 03e: Interim Evaluation Knee Function (KSS, max. = 100 = no complaints) Time Situation Placebo
standard error
Placebo mean
Active mean
Active standard error
1 At commencement of therapy
2.2 66.9 73.4 2.5
2 During therapy After 4 weeks
2.9 66.7 76.3 2.8
3 End of therapy After 6 weeks
2.5 69.4 74.7 2.7
4 After follow-up After 10 weeks
2.8 66.8 75.7 3.0
valid 33 34 missing 3 1 total 36 35 1 Difference beginning Trend towards Active (P<0.1) 1 versus 3 Course: active not significant 1 versus 3 Course: placebo significant (P<0.05) 3 Difference end not significant Table 03e: Course of Evaluation of Knee Assessment Placebo Compared to Active: Table and Illustration 02e show no significant improvement after QRS for the active group in comparison to the placebo group, which only improved significantly; also the difference between the groups is not significant towards active at the end of therapy.
Table 03f: Walking Ability (KSS, max. = 50 = no complaints)
time situation Placebo
standard error
Placebo mean
Active mean
Active standard error
1 At commencement of therapy
1.7 33.1 35.7 1.5
2 During therapy 1.7 31.7 37.1 1.7
13
After 4 weeks 3 End of therapy
After 6 weeks 2.5 32.1 36.8 1.6
4 After follow-up After 10 weeks
1.8 32.6 37.1 1.6
valid 33 34 missing 3 1 total 36 35 1 Difference
beginning not significant
1 versus 3 Course: active not significant 1 versus 3 Course: placebo declined 3 Difference end Sig. towards Active
(P<0.05)
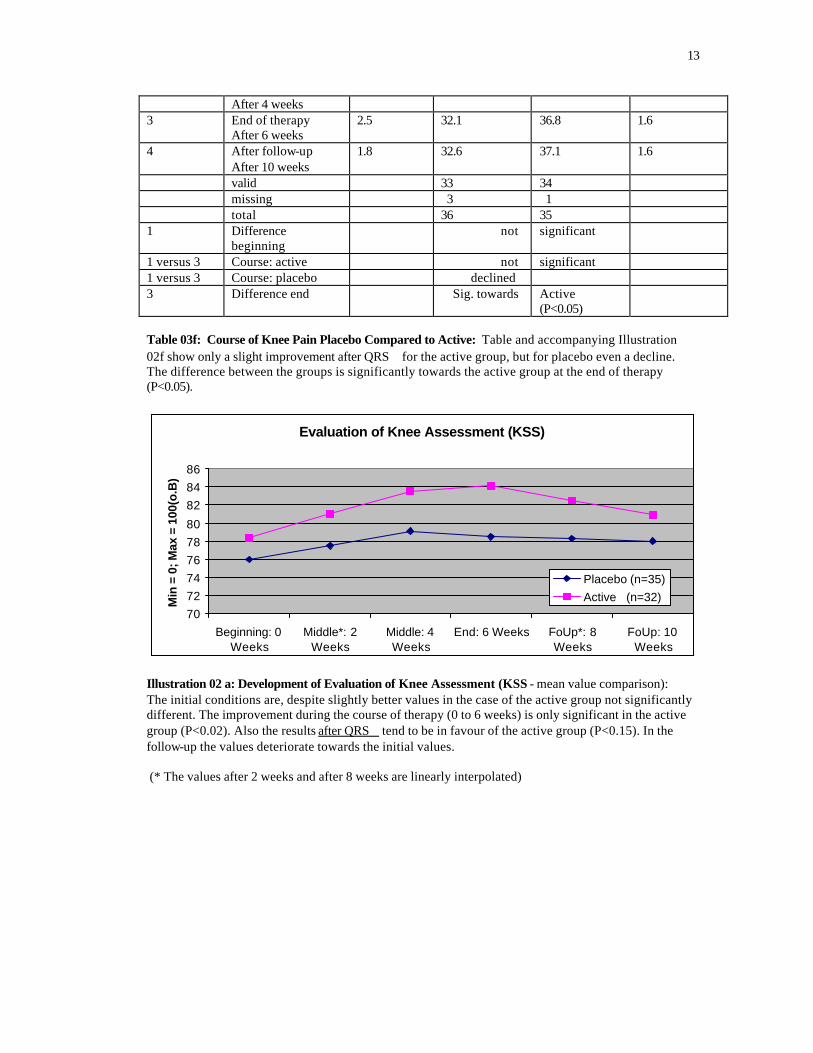
Table 03f: Course of Knee Pain Placebo Compared to Active: Table and accompanying Illustration 02f show only a slight improvement after QRS for the active group, but for placebo even a decline. The difference between the groups is significantly towards the active group at the end of therapy (P<0.05).
Evaluation of Knee Assessment (KSS)
707274767880
828486
Beginning: 0Weeks
Middle*: 2Weeks
Middle: 4Weeks
End: 6 Weeks FoUp*: 8Weeks
FoUp: 10Weeks
Min
= 0
; Max
= 1
00(o
.B)
Placebo (n=35)Active (n=32)
Illustration 02 a: Development of Evaluation of Knee Assessment (KSS - mean value comparison): The initial conditions are, despite slightly better values in the case of the active group not significantly different. The improvement during the course of therapy (0 to 6 weeks) is only significant in the active group (P<0.02). Also the results after QRS tend to be in favour of the active group (P<0.15). In the follow-up the values deteriorate towards the initial values. (* The values after 2 weeks and after 8 weeks are linearly interpolated)
14
Interim evaluation of knee assessment (KSS)
727476788082848688
Beginning:0 Weeks
Middle*: 2Weeks
Middle: 4Weeks
End: 6Weeks
FoUp*: 8Weeks
FoUp: 10Weeks
PlaceboActive
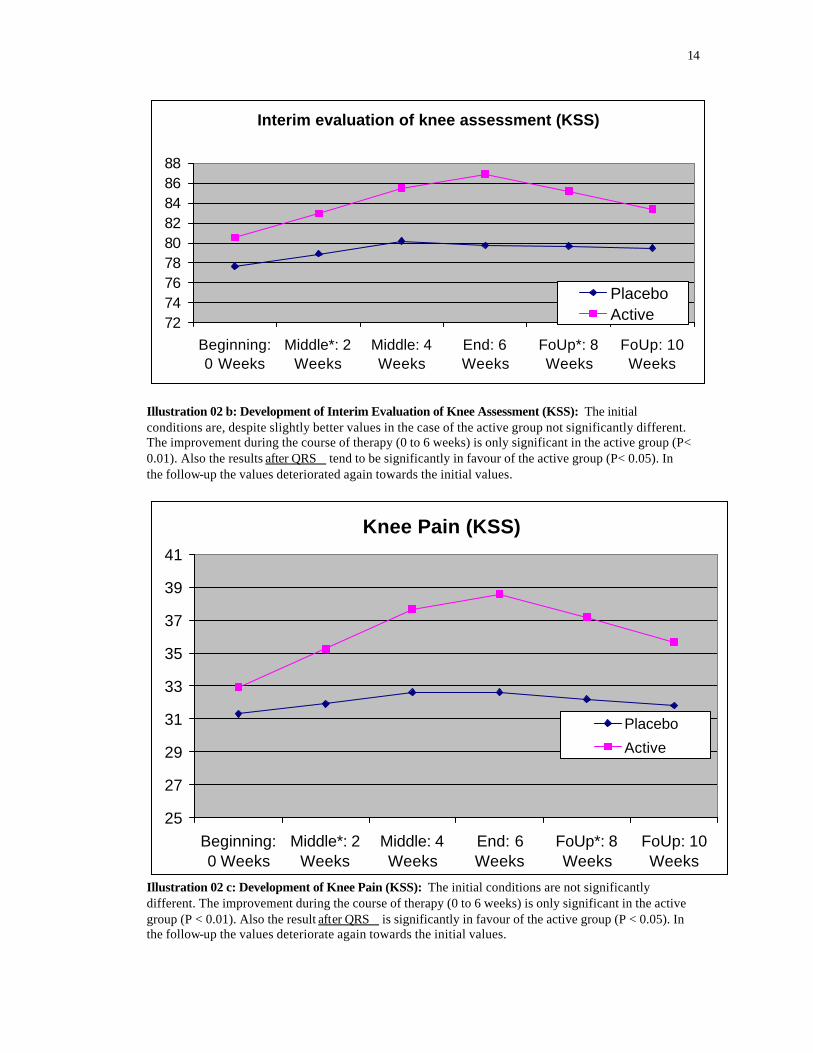
Illustration 02 b: Development of Interim Evaluation of Knee Assessment (KSS): The initial conditions are, despite slightly better values in the case of the active group not significantly different. The improvement during the course of therapy (0 to 6 weeks) is only significant in the active group (P< 0.01). Also the results after QRS tend to be significantly in favour of the active group (P< 0.05). In the follow-up the values deteriorated again towards the initial values.
Knee Pain (KSS)
25
27
29
31
33
35
37
39
41
Beginning:0 Weeks
Middle*: 2Weeks
Middle: 4Weeks
End: 6Weeks
FoUp*: 8Weeks
FoUp: 10Weeks
Placebo
Active
Illustration 02 c: Development of Knee Pain (KSS): The initial conditions are not significantly different. The improvement during the course of therapy (0 to 6 weeks) is only significant in the active group (P < 0.01). Also the result after QRS is significantly in favour of the active group (P < 0.05). In the follow-up the values deteriorate again towards the initial values.
15
Evaluation Knee function (KSS)
60626466687072747678
Beginning:0 Weeks
Middle*: 2Weeks
Middle: 4Weeks
End: 6Weeks
FoUp*: 8Weeks
FoUp: 10Weeks
* Mean values are interpolated
Min
= 0
; M
ax =
100
(o.B
)
Placebo (n=33)Active (n=34)
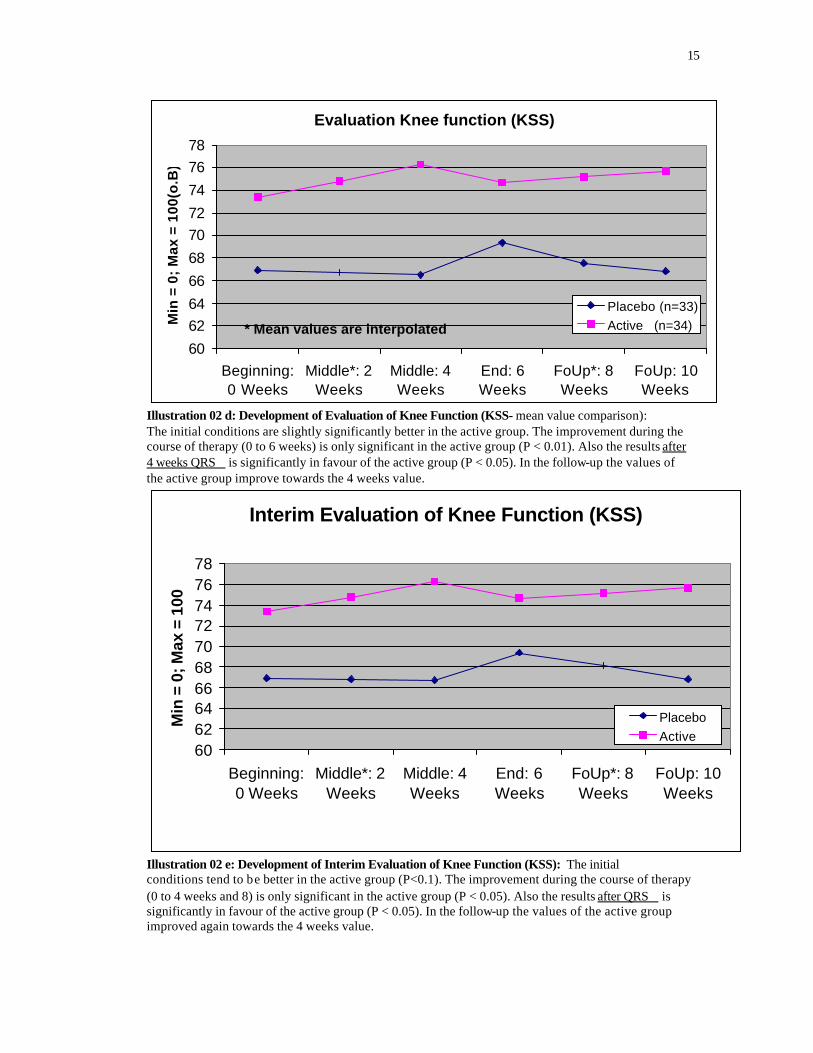
Illustration 02 d: Development of Evaluation of Knee Function (KSS- mean value comparison): The initial conditions are slightly significantly better in the active group. The improvement during the course of therapy (0 to 6 weeks) is only significant in the active group (P < 0.01). Also the results after 4 weeks QRS is significantly in favour of the active group (P < 0.05). In the follow-up the values of the active group improve towards the 4 weeks value.
Interim Evaluation of Knee Function (KSS)
60626466687072747678
Beginning:0 Weeks
Middle*: 2Weeks
Middle: 4Weeks
End: 6Weeks
FoUp*: 8Weeks
FoUp: 10Weeks
Min
= 0
; Max
= 1
00
PlaceboActive
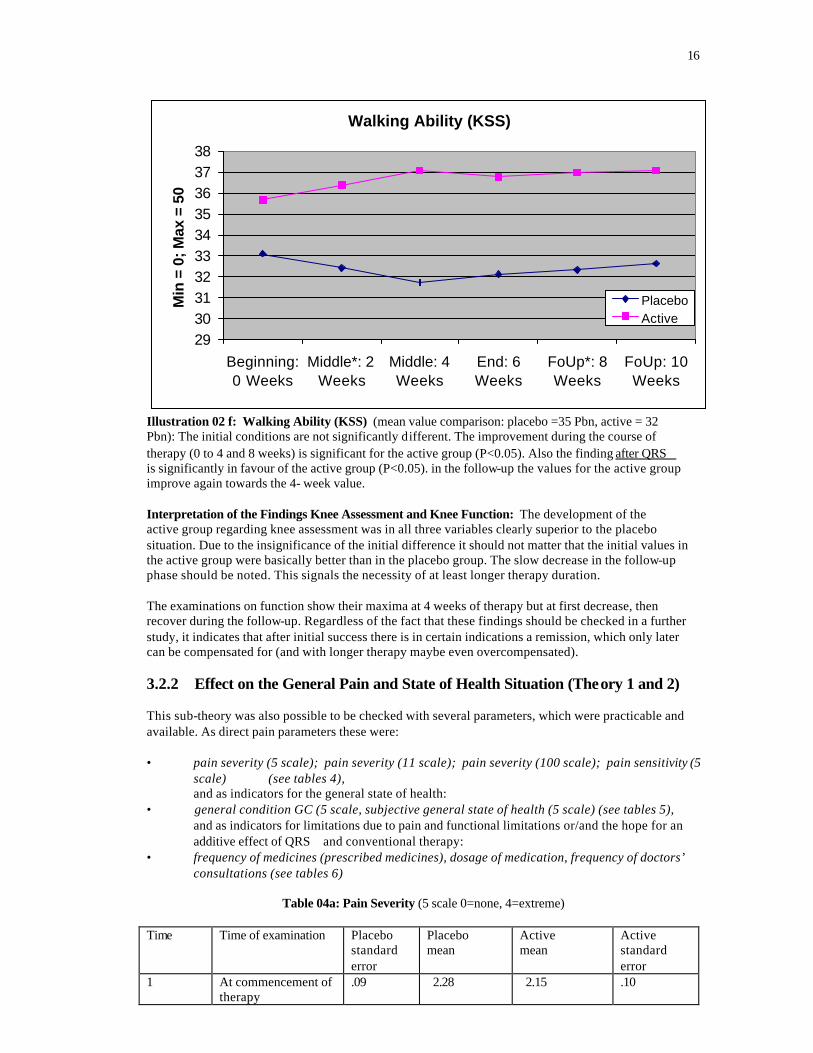
Illustration 02 e: Development of Interim Evaluation of Knee Function (KSS): The initial conditions tend to be better in the active group (P<0.1). The improvement during the course of therapy (0 to 4 weeks and 8) is only significant in the active group (P < 0.05). Also the results after QRS is significantly in favour of the active group (P < 0.05). In the follow-up the values of the active group improved again towards the 4 weeks value.
16
Walking Ability (KSS)
29303132333435363738
Beginning:0 Weeks
Middle*: 2Weeks
Middle: 4Weeks
End: 6Weeks
FoUp*: 8Weeks
FoUp: 10Weeks
Min
= 0
; Max
= 5
0
PlaceboActive
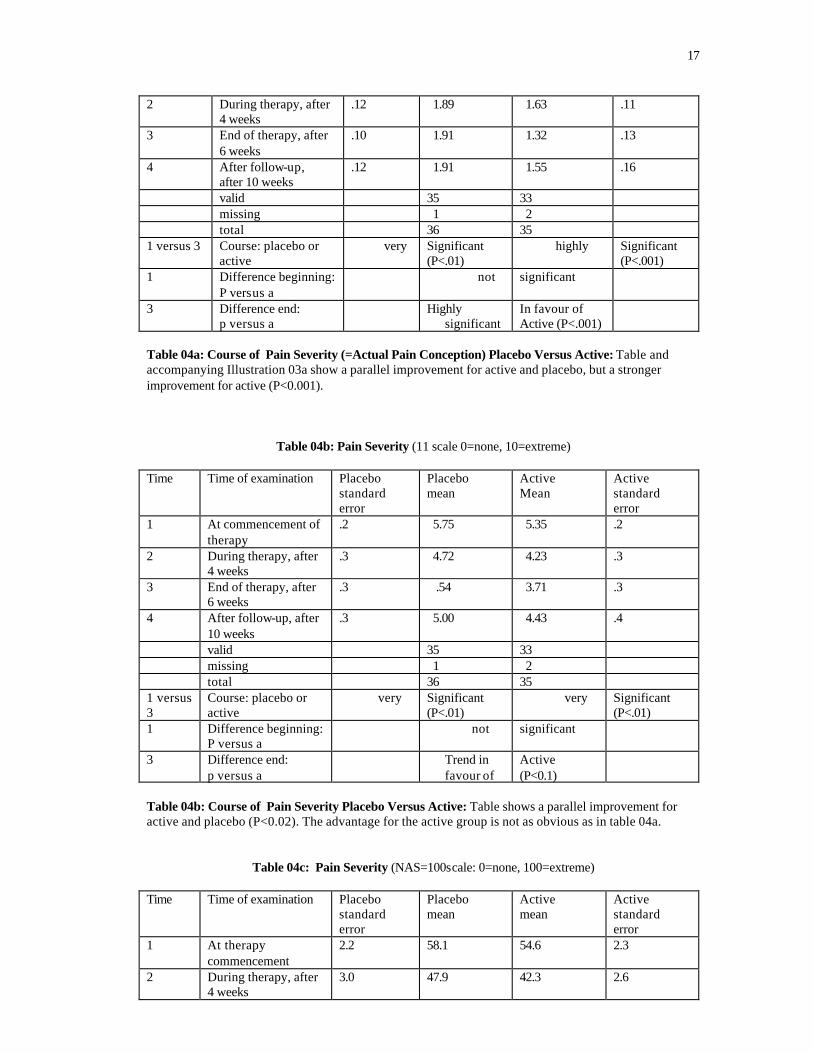
Illustration 02 f: Walking Ability (KSS) (mean value comparison: placebo =35 Pbn, active = 32 Pbn): The initial conditions are not significantly different. The improvement during the course of therapy (0 to 4 and 8 weeks) is significant for the active group (P<0.05). Also the finding after QRS is significantly in favour of the active group (P<0.05). in the follow-up the values for the active group improve again towards the 4- week value. Interpretation of the Findings Knee Assessment and Knee Function: The development of the active group regarding knee assessment was in all three variables clearly superior to the placebo situation. Due to the insignificance of the initial difference it should not matter that the initial values in the active group were basically better than in the placebo group. The slow decrease in the follow-up phase should be noted. This signals the necessity of at least longer therapy duration. The examinations on function show their maxima at 4 weeks of therapy but at first decrease, then recover during the follow-up. Regardless of the fact that these findings should be checked in a further study, it indicates that after initial success there is in certain indications a remission, which only later can be compensated for (and with longer therapy maybe even overcompensated). 3.2.2 Effect on the General Pain and State of Health Situation (Theory 1 and 2) This sub-theory was also possible to be checked with several parameters, which were practicable and available. As direct pain parameters these were: • pain severity (5 scale); pain severity (11 scale); pain severity (100 scale); pain sensitivity (5
scale) (see tables 4), and as indicators for the general state of health:
• general condition GC (5 scale, subjective general state of health (5 scale) (see tables 5), and as indicators for limitations due to pain and functional limitations or/and the hope for an additive effect of QRS and conventional therapy:
• frequency of medicines (prescribed medicines), dosage of medication, frequency of doctors’ consultations (see tables 6)
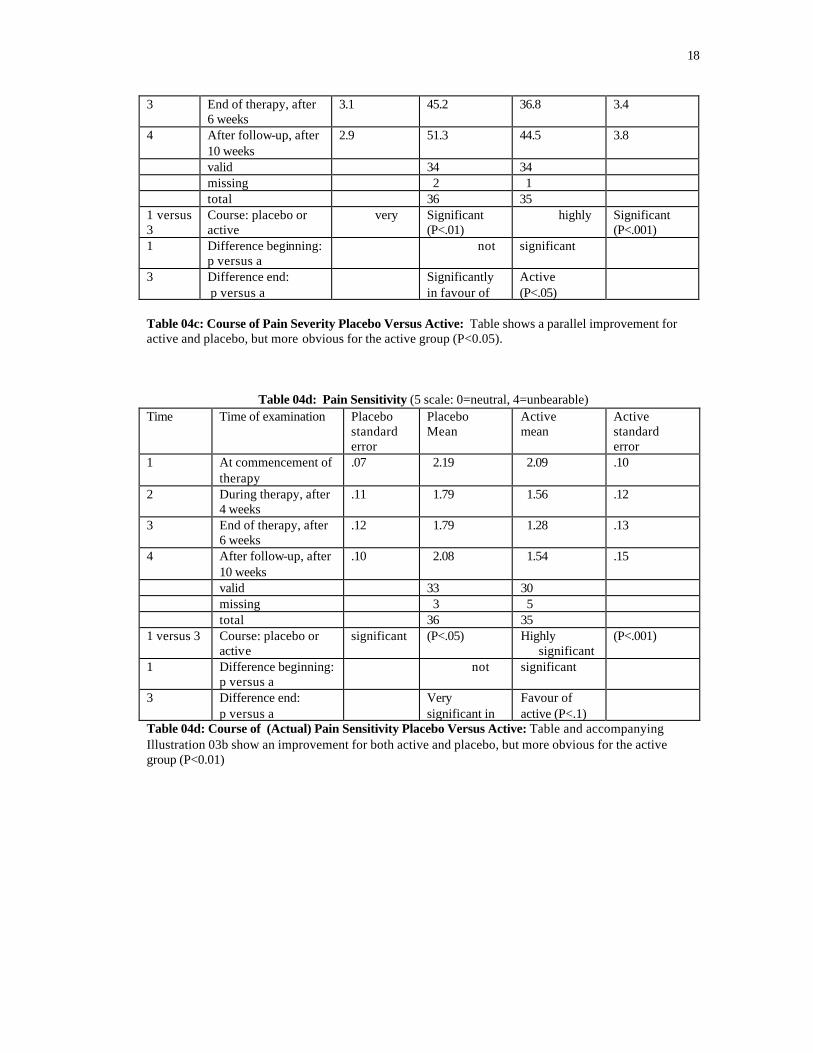
Table 04a: Pain Severity (5 scale 0=none, 4=extreme)
Time Time of examination Placebo
standard error
Placebo mean
Active mean
Active standard error
1 At commencement of therapy
.09 2.28 2.15 .10
17
2 During therapy, after 4 weeks
.12 1.89 1.63 .11
3 End of therapy, after 6 weeks
.10 1.91 1.32 .13
4 After follow-up, after 10 weeks
.12 1.91 1.55 .16
valid 35 33 missing 1 2 total 36 35 1 versus 3 Course: placebo or
active very Significant
(P<.01) highly Significant
(P<.001) 1 Difference beginning:
P versus a not significant
3 Difference end: p versus a
Highly significant
In favour of Active (P<.001)
Table 04a: Course of Pain Severity (=Actual Pain Conception) Placebo Versus Active: Table and accompanying Illustration 03a show a parallel improvement for active and placebo, but a stronger improvement for active (P<0.001).
Table 04b: Pain Severity (11 scale 0=none, 10=extreme) Time Time of examination Placebo
standard error
Placebo mean
Active Mean
Active standard error
1 At commencement of therapy
.2 5.75 5.35 .2
2 During therapy, after 4 weeks
.3 4.72 4.23 .3
3 End of therapy, after 6 weeks
.3 .54 3.71 .3
4 After follow-up, after 10 weeks
.3 5.00 4.43 .4
valid 35 33 missing 1 2 total 36 35 1 versus 3
Course: placebo or active
very Significant (P<.01)
very Significant (P<.01)
1 Difference beginning: P versus a
not significant
3 Difference end: p versus a
Trend in favour of
Active (P<0.1)
Table 04b: Course of Pain Severity Placebo Versus Active: Table shows a parallel improvement for active and placebo (P<0.02). The advantage for the active group is not as obvious as in table 04a.
Table 04c: Pain Severity (NAS=100scale: 0=none, 100=extreme) Time Time of examination Placebo
standard error
Placebo mean
Active mean
Active standard error
1 At therapy commencement
2.2 58.1 54.6 2.3
2 During therapy, after 4 weeks
3.0 47.9 42.3 2.6
18
3 End of therapy, after 6 weeks
3.1 45.2 36.8 3.4
4 After follow-up, after 10 weeks
2.9 51.3 44.5 3.8
valid 34 34 missing 2 1 total 36 35 1 versus 3
Course: placebo or active
very Significant (P<.01)
highly Significant (P<.001)
1 Difference beginning: p versus a
not significant
3 Difference end: p versus a
Significantly in favour of
Active (P<.05)
Table 04c: Course of Pain Severity Placebo Versus Active: Table shows a parallel improvement for active and placebo, but more obvious for the active group (P<0.05).
Table 04d: Pain Sensitivity (5 scale: 0=neutral, 4=unbearable) Time Time of examination Placebo
standard error
Placebo Mean
Active mean
Active standard error
1 At commencement of therapy
.07 2.19 2.09 .10
2 During therapy, after 4 weeks
.11 1.79 1.56 .12
3 End of therapy, after 6 weeks
.12 1.79 1.28 .13
4 After follow-up, after 10 weeks
.10 2.08 1.54 .15
valid 33 30 missing 3 5 total 36 35 1 versus 3 Course: placebo or
active significant (P<.05) Highly
significant (P<.001)
1 Difference beginning: p versus a
not significant
3 Difference end: p versus a
Very significant in
Favour of active (P<.1)
Table 04d: Course of (Actual) Pain Sensitivity Placebo Versus Active: Table and accompanying Illustration 03b show an improvement for both active and placebo, but more obvious for the active group (P<0.01)
19
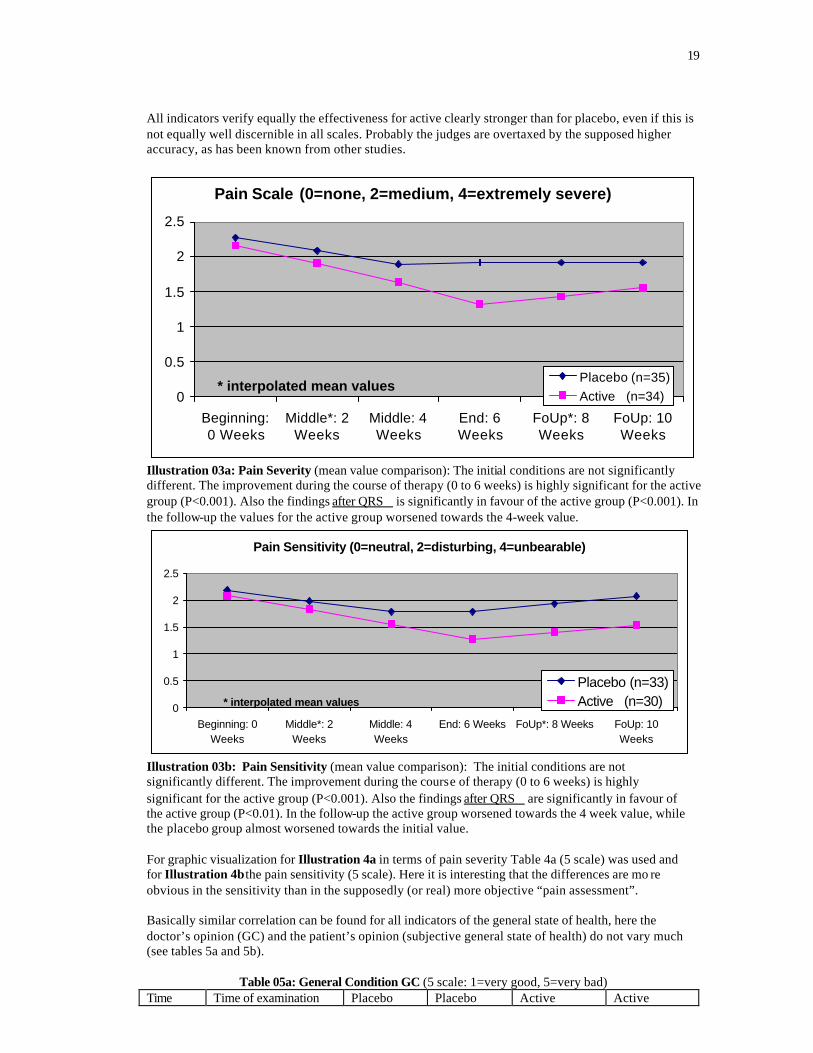
All indicators verify equally the effectiveness for active clearly stronger than for placebo, even if this is not equally well discernible in all scales. Probably the judges are overtaxed by the supposed higher accuracy, as has been known from other studies.
Pain Scale (0=none, 2=medium, 4=extremely severe)
0
0.5
1
1.5
2
2.5
Beginning:0 Weeks
Middle*: 2Weeks
Middle: 4Weeks
End: 6Weeks
FoUp*: 8Weeks
FoUp: 10Weeks
* interpolated mean valuesPlacebo (n=35)Active (n=34)
Illustration 03a: Pain Severity (mean value comparison): The initial conditions are not significantly different. The improvement during the course of therapy (0 to 6 weeks) is highly significant for the active group (P<0.001). Also the findings after QRS is significantly in favour of the active group (P<0.001). In the follow-up the values for the active group worsened towards the 4-week value.
Pain Sensitivity (0=neutral, 2=disturbing, 4=unbearable)
0
0.5
1
1.5
2
2.5
Beginning: 0Weeks
Middle*: 2Weeks
Middle: 4Weeks
End: 6 Weeks FoUp*: 8 Weeks FoUp: 10Weeks
* interpolated mean values
Placebo (n=33)Active (n=30)
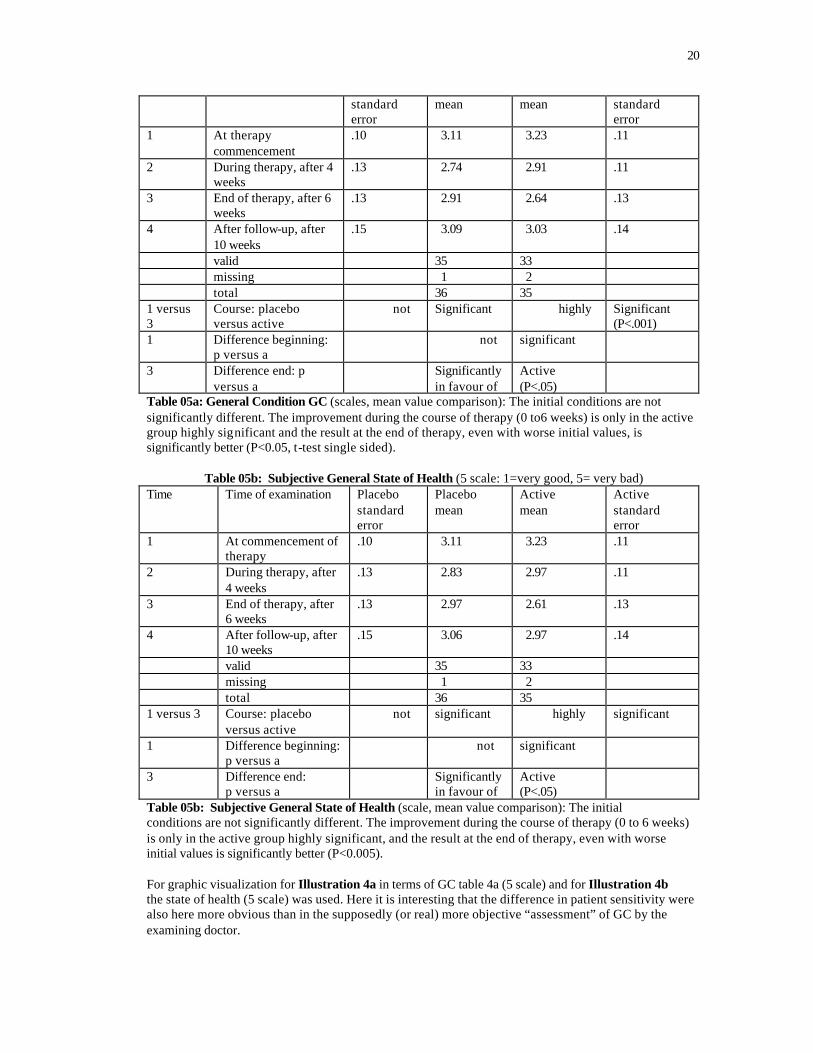
Illustration 03b: Pain Sensitivity (mean value comparison): The initial conditions are not significantly different. The improvement during the course of therapy (0 to 6 weeks) is highly significant for the active group (P<0.001). Also the findings after QRS are significantly in favour of the active group (P<0.01). In the follow-up the active group worsened towards the 4 week value, while the placebo group almost worsened towards the initial value. For graphic visualization for Illustration 4a in terms of pain severity Table 4a (5 scale) was used and for Illustration 4b the pain sensitivity (5 scale). Here it is interesting that the differences are mo re obvious in the sensitivity than in the supposedly (or real) more objective “pain assessment”. Basically similar correlation can be found for all indicators of the general state of health, here the doctor’s opinion (GC) and the patient’s opinion (subjective general state of health) do not vary much (see tables 5a and 5b).
Table 05a: General Condition GC (5 scale: 1=very good, 5=very bad) Time Time of examination Placebo Placebo Active Active
20
standard error
mean mean standard error
1 At therapy commencement
.10 3.11 3.23 .11
2 During therapy, after 4 weeks
.13 2.74 2.91 .11
3 End of therapy, after 6 weeks
.13 2.91 2.64 .13
4 After follow-up, after 10 weeks
.15 3.09 3.03 .14
valid 35 33 missing 1 2 total 36 35 1 versus 3
Course: placebo versus active
not Significant highly Significant (P<.001)
1 Difference beginning: p versus a
not significant
3 Difference end: p versus a
Significantly in favour of
Active (P<.05)
Table 05a: General Condition GC (scales, mean value comparison): The initial conditions are not significantly different. The improvement during the course of therapy (0 to6 weeks) is only in the active group highly significant and the result at the end of therapy, even with worse initial values, is significantly better (P<0.05, t-test single sided).
Table 05b: Subjective General State of Health (5 scale: 1=very good, 5= very bad) Time Time of examination Placebo
standard error
Placebo mean
Active mean
Active standard error
1 At commencement of therapy
.10 3.11 3.23 .11
2 During therapy, after 4 weeks
.13 2.83 2.97 .11
3 End of therapy, after 6 weeks
.13 2.97 2.61 .13
4 After follow-up, after 10 weeks
.15 3.06 2.97 .14
valid 35 33 missing 1 2 total 36 35 1 versus 3 Course: placebo
versus active not significant highly significant
1 Difference beginning: p versus a
not significant
3 Difference end: p versus a
Significantly in favour of
Active (P<.05)
Table 05b: Subjective General State of Health (scale, mean value comparison): The initial conditions are not significantly different. The improvement during the course of therapy (0 to 6 weeks) is only in the active group highly significant, and the result at the end of therapy, even with worse initial values is significantly better (P<0.005). For graphic visualization for Illustration 4a in terms of GC table 4a (5 scale) and for Illustration 4b the state of health (5 scale) was used. Here it is interesting that the difference in patient sensitivity were also here more obvious than in the supposedly (or real) more objective “assessment” of GC by the examining doctor.
21
General Condition GC (1= very good, 3= satisfactory, 5= very bad)
2
2.2
2.4
2.6
2.8
3
3.2
3.4
Beginning:0 Weeks
Middle*: 2Weeks
Middle: 4Weeks
End: 6Weeks
FoUp*: 8Weeks
FoUp: 10Weeks
* Interpolated Mean ValuesPlacebo (n=35)Active (n=33)
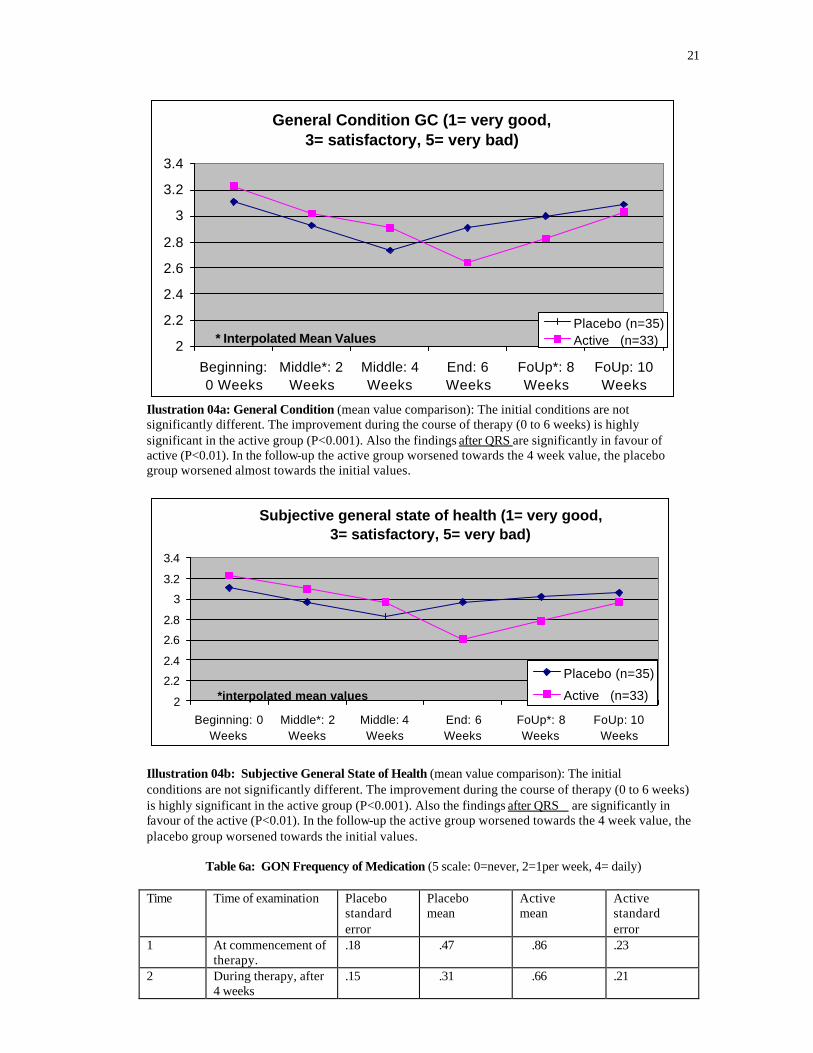
Ilustration 04a: General Condition (mean value comparison): The initial conditions are not significantly different. The improvement during the course of therapy (0 to 6 weeks) is highly significant in the active group (P<0.001). Also the findings after QRS are significantly in favour of active (P<0.01). In the follow-up the active group worsened towards the 4 week value, the placebo group worsened almost towards the initial values.
Subjective general state of health (1= very good, 3= satisfactory, 5= very bad)
2
2.2
2.4
2.6
2.8
3
3.2
3.4
Beginning: 0Weeks
Middle*: 2Weeks
Middle: 4Weeks
End: 6Weeks
FoUp*: 8Weeks
FoUp: 10Weeks
*interpolated mean values
Placebo (n=35)
Active (n=33)
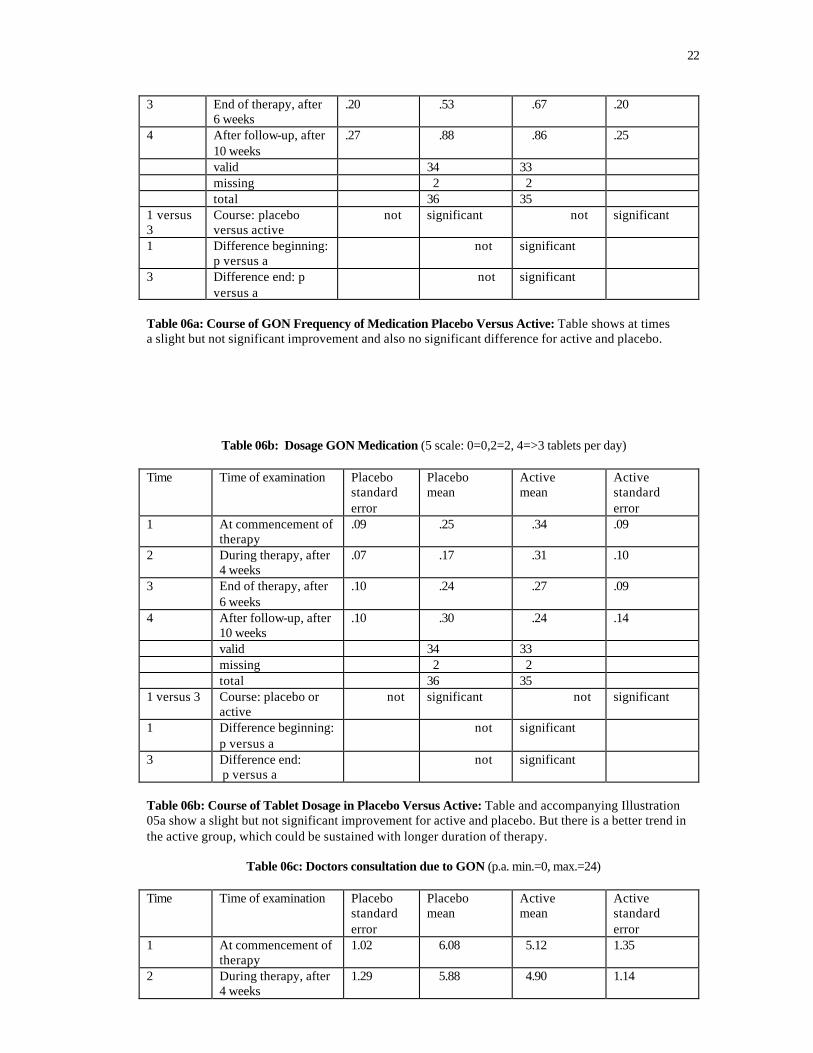
Illustration 04b: Subjective General State of Health (mean value comparison): The initial conditions are not significantly different. The improvement during the course of therapy (0 to 6 weeks) is highly significant in the active group (P<0.001). Also the findings after QRS are significantly in favour of the active (P<0.01). In the follow-up the active group worsened towards the 4 week value, the placebo group worsened towards the initial values.
Table 6a: GON Frequency of Medication (5 scale: 0=never, 2=1per week, 4= daily) Time Time of examination Placebo
standard error
Placebo mean
Active mean
Active standard error
1 At commencement of therapy.
.18 .47 .86 .23
2 During therapy, after 4 weeks
.15 .31 .66 .21
22
3 End of therapy, after 6 weeks
.20 .53 .67 .20
4 After follow-up, after 10 weeks
.27 .88 .86 .25
valid 34 33 missing 2 2 total 36 35 1 versus 3
Course: placebo versus active
not significant not significant
1 Difference beginning: p versus a
not significant
3 Difference end: p versus a
not significant
Table 06a: Course of GON Frequency of Medication Placebo Versus Active: Table shows at times a slight but not significant improvement and also no significant difference for active and placebo.
Table 06b: Dosage GON Medication (5 scale: 0=0,2=2, 4=>3 tablets per day) Time Time of examination Placebo
standard error
Placebo mean
Active mean
Active standard error
1 At commencement of therapy
.09 .25 .34 .09
2 During therapy, after 4 weeks
.07 .17 .31 .10
3 End of therapy, after 6 weeks
.10 .24 .27 .09
4 After follow-up, after 10 weeks
.10 .30 .24 .14
valid 34 33 missing 2 2 total 36 35 1 versus 3 Course: placebo or
active not significant not significant
1 Difference beginning: p versus a
not significant
3 Difference end: p versus a
not significant
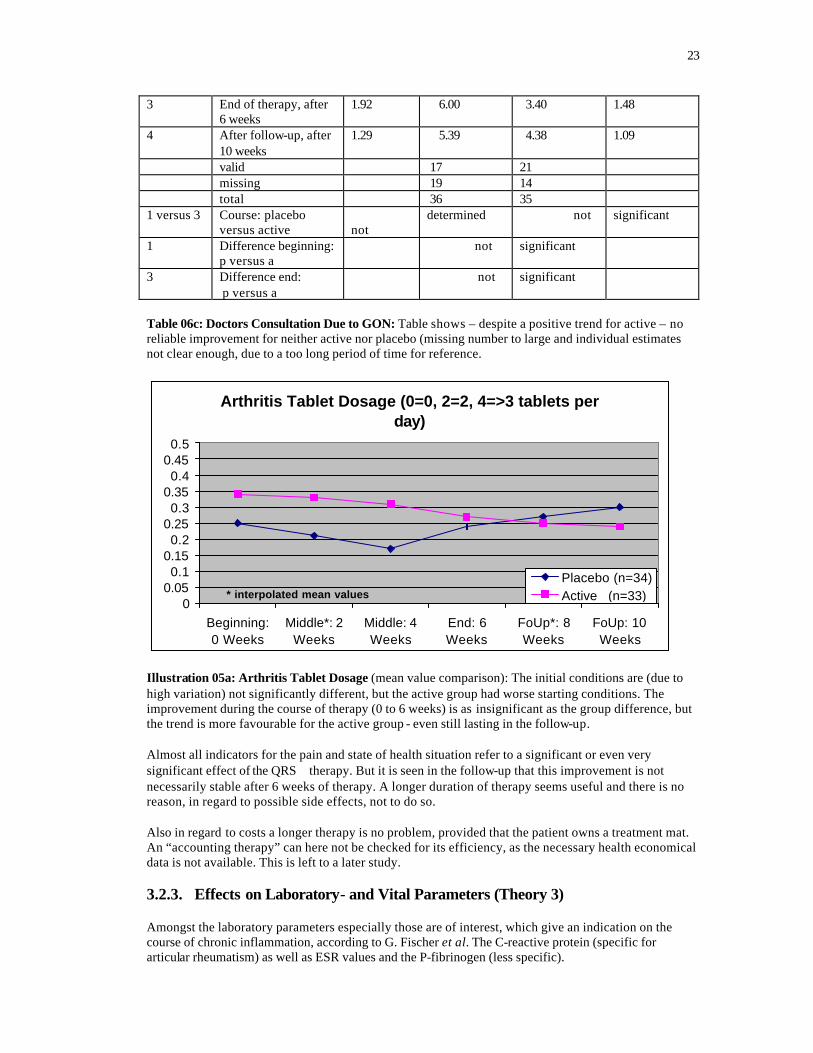
Table 06b: Course of Tablet Dosage in Placebo Versus Active: Table and accompanying Illustration 05a show a slight but not significant improvement for active and placebo. But there is a better trend in the active group, which could be sustained with longer duration of therapy.
Table 06c: Doctors consultation due to GON (p.a. min.=0, max.=24) Time Time of examination Placebo
standard error
Placebo mean
Active mean
Active standard error
1 At commencement of therapy
1.02 6.08 5.12 1.35
2 During therapy, after 4 weeks
1.29 5.88 4.90 1.14
23
3 End of therapy, after 6 weeks
1.92 6.00 3.40 1.48
4 After follow-up, after 10 weeks
1.29 5.39 4.38 1.09
valid 17 21 missing 19 14 total 36 35 1 versus 3 Course: placebo
versus active not
determined not significant
1 Difference beginning: p versus a
not significant
3 Difference end: p versus a
not significant
Table 06c: Doctors Consultation Due to GON: Table shows – despite a positive trend for active – no reliable improvement for neither active nor placebo (missing number to large and individual estimates not clear enough, due to a too long period of time for reference.
Arthritis Tablet Dosage (0=0, 2=2, 4=>3 tablets per day)
00.050.1
0.150.2
0.250.3
0.350.4
0.450.5
Beginning:0 Weeks
Middle*: 2Weeks
Middle: 4Weeks
End: 6Weeks
FoUp*: 8Weeks
FoUp: 10Weeks
* interpolated mean valuesPlacebo (n=34)Active (n=33)
Illustration 05a: Arthritis Tablet Dosage (mean value comparison): The initial conditions are (due to high variation) not significantly different, but the active group had worse starting conditions. The improvement during the course of therapy (0 to 6 weeks) is as insignificant as the group difference, but the trend is more favourable for the active group - even still lasting in the follow-up. Almost all indicators for the pain and state of health situation refer to a significant or even very significant effect of the QRS therapy. But it is seen in the follow-up that this improvement is not necessarily stable after 6 weeks of therapy. A longer duration of therapy seems useful and there is no reason, in regard to possible side effects, not to do so. Also in regard to costs a longer therapy is no problem, provided that the patient owns a treatment mat. An “accounting therapy” can here not be checked for its efficiency, as the necessary health economical data is not available. This is left to a later study. 3.2.3. Effects on Laboratory- and Vital Parameters (Theory 3) Amongst the laboratory parameters especially those are of interest, which give an indication on the course of chronic inflammation, according to G. Fischer et al. The C-reactive protein (specific for articular rheumatism) as well as ESR values and the P-fibrinogen (less specific).
24
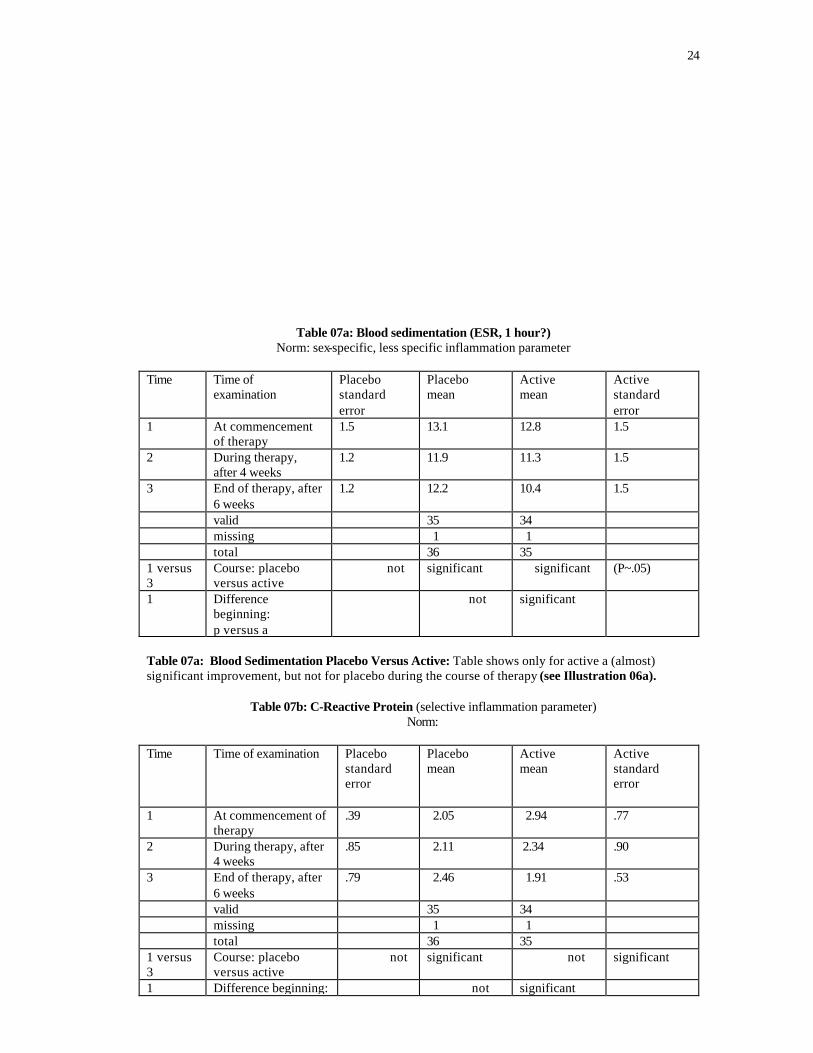
Table 07a: Blood sedimentation (ESR, 1 hour?) Norm: sex-specific, less specific inflammation parameter
Time Time of
examination Placebo standard error
Placebo mean
Active mean
Active standard error
1 At commencement of therapy
1.5 13.1 12.8 1.5
2 During therapy, after 4 weeks
1.2 11.9 11.3 1.5
3 End of therapy, after 6 weeks
1.2 12.2 10.4 1.5
valid 35 34 missing 1 1 total 36 35 1 versus 3
Course: placebo versus active
not significant significant (P~.05)
1 Difference beginning: p versus a
not significant
Table 07a: Blood Sedimentation Placebo Versus Active: Table shows only for active a (almost) significant improvement, but not for placebo during the course of therapy (see Illustration 06a).
Table 07b: C-Reactive Protein (selective inflammation parameter) Norm:
Time Time of examination Placebo
standard error
Placebo mean
Active mean
Active standard error
1 At commencement of therapy
.39 2.05 2.94 .77
2 During therapy, after 4 weeks
.85 2.11 2.34 .90
3 End of therapy, after 6 weeks
.79 2.46 1.91 .53
valid 35 34 missing 1 1 total 36 35 1 versus 3
Course: placebo versus active
not significant not significant
1 Difference beginning: not significant
25
p versus a 3 Difference end:
p versus a not significant
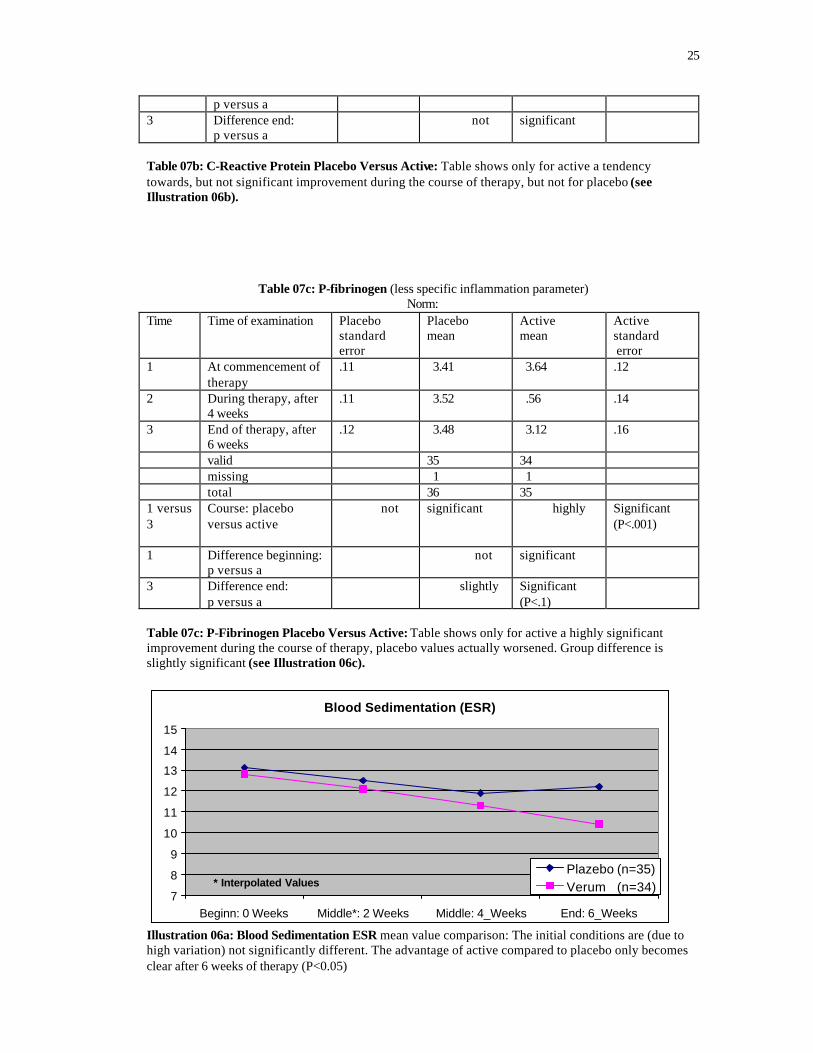
Table 07b: C-Reactive Protein Placebo Versus Active: Table shows only for active a tendency towards, but not significant improvement during the course of therapy, but not for placebo (see Illustration 06b).
Table 07c: P-fibrinogen (less specific inflammation parameter) Norm:
Time Time of examination Placebo standard error
Placebo mean
Active mean
Active standard error
1 At commencement of therapy
.11 3.41 3.64 .12
2 During therapy, after 4 weeks
.11 3.52 .56 .14
3 End of therapy, after 6 weeks
.12 3.48 3.12 .16
valid 35 34 missing 1 1 total 36 35 1 versus 3
Course: placebo versus active
not significant highly Significant (P<.001)
1 Difference beginning: p versus a
not significant
3 Difference end: p versus a
slightly Significant (P<.1)
Table 07c: P-Fibrinogen Placebo Versus Active: Table shows only for active a highly significant improvement during the course of therapy, placebo values actually worsened. Group difference is slightly significant (see Illustration 06c).
Blood Sedimentation (ESR)
7
8
9
10
11
12
13
14
15
Beginn: 0 Weeks Middle*: 2 Weeks Middle: 4_Weeks End: 6_Weeks
* Interpolated ValuesPlazebo (n=35)Verum (n=34)
Illustration 06a: Blood Sedimentation ESR mean value comparison: The initial conditions are (due to high variation) not significantly different. The advantage of active compared to placebo only becomes clear after 6 weeks of therapy (P<0.05)
26
C-Reactive Protein (selective rheumatism parameter)
11.21.41.61.8
22.22.42.62.8
3
Beginn: 0 Weeks Middle*: 2 Weeks Middle: 4_Weeks End: 6_Weeks
* Interpolated values Placebo (n=35)Active (n=34)
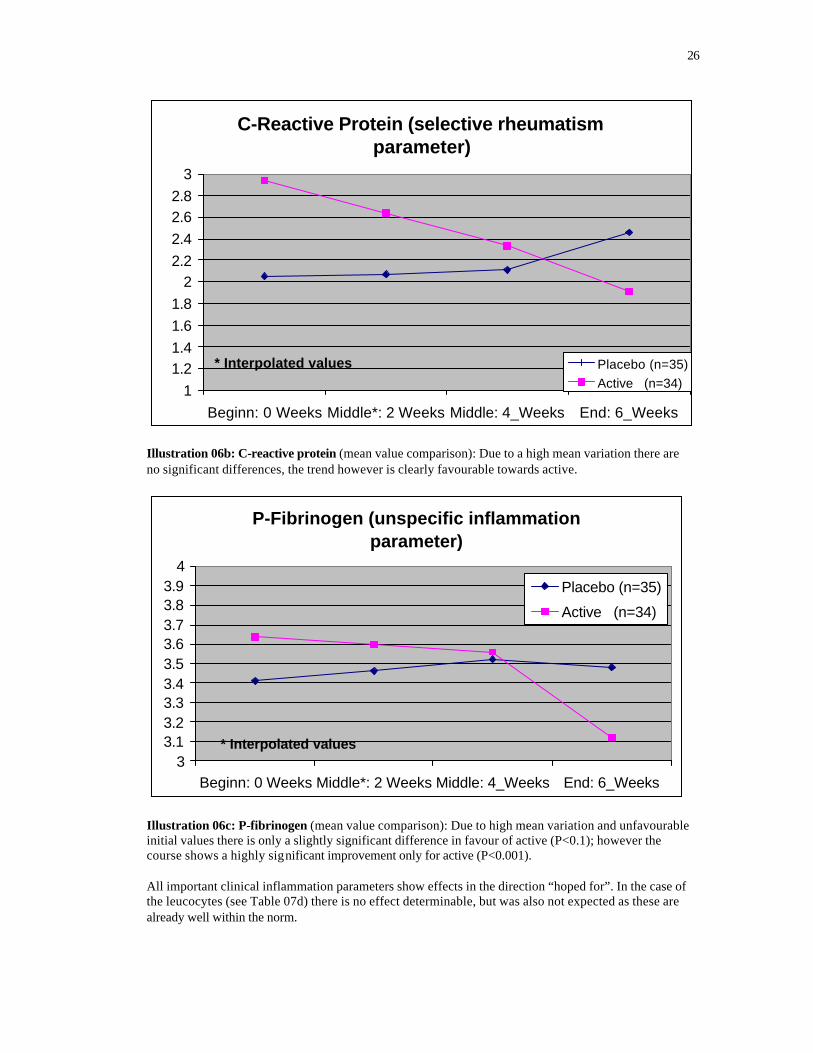
Illustration 06b: C-reactive protein (mean value comparison): Due to a high mean variation there are no significant differences, the trend however is clearly favourable towards active.
P-Fibrinogen (unspecific inflammation parameter)
33.13.23.33.43.53.63.73.83.9
4
Beginn: 0 Weeks Middle*: 2 Weeks Middle: 4_Weeks End: 6_Weeks
* Interpolated values
Placebo (n=35)
Active (n=34)
Illustration 06c: P-fibrinogen (mean value comparison): Due to high mean variation and unfavourable initial values there is only a slightly significant difference in favour of active (P<0.1); however the course shows a highly significant improvement only for active (P<0.001). All important clinical inflammation parameters show effects in the direction “hoped for”. In the case of the leucocytes (see Table 07d) there is no effect determinable, but was also not expected as these are already well within the norm.
27
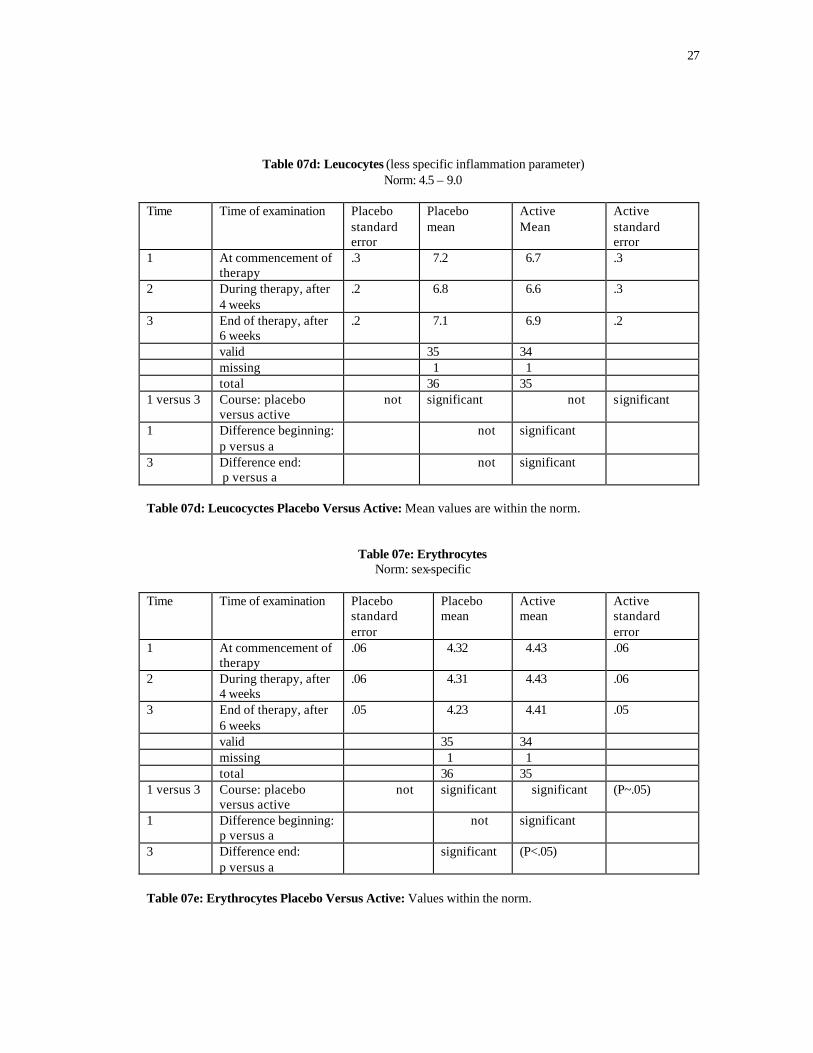
Table 07d: Leucocytes (less specific inflammation parameter) Norm: 4.5 – 9.0
Time Time of examination Placebo
standard error
Placebo mean
Active Mean
Active standard error
1 At commencement of therapy
.3 7.2 6.7 .3
2 During therapy, after 4 weeks
.2 6.8 6.6 .3
3 End of therapy, after 6 weeks
.2 7.1 6.9 .2
valid 35 34 missing 1 1 total 36 35 1 versus 3 Course: placebo
versus active not significant not significant
1 Difference beginning: p versus a
not significant
3 Difference end: p versus a
not significant
Table 07d: Leucocyctes Placebo Versus Active: Mean values are within the norm.
Table 07e: Erythrocytes Norm: sex-specific
Time Time of examination Placebo
standard error
Placebo mean
Active mean
Active standard error
1 At commencement of therapy
.06 4.32 4.43 .06
2 During therapy, after 4 weeks
.06 4.31 4.43 .06
3 End of therapy, after 6 weeks
.05 4.23 4.41 .05
valid 35 34 missing 1 1 total 36 35 1 versus 3 Course: placebo
versus active not significant significant
(P~.05)
1 Difference beginning: p versus a
not significant
3 Difference end: p versus a
significant (P<.05)
Table 07e: Erythrocytes Placebo Versus Active: Values within the norm.
28
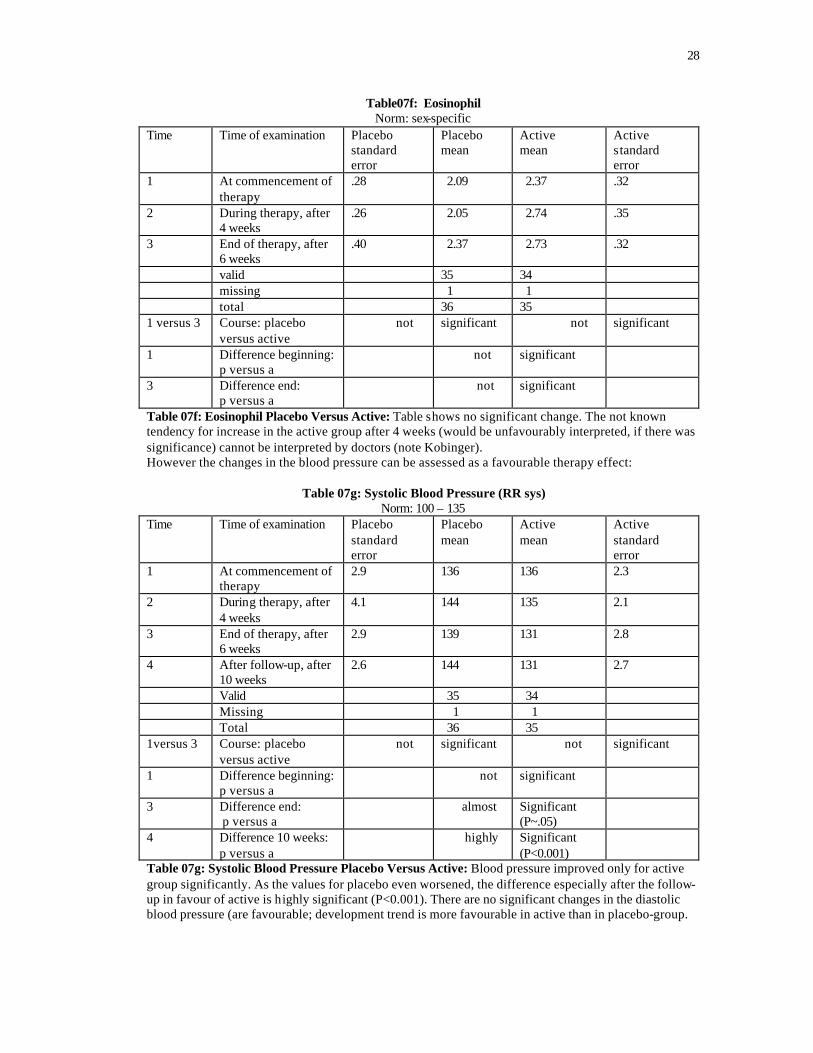
Table07f: Eosinophil Norm: sex-specific
Time Time of examination Placebo standard error
Placebo mean
Active mean
Active standard error
1 At commencement of therapy
.28 2.09 2.37 .32
2 During therapy, after 4 weeks
.26 2.05 2.74 .35
3 End of therapy, after 6 weeks
.40 2.37 2.73 .32
valid 35 34 missing 1 1 total 36 35 1 versus 3 Course: placebo
versus active not significant not significant
1 Difference beginning: p versus a
not significant
3 Difference end: p versus a
not significant
Table 07f: Eosinophil Placebo Versus Active: Table shows no significant change. The not known tendency for increase in the active group after 4 weeks (would be unfavourably interpreted, if there was significance) cannot be interpreted by doctors (note Kobinger). However the changes in the blood pressure can be assessed as a favourable therapy effect:
Table 07g: Systolic Blood Pressure (RR sys) Norm: 100 – 135
Time Time of examination Placebo standard error
Placebo mean
Active mean
Active standard error
1 At commencement of therapy
2.9 136 136 2.3
2 During therapy, after 4 weeks
4.1 144 135 2.1
3 End of therapy, after 6 weeks
2.9 139 131 2.8
4 After follow-up, after 10 weeks
2.6 144 131 2.7
Valid 35 34 Missing 1 1 Total 36 35 1versus 3 Course: placebo
versus active not significant not significant
1 Difference beginning: p versus a
not significant
3 Difference end: p versus a
almost Significant (P~.05)
4 Difference 10 weeks: p versus a
highly Significant (P<0.001)
Table 07g: Systolic Blood Pressure Placebo Versus Active: Blood pressure improved only for active group significantly. As the values for placebo even worsened, the difference especially after the follow-up in favour of active is highly significant (P<0.001). There are no significant changes in the diastolic blood pressure (are favourable; development trend is more favourable in active than in placebo-group.
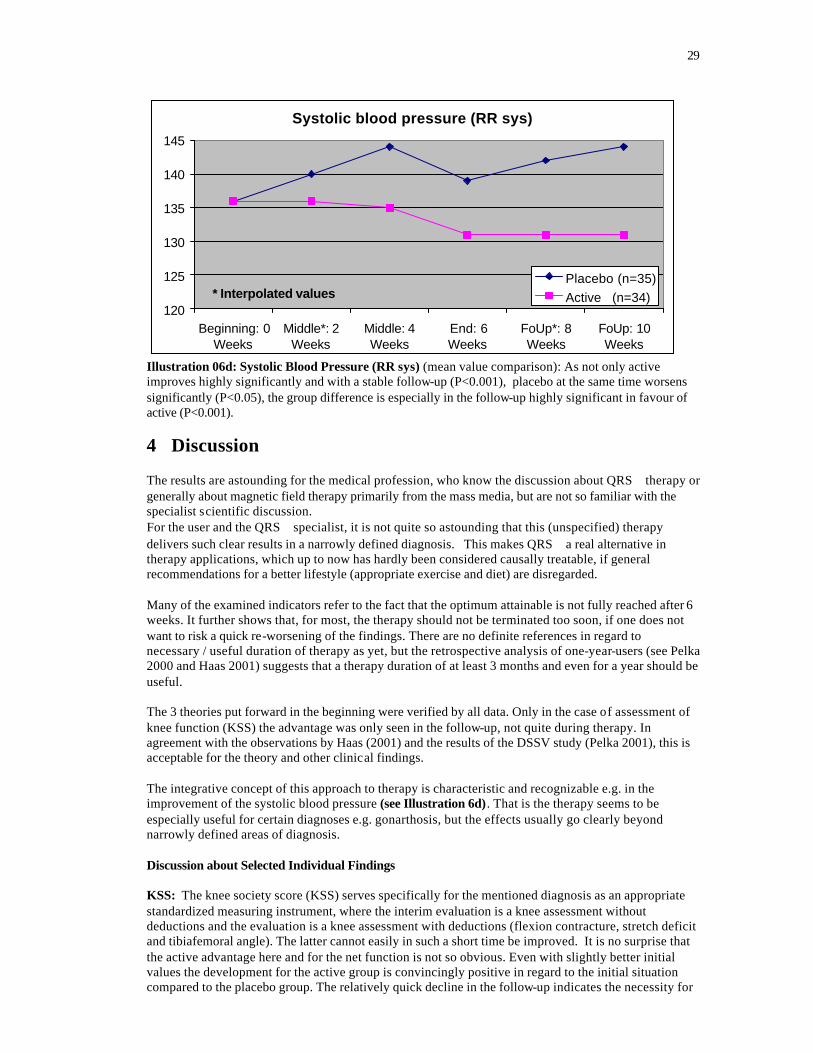
29
Systolic blood pressure (RR sys)
120
125
130
135
140
145
Beginning: 0Weeks
Middle*: 2Weeks
Middle: 4Weeks
End: 6Weeks
FoUp*: 8Weeks
FoUp: 10Weeks
* Interpolated valuesPlacebo (n=35)Active (n=34)
Illustration 06d: Systolic Blood Pressure (RR sys) (mean value comparison): As not only active improves highly significantly and with a stable follow-up (P<0.001), placebo at the same time worsens significantly (P<0.05), the group difference is especially in the follow-up highly significant in favour of active (P<0.001).
4 Discussion The results are astounding for the medical profession, who know the discussion about QRS therapy or generally about magnetic field therapy primarily from the mass media, but are not so familiar with the specialist scientific discussion. For the user and the QRS specialist, it is not quite so astounding that this (unspecified) therapy delivers such clear results in a narrowly defined diagnosis. This makes QRS a real alternative in therapy applications, which up to now has hardly been considered causally treatable, if general recommendations for a better lifestyle (appropriate exercise and diet) are disregarded. Many of the examined indicators refer to the fact that the optimum attainable is not fully reached after 6 weeks. It further shows that, for most, the therapy should not be terminated too soon, if one does not want to risk a quick re-worsening of the findings. There are no definite references in regard to necessary / useful duration of therapy as yet, but the retrospective analysis of one-year-users (see Pelka 2000 and Haas 2001) suggests that a therapy duration of at least 3 months and even for a year should be useful. The 3 theories put forward in the beginning were verified by all data. Only in the case of assessment of knee function (KSS) the advantage was only seen in the follow-up, not quite during therapy. In agreement with the observations by Haas (2001) and the results of the DSSV study (Pelka 2001), this is acceptable for the theory and other clinical findings. The integrative concept of this approach to therapy is characteristic and recognizable e.g. in the improvement of the systolic blood pressure (see Illustration 6d). That is the therapy seems to be especially useful for certain diagnoses e.g. gonarthosis, but the effects usually go clearly beyond narrowly defined areas of diagnosis. Discussion about Selected Individual Findings KSS: The knee society score (KSS) serves specifically for the mentioned diagnosis as an appropriate standardized measuring instrument, where the interim evaluation is a knee assessment without deductions and the evaluation is a knee assessment with deductions (flexion contracture, stretch deficit and tibiafemoral angle). The latter cannot easily in such a short time be improved. It is no surprise that the active advantage here and for the net function is not so obvious. Even with slightly better initial values the development for the active group is convincingly positive in regard to the initial situation compared to the placebo group. The relatively quick decline in the follow-up indicates the necessity for
30
longer therapy. This does not contradict the seemingly contrary finding in case of the knee function and the stable findings in the case of walking ability. Obviously these functional results are only reached with a time delay, dependent or at least corresponding to the assessment 2 weeks earlier. Especially the KSS results and the later pain values suggest a longer to long duration of therapy. General Pain Assessment: All indicators show similar results. The more the subjective sensitivity of patients is taken into account, the more clearly advantageous QRS therapy is (see pain sensitivity versus pain scale, page 22 or subjective general state of health versus general condition, page 24). All developments have in common, that the advantage of active is lost relatively soon. After 4 weeks only 20 to 80% of the attained differences to placebo remain. This indicates a systematic examination about the correlation of therapy duration and the following stability of findings. Use of Medication / Doctors’ Consultations: To assess these results (not bad for QRS) one has to note that several effects play a role, which possibly cover up the advantage of active. On one hand there is a high correlation between use of medication (frequency, dosage) and doctors’ consultations, which signals a certain behaviour pattern that is not really dependent on the actual state of health status. On the other hand the findings are not very accurate, because e.g. the doctors’ consultations refer to an interval longer than the one judged here. In particular the Illustration: Dosage GON Medication indicates that the willingness to reduce the dosage has not reached its maximum after 6 weeks of therapy. This is also indicated in the retrospect analysis of the 1-year-user study (see Pelka 2000). Laboratory (Inflammation) Parameters: Here the trends are so much better than the statistically significant verified differences in favour of active, which are just over or under the significance level. It is important is to realize that QRS has a favourable effect on the blood parameters as it reduced the inflammatory processes in the knee and (probably) beyond in the whole organism. These findings (see Illustration 06a to c, pages 28-29) also indicate the necessity for a further study with longer duration of therapy. The systolic blood pressure reacts relatively quickly in a convincingly favourable way (see Illustration 6d, page 31). The result should be checked in further studies. Resume: Finally it can be determined that despite not yet optimal therapy duration the study indicates strongly that QRS in the case of diagnosis “gonarthrosis” is one of the most attractive therapies at present.
5 References Basset C. Andrew Fundamental and practical aspects of therapeutic uses of pulsed electromagnetic fields (PEMFs).
Critical Reviews in Biomedical Engineering,Vol.17, Issue 5, 1989: 451-529 Becker RO, G Selden The Body Electric. William Morrow New York, 1985. (Körperelektrizität – Elektromagnetismus und der
Ursprung des Lebens: Dt. Übers. mit Ergänzungen von 1985 – 1999; R.Irmer, Leben Verlag AG, St. Gallen 1999)
Bortz J.et al.: Verteilungsfreie Methoden in der Biostatistik. Berlin, Springer, 1990. Bondemark Lars Orthodontic Magnets. A study of force and field pattern, biocompatibility and clinical effects. Swedish
Dental J. Suppl. 99, Malmö 1994: 1-148.
Chou SC, J Liu Design and Analysis of Clinical Trials. Concepts and Methodologies. Wiley New York, 1998. Evertz U, HL König Pulsierende magnetische Felder in ihrer Bedeutung für die Medizin. Hippokrates Jg. 78, H.1; 1977:16-
37
Fischer G. Magnetfeldtherapie mit ELMAG MK75 mini . Abt. für Medizinische Bioklimatologie am Hygiene- Institut der Universität Graz, A-8010Graz, Universitätsplatz 4 (unveröffentlicht, 1996).
Fischer GE Grundlagen der Quantentherapie. Hecateus Verlag, Vaduz, 1996.
Fisher LD, G van Belle Biostatistics. A Methodology for the Health Sciences. Wiley New York, 1993. Fuhrmeister ML Bericht über Erfahrungen mit QRS (Siemens Würzburg, 17.06.99, unveröffentlicht) Gaube W, W Kobinger, G Fischer
Adjuvante MF-Therapie bei ausgewählten Erkrankungen älterer Patienten. Erfahrungsbericht. ÖZPMR, 1999.
Grohmann G, M Krauß et al Die Autokorrelationsfunktion der Herzperiodendauer. Indikator zur Früherkennung kardiovaskulärer Erkrankungen. I Theorie. Perfusion 10, 1996:370-85.
Grohmann G, M Krauß S Müller
Vergleichende Untersuchungen zur autonomen kardialen Neuropathie zwischen NIRP und ProSciCard- Verfahren bei Patienten mit Diabetes. Perfusion 10, 1999a:392-405.
31
Müller Verfahren bei Patienten mit Diabetes. Perfusion 10, 1999a:392-405. Grohmann G, M Krauß et al. Zur Makro- und Mikrozirkulation am Vorfuß + verschiedenen Kompressionsdrücken bei Pat. mit
peripheren arteriellen Verschlußkrankheiten. Phlebologie 28, 1999b:135-43. Haas Persönliche Mitteilung auf dem 1.Symposium QRS in Darmstadt, 02.04.2001. Jacobson J. /W.Yamanashi A physical mechanism in the treatment of neurologic disorders with externally applied pico Tesla
magnetic fields. Panminerva Med 37; 1995:98-104. König HL Unsichtbare Umwelt. Der Mensch im Spielfeld der Feldkräfte. München 1986.
Kokoschinegg P./ G. Fischer Einflüsse gepulster magnetischer Felder niederer Intensität auf biologische Systeme. Graz/Salzburg 1996, Inst. für Biophysik und Strahlenforschung, Jägerbauerweg 22, A-5302 Henndorf/Salzburg (unveröffentlicht).
Krauß M , G Grohmann Messung von peripheren Kreislaufparametern mit NIRP bei Salut1-Therapie. ZÄN, Uelzen, 1997. Kyryakoulis A Zur Integration der Magnetfeldtherapie (QRS) in der universitären Medizin. Wien 1997. Marino AA Moderne Bioelektrizität. West Indies, Trinidad 1997. (Dt.Übers. Magnovit AG, Eschen), 2001. Orlov L. et al. The influence of running impulse magnetic field on some humoral indexes and physical load tolerability
in patients with neurocirculatory hypo- and hypertension. Biophysika, Jg.41, No.4; 1996: 44-48
Pelka RB: QRS-Kunden-Feldstudie 2000. Erfahrungen mit der QRS-Magnetfeldtherapie (Gerät: Salut 1) von im Sommer 2000 eingegangenen Berichten von insgesamt 74 Patienten mit verschiedenen Diagnosen, v.a. aus dem Bereich Bewegungsapparat. UniBw München, 09.11.2000 (unveröffentlicht).
Pelka RB: QRS-DSSV-Studie 2001. Randomisierte Doppelblindstudie mit der QRS-Magnetfeldtherapie (Gerät: Salut 2) bei 76 Fitness-Aktiven mit unterschiedlichem Gesundheitsstatus in Verbindung mit einem Fitness-Training am 27.01.01 in Bad Neuenahr (unveröffentlicht, UniBw München, 18.05.2001).
Rao CR, R. Chakrabrowsky: Handbook of statistics. Elsevier Science Publication, Amsterdam 1991. Schafer JL Analysis of incomplete Multivariate Data. Chapman & Hall, London 1997.
Turk Z., J Barovic, I Flis Behandlung der ankylosierenden Sondylitis (M.Bechterev) mit Magnetfeldtherapie. Z. Phys. Med. Baln. Med. Klim.19; 1990: 222.
Turk Z. et al. Gepulste Magnetfelder niederer Intensität als adjuvante Therapie bei schwer polytraumatisierten Patienten. Phys. Rehab. Kur Med 2; 1992: 154-156.
Turk Z, J Barovic, G. Fischer, W Kobinger
QRS-Therapie bei Gonarthrose-Patienten – Erste Ergebnisse einer Doppelblindstudie. Allgemeines Krankenhaus Maribor (SLO), 2001 (unveröffentlicht).
Wagner W. , J Barovcic, W Kobinger, G Fischer
Erfahrungen mit einem Magnetfeld-Kleingerät bei der Behandlung von Erkrankungen d. Bewegungs- und Stützapparates. Ärztezeitschr. für Naturheilverfahren, 36.Jg.(3); 1995: 192-196.