Embed Size (px)
Citation preview
Ahold Delhaize reports a strong fourth quarter and raises the dividend for 2016, integrationprogresses well
• Pro forma Q4 net sales of €15.5 billion, up 2.8% at constant exchange rates, adjusted for week 53 in2015
• Pro forma Q4 underlying operating margin of 3.9%, driven by strong performance in the Netherlands andat Delhaize America
• Pro forma full-year underlying operating margin of 3.7%, up 20 basis points compared to 2015• Strong free cash flow of €874 million in Q4, resulting in €1.4 billion full-year free cash flow • Proposed dividend of €0.57, up 9.6% compared to the Ahold dividend last year• Integration on track, with synergies from the Better Together strategy delivering according to plan
Zaandam, the Netherlands, March 1, 2017 - Ahold Delhaize, a leader in supermarkets andeCommerce with market-leading local brands in 11 countries, reported a strong fourth quarter and fullyear performance with solid sales growth and margins in the year of its landmark merger.
Dick Boer, CEO of Ahold Delhaize, said: "2016 was not only a year where we brought together twostrong food retailers. It was also a year in which our great local brands drove solid performance, servingour customers both in stores and online.
"I am very pleased with the financial results in the fourth quarter with volume growth and strongmargins, while making good progress implementing our Better Together strategy which we announcedin December. Our teams are working hard on the integration, leveraging best practices andrealizing synergy targets.
"Pro forma sales grew by 2.8% in the fourth quarter at constant exchange rates and adjusted for the53rd week in 2015, driving volumes while operating in a deflationary environment in the U.S.
"Ahold USA continued to focus on its “Heading Northeast” strategy by offering better value, betterquality and improved service to its customers, resulting in resilient volume trends. Underlying operatingmargin performance was slightly better than last year, adjusted for week 53 last year, supported byongoing cost initiatives and synergies.
"Delhaize America showed continued good performance at both Food Lion and Hannaford with strongvolume growth, more than offsetting the impact of deflation on sales. Underlying operating marginsimproved, driven by the "Easy, Fresh & Affordable" strategic initiative and synergies.
"In The Netherlands performance was outstanding, driven by both supermarkets and our onlinebusinesses ah.nl and bol.com. Underlying operating margin exceeded last year’s margin, reflectingoperational efficiency and synergies.
"In Belgium, sales performance reflected a softer holiday season compared to 2015. However,underlying operating margins slightly improved due to capturing synergies.
"In Central and Southeastern Europe sales growth was mainly driven by Romania. Underlyingoperating margins decreased mainly due to our Serbian and our Czech business.
"Our strong free cash flow of €1.4 billion for the full year allows us to continue to fund growth in keychannels, as well as to return excess liquidity to our shareholders. In January, we started a €1 billionshare buyback to be carried out throughout 2017.
"Finally, we are pleased to propose a dividend of €0.57 to our shareholders, an increase of 9.6%compared to Ahold last year, representing a payout ratio of 48% of pro forma underlying income fromcontinuing operations."
Summary Report Fourth quarter and Full year 2016
Press Office: +31 88 659 5134Investor Relations: +31 88 659 5213www.aholddelhaize.com
Social MediaTwitter: @AholdDelhaizeNewsYoutube: @CommunicationsAholdDelhaizeLinkedIn: @AholdDelhaize
Page 1/37
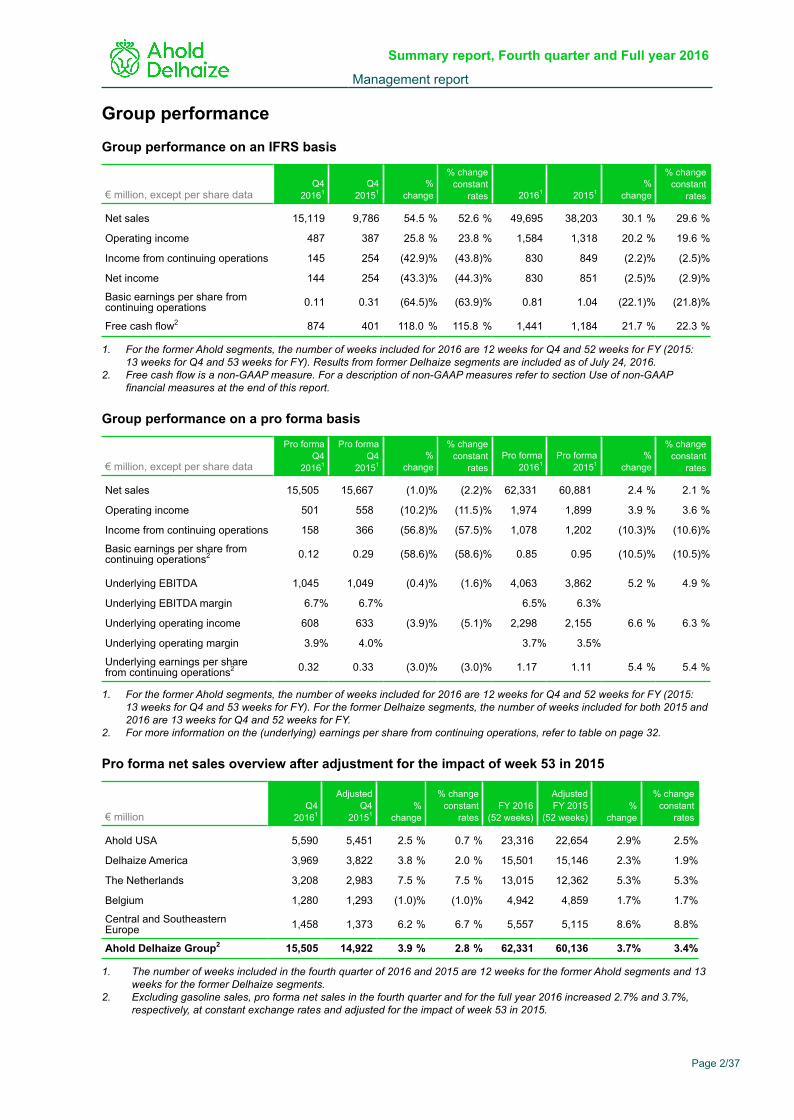
Group performance
Group performance on an IFRS basis
€ million, except per share dataQ4
20161Q4
20151%
change
% changeconstant
rates 20161 20151%
change
% changeconstant
rates
Net sales 15,119 9,786 54.5 % 52.6 % 49,695 38,203 30.1 % 29.6 %
Operating income 487 387 25.8 % 23.8 % 1,584 1,318 20.2 % 19.6 %
Income from continuing operations 145 254 (42.9)% (43.8)% 830 849 (2.2)% (2.5)%
Net income 144 254 (43.3)% (44.3)% 830 851 (2.5)% (2.9)%
Basic earnings per share fromcontinuing operations 0.11 0.31 (64.5)% (63.9)% 0.81 1.04 (22.1)% (21.8)%
Free cash flow2 874 401 118.0 % 115.8 % 1,441 1,184 21.7 % 22.3 %
1. For the former Ahold segments, the number of weeks included for 2016 are 12 weeks for Q4 and 52 weeks for FY (2015:13 weeks for Q4 and 53 weeks for FY). Results from former Delhaize segments are included as of July 24, 2016.
2. Free cash flow is a non-GAAP measure. For a description of non-GAAP measures refer to section Use of non-GAAPfinancial measures at the end of this report.
Group performance on a pro forma basis
€ million, except per share data
Pro formaQ4
20161
Pro formaQ4
20151%
change
% changeconstant
ratesPro forma
20161Pro forma
20151%
change
% changeconstant
rates
Net sales 15,505 15,667 (1.0)% (2.2)% 62,331 60,881 2.4 % 2.1 %
Operating income 501 558 (10.2)% (11.5)% 1,974 1,899 3.9 % 3.6 %
Income from continuing operations 158 366 (56.8)% (57.5)% 1,078 1,202 (10.3)% (10.6)%
Basic earnings per share fromcontinuing operations2 0.12 0.29 (58.6)% (58.6)% 0.85 0.95 (10.5)% (10.5)%
Underlying EBITDA 1,045 1,049 (0.4)% (1.6)% 4,063 3,862 5.2 % 4.9 %
Underlying EBITDA margin 6.7% 6.7% 6.5% 6.3%
Underlying operating income 608 633 (3.9)% (5.1)% 2,298 2,155 6.6 % 6.3 %
Underlying operating margin 3.9% 4.0% 3.7% 3.5%
Underlying earnings per sharefrom continuing operations2 0.32 0.33 (3.0)% (3.0)% 1.17 1.11 5.4 % 5.4 %
1. For the former Ahold segments, the number of weeks included for 2016 are 12 weeks for Q4 and 52 weeks for FY (2015:
13 weeks for Q4 and 53 weeks for FY). For the former Delhaize segments, the number of weeks included for both 2015 and2016 are 13 weeks for Q4 and 52 weeks for FY.
2. For more information on the (underlying) earnings per share from continuing operations, refer to table on page 32.
Pro forma net sales overview after adjustment for the impact of week 53 in 2015
€ millionQ4
20161
AdjustedQ4
20151%
change
% changeconstant
ratesFY 2016
(52 weeks)
AdjustedFY 2015
(52 weeks)%
change
% changeconstant
rates
Ahold USA 5,590 5,451 2.5 % 0.7 % 23,316 22,654 2.9% 2.5%
Delhaize America 3,969 3,822 3.8 % 2.0 % 15,501 15,146 2.3% 1.9%
The Netherlands 3,208 2,983 7.5 % 7.5 % 13,015 12,362 5.3% 5.3%
Belgium 1,280 1,293 (1.0)% (1.0)% 4,942 4,859 1.7% 1.7%
Central and SoutheasternEurope 1,458 1,373 6.2 % 6.7 % 5,557 5,115 8.6% 8.8%
Ahold Delhaize Group2 15,505 14,922 3.9 % 2.8 % 62,331 60,136 3.7% 3.4%
1. The number of weeks included in the fourth quarter of 2016 and 2015 are 12 weeks for the former Ahold segments and 13weeks for the former Delhaize segments.
2. Excluding gasoline sales, pro forma net sales in the fourth quarter and for the full year 2016 increased 2.7% and 3.7%,respectively, at constant exchange rates and adjusted for the impact of week 53 in 2015.
Summary report, Fourth quarter and Full year 2016
Management report
Page 2/37
Basis of preparation - Management reportThis report includes information presented in accordance with International Financial ReportingStandards (IFRS) as issued by the International Accounting Standards Board (IASB) and as adopted bythe European Union and information presented on a pro forma basis ("pro forma information"). Theperiods reflected in the IFRS and in the pro forma information are explained below. See Note 2 of thesummary financial statements for more information on the basis of presentation of the IFRSinformation. For more information on the basis of presentation of the pro forma information, refer to thepro forma information as published on October 6, 2016 ("Pro forma booklet").
Q4 2016 - IFRS informationThe Group performance overview for the fourth quarter of 2016 reflects results for Ahold Delhaize forthe period October 10, 2016, to January 1, 2017. For the former Delhaize European subsidiaries thefourth quarter started on October 1, 2016, and for the former Delhaize U.S. subsidiaries, the fourthquarter started on October 2, 2016. The results for these Delhaize subsidiaries for the period betweentheir respective starting dates and October 10 have been excluded by extrapolating the incomestatement line items for the additional days and by adjusting for any significant transactions.
2016 - Pro forma informationThe pro forma information in this press release is presented to give effect to the merger of Ahold andDelhaize as if it had occurred on the first day of Ahold's 2015 financial year, using the fair valuesestablished as of July 23, 2016 (the merger date), as the basis for the purchase price allocation effects.The information is not intended to revise past performance, but instead to provide a comparative basisfor the assessment of current performance. The pro forma information represents a hypotheticalsituation and does not purport to represent what Ahold Delhaize's actual result of operations wouldhave been, should the merger with Delhaize actually have occurred at the beginning of Ahold's 2015financial year, nor are they necessarily indicative of future results of Ahold Delhaize. The company doesnot claim or represent that the pro forma information is indicative of what the results would have beenhad the merger taken place as of the date indicated or of the results that may be achieved in the future.
The reconciliation of the Q4 2016 IFRS numbers to the Q4 2016 pro forma numbers is included in thesection Pro forma financial information, commencing on page 33 of this press release. Thereconciliation of IFRS numbers to pro forma numbers for Q3 2016 is included in the Q3 2016 pressrelease and for periods prior to Q3 2016 is included in the Pro forma booklet, which can be accessedvia this link: Pro forma booklet.
Ahold Delhaize's fourth financial quarter for 2016 started on October 10, 2016, and ended onJanuary 1, 2017. As explained in the Pro forma booklet, Ahold and Delhaize had different reportingcalendars. The pro forma information is not adjusted for the difference in the reporting calendars. TheQ4 pro forma information includes the results of the former Ahold companies for the period October 10,2016, to January 1, 2017, and the results of the former Delhaize companies for the period October 1,2016, to December 31, 20161. The year-to-date pro forma information includes the results of the formerAhold companies for the period January 4, 2016, to January 1, 2017, and the results from the formerDelhaize companies for the period January 1, 2016, to December 31, 20171.
1. For the former Delhaize U.S. subsidiaries the financial year and fourth quarter of 2016 commenced on January 4, 2016, andOctober 2, 2016, respectively, and the fourth quarter ended on January 1, 2017.
Summary report, Fourth quarter and Full year 2016
Management report
Page 3/37
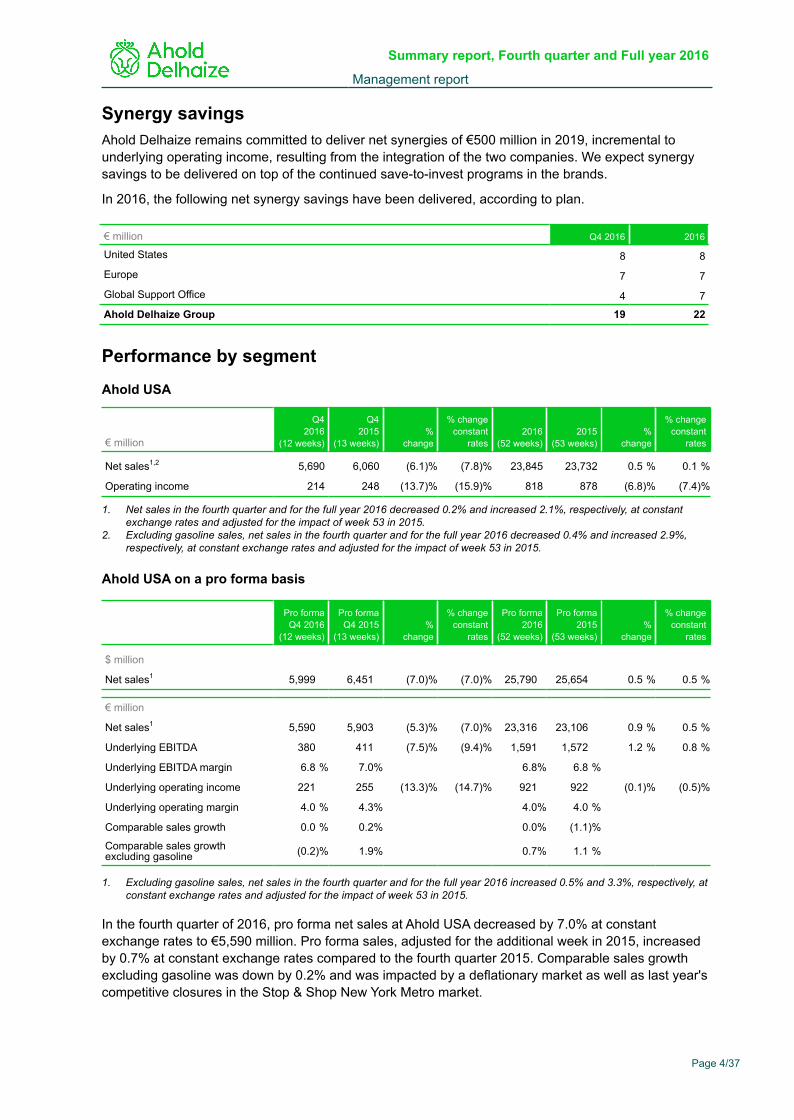
Synergy savingsAhold Delhaize remains committed to deliver net synergies of €500 million in 2019, incremental tounderlying operating income, resulting from the integration of the two companies. We expect synergysavings to be delivered on top of the continued save-to-invest programs in the brands.
In 2016, the following net synergy savings have been delivered, according to plan.
€ million Q4 2016 2016
United States 8 8
Europe 7 7
Global Support Office 4 7
Ahold Delhaize Group 19 22
Performance by segment
Ahold USA
€ million
Q42016
(12 weeks)
Q42015
(13 weeks)%
change
% changeconstant
rates2016
(52 weeks)2015
(53 weeks)%
change
% changeconstant
rates
Net sales1,2 5,690 6,060 (6.1)% (7.8)% 23,845 23,732 0.5 % 0.1 %
Operating income 214 248 (13.7)% (15.9)% 818 878 (6.8)% (7.4)%
1. Net sales in the fourth quarter and for the full year 2016 decreased 0.2% and increased 2.1%, respectively, at constantexchange rates and adjusted for the impact of week 53 in 2015.
2. Excluding gasoline sales, net sales in the fourth quarter and for the full year 2016 decreased 0.4% and increased 2.9%,respectively, at constant exchange rates and adjusted for the impact of week 53 in 2015.
Ahold USA on a pro forma basis
Pro formaQ4 2016
(12 weeks)
Pro formaQ4 2015
(13 weeks)%
change
% changeconstant
rates
Pro forma2016
(52 weeks)
Pro forma2015
(53 weeks)%
change
% changeconstant
rates
$ million
Net sales1 5,999 6,451 (7.0)% (7.0)% 25,790 25,654 0.5 % 0.5 %
€ million
Net sales1 5,590 5,903 (5.3)% (7.0)% 23,316 23,106 0.9 % 0.5 %
Underlying EBITDA 380 411 (7.5)% (9.4)% 1,591 1,572 1.2 % 0.8 %
Underlying EBITDA margin 6.8 % 7.0% 6.8% 6.8 %
Underlying operating income 221 255 (13.3)% (14.7)% 921 922 (0.1)% (0.5)%
Underlying operating margin 4.0 % 4.3% 4.0% 4.0 %
Comparable sales growth 0.0 % 0.2% 0.0% (1.1)%
Comparable sales growthexcluding gasoline (0.2)% 1.9% 0.7% 1.1 %
1. Excluding gasoline sales, net sales in the fourth quarter and for the full year 2016 increased 0.5% and 3.3%, respectively, atconstant exchange rates and adjusted for the impact of week 53 in 2015.
In the fourth quarter of 2016, pro forma net sales at Ahold USA decreased by 7.0% at constantexchange rates to €5,590 million. Pro forma sales, adjusted for the additional week in 2015, increasedby 0.7% at constant exchange rates compared to the fourth quarter 2015. Comparable sales growthexcluding gasoline was down by 0.2% and was impacted by a deflationary market as well as last year'scompetitive closures in the Stop & Shop New York Metro market.
Summary report, Fourth quarter and Full year 2016
Management report
Page 4/37
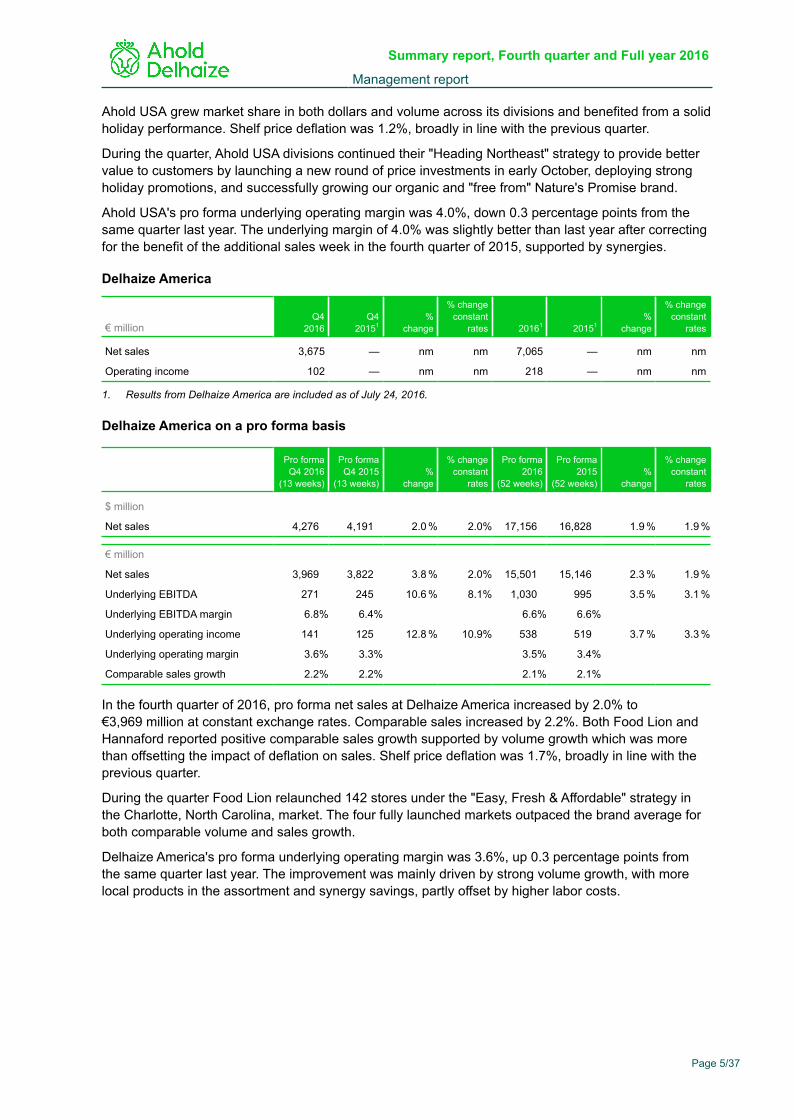
Ahold USA grew market share in both dollars and volume across its divisions and benefited from a solidholiday performance. Shelf price deflation was 1.2%, broadly in line with the previous quarter.
During the quarter, Ahold USA divisions continued their "Heading Northeast" strategy to provide bettervalue to customers by launching a new round of price investments in early October, deploying strongholiday promotions, and successfully growing our organic and "free from" Nature's Promise brand.
Ahold USA's pro forma underlying operating margin was 4.0%, down 0.3 percentage points from thesame quarter last year. The underlying margin of 4.0% was slightly better than last year after correctingfor the benefit of the additional sales week in the fourth quarter of 2015, supported by synergies.
Delhaize America
€ millionQ4
2016Q4
20151%
change
% changeconstant
rates 20161 20151%
change
% changeconstant
rates
Net sales 3,675 — nm nm 7,065 — nm nm
Operating income 102 — nm nm 218 — nm nm
1. Results from Delhaize America are included as of July 24, 2016.
Delhaize America on a pro forma basis
Pro formaQ4 2016
(13 weeks)
Pro formaQ4 2015
(13 weeks)%
change
% changeconstant
rates
Pro forma2016
(52 weeks)
Pro forma2015
(52 weeks)%
change
% changeconstant
rates
$ million
Net sales 4,276 4,191 2.0 % 2.0% 17,156 16,828 1.9 % 1.9 %
€ million
Net sales 3,969 3,822 3.8 % 2.0% 15,501 15,146 2.3 % 1.9 %
Underlying EBITDA 271 245 10.6 % 8.1% 1,030 995 3.5 % 3.1 %
Underlying EBITDA margin 6.8% 6.4% 6.6% 6.6%
Underlying operating income 141 125 12.8 % 10.9% 538 519 3.7 % 3.3 %
Underlying operating margin 3.6% 3.3% 3.5% 3.4%
Comparable sales growth 2.2% 2.2% 2.1% 2.1%
In the fourth quarter of 2016, pro forma net sales at Delhaize America increased by 2.0% to€3,969 million at constant exchange rates. Comparable sales increased by 2.2%. Both Food Lion andHannaford reported positive comparable sales growth supported by volume growth which was morethan offsetting the impact of deflation on sales. Shelf price deflation was 1.7%, broadly in line with theprevious quarter.
During the quarter Food Lion relaunched 142 stores under the "Easy, Fresh & Affordable" strategy inthe Charlotte, North Carolina, market. The four fully launched markets outpaced the brand average forboth comparable volume and sales growth.
Delhaize America's pro forma underlying operating margin was 3.6%, up 0.3 percentage points fromthe same quarter last year. The improvement was mainly driven by strong volume growth, with morelocal products in the assortment and synergy savings, partly offset by higher labor costs.
Summary report, Fourth quarter and Full year 2016
Management report
Page 5/37
The Netherlands
€ million
Q42016
(12 weeks)
Q42015
(13 weeks)%
change2016
(52 weeks)2015
(53 weeks)%
change
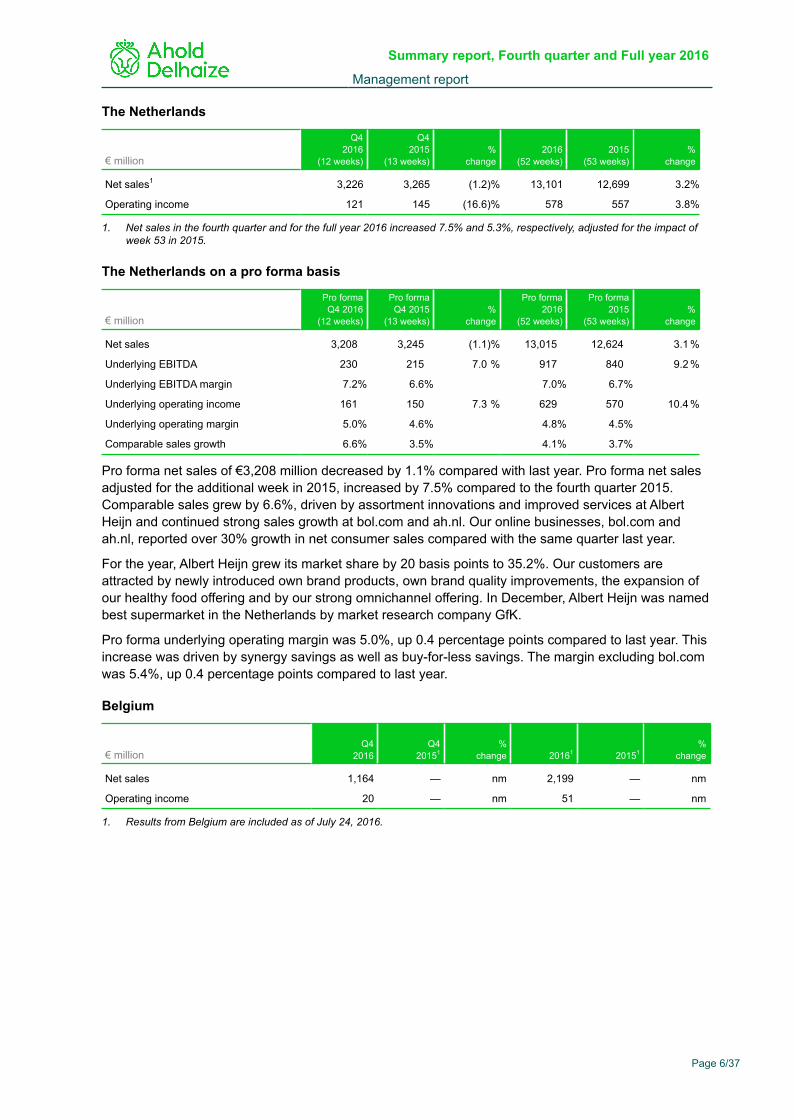
Net sales1 3,226 3,265 (1.2)% 13,101 12,699 3.2%
Operating income 121 145 (16.6)% 578 557 3.8%
1. Net sales in the fourth quarter and for the full year 2016 increased 7.5% and 5.3%, respectively, adjusted for the impact ofweek 53 in 2015.
The Netherlands on a pro forma basis
€ million
Pro formaQ4 2016
(12 weeks)
Pro formaQ4 2015
(13 weeks)%
change
Pro forma2016
(52 weeks)
Pro forma2015
(53 weeks)%
change
Net sales 3,208 3,245 (1.1)% 13,015 12,624 3.1 %
Underlying EBITDA 230 215 7.0 % 917 840 9.2 %
Underlying EBITDA margin 7.2% 6.6% 7.0% 6.7%
Underlying operating income 161 150 7.3 % 629 570 10.4 %
Underlying operating margin 5.0% 4.6% 4.8% 4.5%
Comparable sales growth 6.6% 3.5% 4.1% 3.7% Pro forma net sales of €3,208 million decreased by 1.1% compared with last year. Pro forma net salesadjusted for the additional week in 2015, increased by 7.5% compared to the fourth quarter 2015.Comparable sales grew by 6.6%, driven by assortment innovations and improved services at AlbertHeijn and continued strong sales growth at bol.com and ah.nl. Our online businesses, bol.com andah.nl, reported over 30% growth in net consumer sales compared with the same quarter last year.
For the year, Albert Heijn grew its market share by 20 basis points to 35.2%. Our customers areattracted by newly introduced own brand products, own brand quality improvements, the expansion ofour healthy food offering and by our strong omnichannel offering. In December, Albert Heijn was namedbest supermarket in the Netherlands by market research company GfK.
Pro forma underlying operating margin was 5.0%, up 0.4 percentage points compared to last year. Thisincrease was driven by synergy savings as well as buy-for-less savings. The margin excluding bol.comwas 5.4%, up 0.4 percentage points compared to last year.
Belgium
€ millionQ4
2016Q4
20151%
change 20161 20151%
change
Net sales 1,164 — nm 2,199 — nm
Operating income 20 — nm 51 — nm
1. Results from Belgium are included as of July 24, 2016.
Summary report, Fourth quarter and Full year 2016
Management report
Page 6/37
Belgium on a pro forma basis
€ million
Pro formaQ4 2016
(13 weeks)
Pro formaQ4 2015
(13 weeks)%
change
Pro forma2016
(52 weeks)
Pro forma2015
(52 weeks)%
change
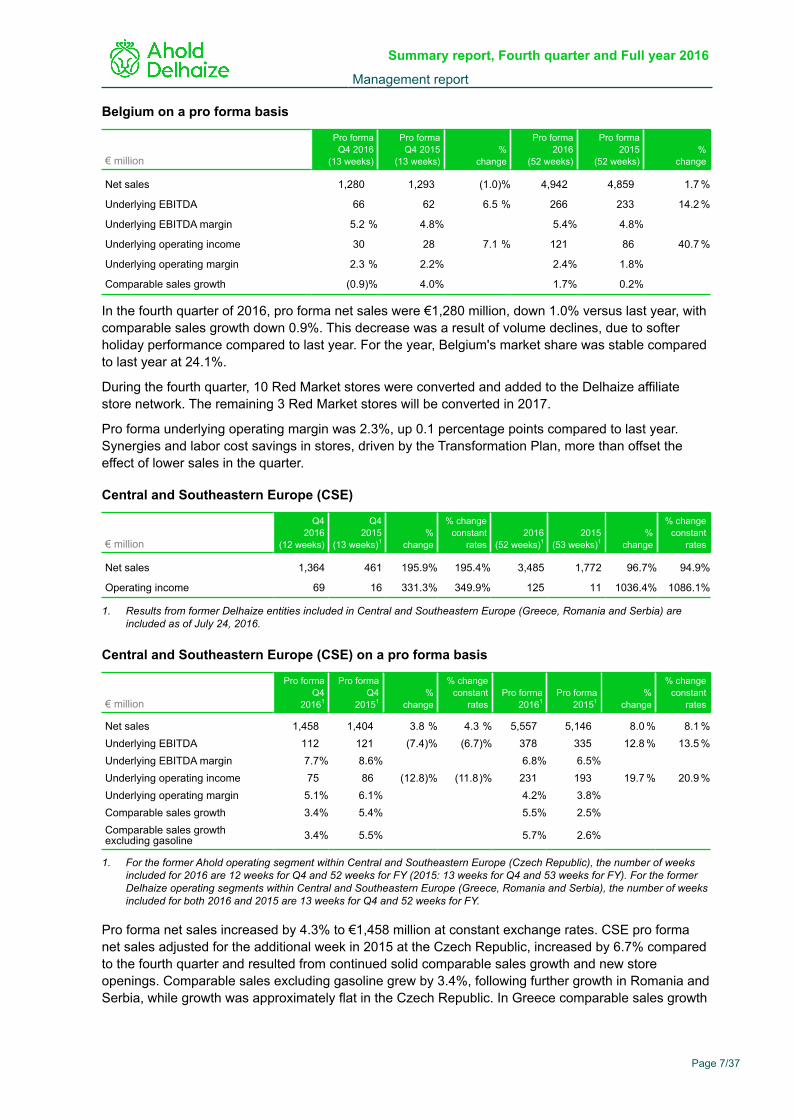
Net sales 1,280 1,293 (1.0)% 4,942 4,859 1.7 %
Underlying EBITDA 66 62 6.5 % 266 233 14.2 %
Underlying EBITDA margin 5.2 % 4.8% 5.4% 4.8%
Underlying operating income 30 28 7.1 % 121 86 40.7 %
Underlying operating margin 2.3 % 2.2% 2.4% 1.8%
Comparable sales growth (0.9)% 4.0% 1.7% 0.2%
In the fourth quarter of 2016, pro forma net sales were €1,280 million, down 1.0% versus last year, withcomparable sales growth down 0.9%. This decrease was a result of volume declines, due to softerholiday performance compared to last year. For the year, Belgium's market share was stable comparedto last year at 24.1%.
During the fourth quarter, 10 Red Market stores were converted and added to the Delhaize affiliatestore network. The remaining 3 Red Market stores will be converted in 2017.
Pro forma underlying operating margin was 2.3%, up 0.1 percentage points compared to last year.Synergies and labor cost savings in stores, driven by the Transformation Plan, more than offset theeffect of lower sales in the quarter.
Central and Southeastern Europe (CSE)
€ million
Q4 2016
(12 weeks)
Q4 2015
(13 weeks)1%
change
% changeconstant
rates2016
(52 weeks)12015
(53 weeks)1%
change
% changeconstant
rates
Net sales 1,364 461 195.9% 195.4% 3,485 1,772 96.7% 94.9%
Operating income 69 16 331.3% 349.9% 125 11 1036.4% 1086.1%
1. Results from former Delhaize entities included in Central and Southeastern Europe (Greece, Romania and Serbia) areincluded as of July 24, 2016.
Central and Southeastern Europe (CSE) on a pro forma basis
€ million
Pro formaQ4
20161
Pro formaQ4
20151%
change
% changeconstant
ratesPro forma
20161Pro forma
20151%
change
% changeconstant
rates
Net sales 1,458 1,404 3.8 % 4.3 % 5,557 5,146 8.0 % 8.1 %Underlying EBITDA 112 121 (7.4)% (6.7)% 378 335 12.8 % 13.5 %Underlying EBITDA margin 7.7% 8.6% 6.8% 6.5%Underlying operating income 75 86 (12.8)% (11.8)% 231 193 19.7 % 20.9 %Underlying operating margin 5.1% 6.1% 4.2% 3.8%Comparable sales growth 3.4% 5.4% 5.5% 2.5%Comparable sales growthexcluding gasoline 3.4% 5.5% 5.7% 2.6%
1. For the former Ahold operating segment within Central and Southeastern Europe (Czech Republic), the number of weeksincluded for 2016 are 12 weeks for Q4 and 52 weeks for FY (2015: 13 weeks for Q4 and 53 weeks for FY). For the formerDelhaize operating segments within Central and Southeastern Europe (Greece, Romania and Serbia), the number of weeksincluded for both 2016 and 2015 are 13 weeks for Q4 and 52 weeks for FY.
Pro forma net sales increased by 4.3% to €1,458 million at constant exchange rates. CSE pro formanet sales adjusted for the additional week in 2015 at the Czech Republic, increased by 6.7% comparedto the fourth quarter and resulted from continued solid comparable sales growth and new storeopenings. Comparable sales excluding gasoline grew by 3.4%, following further growth in Romania andSerbia, while growth was approximately flat in the Czech Republic. In Greece comparable sales growth
Summary report, Fourth quarter and Full year 2016
Management report
Page 7/37

was lower than in previous quarters as it was impacted by last year's strong performance as a result ofoperational issues at a large competitor in this market.
CSE's pro forma underlying operating margin decreased by 1.0 percentage points to 5.1%. The margindecrease versus last year was mainly caused by the Czech Republic and Serbia. While gross margin ofCSE improved, operating expenses in the fourth quarter of 2015 included one-off benefits in the CzechRepublic.
Global Support Office
€ million
Pro formaQ4
2016
Pro formaQ4
2015%
change
% changeconstant
ratesPro forma
2016Pro forma
2015%
change
% changeconstant
rates
Underlying operating income (20) (11) (81.8)% (96.1)% (142) (135) (5.2)% (5.8)%Underlying operating incomeexcluding insurance activities (41) (42) 2.4 % 2.3 % (165) (164) (0.6)% (0.6)%
Pro forma underlying Global Support Office costs were €20 million, €9 million higher than the prior year.Excluding insurance activities, underlying costs were €41 million compared with €42 million last year.Insurance benefits resulted from an increase in discount rates.
Financial review IFRSFourth quarter 2016 (compared to fourth quarter 2015)
Operating income increased by €100 million to €487 million, which is primarily due to the contribution ofthe former Delhaize operating companies (Delhaize America €102 million, Belgium €20 million, CSEexcluding the Czech Republic €57 million) and higher gains on sale of assets of €13 million, partlyoffset by increased impairment charges of €14 million and higher restructuring and related charges of€63 million. Operating income is adjusted for impairments of €28 million (Q4 2015: €14 million),restructuring and related charges of €90 million (Q4 2015: €27 million) and the gain on sale of assets of€20 million (Q4 2015: €7 million) to arrive at underlying operating income of €585 million (up€164 million over Q4 2015). Impairments are primarily related to operating and closed stores andinvestment properties at Ahold USA (€17 million) and remedy stores and other store operations in theNetherlands (€9 million). The restructuring and related charges of €90 million include €38 million ofintegration costs related to the merger between Ahold and Delhaize, €3 million of transaction costs,€3 million related to divestments of remedy stores, €11 million of costs related to Hurricane Matthew inthe U.S. and €35 million related to a lump sum compensation for a reduction in benefits for employeesin the Netherlands and the Global Support Office.
Income from continuing operations was €145 million; €109 million lower than last year. This followsfrom the increase in operating income of €100 million, a decrease in income taxes of €31 million and anincrease in income from joint ventures of €14 million, offset by an increase in financial expenses of€254 million. The increase in financial expenses is mainly the result of the buy-back and cancellation ofthe entire principal amount of the JPY33 billion Floating Rate notes, and the unwinding of thecorresponding derivatives, resulting in a one-off finance cost of €243 million.
Free cash flow of €874 million increased by €473 million compared to Q4 2015. This increase wasmainly driven by higher cash generated from operations of €636 million, lower income taxes paid of€102 million and higher proceeds from divestments of assets of €19 million, partly offset by higherpurchases of non-current assets of €223 million and higher interest paid of €65 million.
Net debt decreased in Q4 2016 by €371 million to €3,244 million, which is a result of our free cash flowof €874 million, partly offset by the settlement of the swap and the premium paid for the buyback of theJPY33 notes of €253 million, additional finance leases and the strengthening of the U.S. dollar againstthe euro.
Summary report, Fourth quarter and Full year 2016
Management report
Page 8/37
Full year 2016 (compared to full year 2015)
Operating income increased by €266 million to €1,584 million. Recorded in operating income areimpairments of €104 million (2015: €39 million) and restructuring and related charges of €233 million(2015: €122 million), offset by a gain on the sale of assets €22 million (2015: €18 million), whichcollectively total €315 million (2015: €143 million) and are adjusted to arrive at underlying operatingincome of €1,899 million.
Income from continuing operations was €830 million; €19 million lower than last year. This reflects theincrease in operating income of €266 million and higher income from joint ventures of €14 million,adjusted for higher net financial expenses of €276 million and higher income taxes of €23 million.
Net income was €830 million, down €21 million.
Free cash flow was €1,441 million; €257 million higher than last year. The increase is mainly due tohigher cash generated from operations of €806 million and higher proceeds from divestment of assetsof €53 million, partly offset by higher capital expenditures of €498 million, higher income taxes paid of€47 million and higher interest paid of €66 million.
In 2016, gross debt increased by €4,059 million to €7,561 million, primarily due to the merger withDelhaize (€4,134 million) and the strengthening of the U.S. dollar against the euro. This was partiallyoffset by the buyback and cancellation of the entire principal amount of the JPY33 billion notes andregular payments on finance lease and financing transaction liabilities.
Ahold Delhaize’s net debt was €3,244 million as of January 1, 2017, an increase of €2,096 million fromJanuary 3, 2016. The increase in gross debt (€4,059 million), the capital repayment (€1,001 million),payment of common stock dividend (€429 million) and the buy-back of the JPY33 notes and theunwinding of the corresponding derivatives (total cash impact of €543 million), were partly offset by ourfree cash flow (€1,441 million), €2,201 million related to acquisition / divestments of businesses, net ofcash, and acquired available for sale financial assets and restricted cash (€202 million).
Financial review pro forma
Fourth quarter 2016 (compared to fourth quarter 2015)Pro forma underlying operating income was €608 million, €25 million lower than last year. Pro formaunderlying operating margin was 3.9%, down 0.1% percentage points from last year.
Pro forma operating income decreased by €57 million to €501 million. Recorded in operating incomeare impairments of €23 million and restructuring and related charges and other of €84 million, whichtotal €107 million and are adjusted to arrive at the pro forma underlying operating income. Impairmentsare primarily related to operating and closed stores and investment properties at Ahold USA(€17 million) and store operations in the Netherlands (€4 million). The restructuring and related chargesof €84 million include €38 million of integration costs for the merger between Ahold and Delhaize,€11 million of costs related to Hurricane Matthew in the U.S. and €35 million related to a lump sumcompensation for a reduction in benefits for employees in the Netherlands and the Global SupportOffice.
Pro forma income from continuing operations was €158 million, €208 million lower than last year, as aresult of the decrease in pro forma operating income of €57 million and the increase in financialexpenses of €230 million, partly offset by the decrease in income taxes of €68 million and increase inincome of joint ventures of €12 million. The increase in financial expenses is mainly the result of thebuy-back and cancellation of the entire principal amount of the JPY33 billion Floating Rate notes, andthe unwinding of the corresponding derivatives, resulting in a one-off finance cost of €243 million.
Summary report, Fourth quarter and Full year 2016
Management report
Page 9/37
OutlookWe will remain focused on implementing our strategic initiatives to further improve the customerproposition and drive volumes, however we expect the deflationary environment in the United States tocontinue through the first quarter of 2017.
We confirm our target for 2017 of realizing €220 million net synergies, including €22 million realized in2016, incremental to pro forma underlying operating income.
We expect free cash flow for the year 2017 to be €1.6 billion, after €1.8 billion of capital expenditure.
Dividend per shareWe propose a common stock dividend of €0.57 for the financial year 2016, up 9.6% from last year. Thisrepresents a payout ratio of 48%, based on the expected dividend payment on pro forma underlyingincome from continuing operations.
Auditor's involvementThe full year 2016 and 2015 information in the summary financial statements, as set out on pages 11 to28 of this summary report, is based on Ahold Delhaize’s 2016 financial statements, as included in the2016 Annual Report (the Financial Statements), published on March 1, 2017. In accordance with article2:395 of the Netherlands Civil Code, we state that our auditor, PricewaterhouseCoopers AccountantsN.V., has issued an unqualified opinion on the Financial Statements, dated February 28, 2017. For abetter understanding of the company’s financial position and results and of the scope of the audit ofPricewaterhouseCoopers Accountants N.V., this report should be read in conjunction with the FinancialStatements. The General Meeting of Shareholders has not yet adopted the Financial Statements.
Summary report, Fourth quarter and Full year 2016
Management report
Page 10/37
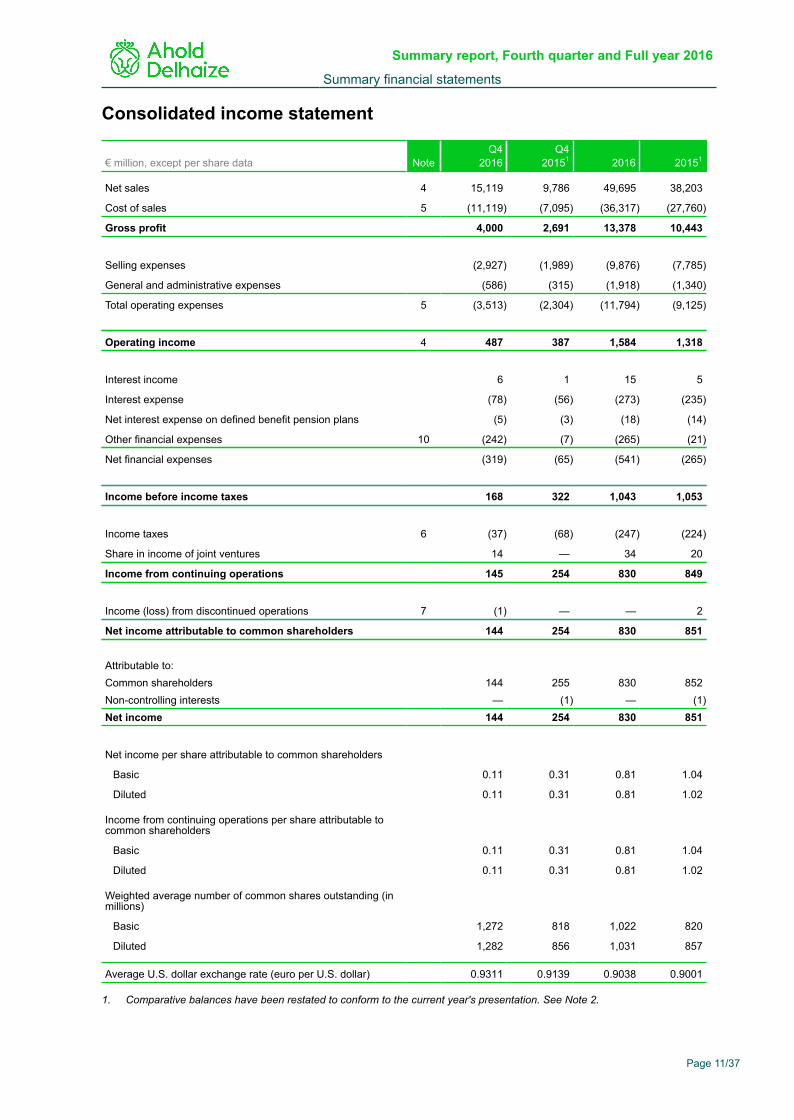
Consolidated income statement
€ million, except per share data NoteQ4
2016Q4
20151 2016 20151
Net sales 4 15,119 9,786 49,695 38,203
Cost of sales 5 (11,119) (7,095) (36,317) (27,760)
Gross profit 4,000 2,691 13,378 10,443
Selling expenses (2,927) (1,989) (9,876) (7,785)
General and administrative expenses (586) (315) (1,918) (1,340)
Total operating expenses 5 (3,513) (2,304) (11,794) (9,125)
Operating income 4 487 387 1,584 1,318
Interest income 6 1 15 5
Interest expense (78) (56) (273) (235)
Net interest expense on defined benefit pension plans (5) (3) (18) (14)
Other financial expenses 10 (242) (7) (265) (21)
Net financial expenses (319) (65) (541) (265)
Income before income taxes 168 322 1,043 1,053
Income taxes 6 (37) (68) (247) (224)
Share in income of joint ventures 14 — 34 20
Income from continuing operations 145 254 830 849
Income (loss) from discontinued operations 7 (1) — — 2
Net income attributable to common shareholders 144 254 830 851
Attributable to:Common shareholders 144 255 830 852Non-controlling interests — (1) — (1)Net income 144 254 830 851
Net income per share attributable to common shareholders
Basic 0.11 0.31 0.81 1.04
Diluted 0.11 0.31 0.81 1.02
Income from continuing operations per share attributable tocommon shareholders
Basic 0.11 0.31 0.81 1.04
Diluted 0.11 0.31 0.81 1.02
Weighted average number of common shares outstanding (inmillions)
Basic 1,272 818 1,022 820
Diluted 1,282 856 1,031 857
Average U.S. dollar exchange rate (euro per U.S. dollar) 0.9311 0.9139 0.9038 0.9001
1. Comparative balances have been restated to conform to the current year's presentation. See Note 2.
Summary report, Fourth quarter and Full year 2016
Summary financial statements
Page 11/37
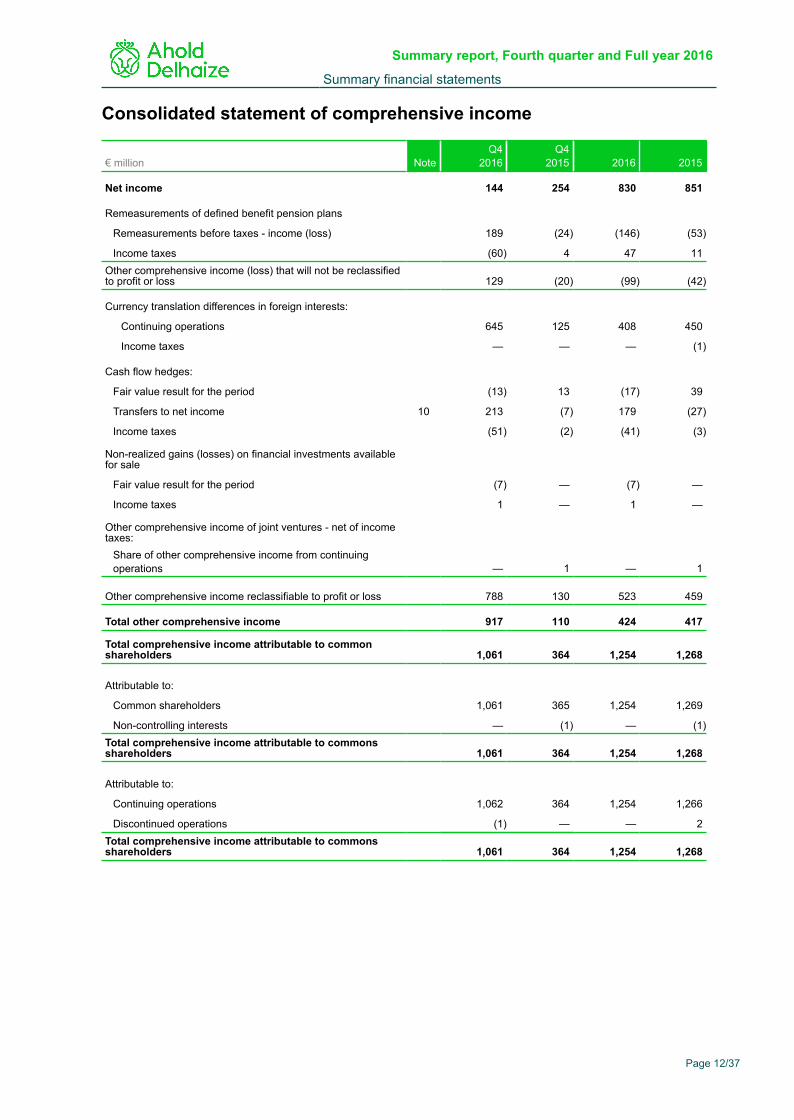
Consolidated statement of comprehensive income
€ million NoteQ4
2016Q4
2015 2016 2015
Net income 144 254 830 851
Remeasurements of defined benefit pension plans
Remeasurements before taxes - income (loss) 189 (24) (146) (53)
Income taxes (60) 4 47 11Other comprehensive income (loss) that will not be reclassifiedto profit or loss 129 (20) (99) (42)
Currency translation differences in foreign interests:
Continuing operations 645 125 408 450
Income taxes — — — (1)
Cash flow hedges:
Fair value result for the period (13) 13 (17) 39
Transfers to net income 10 213 (7) 179 (27)
Income taxes (51) (2) (41) (3)
Non-realized gains (losses) on financial investments availablefor sale
Fair value result for the period (7) — (7) —
Income taxes 1 — 1 —
Other comprehensive income of joint ventures - net of incometaxes:
Share of other comprehensive income from continuingoperations — 1 — 1
Other comprehensive income reclassifiable to profit or loss 788 130 523 459
Total other comprehensive income 917 110 424 417
Total comprehensive income attributable to commonshareholders 1,061 364 1,254 1,268
Attributable to:
Common shareholders 1,061 365 1,254 1,269
Non-controlling interests — (1) — (1)Total comprehensive income attributable to commonsshareholders 1,061 364 1,254 1,268
Attributable to:
Continuing operations 1,062 364 1,254 1,266
Discontinued operations (1) — — 2Total comprehensive income attributable to commonsshareholders 1,061 364 1,254 1,268
Summary report, Fourth quarter and Full year 2016
Summary financial statements
Page 12/37
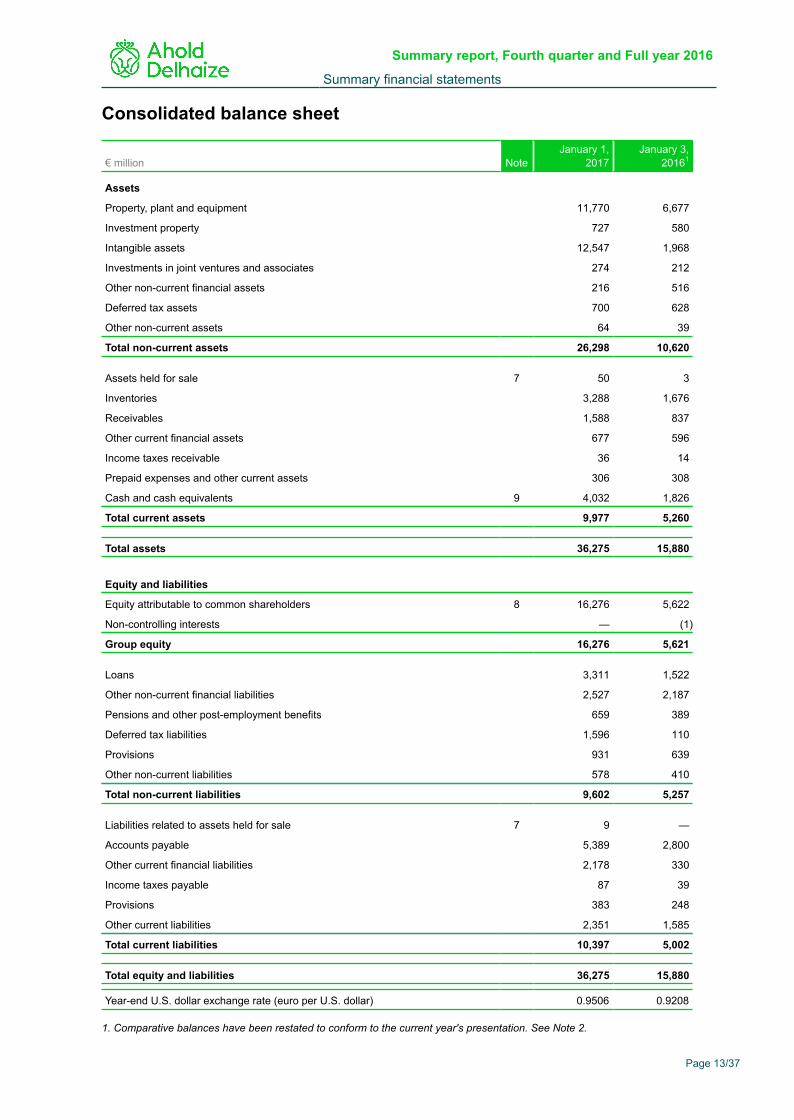
Consolidated balance sheet
€ million NoteJanuary 1,
2017January 3,
20161
Assets
Property, plant and equipment 11,770 6,677
Investment property 727 580
Intangible assets 12,547 1,968
Investments in joint ventures and associates 274 212
Other non-current financial assets 216 516
Deferred tax assets 700 628
Other non-current assets 64 39
Total non-current assets 26,298 10,620
Assets held for sale 7 50 3
Inventories 3,288 1,676
Receivables 1,588 837
Other current financial assets 677 596
Income taxes receivable 36 14
Prepaid expenses and other current assets 306 308
Cash and cash equivalents 9 4,032 1,826
Total current assets 9,977 5,260
Total assets 36,275 15,880
Equity and liabilities
Equity attributable to common shareholders 8 16,276 5,622
Non-controlling interests — (1)
Group equity 16,276 5,621
Loans 3,311 1,522
Other non-current financial liabilities 2,527 2,187
Pensions and other post-employment benefits 659 389
Deferred tax liabilities 1,596 110
Provisions 931 639
Other non-current liabilities 578 410
Total non-current liabilities 9,602 5,257
Liabilities related to assets held for sale 7 9 —
Accounts payable 5,389 2,800
Other current financial liabilities 2,178 330
Income taxes payable 87 39
Provisions 383 248
Other current liabilities 2,351 1,585
Total current liabilities 10,397 5,002
Total equity and liabilities 36,275 15,880
Year-end U.S. dollar exchange rate (euro per U.S. dollar) 0.9506 0.9208
1. Comparative balances have been restated to conform to the current year's presentation. See Note 2.
Summary report, Fourth quarter and Full year 2016
Summary financial statements
Page 13/37
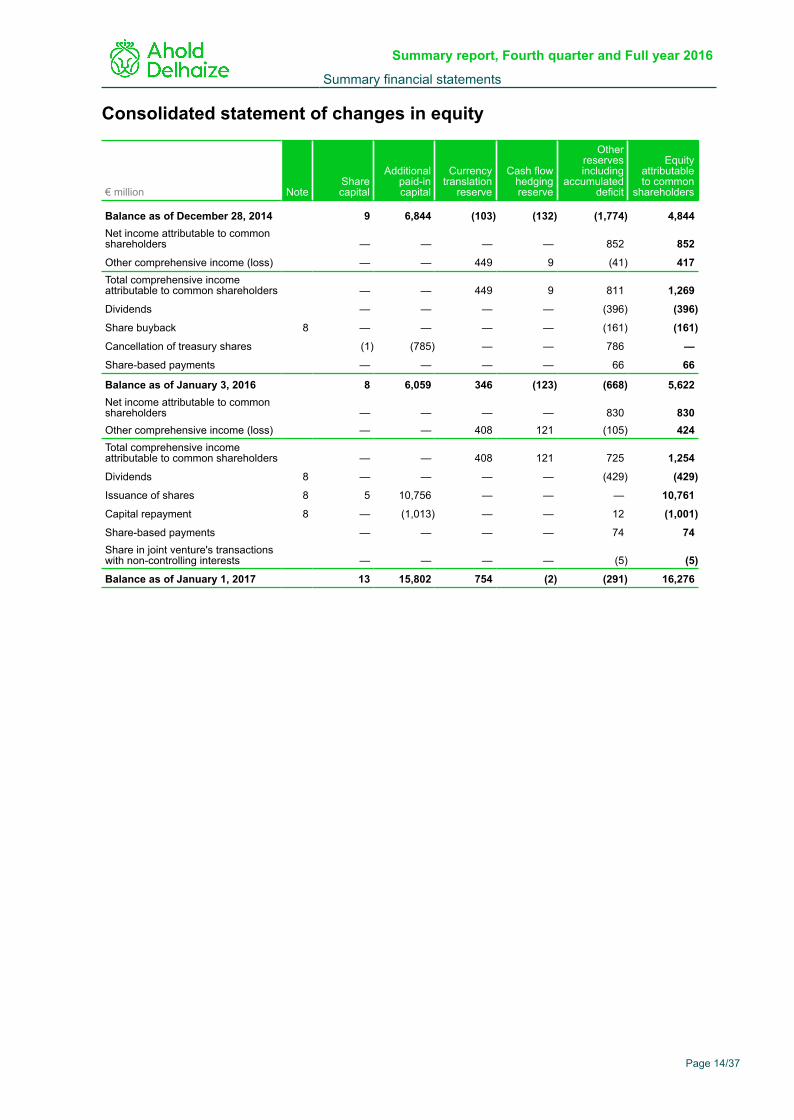
Consolidated statement of changes in equity
€ million NoteSharecapital
Additionalpaid-incapital
Currencytranslation
reserve
Cash flowhedgingreserve
Otherreservesincluding
accumulateddeficit
Equityattributableto common
shareholders
Balance as of December 28, 2014 9 6,844 (103) (132) (1,774) 4,844Net income attributable to commonshareholders — — — — 852 852
Other comprehensive income (loss) — — 449 9 (41) 417Total comprehensive incomeattributable to common shareholders — — 449 9 811 1,269
Dividends — — — — (396) (396)
Share buyback 8 — — — — (161) (161)
Cancellation of treasury shares (1) (785) — — 786 —
Share-based payments — — — — 66 66
Balance as of January 3, 2016 8 6,059 346 (123) (668) 5,622Net income attributable to commonshareholders — — — — 830 830Other comprehensive income (loss) — — 408 121 (105) 424Total comprehensive incomeattributable to common shareholders — — 408 121 725 1,254
Dividends 8 — — — — (429) (429)
Issuance of shares 8 5 10,756 — — — 10,761
Capital repayment 8 — (1,013) — — 12 (1,001)
Share-based payments — — — — 74 74Share in joint venture's transactionswith non-controlling interests — — — — (5) (5)
Balance as of January 1, 2017 13 15,802 754 (2) (291) 16,276
Summary report, Fourth quarter and Full year 2016
Summary financial statements
Page 14/37
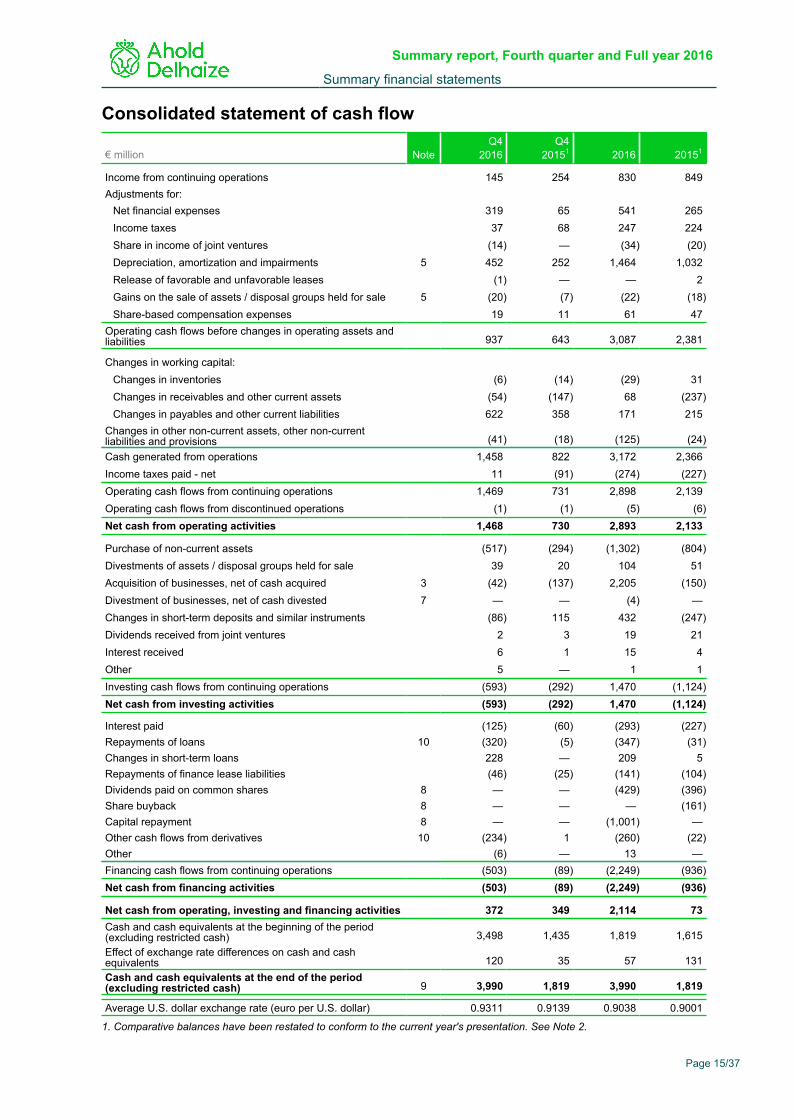
Consolidated statement of cash flow
€ million NoteQ4
2016Q4
20151 2016 20151
Income from continuing operations 145 254 830 849Adjustments for:
Net financial expenses 319 65 541 265Income taxes 37 68 247 224Share in income of joint ventures (14) — (34) (20)Depreciation, amortization and impairments 5 452 252 1,464 1,032Release of favorable and unfavorable leases (1) — — 2Gains on the sale of assets / disposal groups held for sale 5 (20) (7) (22) (18)Share-based compensation expenses 19 11 61 47
Operating cash flows before changes in operating assets andliabilities 937 643 3,087 2,381
Changes in working capital:Changes in inventories (6) (14) (29) 31Changes in receivables and other current assets (54) (147) 68 (237)Changes in payables and other current liabilities 622 358 171 215
Changes in other non-current assets, other non-currentliabilities and provisions (41) (18) (125) (24)Cash generated from operations 1,458 822 3,172 2,366Income taxes paid - net 11 (91) (274) (227)Operating cash flows from continuing operations 1,469 731 2,898 2,139Operating cash flows from discontinued operations (1) (1) (5) (6)Net cash from operating activities 1,468 730 2,893 2,133
Purchase of non-current assets (517) (294) (1,302) (804)Divestments of assets / disposal groups held for sale 39 20 104 51Acquisition of businesses, net of cash acquired 3 (42) (137) 2,205 (150)Divestment of businesses, net of cash divested 7 — — (4) —Changes in short-term deposits and similar instruments (86) 115 432 (247)Dividends received from joint ventures 2 3 19 21Interest received 6 1 15 4Other 5 — 1 1Investing cash flows from continuing operations (593) (292) 1,470 (1,124)Net cash from investing activities (593) (292) 1,470 (1,124)
Interest paid (125) (60) (293) (227)Repayments of loans 10 (320) (5) (347) (31)Changes in short-term loans 228 — 209 5Repayments of finance lease liabilities (46) (25) (141) (104)Dividends paid on common shares 8 — — (429) (396)Share buyback 8 — — — (161)Capital repayment 8 — — (1,001) —Other cash flows from derivatives 10 (234) 1 (260) (22)Other (6) — 13 —Financing cash flows from continuing operations (503) (89) (2,249) (936)Net cash from financing activities (503) (89) (2,249) (936)
Net cash from operating, investing and financing activities 372 349 2,114 73Cash and cash equivalents at the beginning of the period(excluding restricted cash) 3,498 1,435 1,819 1,615Effect of exchange rate differences on cash and cashequivalents 120 35 57 131Cash and cash equivalents at the end of the period(excluding restricted cash) 9 3,990 1,819 3,990 1,819
Average U.S. dollar exchange rate (euro per U.S. dollar) 0.9311 0.9139 0.9038 0.9001
1. Comparative balances have been restated to conform to the current year's presentation. See Note 2.
Summary report, Fourth quarter and Full year 2016
Summary financial statements
Page 15/37
Notes to the consolidated summary financial statements
1. The Company and its operationsThe principal activity of Koninklijke Ahold Delhaize N.V. (“Ahold Delhaize” or the “Company” or "Group"or "Ahold Delhaize Group"), a public limited liability company with its registered seat and head office inZaandam, the Netherlands, is the operation of retail food stores primarily in the United States andEurope.
As of July 24, 2016, Ahold Delhaize is the new name of Koninklijke Ahold N.V. following the completionof the merger between Koninklijke Ahold N.V. ("Ahold") and Delhaize Group NV/SA ("Delhaize").
As a result of the legal structure of the merger, Delhaize merged into Ahold. Since Ahold is the survivingentity, the historical IFRS information prior to the merger is that of Ahold.
The information in these condensed consolidated interim financial statements ("financial statements") isunaudited.
2. Accounting policies
Basis of preparationThese financial statements have been prepared in accordance with IAS 34 “Interim FinancialReporting.” The accounting policies applied in these financial statements are consistent with thoseapplied in Ahold’s 2015 consolidated financial statements, except as otherwise indicated below.
Taxes on income in the interim periods are accrued using the tax rate that would be applicable to theexpected total annual profit or loss.
Ahold Delhaize’s reporting calendar in 2016 is based on 13 periods of four weeks, for a total of 52weeks. The 2015 reporting calendar is based on 12 periods of four weeks and one period of five weeks,for a total of 53 weeks.
The fourth quarter of 2016 started on October 10, 2016. For the former European Delhaize subsidiariesthe fourth quarter started on October 1, 2016, and for the former Delhaize U.S. subsidiaries, the fourthquarter started on October 2, 2016. The results for these Delhaize subsidiaries for the period betweentheir respective starting dates and October 10 have been excluded by extrapolating the incomestatement line items for these days and by adjusting for any significant transactions. The fourth quarterended on January 1, 2017.
SegmentationAhold Delhaize’s operating segments are its retail operating companies that engage in businessactivities from which they earn revenues and incur expenses and whose operating results are regularlyreviewed by the Management Board to make decisions about resources to be allocated to thesegments and to assess their performance. In establishing the reportable segments, certain operatingsegments with similar economic characteristics have been aggregated. As Ahold Delhaize’s operatingsegments offer similar products using complementary business models, and there is no discernibledifference in customer bases, Ahold Delhaize’s policy on aggregating its operating segments intoreportable segments is based on geography and on the management reporting structure.
As a result of the merger of Ahold and Delhaize, Ahold Delhaize assessed the segmentation structure,which resulted in the five reportable segments as included in Note 4 of these summary financialstatements.
Changes in accounting policyIn 2016, in conjunction with the merger and the alignment of accounting policies, theCompany changed its policy of accounting for employee contributions to its defined benefit plans andthey are now reflected as a reduction of service costs in the period in which the related service isrendered. Previously, employee contributions were attributed to the periods of future service whenmeasuring the defined benefit obligation.
Summary report, Fourth quarter and Full year 2016
Summary financial statements
Page 16/37
This change is only applicable to the Company's defined benefit pension plan in the Netherlands, asother defined benefit plans do not receive employee contributions. The change in policy has beenapplied prospectively. The effect of this change in policy was to increase the pension provision balanceby €28 million, through other comprehensive income.
Changes in presentation
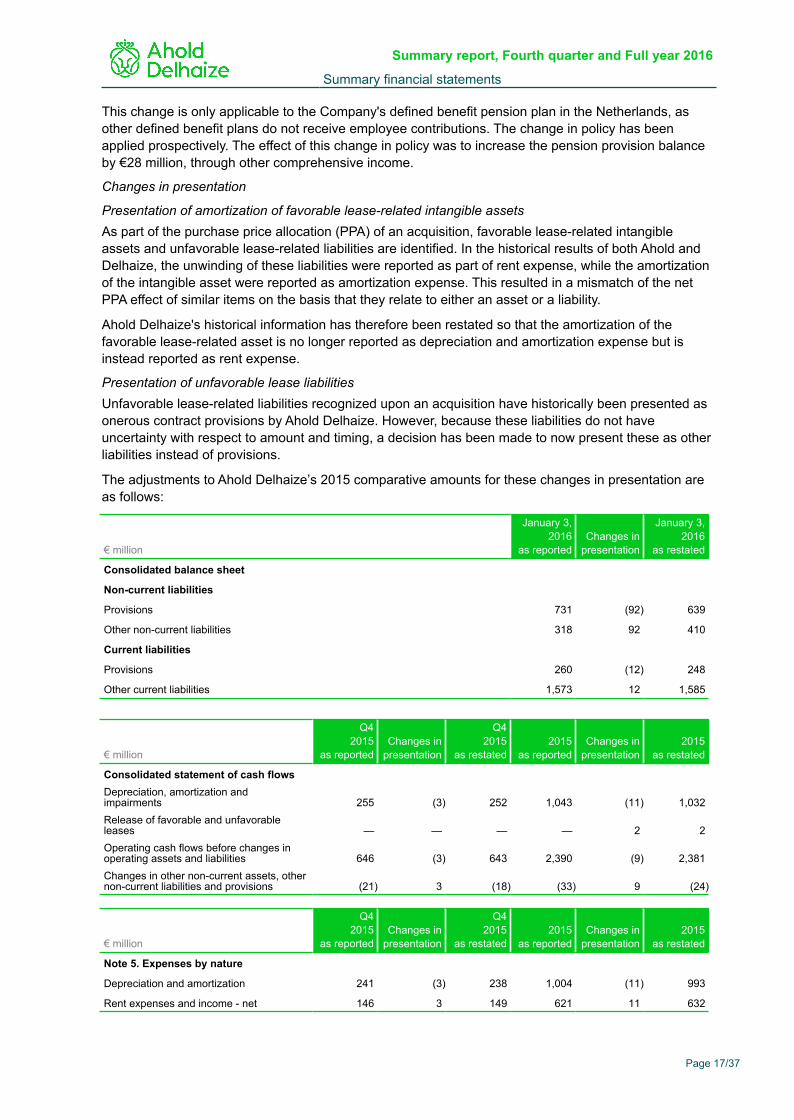
Presentation of amortization of favorable lease-related intangible assetsAs part of the purchase price allocation (PPA) of an acquisition, favorable lease-related intangibleassets and unfavorable lease-related liabilities are identified. In the historical results of both Ahold andDelhaize, the unwinding of these liabilities were reported as part of rent expense, while the amortizationof the intangible asset were reported as amortization expense. This resulted in a mismatch of the netPPA effect of similar items on the basis that they relate to either an asset or a liability.
Ahold Delhaize's historical information has therefore been restated so that the amortization of thefavorable lease-related asset is no longer reported as depreciation and amortization expense but isinstead reported as rent expense.
Presentation of unfavorable lease liabilitiesUnfavorable lease-related liabilities recognized upon an acquisition have historically been presented asonerous contract provisions by Ahold Delhaize. However, because these liabilities do not haveuncertainty with respect to amount and timing, a decision has been made to now present these as otherliabilities instead of provisions.
The adjustments to Ahold Delhaize’s 2015 comparative amounts for these changes in presentation areas follows:
€ million
January 3,2016
as reportedChanges in
presentation
January 3,2016
as restated
Consolidated balance sheet
Non-current liabilities
Provisions 731 (92) 639
Other non-current liabilities 318 92 410
Current liabilities
Provisions 260 (12) 248
Other current liabilities 1,573 12 1,585
€ million
Q42015
as reportedChanges in
presentation
Q42015
as restated 2015
as reportedChanges in
presentation 2015
as restated
Consolidated statement of cash flowsDepreciation, amortization andimpairments 255 (3) 252 1,043 (11) 1,032Release of favorable and unfavorableleases — — — — 2 2Operating cash flows before changes inoperating assets and liabilities 646 (3) 643 2,390 (9) 2,381Changes in other non-current assets, othernon-current liabilities and provisions (21) 3 (18) (33) 9 (24)
€ million
Q42015
as reportedChanges in
presentation
Q42015
as restated 2015
as reportedChanges in
presentation 2015
as restated
Note 5. Expenses by nature
Depreciation and amortization 241 (3) 238 1,004 (11) 993
Rent expenses and income - net 146 3 149 621 11 632
Summary report, Fourth quarter and Full year 2016
Summary financial statements
Page 17/37
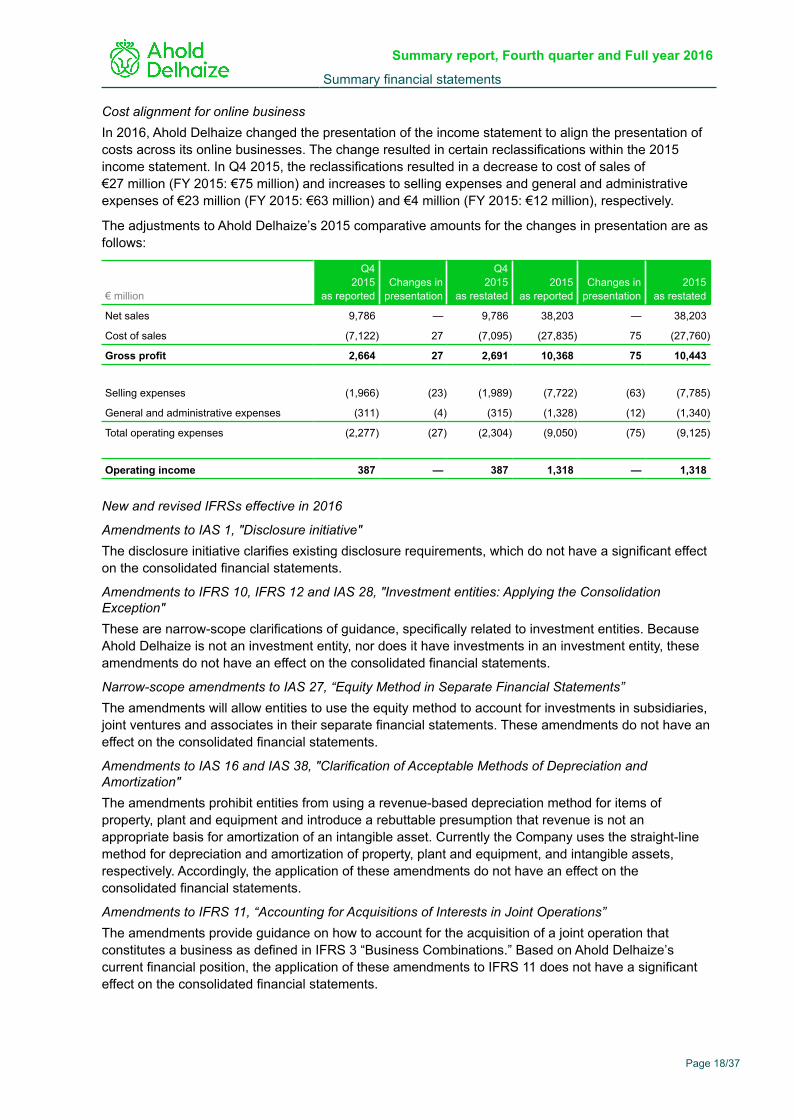
Cost alignment for online businessIn 2016, Ahold Delhaize changed the presentation of the income statement to align the presentation ofcosts across its online businesses. The change resulted in certain reclassifications within the 2015income statement. In Q4 2015, the reclassifications resulted in a decrease to cost of sales of€27 million (FY 2015: €75 million) and increases to selling expenses and general and administrativeexpenses of €23 million (FY 2015: €63 million) and €4 million (FY 2015: €12 million), respectively.
The adjustments to Ahold Delhaize’s 2015 comparative amounts for the changes in presentation are asfollows:
€ million
Q4 2015
as reportedChanges in
presentation
Q4 2015
as restated 2015
as reportedChanges in
presentation2015
as restated
Net sales 9,786 — 9,786 38,203 — 38,203
Cost of sales (7,122) 27 (7,095) (27,835) 75 (27,760)
Gross profit 2,664 27 2,691 10,368 75 10,443
Selling expenses (1,966) (23) (1,989) (7,722) (63) (7,785)
General and administrative expenses (311) (4) (315) (1,328) (12) (1,340)
Total operating expenses (2,277) (27) (2,304) (9,050) (75) (9,125)
Operating income 387 — 387 1,318 — 1,318
New and revised IFRSs effective in 2016
Amendments to IAS 1, "Disclosure initiative" The disclosure initiative clarifies existing disclosure requirements, which do not have a significant effecton the consolidated financial statements.
Amendments to IFRS 10, IFRS 12 and IAS 28, "Investment entities: Applying the ConsolidationException" These are narrow-scope clarifications of guidance, specifically related to investment entities. BecauseAhold Delhaize is not an investment entity, nor does it have investments in an investment entity, theseamendments do not have an effect on the consolidated financial statements.
Narrow-scope amendments to IAS 27, “Equity Method in Separate Financial Statements” The amendments will allow entities to use the equity method to account for investments in subsidiaries,joint ventures and associates in their separate financial statements. These amendments do not have aneffect on the consolidated financial statements.
Amendments to IAS 16 and IAS 38, "Clarification of Acceptable Methods of Depreciation andAmortization" The amendments prohibit entities from using a revenue-based depreciation method for items ofproperty, plant and equipment and introduce a rebuttable presumption that revenue is not anappropriate basis for amortization of an intangible asset. Currently the Company uses the straight-linemethod for depreciation and amortization of property, plant and equipment, and intangible assets,respectively. Accordingly, the application of these amendments do not have an effect on theconsolidated financial statements.
Amendments to IFRS 11, “Accounting for Acquisitions of Interests in Joint Operations” The amendments provide guidance on how to account for the acquisition of a joint operation thatconstitutes a business as defined in IFRS 3 “Business Combinations.” Based on Ahold Delhaize’scurrent financial position, the application of these amendments to IFRS 11 does not have a significanteffect on the consolidated financial statements.
Summary report, Fourth quarter and Full year 2016
Summary financial statements
Page 18/37
Annual improvements to IFRSs 2012-2014 Annual improvements to IFRSs 2012-2014 Cycle made a number of amendments to various IFRSs,which do not have a significant effect on the consolidated financial statements.
3. Business combinations and goodwillOn July 23, 2016, Ahold and Delhaize announced the completion of their merger, which becameeffective on July 24, 2016. With this merger, Ahold Delhaize has 21 local brands in 11 countries andemploys 370,000 associates in over 6,500 grocery and specialty stores.
Key terms of the merger are:
• The merger took place through a cross-border legal merger of Delhaize into Ahold; • Delhaize shareholders received 4.75 Ahold ordinary shares for each Delhaize ordinary share; • €1 billion was returned to Ahold shareholders via a capital return and a reverse stock split prior
to completion of the merger; and • Ahold Delhaize is listed on the Amsterdam Stock Exchange and the Brussels Stock Exchange.
The merger has been accounted for as a business combination using the acquisition method ofaccounting under IFRS 3, with Ahold being identified as the acquirer.
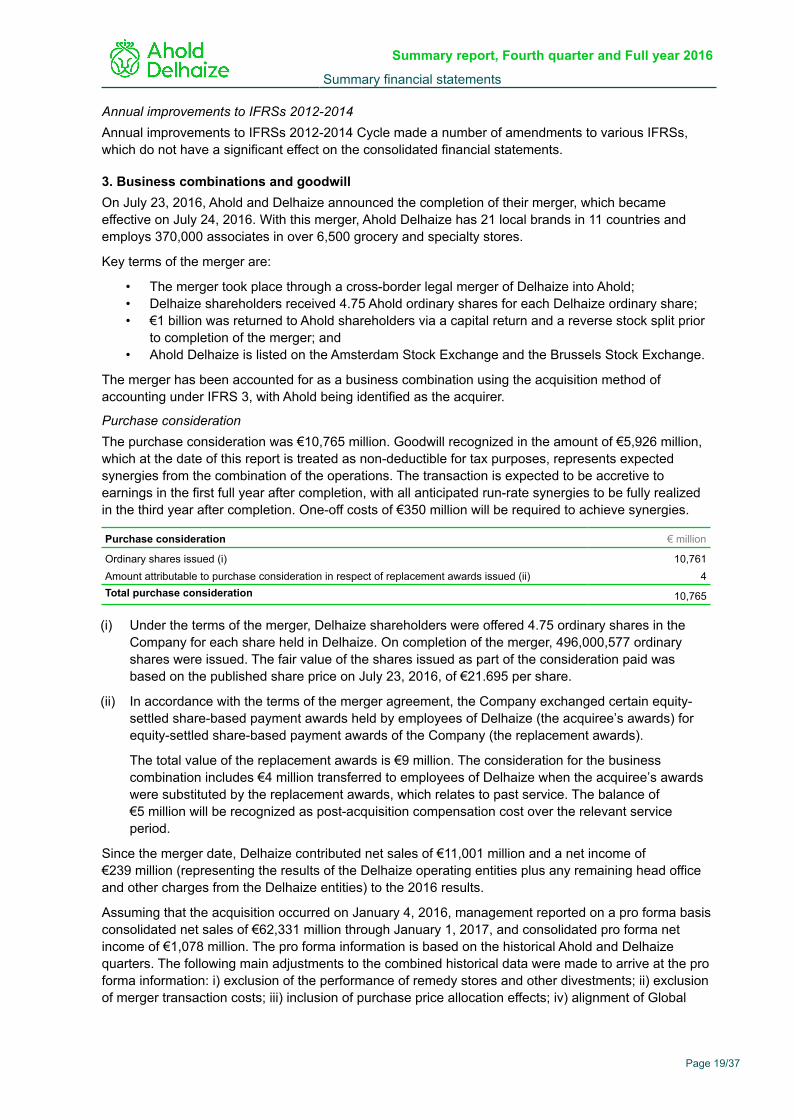
Purchase considerationThe purchase consideration was €10,765 million. Goodwill recognized in the amount of €5,926 million,which at the date of this report is treated as non-deductible for tax purposes, represents expectedsynergies from the combination of the operations. The transaction is expected to be accretive toearnings in the first full year after completion, with all anticipated run-rate synergies to be fully realizedin the third year after completion. One-off costs of €350 million will be required to achieve synergies.
Purchase consideration € million
Ordinary shares issued (i) 10,761Amount attributable to purchase consideration in respect of replacement awards issued (ii) 4Total purchase consideration 10,765
(i) Under the terms of the merger, Delhaize shareholders were offered 4.75 ordinary shares in theCompany for each share held in Delhaize. On completion of the merger, 496,000,577 ordinaryshares were issued. The fair value of the shares issued as part of the consideration paid wasbased on the published share price on July 23, 2016, of €21.695 per share.
(ii) In accordance with the terms of the merger agreement, the Company exchanged certain equity-settled share-based payment awards held by employees of Delhaize (the acquiree’s awards) forequity-settled share-based payment awards of the Company (the replacement awards).
The total value of the replacement awards is €9 million. The consideration for the businesscombination includes €4 million transferred to employees of Delhaize when the acquiree’s awardswere substituted by the replacement awards, which relates to past service. The balance of€5 million will be recognized as post-acquisition compensation cost over the relevant serviceperiod.
Since the merger date, Delhaize contributed net sales of €11,001 million and a net income of€239 million (representing the results of the Delhaize operating entities plus any remaining head officeand other charges from the Delhaize entities) to the 2016 results.
Assuming that the acquisition occurred on January 4, 2016, management reported on a pro forma basisconsolidated net sales of €62,331 million through January 1, 2017, and consolidated pro forma netincome of €1,078 million. The pro forma information is based on the historical Ahold and Delhaizequarters. The following main adjustments to the combined historical data were made to arrive at the proforma information: i) exclusion of the performance of remedy stores and other divestments; ii) exclusionof merger transaction costs; iii) inclusion of purchase price allocation effects; iv) alignment of Global
Summary report, Fourth quarter and Full year 2016
Summary financial statements
Page 19/37
Support Office functions and related costs; and v) alignment of foreign exchange rates used in thetranslation of foreign group entities.
Acquisition-related costsAhold and Delhaize incurred transaction costs of €135 million for banking fees, legal fees and otherprofessional fees, of which €62 million has been booked by Ahold and Delhaize in 2015 and €73 millionin 2016. Transaction costs of €38 million (2015: €32 million) have been included in General andadministrative expenses as Restructuring and related charges and other.
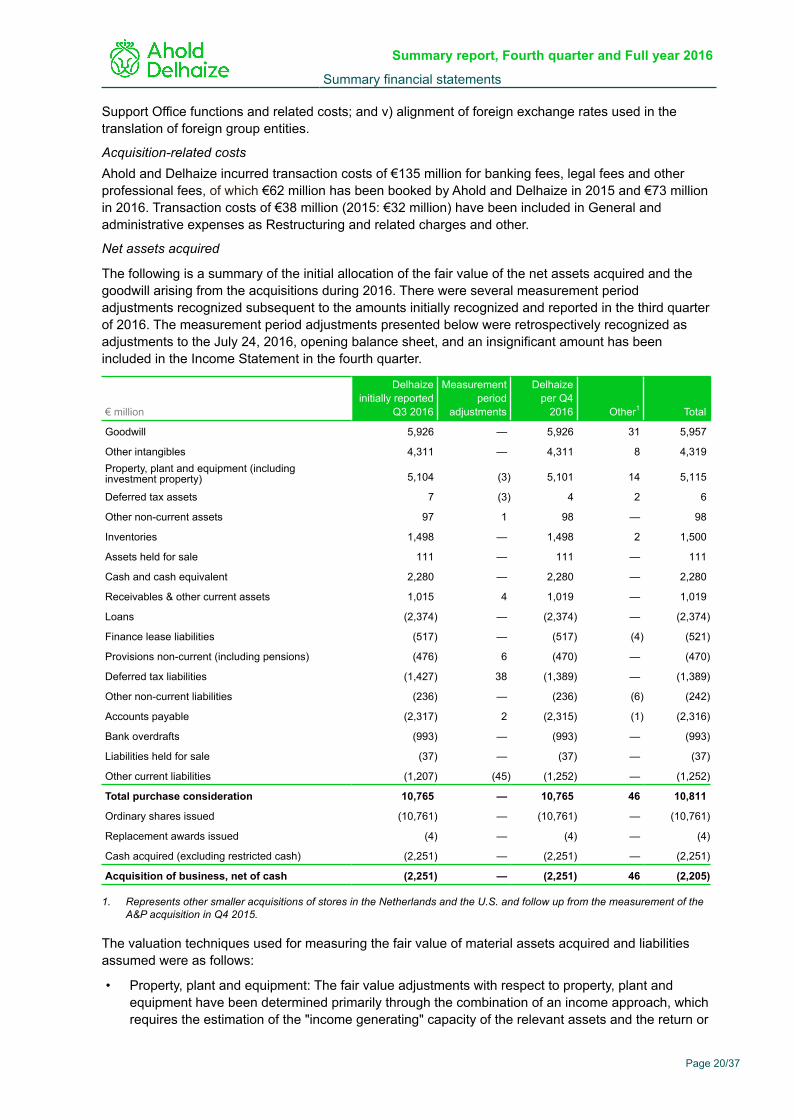
Net assets acquired
The following is a summary of the initial allocation of the fair value of the net assets acquired and thegoodwill arising from the acquisitions during 2016. There were several measurement periodadjustments recognized subsequent to the amounts initially recognized and reported in the third quarterof 2016. The measurement period adjustments presented below were retrospectively recognized asadjustments to the July 24, 2016, opening balance sheet, and an insignificant amount has beenincluded in the Income Statement in the fourth quarter.
€ million
Delhaize initially reported
Q3 2016
Measurementperiod
adjustments
Delhaizeper Q4
2016 Other1 Total
Goodwill 5,926 — 5,926 31 5,957
Other intangibles 4,311 — 4,311 8 4,319Property, plant and equipment (includinginvestment property) 5,104 (3) 5,101 14 5,115
Deferred tax assets 7 (3) 4 2 6
Other non-current assets 97 1 98 — 98
Inventories 1,498 — 1,498 2 1,500
Assets held for sale 111 — 111 — 111
Cash and cash equivalent 2,280 — 2,280 — 2,280
Receivables & other current assets 1,015 4 1,019 — 1,019
Loans (2,374) — (2,374) — (2,374)
Finance lease liabilities (517) — (517) (4) (521)
Provisions non-current (including pensions) (476) 6 (470) — (470)
Deferred tax liabilities (1,427) 38 (1,389) — (1,389)
Other non-current liabilities (236) — (236) (6) (242)
Accounts payable (2,317) 2 (2,315) (1) (2,316)
Bank overdrafts (993) — (993) — (993)
Liabilities held for sale (37) — (37) — (37)
Other current liabilities (1,207) (45) (1,252) — (1,252)
Total purchase consideration 10,765 — 10,765 46 10,811
Ordinary shares issued (10,761) — (10,761) — (10,761)
Replacement awards issued (4) — (4) — (4)
Cash acquired (excluding restricted cash) (2,251) — (2,251) — (2,251)
Acquisition of business, net of cash (2,251) — (2,251) 46 (2,205)
1. Represents other smaller acquisitions of stores in the Netherlands and the U.S. and follow up from the measurement of theA&P acquisition in Q4 2015.
The valuation techniques used for measuring the fair value of material assets acquired and liabilitiesassumed were as follows:
• Property, plant and equipment: The fair value adjustments with respect to property, plant andequipment have been determined primarily through the combination of an income approach, whichrequires the estimation of the "income generating" capacity of the relevant assets and the return or
Summary report, Fourth quarter and Full year 2016
Summary financial statements
Page 20/37
yield that a market participant would apply to such assets; a cost approach, which requires thecalculation of the depreciated replacement cost of the relevant assets; and a market approach,which requires the comparison of the subject assets to transactions involving comparable assets.
• Other intangible assets: The fair values of brand names and contractual relationships have beendetermined primarily through an income approach, which requires an estimate or forecast of futureexpected cash flows through either a relief from royalty or multi-period excess earnings approach.
• Other intangible assets - lease-related intangibles: The fair values of lease-related intangibleshave been assessed through a market approach, which requires a comparison of contract andmarket prices.
• Deferred tax assets and liabilities: Deferred income tax assets and liabilities as of the merger daterepresented the expected future tax consequences of temporary differences between the fairvalues of the assets acquired and liabilities assumed and their tax bases. Deferred tax liabilitieshave been recognized in full except where the reversal of the temporary differences is within thecontrol of the Company and these differences are not expected to reverse in the foreseeablefuture. Deferred tax assets have been recognized based on recoverability of the temporarydifferences and considering the tax planning strategies expected to be adopted by the Company.
• Inventory: The fair value of inventory is primarily the carrying value at the merger date on the basisthat the carrying value of inventory at cost for a retailer represents the fair value that would be paidby a market participant in the retail sector.
• Assets held for sale - remedy stores: In order to get approval from competition authorities in theU.S. and Belgium, the Company has agreed to sell certain stores as part of the merger ("remedystores"). The remedy stores have been presented as assets held for sale on the opening balancesheet and the purchase price allocated to these stores is based on the expected salesconsideration, less any incremental costs directly attributable to the sale in accordance withIFRS 5.
• Loans: The fair value of debt was estimated primarily on the basis of "market-quoted rates" for thelisted debt.
• Provisions - contingent liabilities: The provisions assumed as part of the net assets of the businesscombination include the fair value of contingent liabilities related to certain legal disputes as well aslease guarantees provided to lessors on certain stores which have been assigned or sold.
The fair value of the contingent liability associated with the legal disputes is based on anassessment of the expected cash outflow and the probability of such an outflow. The timingassociated with any settlement of these disputes is uncertain and therefore the expected cashoutflow considering its probability has not been discounted.
The fair value of the contingent liability associated with lease guarantees provided on sold orassigned stores is based on an evaluation of the counterparty’s credit risk (i.e., the risk of the partyon behalf of whom the guarantee is provided) and the re-let potential of the property linked to itslocation.
• Other receivables and liabilities: Other receivables and liabilities such as trade payables andreceivables, other current and non-current assets and liabilities, provisions (other than contingentliabilities) and accruals are valued at the carrying values in Delhaize's books on the basis that thecarrying value represented the fair value as of the merger date. The carrying value of tradereceivables recorded in Delhaize's books included a provision relating to uncertain tradereceivables where collectibility was not assured and these provisions have been included in thefair value assessment as of the merger date. No incremental fair value adjustments have beenmade to the carrying value of trade receivables recorded in Delhaize's books.
If new information is obtained within one year of the date of acquisition about any additional provisionsor facts and circumstances that would lead to adjustments to the above amounts that existed at thedate of acquisition, the accounting for the acquisition will be revised.
Summary report, Fourth quarter and Full year 2016
Summary financial statements
Page 21/37
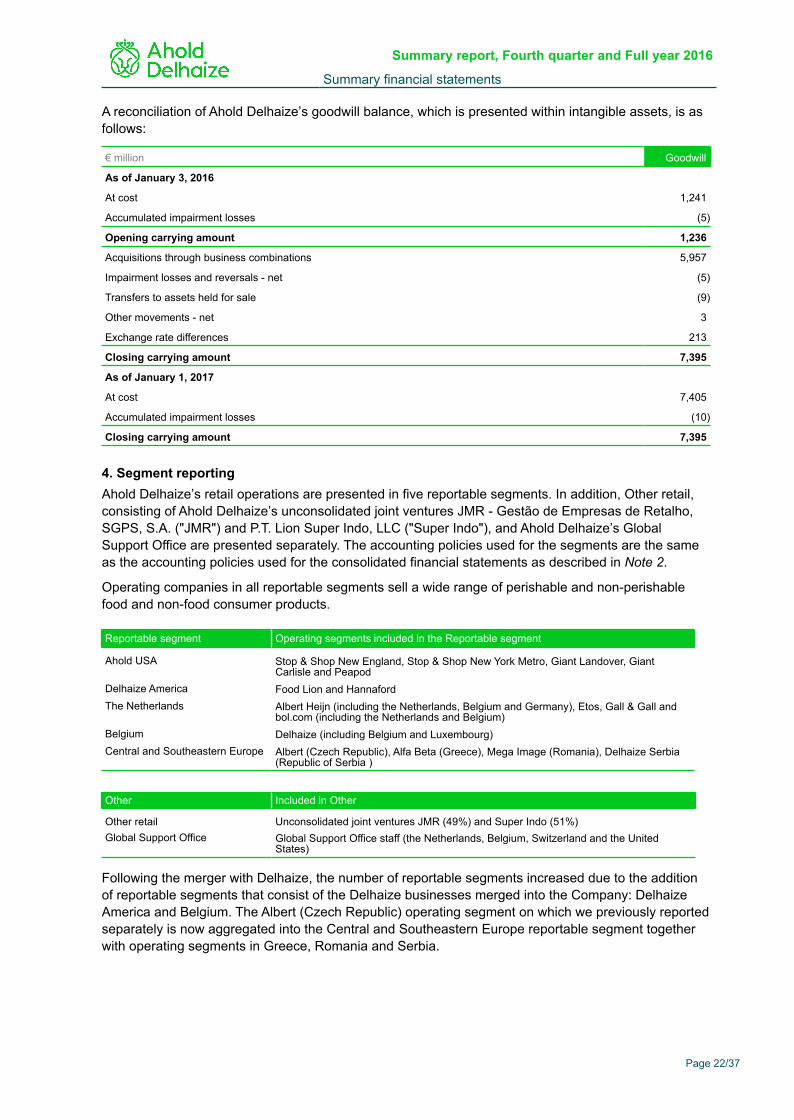
A reconciliation of Ahold Delhaize’s goodwill balance, which is presented within intangible assets, is asfollows:
€ million Goodwill
As of January 3, 2016
At cost 1,241
Accumulated impairment losses (5)
Opening carrying amount 1,236
Acquisitions through business combinations 5,957
Impairment losses and reversals - net (5)
Transfers to assets held for sale (9)
Other movements - net 3
Exchange rate differences 213
Closing carrying amount 7,395
As of January 1, 2017
At cost 7,405
Accumulated impairment losses (10)
Closing carrying amount 7,395
4. Segment reportingAhold Delhaize’s retail operations are presented in five reportable segments. In addition, Other retail,consisting of Ahold Delhaize’s unconsolidated joint ventures JMR - Gestão de Empresas de Retalho,SGPS, S.A. ("JMR") and P.T. Lion Super Indo, LLC ("Super Indo"), and Ahold Delhaize’s GlobalSupport Office are presented separately. The accounting policies used for the segments are the sameas the accounting policies used for the consolidated financial statements as described in Note 2.
Operating companies in all reportable segments sell a wide range of perishable and non-perishablefood and non-food consumer products.
Reportable segment Operating segments included in the Reportable segment
Ahold USA Stop & Shop New England, Stop & Shop New York Metro, Giant Landover, GiantCarlisle and Peapod
Delhaize America Food Lion and HannafordThe Netherlands Albert Heijn (including the Netherlands, Belgium and Germany), Etos, Gall & Gall and
bol.com (including the Netherlands and Belgium)Belgium Delhaize (including Belgium and Luxembourg)Central and Southeastern Europe Albert (Czech Republic), Alfa Beta (Greece), Mega Image (Romania), Delhaize Serbia
(Republic of Serbia )
Other Included in Other
Other retail Unconsolidated joint ventures JMR (49%) and Super Indo (51%)Global Support Office Global Support Office staff (the Netherlands, Belgium, Switzerland and the United
States)
Following the merger with Delhaize, the number of reportable segments increased due to the additionof reportable segments that consist of the Delhaize businesses merged into the Company: DelhaizeAmerica and Belgium. The Albert (Czech Republic) operating segment on which we previously reportedseparately is now aggregated into the Central and Southeastern Europe reportable segment togetherwith operating segments in Greece, Romania and Serbia.
Summary report, Fourth quarter and Full year 2016
Summary financial statements
Page 22/37
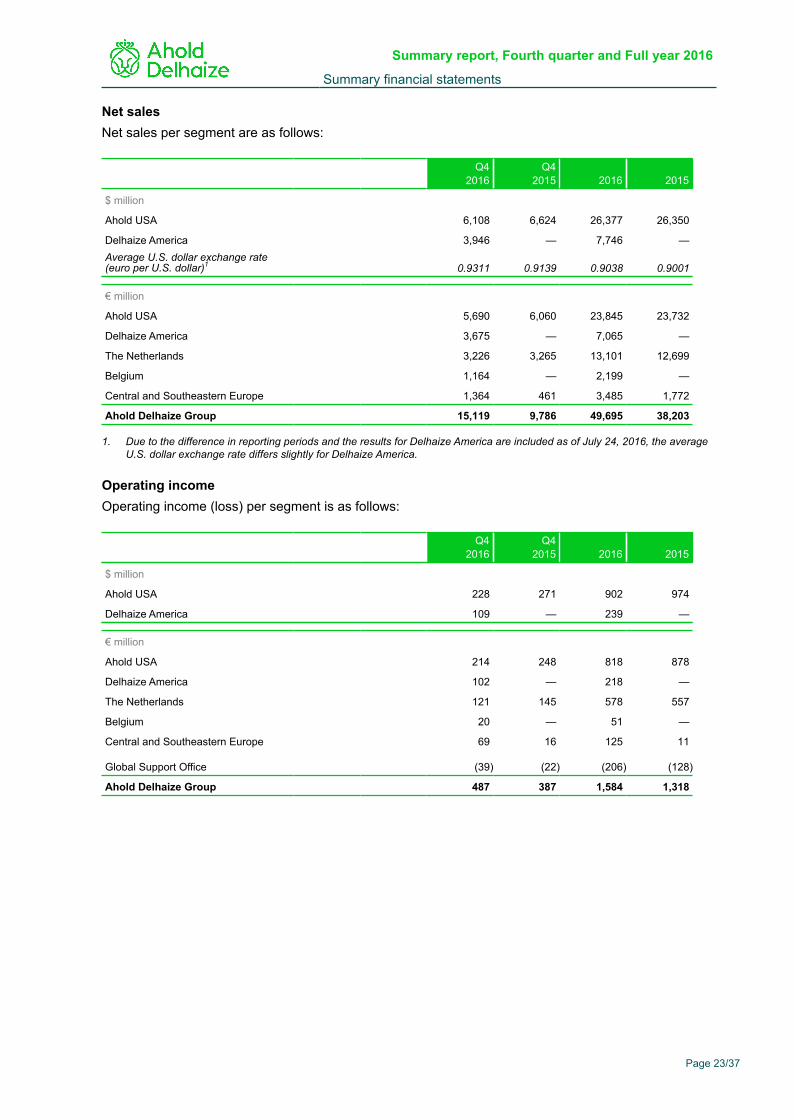
Net salesNet sales per segment are as follows:
Q42016
Q42015 2016 2015
$ million
Ahold USA 6,108 6,624 26,377 26,350
Delhaize America 3,946 — 7,746 —Average U.S. dollar exchange rate(euro per U.S. dollar)1 0.9311 0.9139 0.9038 0.9001
€ million
Ahold USA 5,690 6,060 23,845 23,732
Delhaize America 3,675 — 7,065 —
The Netherlands 3,226 3,265 13,101 12,699
Belgium 1,164 — 2,199 —
Central and Southeastern Europe 1,364 461 3,485 1,772
Ahold Delhaize Group 15,119 9,786 49,695 38,203
1. Due to the difference in reporting periods and the results for Delhaize America are included as of July 24, 2016, the averageU.S. dollar exchange rate differs slightly for Delhaize America.
Operating income Operating income (loss) per segment is as follows:
Q42016
Q42015 2016 2015
$ million
Ahold USA 228 271 902 974
Delhaize America 109 — 239 —
€ million
Ahold USA 214 248 818 878
Delhaize America 102 — 218 —
The Netherlands 121 145 578 557
Belgium 20 — 51 —
Central and Southeastern Europe 69 16 125 11
Global Support Office (39) (22) (206) (128)
Ahold Delhaize Group 487 387 1,584 1,318
Summary report, Fourth quarter and Full year 2016
Summary financial statements
Page 23/37
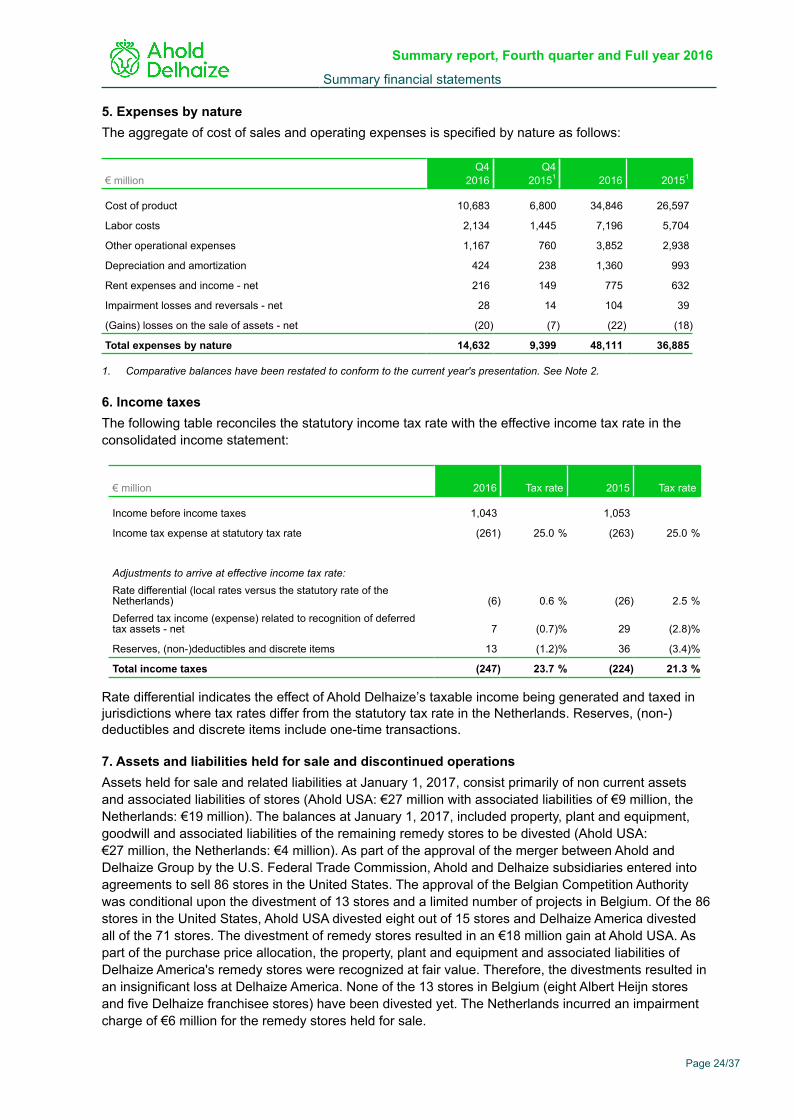
5. Expenses by natureThe aggregate of cost of sales and operating expenses is specified by nature as follows:
€ millionQ4
2016Q4
20151 2016 20151
Cost of product 10,683 6,800 34,846 26,597
Labor costs 2,134 1,445 7,196 5,704
Other operational expenses 1,167 760 3,852 2,938
Depreciation and amortization 424 238 1,360 993
Rent expenses and income - net 216 149 775 632
Impairment losses and reversals - net 28 14 104 39
(Gains) losses on the sale of assets - net (20) (7) (22) (18)
Total expenses by nature 14,632 9,399 48,111 36,885
1. Comparative balances have been restated to conform to the current year's presentation. See Note 2.
6. Income taxesThe following table reconciles the statutory income tax rate with the effective income tax rate in theconsolidated income statement:
€ million 2016 Tax rate 2015 Tax rate
Income before income taxes 1,043 1,053
Income tax expense at statutory tax rate (261) 25.0 % (263) 25.0 %
Adjustments to arrive at effective income tax rate:Rate differential (local rates versus the statutory rate of theNetherlands) (6) 0.6 % (26) 2.5 %Deferred tax income (expense) related to recognition of deferredtax assets - net 7 (0.7)% 29 (2.8)%
Reserves, (non-)deductibles and discrete items 13 (1.2)% 36 (3.4)%
Total income taxes (247) 23.7 % (224) 21.3 %
Rate differential indicates the effect of Ahold Delhaize’s taxable income being generated and taxed injurisdictions where tax rates differ from the statutory tax rate in the Netherlands. Reserves, (non-)deductibles and discrete items include one-time transactions.
7. Assets and liabilities held for sale and discontinued operationsAssets held for sale and related liabilities at January 1, 2017, consist primarily of non current assetsand associated liabilities of stores (Ahold USA: €27 million with associated liabilities of €9 million, theNetherlands: €19 million). The balances at January 1, 2017, included property, plant and equipment,goodwill and associated liabilities of the remaining remedy stores to be divested (Ahold USA:€27 million, the Netherlands: €4 million). As part of the approval of the merger between Ahold andDelhaize Group by the U.S. Federal Trade Commission, Ahold and Delhaize subsidiaries entered intoagreements to sell 86 stores in the United States. The approval of the Belgian Competition Authoritywas conditional upon the divestment of 13 stores and a limited number of projects in Belgium. Of the 86stores in the United States, Ahold USA divested eight out of 15 stores and Delhaize America divestedall of the 71 stores. The divestment of remedy stores resulted in an €18 million gain at Ahold USA. Aspart of the purchase price allocation, the property, plant and equipment and associated liabilities ofDelhaize America's remedy stores were recognized at fair value. Therefore, the divestments resulted inan insignificant loss at Delhaize America. None of the 13 stores in Belgium (eight Albert Heijn storesand five Delhaize franchisee stores) have been divested yet. The Netherlands incurred an impairmentcharge of €6 million for the remedy stores held for sale.
Summary report, Fourth quarter and Full year 2016
Summary financial statements
Page 24/37
In addition, Ahold Delhaize completed the sale of pet specialist shop chain Tom & Co with aninsignificant divestment loss.
The remedy stores and Tom & Co do not represent discontinued operations.
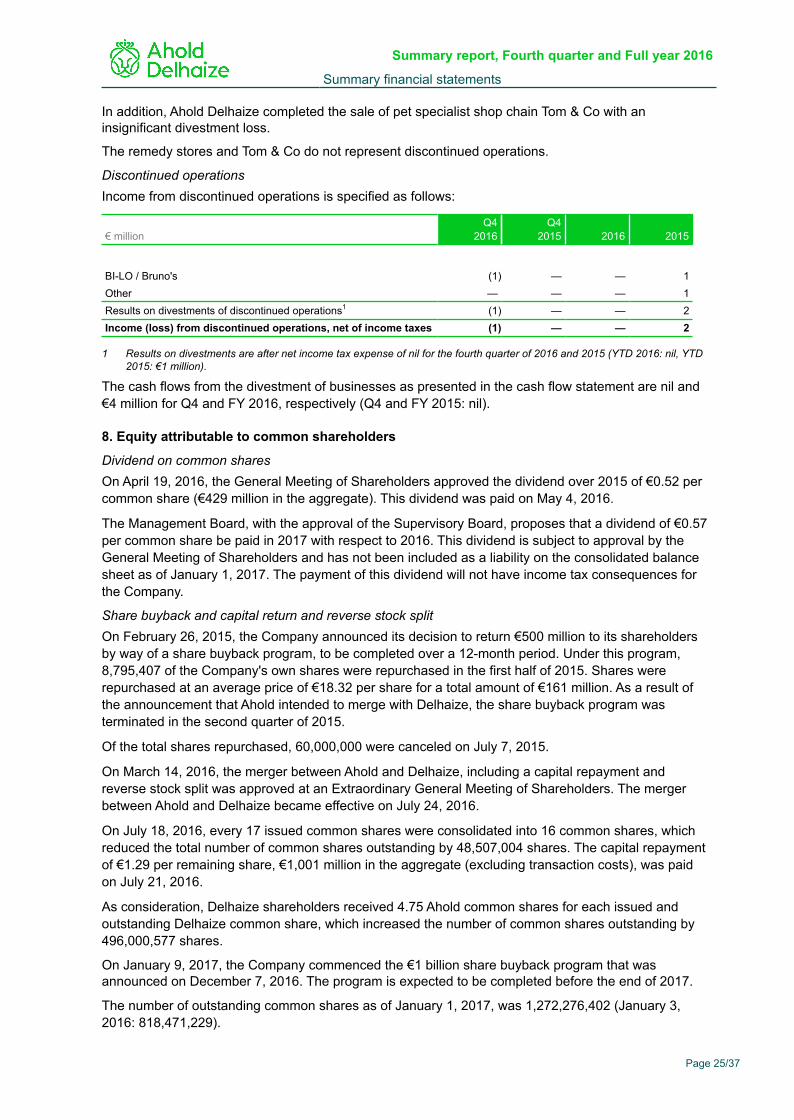
Discontinued operationsIncome from discontinued operations is specified as follows:
€ millionQ4
2016Q4
2015 2016 2015
BI-LO / Bruno's (1) — — 1Other — — — 1Results on divestments of discontinued operations1 (1) — — 2Income (loss) from discontinued operations, net of income taxes (1) — — 2
1 Results on divestments are after net income tax expense of nil for the fourth quarter of 2016 and 2015 (YTD 2016: nil, YTD2015: €1 million).
The cash flows from the divestment of businesses as presented in the cash flow statement are nil and€4 million for Q4 and FY 2016, respectively (Q4 and FY 2015: nil).
8. Equity attributable to common shareholders
Dividend on common sharesOn April 19, 2016, the General Meeting of Shareholders approved the dividend over 2015 of €0.52 percommon share (€429 million in the aggregate). This dividend was paid on May 4, 2016.
The Management Board, with the approval of the Supervisory Board, proposes that a dividend of €0.57per common share be paid in 2017 with respect to 2016. This dividend is subject to approval by theGeneral Meeting of Shareholders and has not been included as a liability on the consolidated balancesheet as of January 1, 2017. The payment of this dividend will not have income tax consequences forthe Company.
Share buyback and capital return and reverse stock splitOn February 26, 2015, the Company announced its decision to return €500 million to its shareholdersby way of a share buyback program, to be completed over a 12-month period. Under this program,8,795,407 of the Company's own shares were repurchased in the first half of 2015. Shares wererepurchased at an average price of €18.32 per share for a total amount of €161 million. As a result ofthe announcement that Ahold intended to merge with Delhaize, the share buyback program wasterminated in the second quarter of 2015.
Of the total shares repurchased, 60,000,000 were canceled on July 7, 2015.
On March 14, 2016, the merger between Ahold and Delhaize, including a capital repayment andreverse stock split was approved at an Extraordinary General Meeting of Shareholders. The mergerbetween Ahold and Delhaize became effective on July 24, 2016.
On July 18, 2016, every 17 issued common shares were consolidated into 16 common shares, whichreduced the total number of common shares outstanding by 48,507,004 shares. The capital repaymentof €1.29 per remaining share, €1,001 million in the aggregate (excluding transaction costs), was paidon July 21, 2016.
As consideration, Delhaize shareholders received 4.75 Ahold common shares for each issued andoutstanding Delhaize common share, which increased the number of common shares outstanding by496,000,577 shares.
On January 9, 2017, the Company commenced the €1 billion share buyback program that wasannounced on December 7, 2016. The program is expected to be completed before the end of 2017.
The number of outstanding common shares as of January 1, 2017, was 1,272,276,402 (January 3,2016: 818,471,229).
Summary report, Fourth quarter and Full year 2016
Summary financial statements
Page 25/37
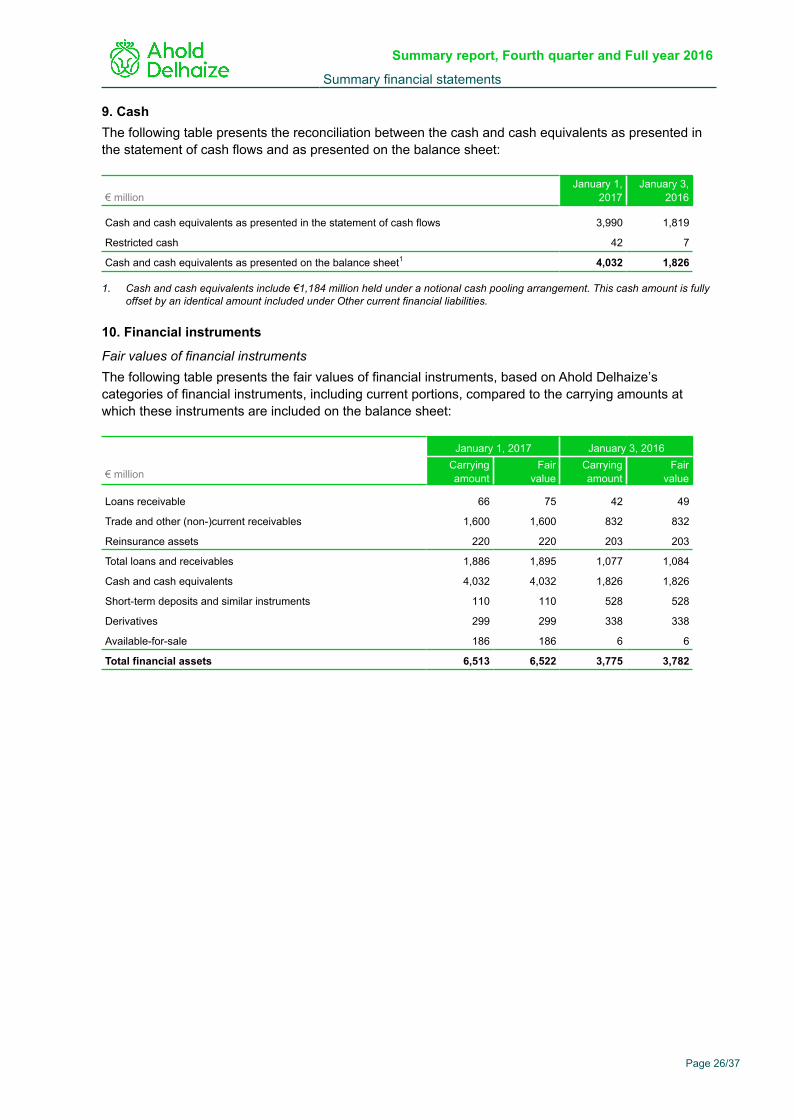
9. CashThe following table presents the reconciliation between the cash and cash equivalents as presented inthe statement of cash flows and as presented on the balance sheet:
€ millionJanuary 1,
2017January 3,
2016
Cash and cash equivalents as presented in the statement of cash flows 3,990 1,819
Restricted cash 42 7
Cash and cash equivalents as presented on the balance sheet1 4,032 1,826
1. Cash and cash equivalents include €1,184 million held under a notional cash pooling arrangement. This cash amount is fullyoffset by an identical amount included under Other current financial liabilities.
10. Financial instruments
Fair values of financial instrumentsThe following table presents the fair values of financial instruments, based on Ahold Delhaize’scategories of financial instruments, including current portions, compared to the carrying amounts atwhich these instruments are included on the balance sheet:
€ million
January 1, 2017 January 3, 2016Carryingamount
Fairvalue
Carryingamount
Fairvalue
Loans receivable 66 75 42 49
Trade and other (non-)current receivables 1,600 1,600 832 832
Reinsurance assets 220 220 203 203
Total loans and receivables 1,886 1,895 1,077 1,084
Cash and cash equivalents 4,032 4,032 1,826 1,826
Short-term deposits and similar instruments 110 110 528 528
Derivatives 299 299 338 338
Available-for-sale 186 186 6 6
Total financial assets 6,513 6,522 3,775 3,782
Summary report, Fourth quarter and Full year 2016
Summary financial statements
Page 26/37
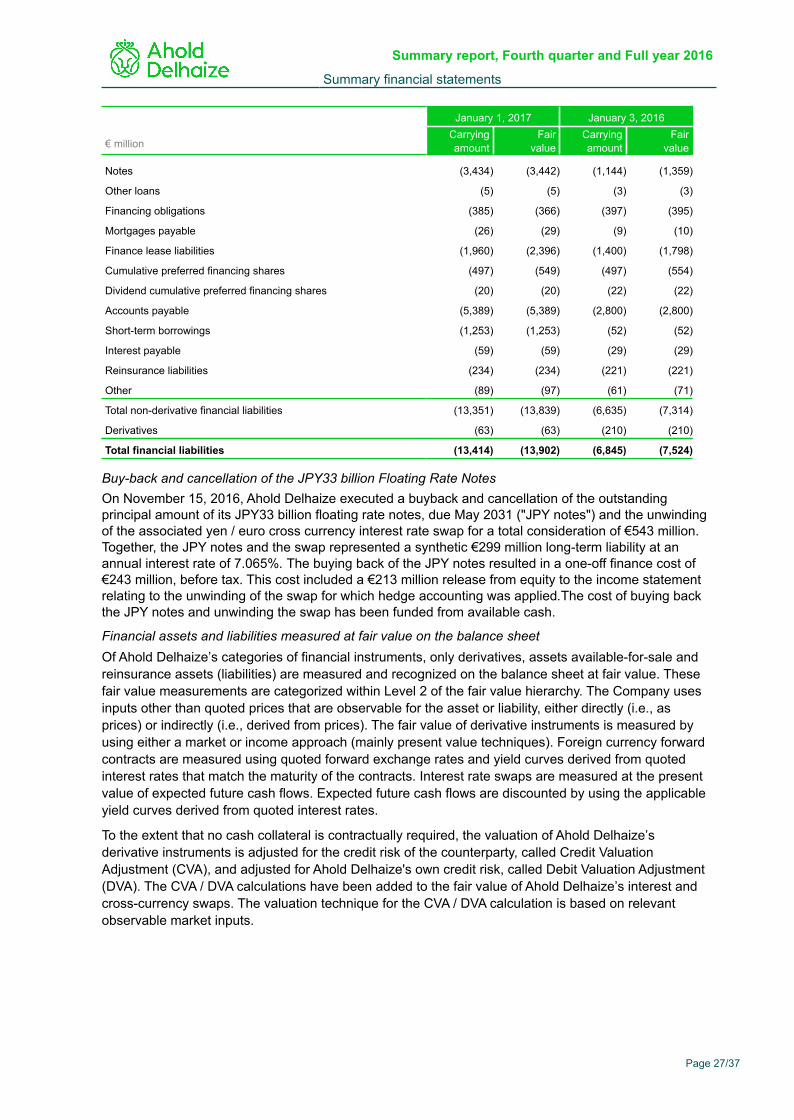
€ million
January 1, 2017 January 3, 2016Carryingamount
Fairvalue
Carryingamount
Fairvalue
Notes (3,434) (3,442) (1,144) (1,359)
Other loans (5) (5) (3) (3)
Financing obligations (385) (366) (397) (395)
Mortgages payable (26) (29) (9) (10)
Finance lease liabilities (1,960) (2,396) (1,400) (1,798)
Cumulative preferred financing shares (497) (549) (497) (554)
Dividend cumulative preferred financing shares (20) (20) (22) (22)
Accounts payable (5,389) (5,389) (2,800) (2,800)
Short-term borrowings (1,253) (1,253) (52) (52)
Interest payable (59) (59) (29) (29)
Reinsurance liabilities (234) (234) (221) (221)
Other (89) (97) (61) (71)
Total non-derivative financial liabilities (13,351) (13,839) (6,635) (7,314)
Derivatives (63) (63) (210) (210)
Total financial liabilities (13,414) (13,902) (6,845) (7,524)
Buy-back and cancellation of the JPY33 billion Floating Rate NotesOn November 15, 2016, Ahold Delhaize executed a buyback and cancellation of the outstandingprincipal amount of its JPY33 billion floating rate notes, due May 2031 ("JPY notes") and the unwindingof the associated yen / euro cross currency interest rate swap for a total consideration of €543 million.Together, the JPY notes and the swap represented a synthetic €299 million long-term liability at anannual interest rate of 7.065%. The buying back of the JPY notes resulted in a one-off finance cost of€243 million, before tax. This cost included a €213 million release from equity to the income statementrelating to the unwinding of the swap for which hedge accounting was applied.The cost of buying backthe JPY notes and unwinding the swap has been funded from available cash.
Financial assets and liabilities measured at fair value on the balance sheetOf Ahold Delhaize’s categories of financial instruments, only derivatives, assets available-for-sale andreinsurance assets (liabilities) are measured and recognized on the balance sheet at fair value. Thesefair value measurements are categorized within Level 2 of the fair value hierarchy. The Company usesinputs other than quoted prices that are observable for the asset or liability, either directly (i.e., asprices) or indirectly (i.e., derived from prices). The fair value of derivative instruments is measured byusing either a market or income approach (mainly present value techniques). Foreign currency forwardcontracts are measured using quoted forward exchange rates and yield curves derived from quotedinterest rates that match the maturity of the contracts. Interest rate swaps are measured at the presentvalue of expected future cash flows. Expected future cash flows are discounted by using the applicableyield curves derived from quoted interest rates.
To the extent that no cash collateral is contractually required, the valuation of Ahold Delhaize’sderivative instruments is adjusted for the credit risk of the counterparty, called Credit ValuationAdjustment (CVA), and adjusted for Ahold Delhaize's own credit risk, called Debit Valuation Adjustment(DVA). The CVA / DVA calculations have been added to the fair value of Ahold Delhaize’s interest andcross-currency swaps. The valuation technique for the CVA / DVA calculation is based on relevantobservable market inputs.
Summary report, Fourth quarter and Full year 2016
Summary financial statements
Page 27/37
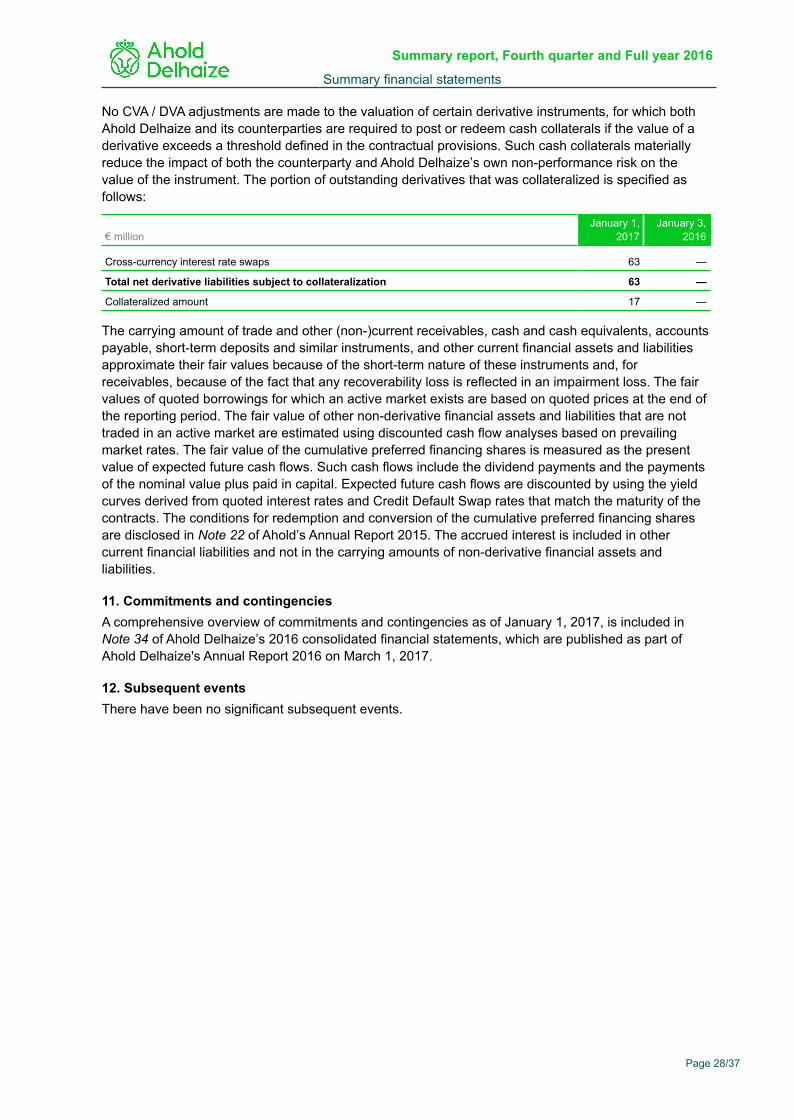
No CVA / DVA adjustments are made to the valuation of certain derivative instruments, for which bothAhold Delhaize and its counterparties are required to post or redeem cash collaterals if the value of aderivative exceeds a threshold defined in the contractual provisions. Such cash collaterals materiallyreduce the impact of both the counterparty and Ahold Delhaize’s own non-performance risk on thevalue of the instrument. The portion of outstanding derivatives that was collateralized is specified asfollows:
€ millionJanuary 1,
2017January 3,
2016
Cross-currency interest rate swaps 63 —
Total net derivative liabilities subject to collateralization 63 —
Collateralized amount 17 —
The carrying amount of trade and other (non-)current receivables, cash and cash equivalents, accountspayable, short-term deposits and similar instruments, and other current financial assets and liabilitiesapproximate their fair values because of the short-term nature of these instruments and, forreceivables, because of the fact that any recoverability loss is reflected in an impairment loss. The fairvalues of quoted borrowings for which an active market exists are based on quoted prices at the end ofthe reporting period. The fair value of other non-derivative financial assets and liabilities that are nottraded in an active market are estimated using discounted cash flow analyses based on prevailingmarket rates. The fair value of the cumulative preferred financing shares is measured as the presentvalue of expected future cash flows. Such cash flows include the dividend payments and the paymentsof the nominal value plus paid in capital. Expected future cash flows are discounted by using the yieldcurves derived from quoted interest rates and Credit Default Swap rates that match the maturity of thecontracts. The conditions for redemption and conversion of the cumulative preferred financing sharesare disclosed in Note 22 of Ahold’s Annual Report 2015. The accrued interest is included in othercurrent financial liabilities and not in the carrying amounts of non-derivative financial assets andliabilities.
11. Commitments and contingencies A comprehensive overview of commitments and contingencies as of January 1, 2017, is included inNote 34 of Ahold Delhaize’s 2016 consolidated financial statements, which are published as part ofAhold Delhaize's Annual Report 2016 on March 1, 2017.
12. Subsequent eventsThere have been no significant subsequent events.
Summary report, Fourth quarter and Full year 2016
Summary financial statements
Page 28/37
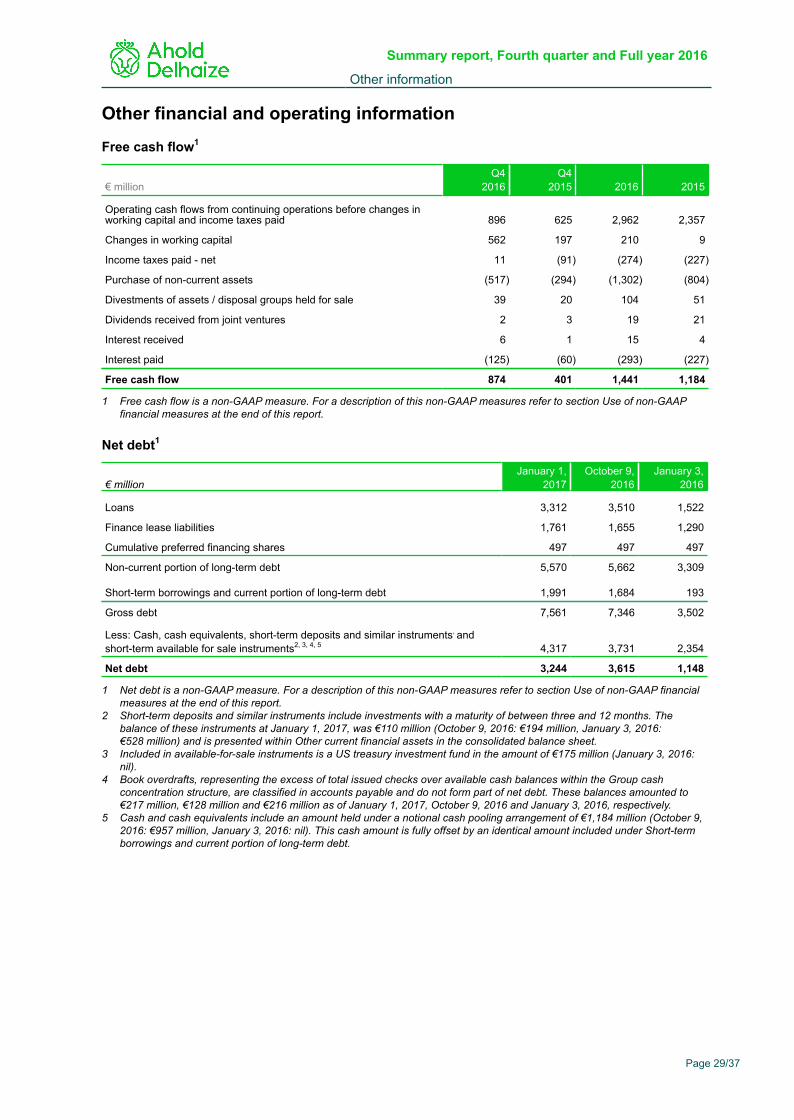
Other financial and operating information
Free cash flow1
€ millionQ4
2016Q4
2015 2016 2015
Operating cash flows from continuing operations before changes inworking capital and income taxes paid 896 625 2,962 2,357
Changes in working capital 562 197 210 9
Income taxes paid - net 11 (91) (274) (227)
Purchase of non-current assets (517) (294) (1,302) (804)
Divestments of assets / disposal groups held for sale 39 20 104 51
Dividends received from joint ventures 2 3 19 21
Interest received 6 1 15 4
Interest paid (125) (60) (293) (227)
Free cash flow 874 401 1,441 1,184
1 Free cash flow is a non-GAAP measure. For a description of this non-GAAP measures refer to section Use of non-GAAPfinancial measures at the end of this report.
Net debt1
€ millionJanuary 1,
2017October 9,
2016January 3,
2016
Loans 3,312 3,510 1,522
Finance lease liabilities 1,761 1,655 1,290
Cumulative preferred financing shares 497 497 497
Non-current portion of long-term debt 5,570 5,662 3,309
Short-term borrowings and current portion of long-term debt 1,991 1,684 193
Gross debt 7,561 7,346 3,502
Less: Cash, cash equivalents, short-term deposits and similar instruments, andshort-term available for sale instruments2, 3, 4, 5 4,317 3,731 2,354
Net debt 3,244 3,615 1,148
1 Net debt is a non-GAAP measure. For a description of this non-GAAP measures refer to section Use of non-GAAP financialmeasures at the end of this report.
2 Short-term deposits and similar instruments include investments with a maturity of between three and 12 months. Thebalance of these instruments at January 1, 2017, was €110 million (October 9, 2016: €194 million, January 3, 2016:€528 million) and is presented within Other current financial assets in the consolidated balance sheet.
3 Included in available-for-sale instruments is a US treasury investment fund in the amount of €175 million (January 3, 2016:nil).
4 Book overdrafts, representing the excess of total issued checks over available cash balances within the Group cashconcentration structure, are classified in accounts payable and do not form part of net debt. These balances amounted to€217 million, €128 million and €216 million as of January 1, 2017, October 9, 2016 and January 3, 2016, respectively.
5 Cash and cash equivalents include an amount held under a notional cash pooling arrangement of €1,184 million (October 9,2016: €957 million, January 3, 2016: nil). This cash amount is fully offset by an identical amount included under Short-termborrowings and current portion of long-term debt.
Summary report, Fourth quarter and Full year 2016
Other information
Page 29/37
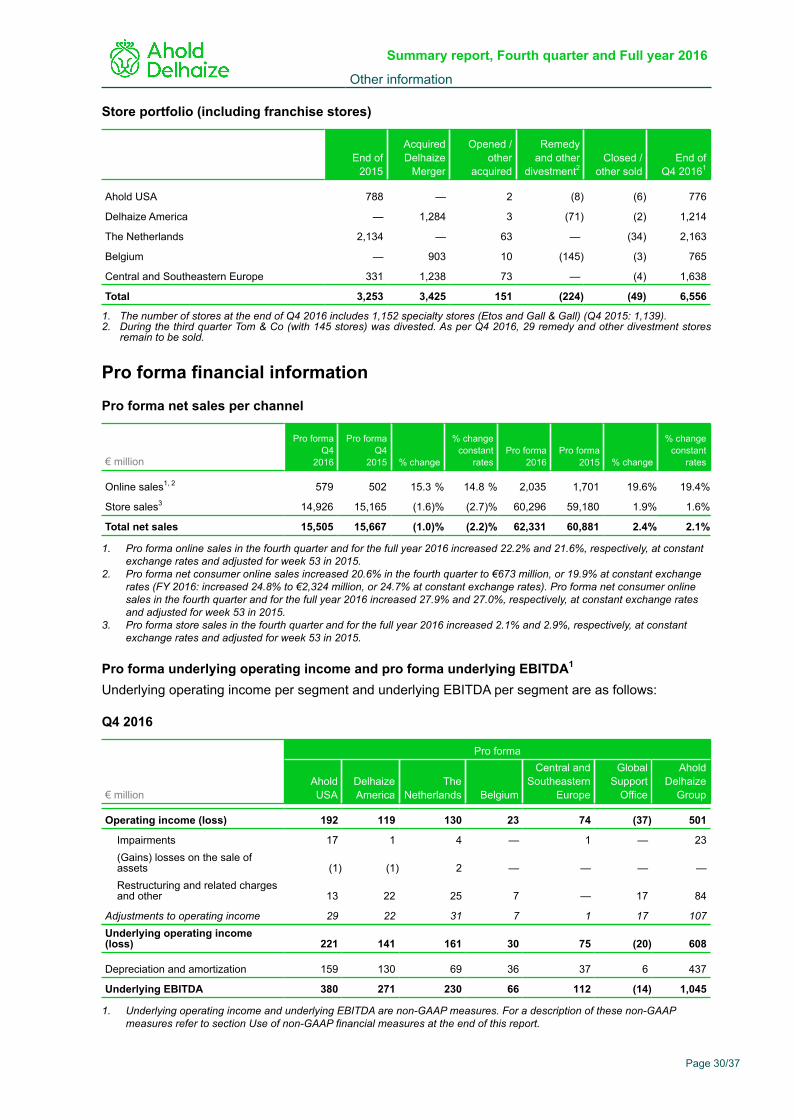
Store portfolio (including franchise stores)
End of2015
AcquiredDelhaize
Merger
Opened /other
acquired
Remedyand other
divestment2Closed /
other soldEnd of
Q4 20161
Ahold USA 788 — 2 (8) (6) 776
Delhaize America — 1,284 3 (71) (2) 1,214
The Netherlands 2,134 — 63 — (34) 2,163
Belgium — 903 10 (145) (3) 765
Central and Southeastern Europe 331 1,238 73 — (4) 1,638
Total 3,253 3,425 151 (224) (49) 6,556
1. The number of stores at the end of Q4 2016 includes 1,152 specialty stores (Etos and Gall & Gall) (Q4 2015: 1,139). 2. During the third quarter Tom & Co (with 145 stores) was divested. As per Q4 2016, 29 remedy and other divestment stores
remain to be sold.
Pro forma financial information
Pro forma net sales per channel
€ million
Pro formaQ4
2016
Pro formaQ4
2015 % change
% changeconstant
ratesPro forma
2016Pro forma
2015 % change
% changeconstant
rates
Online sales1, 2 579 502 15.3 % 14.8 % 2,035 1,701 19.6% 19.4%
Store sales3 14,926 15,165 (1.6)% (2.7)% 60,296 59,180 1.9% 1.6%
Total net sales 15,505 15,667 (1.0)% (2.2)% 62,331 60,881 2.4% 2.1%
1. Pro forma online sales in the fourth quarter and for the full year 2016 increased 22.2% and 21.6%, respectively, at constantexchange rates and adjusted for week 53 in 2015.
2. Pro forma net consumer online sales increased 20.6% in the fourth quarter to €673 million, or 19.9% at constant exchangerates (FY 2016: increased 24.8% to €2,324 million, or 24.7% at constant exchange rates). Pro forma net consumer onlinesales in the fourth quarter and for the full year 2016 increased 27.9% and 27.0%, respectively, at constant exchange ratesand adjusted for week 53 in 2015.
3. Pro forma store sales in the fourth quarter and for the full year 2016 increased 2.1% and 2.9%, respectively, at constantexchange rates and adjusted for week 53 in 2015.
Pro forma underlying operating income and pro forma underlying EBITDA1
Underlying operating income per segment and underlying EBITDA per segment are as follows:
Q4 2016
€ million
Pro forma
AholdUSA
DelhaizeAmerica
TheNetherlands Belgium
Central andSoutheastern
Europe
GlobalSupport
Office
AholdDelhaize
Group
Operating income (loss) 192 119 130 23 74 (37) 501
Impairments 17 1 4 — 1 — 23(Gains) losses on the sale ofassets (1) (1) 2 — — — —Restructuring and related chargesand other 13 22 25 7 — 17 84
Adjustments to operating income 29 22 31 7 1 17 107Underlying operating income(loss) 221 141 161 30 75 (20) 608
Depreciation and amortization 159 130 69 36 37 6 437
Underlying EBITDA 380 271 230 66 112 (14) 1,045
1. Underlying operating income and underlying EBITDA are non-GAAP measures. For a description of these non-GAAPmeasures refer to section Use of non-GAAP financial measures at the end of this report.
Summary report, Fourth quarter and Full year 2016
Other information
Page 30/37
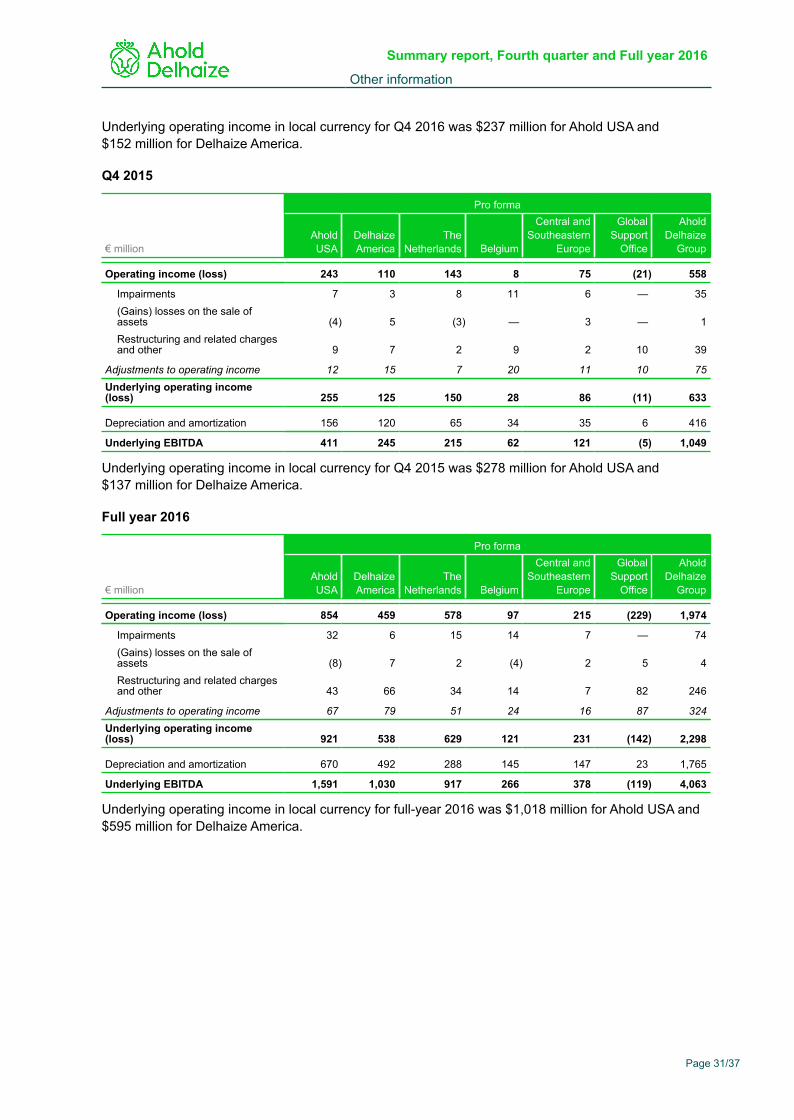
Underlying operating income in local currency for Q4 2016 was $237 million for Ahold USA and$152 million for Delhaize America.
Q4 2015
€ million
Pro forma
AholdUSA
DelhaizeAmerica
TheNetherlands Belgium
Central andSoutheastern
Europe
GlobalSupport
Office
AholdDelhaize
Group
Operating income (loss) 243 110 143 8 75 (21) 558
Impairments 7 3 8 11 6 — 35(Gains) losses on the sale ofassets (4) 5 (3) — 3 — 1Restructuring and related chargesand other 9 7 2 9 2 10 39
Adjustments to operating income 12 15 7 20 11 10 75Underlying operating income(loss) 255 125 150 28 86 (11) 633
Depreciation and amortization 156 120 65 34 35 6 416
Underlying EBITDA 411 245 215 62 121 (5) 1,049
Underlying operating income in local currency for Q4 2015 was $278 million for Ahold USA and$137 million for Delhaize America.
Full year 2016
€ million
Pro forma
AholdUSA
DelhaizeAmerica
TheNetherlands Belgium
Central andSoutheastern
Europe
GlobalSupport
Office
AholdDelhaize
Group
Operating income (loss) 854 459 578 97 215 (229) 1,974
Impairments 32 6 15 14 7 — 74(Gains) losses on the sale ofassets (8) 7 2 (4) 2 5 4Restructuring and related chargesand other 43 66 34 14 7 82 246
Adjustments to operating income 67 79 51 24 16 87 324Underlying operating income(loss) 921 538 629 121 231 (142) 2,298
Depreciation and amortization 670 492 288 145 147 23 1,765
Underlying EBITDA 1,591 1,030 917 266 378 (119) 4,063
Underlying operating income in local currency for full-year 2016 was $1,018 million for Ahold USA and$595 million for Delhaize America.
Summary report, Fourth quarter and Full year 2016
Other information
Page 31/37
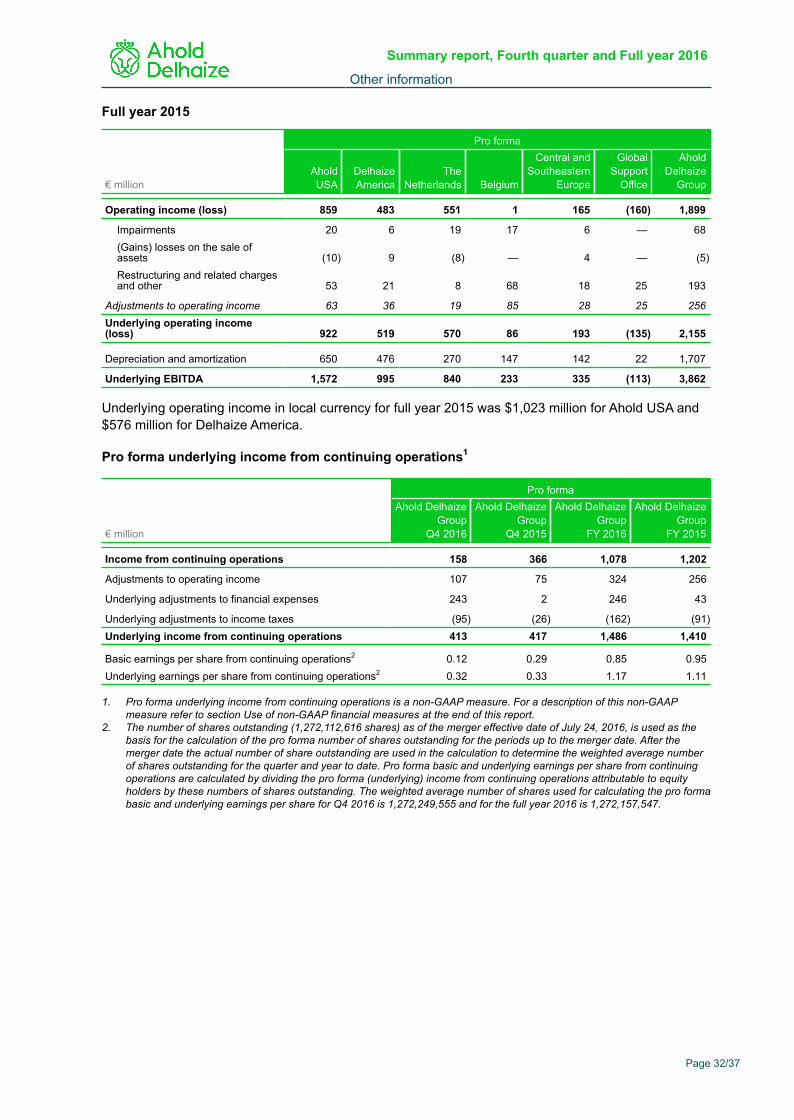
Full year 2015
€ million
Pro forma
AholdUSA
DelhaizeAmerica
TheNetherlands Belgium
Central andSoutheastern
Europe
GlobalSupport
Office
AholdDelhaize
Group
Operating income (loss) 859 483 551 1 165 (160) 1,899
Impairments 20 6 19 17 6 — 68(Gains) losses on the sale ofassets (10) 9 (8) — 4 — (5)Restructuring and related chargesand other 53 21 8 68 18 25 193
Adjustments to operating income 63 36 19 85 28 25 256Underlying operating income(loss) 922 519 570 86 193 (135) 2,155
Depreciation and amortization 650 476 270 147 142 22 1,707
Underlying EBITDA 1,572 995 840 233 335 (113) 3,862
Underlying operating income in local currency for full year 2015 was $1,023 million for Ahold USA and$576 million for Delhaize America.
Pro forma underlying income from continuing operations1
€ million
Pro formaAhold Delhaize
GroupQ4 2016
Ahold DelhaizeGroup
Q4 2015
Ahold DelhaizeGroup
FY 2016
Ahold DelhaizeGroup
FY 2015
Income from continuing operations 158 366 1,078 1,202
Adjustments to operating income 107 75 324 256
Underlying adjustments to financial expenses 243 2 246 43
Underlying adjustments to income taxes (95) (26) (162) (91)Underlying income from continuing operations 413 417 1,486 1,410
Basic earnings per share from continuing operations2 0.12 0.29 0.85 0.95Underlying earnings per share from continuing operations2 0.32 0.33 1.17 1.11
1. Pro forma underlying income from continuing operations is a non-GAAP measure. For a description of this non-GAAPmeasure refer to section Use of non-GAAP financial measures at the end of this report.
2. The number of shares outstanding (1,272,112,616 shares) as of the merger effective date of July 24, 2016, is used as thebasis for the calculation of the pro forma number of shares outstanding for the periods up to the merger date. After themerger date the actual number of share outstanding are used in the calculation to determine the weighted average numberof shares outstanding for the quarter and year to date. Pro forma basic and underlying earnings per share from continuingoperations are calculated by dividing the pro forma (underlying) income from continuing operations attributable to equityholders by these numbers of shares outstanding. The weighted average number of shares used for calculating the pro formabasic and underlying earnings per share for Q4 2016 is 1,272,249,555 and for the full year 2016 is 1,272,157,547.
Summary report, Fourth quarter and Full year 2016
Other information
Page 32/37
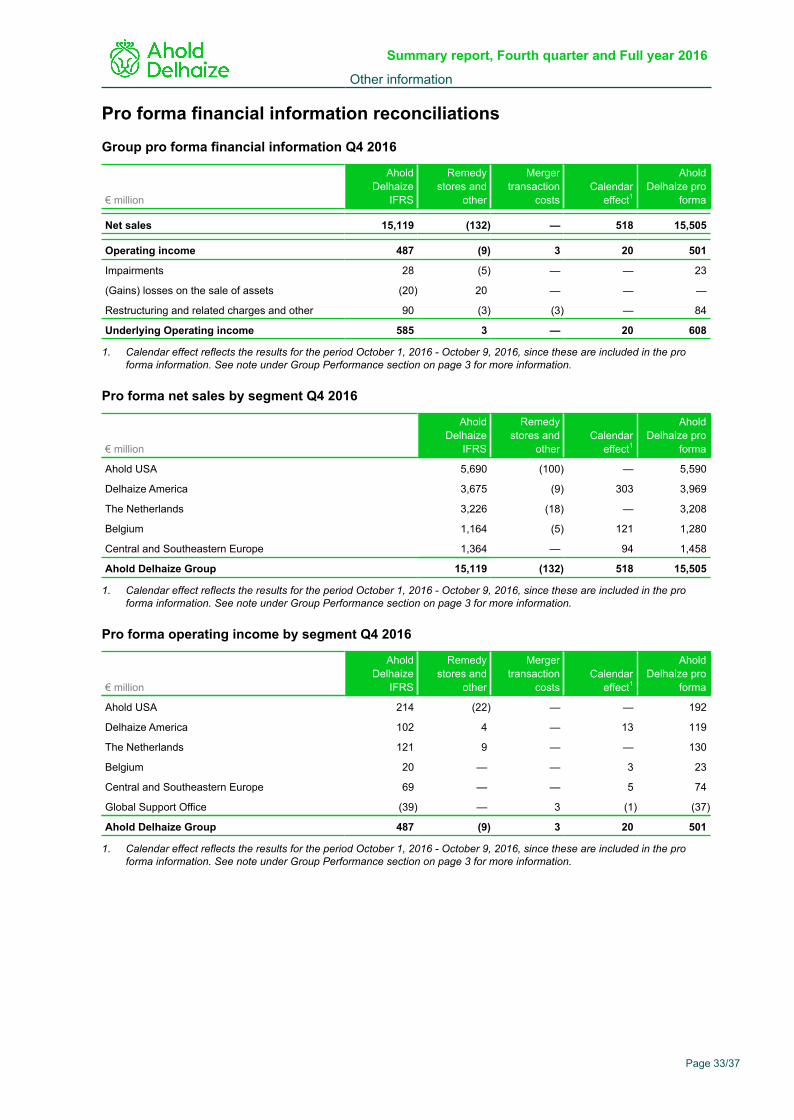
Pro forma financial information reconciliations
Group pro forma financial information Q4 2016
€ million
AholdDelhaize
IFRS
Remedystores and
other
Mergertransaction
costsCalendar
effect1
AholdDelhaize pro
forma
Net sales 15,119 (132) — 518 15,505
Operating income 487 (9) 3 20 501
Impairments 28 (5) — — 23
(Gains) losses on the sale of assets (20) 20 — — —
Restructuring and related charges and other 90 (3) (3) — 84
Underlying Operating income 585 3 — 20 608
1. Calendar effect reflects the results for the period October 1, 2016 - October 9, 2016, since these are included in the proforma information. See note under Group Performance section on page 3 for more information.
Pro forma net sales by segment Q4 2016
€ million
AholdDelhaize
IFRS
Remedystores and
otherCalendar
effect1
AholdDelhaize pro
forma
Ahold USA 5,690 (100) — 5,590
Delhaize America 3,675 (9) 303 3,969
The Netherlands 3,226 (18) — 3,208
Belgium 1,164 (5) 121 1,280
Central and Southeastern Europe 1,364 — 94 1,458
Ahold Delhaize Group 15,119 (132) 518 15,505
1. Calendar effect reflects the results for the period October 1, 2016 - October 9, 2016, since these are included in the proforma information. See note under Group Performance section on page 3 for more information.
Pro forma operating income by segment Q4 2016
€ million
AholdDelhaize
IFRS
Remedystores and
other
Mergertransaction
costsCalendar
effect1
AholdDelhaize pro
forma
Ahold USA 214 (22) — — 192
Delhaize America 102 4 — 13 119
The Netherlands 121 9 — — 130
Belgium 20 — — 3 23
Central and Southeastern Europe 69 — — 5 74
Global Support Office (39) — 3 (1) (37)
Ahold Delhaize Group 487 (9) 3 20 501
1. Calendar effect reflects the results for the period October 1, 2016 - October 9, 2016, since these are included in the proforma information. See note under Group Performance section on page 3 for more information.
Summary report, Fourth quarter and Full year 2016
Other information
Page 33/37
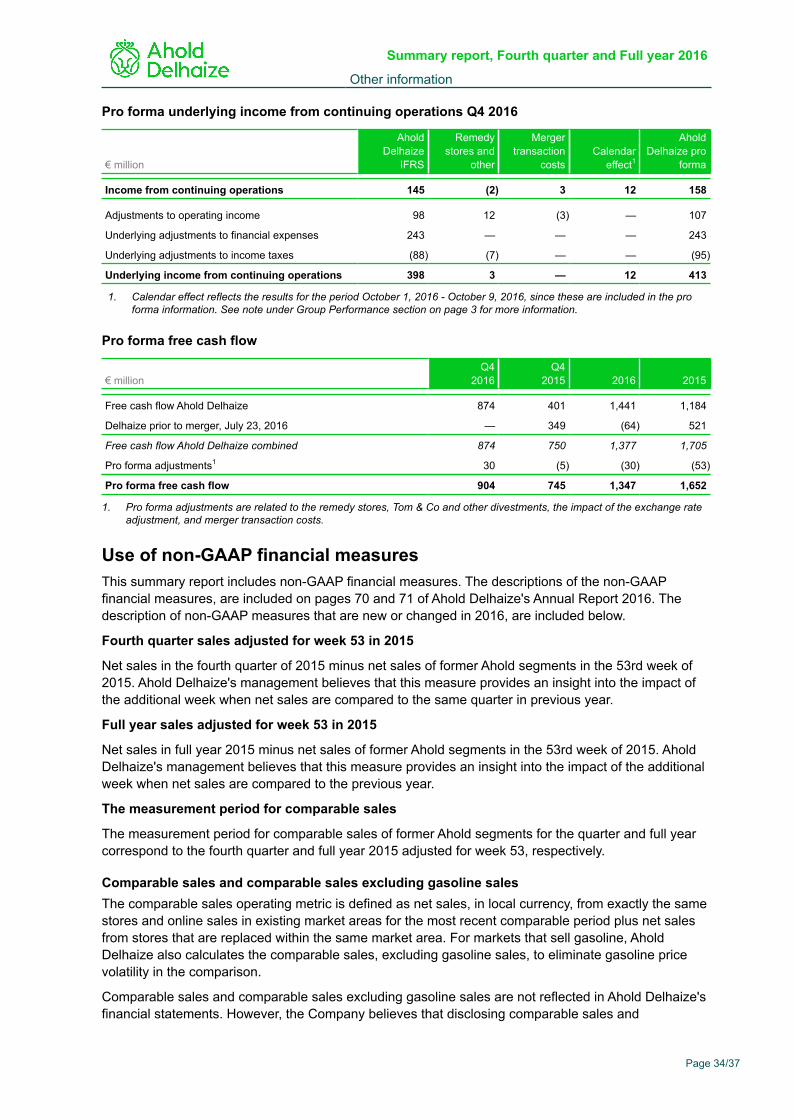
Pro forma underlying income from continuing operations Q4 2016
€ million
AholdDelhaize
IFRS
Remedystores and
other
Mergertransaction
costsCalendar
effect1
AholdDelhaize pro
forma
Income from continuing operations 145 (2) 3 12 158
Adjustments to operating income 98 12 (3) — 107
Underlying adjustments to financial expenses 243 — — — 243
Underlying adjustments to income taxes (88) (7) — — (95)
Underlying income from continuing operations 398 3 — 12 413
1. Calendar effect reflects the results for the period October 1, 2016 - October 9, 2016, since these are included in the proforma information. See note under Group Performance section on page 3 for more information.
Pro forma free cash flow
€ millionQ4
2016Q4
2015 2016 2015
Free cash flow Ahold Delhaize 874 401 1,441 1,184
Delhaize prior to merger, July 23, 2016 — 349 (64) 521
Free cash flow Ahold Delhaize combined 874 750 1,377 1,705
Pro forma adjustments1 30 (5) (30) (53)
Pro forma free cash flow 904 745 1,347 1,652
1. Pro forma adjustments are related to the remedy stores, Tom & Co and other divestments, the impact of the exchange rateadjustment, and merger transaction costs.
Use of non-GAAP financial measuresThis summary report includes non-GAAP financial measures. The descriptions of the non-GAAPfinancial measures, are included on pages 70 and 71 of Ahold Delhaize's Annual Report 2016. Thedescription of non-GAAP measures that are new or changed in 2016, are included below.
Fourth quarter sales adjusted for week 53 in 2015
Net sales in the fourth quarter of 2015 minus net sales of former Ahold segments in the 53rd week of2015. Ahold Delhaize's management believes that this measure provides an insight into the impact ofthe additional week when net sales are compared to the same quarter in previous year.
Full year sales adjusted for week 53 in 2015
Net sales in full year 2015 minus net sales of former Ahold segments in the 53rd week of 2015. AholdDelhaize's management believes that this measure provides an insight into the impact of the additionalweek when net sales are compared to the previous year.
The measurement period for comparable sales
The measurement period for comparable sales of former Ahold segments for the quarter and full yearcorrespond to the fourth quarter and full year 2015 adjusted for week 53, respectively.
Comparable sales and comparable sales excluding gasoline salesThe comparable sales operating metric is defined as net sales, in local currency, from exactly the samestores and online sales in existing market areas for the most recent comparable period plus net salesfrom stores that are replaced within the same market area. For markets that sell gasoline, AholdDelhaize also calculates the comparable sales, excluding gasoline sales, to eliminate gasoline pricevolatility in the comparison.
Comparable sales and comparable sales excluding gasoline sales are not reflected in Ahold Delhaize'sfinancial statements. However, the Company believes that disclosing comparable sales and
Summary report, Fourth quarter and Full year 2016
Other information
Page 34/37
comparable sales excluding gasoline sales provides additional useful analytical information to investorsregarding the operating performance of Ahold Delhaize as it neutralizes the impact of, for example,newly acquired stores in the calculation of sales growth.
Earnings before interest, taxes, deprecation and amortization, or EBITDAAhold Delhaize defines EBITDA as operating income / (loss) plus depreciation and amortization.EBITDA is considered to be a useful measure for investors to analyze profitability by eliminating theeffects of financing (i.e., net financial expense), capital investments and the impact of the purchaseprice allocation (i.e., depreciation and amortization).
Underlying earnings before interest, taxes, depreciation and amortization, or underlying EBITDAAhold Delhaize defines underlying EBITDA as underlying operating income plus depreciation andamortization. Underlying EBITDA is considered to be a useful measure for investors to analyzeprofitability by eliminating the effects of financing (i.e., net financial expense), capital investments andthe impact of the purchase price allocation (i.e., depreciation and amortization).
Underlying income from continuing operations Ahold Delhaize defines underlying income from continuing operations as income from continuingoperations adjusted for (i) impairments of non-current assets, gains and losses on the sale of assets,restructuring and related charges, and other specific items considered to not be directly related to theunderlying operating performance, (ii) material non-recurring finance costs and income tax expense,and (iii) the potential effect of income tax on all these items.
Underlying earnings per share from continuing operationsUnderlying earnings per share from continuing operations is calculated as underlying income fromcontinuing operations, divided by the weighted average number of shares outstanding.
Free cash flowAhold Delhaize defines free cash flow as operating cash flows from continuing operations minus netcapital expenditures and net interest paid plus dividends received. Ahold Delhaize has included freecash flow as the Company believes it is a useful measure for investors, because it provides insight intothe cash flows available to, among other things, reduce debt and pay dividends. Free cash flow isderived from the financial statements; however, this is not a measure calculated in accordance withIFRS and may not be comparable to similar measures presented by other companies. Accordingly, freecash flow should not be considered as an alternative to operating cash flow.
Net Debt
Net debt is the difference between (i) the sum of loans, finance lease liabilities, cumulative preferredfinancing shares and short-term debt (i.e., gross debt) and (ii) cash, cash equivalents, current portion ofavailable-for-sale financial assets, and short-term deposits and similar instruments. In management’sview, because cash, cash equivalents, current portion of available-for-sale financial assets, and short-term deposits and similar instruments can be used, among other things, to repay indebtedness, nettingthis against gross debt is a useful measure for investors to judge Ahold Delhaize’s leverage. Net debtmay include certain cash items that are not readily available for repaying debt.
Global Support Office costs
Global Support Office costs relate to the responsibilities of the Global Support Office, including Finance,Strategy, Mergers & Acquisitions, Internal Audit, Legal & Compliance, Human Resources, InformationTechnology, Insurance, Tax, Treasury, Communications, Investor Relations, Corporate Responsibility,and the majority of the Executive Committee. Global Support Office costs also include results fromother activities coordinated centrally but not allocated to any subsidiary.
Summary report, Fourth quarter and Full year 2016
Other information
Page 35/37
Pro formaAhold Delhaize defines the pro forma information as the combined results of Ahold and Delhaize inaccordance with International Financial Reporting Standards ("IFRS") as issued by the InternationalAccounting Standards Board ("IASB") and as adopted by the European Union ("EU"). These combinedresults are adjusted for:
• Exclusion of the performance of remedy stores and other divestments• Exclusion of merger transaction costs• Inclusion of Purchase Price Allocation ("PPA") effects• Alignment of Global Support Office functions and related costs • Alignment of foreign exchange rates used in the translation of foreign group entities
For more information on the pro forma numbers, refer to page 2 of this press release and to the Proforma booklet as published on October 6, 2016.
Vesting of shares under the GRO planOn April 13, 2017, a maximum of 0.3 million shares granted in 2014 to members of the ManagementBoard under the Ahold GRO plan and 0.2 million performance shares granted in 2012 to members ofthe Management Board under the five-year component of the Ahold GRO plan are expected to vest. OnMay 26, 2017, a maximum of 0.2 million shares granted in 2014 to members of the Management Boardunder the Delhaize European long-term incentive plan are expected to vest. Except to finance taxesand social charges due on the vesting date, members of the Management Board cannot sell shares fora period of at least five years following the grant date, or until the date of resignation from theManagement Board, if this period is shorter.
On March 2, 2017, a maximum of 3.3 million shares granted in 2014 to Ahold Delhaize associatesunder the Ahold GRO plan, 2.7 million performance shares granted in 2012 to Ahold Delhaizeassociates under the five-year component of the Ahold GRO plan and 0.1 million matching sharesgranted in 2012 to Ahold Delhaize associates under the three-year component of the Ahold GRO planare expected to vest. Vesting is subject to the participant being employed by the Company on theapplicable vesting date. As of the vesting date, participants are allowed to sell all or part of the sharesvested, subject to insider trading restrictions as applicable from time to time.
In addition, a maximum number of 0.7 million shares granted in 2016 to Ahold Delhaize associatesunder the one-time retention plan are expected to vest in November 2017, provided the performanceconditions are met.
The Company will use treasury shares for delivery of the vested shares.
Financial calendar Ahold Delhaize's financial year consists of 52 or 53 weeks and ends on the Sunday nearest toDecember 31.
Ahold Delhaize's 2016 financial year consisted of 52 weeks and ended on January 1, 2017. AholdDelhaize's 2015 financial year consisted of 53 weeks and ended on January 3, 2016.
Ahold Delhaize's 2017 financial year consists of 52 weeks and ends on December 31, 2017. Thequarters in 2017 are:
First quarter January 2 through April 2, 2017Second quarter April 3 through July 2, 2017Third quarter July 3, through October 1, 2017Fourth quarter October 2 through December 31, 2017
Summary report, Fourth quarter and Full year 2016
Other information
Page 36/37
Cautionary noticeThis press release contains information that qualifies as inside information within the meaning of Article 7(1) of the EU MarketAbuse Regulation.
This communication includes forward-looking statements. All statements other than statements of historical facts may beforward-looking statements. Words such as progresses, proposed, on track, strategy, plan, leveraging, realizing, targets, focus,continue, growth, to be carried out, future, commitment to deliver, expect, incremental, will, save-to-invest programs and improveor other similar words or expressions are typically used to identify forward-looking statements.
Forward-looking statements are subject to risks, uncertainties and other factors that are difficult to predict and that may causeactual results of Koninklijke Ahold Delhaize N.V. (the “Company”) to differ materially from future results expressed or implied bysuch forward-looking statements. Such factors include, but are not limited to risks relating to competition and pressure on profitmargins in the food retail industry; the impact of the Company’s outstanding financial debt; future changes in accountingstandards; the Company’s ability to generate positive cash flows; general economic conditions; the Company’s internationaloperations; the impact of economic conditions on consumer spending; turbulences in the global credit markets and the economy;the significance of the Company’s U.S. operations and the concentration of its U.S. operations on the east coast of the U.S.;increases in interest rates and the impact of downgrades in the Company’s credit ratings; competitive labor markets, changes inlabor conditions and labor disruptions; environmental liabilities associated with the properties that the Company owns or leases;the Company’s inability to locate appropriate real estate or enter into real estate leases on commercially acceptable terms;exchange rate fluctuations; additional expenses or capital expenditures associated with compliance with federal, regional, stateand local laws and regulations in the U.S., the Netherlands, Belgium and other countries; product liability claims and adversepublicity; risks related to corporate responsibility and sustainable retailing; the Company’s inability to successfully implement itsstrategy, manage the growth of its business or realize the anticipated benefits of acquisitions; its inability to successfully completedivestitures and the effect of contingent liabilities arising from completed divestitures; unexpected outcomes with respect to taxaudits; disruption of operations and other factors negatively affecting the Company’s suppliers; the unsuccessful operation of theCompany’s franchised and affiliated stores; natural disasters and geopolitical events; inherent limitations in the Company’scontrol systems; the failure or breach of security of IT systems; changes in supplier terms; antitrust and similar legislation;unexpected outcome in the Company’s legal proceedings; adverse results arising from the Company’s claims against its self-insurance programs; increase in costs associated with the Company’s defined benefit pension plans; and other factors discussedin the Company’s public filings and other disclosures.
Forward-looking statements reflect the current views of the Company’s management and assumptions based on informationcurrently available to the Company’s management. Forward-looking statements speak only as of the date they are made, and theCompany does not assume any obligation to update such statements, except as required by law. Contact the legal departmentfor the latest version of the cautionary notice.
For more information:
Press office: +31 88 659 5134 Investor relations: +31 88 659 5213 Social media: Twitter: @AholdDelhaize
YouTube: @AholdDelhaize
LinkedIn: @AholdDelhaize
Ahold Delhaize is one of the world’s largest food retail groups and a leader in both supermarkets and e-commerce. Its family of
21 strong, local brands serves more than 50 million customers each week in 11 countries. Together, these brands employ more
than 370,000 associates in 6,500 grocery and specialty stores and include the top online retailer in the Benelux and the leading
online grocers in the Benelux and the United States. Ahold Delhaize brands are at the forefront of sustainable retailing, sourcing
responsibly, supporting local communities and helping customers make healthier choices. Headquartered in Zaandam, the
Netherlands, Ahold Delhaize shares are listed on Euronext Amsterdam and Brussels (ticker: AD) and its American Depositary
Receipts on the over-the-counter market in the U.S., quoted on the OTCQX International marketplace (ticker: ADRNY). For more
information, please visit www.aholddelhaize.com.
Summary report, Fourth quarter and Full year 2016
Other information
Page 37/37