Embed Size (px)
Citation preview

Quality, Innovation, Productivity and Prevention
QIPP national workstream: Back office efficiency and management optimisation November 2010

The QIPP Back Office Efficiency and Management Optimisation Workstream will commission and publish a full Equality Impact Assessment, based on a meaningful analysis of the information available from the Electronic Staff Record and any other relevant sources on the demographics of staff working in back office roles in the NHS (disaggregated by protected characteristics) by May 2011, and publish national and regional trends on an annual basis until the completion of the QIPP programme.
The Workstream will incorporate equality related questions into the benchmarking tools that are being made available to local organisations and use this assessment in implementing a shared service model.
The Workstream encourages local decision makers to refer to the Office of Government Commerce's guidance and toolkit on using public procurement to advance equality at http://www.ogc.gov.uk/policy_and_standards_framework_equality.asp Taking account of equality considerations into the procurement process will enable the public sector to deliver better quality public services that meet the needs of its diverse users and communities, thereby increasing the quality of the services and achieving value for money for the taxpayer.
While the Workstream will be undertaking a full Equality Impact Assessment, we would remind local health and social care organisations their statutory duty to assess the impact of proposed changes to policies, procedures or practices, utilising their local data and publish this assessment as early as possible
.
This report is aimed at chairs and chief executives of both commissioner and provider organisations in the NHS, and its objective is to provide them with a clear roadmap on how to respond to the fiscal challenges the NHS currently faces by driving through efficiencies in their back office functions.
The report is also aimed at senior managers within those organisations to provide them with clear advice and practical guidance on how to generate those efficiencies within their back office and also move towards shared services.
The audience for this report
QIPP national workstream: Back office efficiency and management optimisation
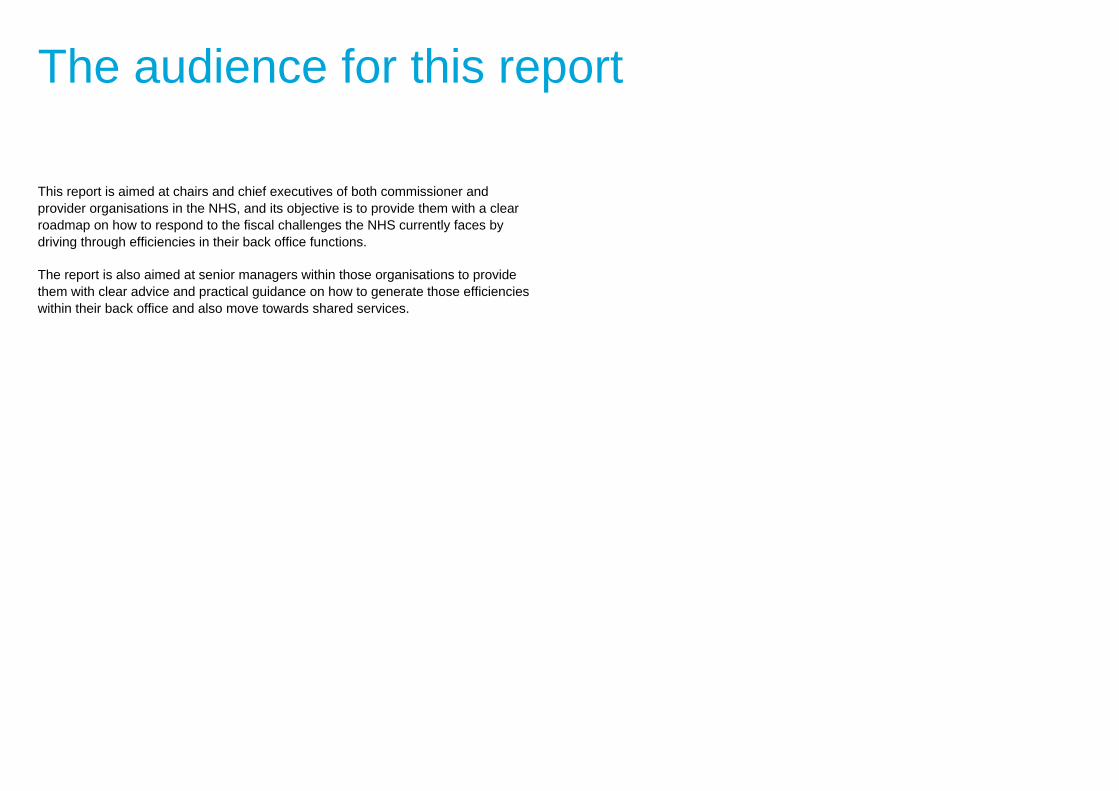
I am delighted to introduce this report which is the first in a series offering important contributions on how the NHS can achieve substantial efficiency savings and so ensure more resources are directed to frontline services. Whilst commissioned by the Department of Health, the work has been led under the auspices of the Foundation Trust Network. I welcome this approach. It represents the service’s own view of the need for transformation of back office functions and how this is most appropriately delivered.
The report sets out how over £600m can be released to reinvest in frontline care. For provider organisations the report proposes that trusts should simplify, standardise and share their back office functions. The evidence base for a shared service is overwhelming. It is critical that the NHS uses its scale to leverage greater efficiency. Closer collaboration of provider organisations allied to a granular examination of how to take cost out and reduce low-value-adding transactions will be essential. All boards should understand the savings potential from benchmarking their service. As the report author emphasises, the headline savings are a conservative estimate and further opportunities exist through the transformation of middle and front office functions. As GP consortia are established they will need to consider how to come together to provide shared back office services effectively. I am sure all boards will now act quickly to drive forward the recommendations detailed in this report. Jim Easton, National Director for Improvement and Efficiency, Department of Health
Foreword
For many organisations there is clearly significant potential to release resource by driving greater efficiency from their back office functions and so invest further in frontline services. Throughout this review I have been keen to ensure that this guidance offers practical help and support to assist Chief Executives and their boards in delivering the necessary transformation.
Significant contribution has been made by trust colleagues who lead many of these functions. We have also sought advice and input from a wide variety of stakeholders,
including the commercial sector, and have used their skills and experience to help shape our proposals. There is a compelling evidence base for adopting a shared service approach.
What is also clear from the detailed work undertaken is that the real gains of improved quality and cost effectiveness can only be realised by a relentless focus on getting the detail right. This will require dedicated project management time, together with the engagement of your board and, crucially, that of the staff who provide these services.
The importance of involving existing back office teams to drive the transformation is key. Clearly, there will be uncertainty for many who work in these services, and Chief Executives and their boards will want to move quickly to consider and agree the direction of travel for their service.
We have principally confined our work to back office services. For the NHS significant opportunities remain in transforming middle (support services to clinicians) and front office (entry points to hospitals and their administration) functions.
Even greater gains can be made from the transformation of GP back office services. We recommend that the Department of Health lead work to review the potential savings in this area.
Finally I would like to thank the Foundation Trust Network for their help and support, without which this publication would not have been possible.
Tony Spotswood Chief Executive Royal Bournemouth and Christchurch Hospitals Chair of the Review Group
Preface

QIPP national workstream: Back office efficiency and management optimisation
1. Executive summary 8
2. Recommendations 11
3. Introduction 12
4. The evidence for change 14
5. What our data shows 19
6. Simplify, standardise and share 32
7. Creating an efficient back office 34
8. Shared service models 41
9. How to approach implementation of shared services 50
10. Creating sustainable change 57
11. Risk sharing agreements 58
12. Management costs 61
13. Making it happen from the centre 63
14. Future opportunities 67
15. What to do next 69
16. Contributors to this report 72
Contents

8
QIPP national workstream: Back office efficiency and management optimisation
The review of NHS back office efficiency and management optimisation identifies how a minimum of £600m can be saved across England and redirected to support frontline services. This report provides every organisation with a means of evaluating the relative efficiency of their back office functions and outlines the steps necessary to re-engineer and transform back office services to realise the savings potential. The White Paper, Equity and excellence: Liberating the NHS, sets out the Government’s overarching proposals for the NHS. Further details about these proposals will be provided in due course. Some of the changes the Government proposes are subject to Parliamentary Approval, but what is without doubt is that the cost of back office functions will need to be reduced.
Section 2 sets out a series of recommendations. For commissioning organisations (PCTs and GP commissioners (from April 2013)) it is proposed that back office services are configured at scale on a national or regional/multi-regional basis. We propose that all management cost savings achieved by primary care trusts (PCTs) and strategic health authorities (SHAs) are consolidated into the management allowances set for GP commissioners, with cash-limited allocations reflecting the importance of as much resource as possible being directed to frontline patient care. Provider organisations should move rapidly towards adopting a shared service approach for the future provision of back office services. Typically we propose that boards work to identify consortia partners by April 2011, recognising that in many instances trusts will be able to achieve this well in advance of the timescale we outline. Within our report we identify various models of shared service provision and evaluate the relevance and applicability of each model. We also outline how savings can be achieved at a granular level. It is for each provider organisation to determine which approach bests suits their needs. All organisations will be aware that the setting of a future tariff will reflect assumed efficiencies in this and other QIPP areas. Boards will need to act promptly to ensure that they can realise the efficiencies that will be assumed within the tariff-setting process for 2011/12.
Section 3 confirms the back office areas we have reviewed, namely: Finance, Human Resources, Information Management and Technology, Estate Management, Payroll, Governance and Risk and Procurement. The recommendations and advice contained within this report are centred on three principal objectives. Firstly, the importance of reducing unnecessary spend on back office functions; secondly and critically, the need to maintain capacity and capability to deliver high quality services at a time of rapid and unprecedented change. Thirdly, practical action boards can take to drive efficiency savings, capitalising on the learning drawn from both within health and the commercial sector.
Section 4 presents the evidence for change. The key challenges that have historically impaired the delivery of effective and efficient back office functions are well understood; namely the fragmented nature of the NHS, with almost all organisations developing their own back office operations, an absence of robust and consistent management information to evaluate and compare spend, and limited review mechanisms to examine the operational effectiveness of back office functions. The lack of uniformity of approach has often hindered efficient provision of back office functions and our proposals outline how each of these challenges can be addressed effectively. Various independent reviews have suggested that savings in the order of 20%–30% can be achieved through the rationalisation of back office functions. The commercial sector has led the way in this area, creating leaner back office functions through three key steps: simplification of processes, re-engineering of back office processes to a common standard and the adoption of a shared service approach. The report outlines how this can be achieved.
Section 5 provides detailed benchmarking, which reveals that the total spend on back office functions across the NHS in England is £2.8bn. The majority of NHS organisations have now participated in this benchmarking exercise, which allows each organisation to compare their spend on each back office function with other similar organisations and industry best practice. Our analysis reveals that if those organisations which spend proportionately more on back office functions were to reduce their spend to the average as expressed as a percentage of turnover, the NHS would save a minimum of £616m. However, the steps we outline within this
1. Executive summary
QIPP national workstream: Back office efficiency and management optimisation 9
document demonstrate that further savings can be achieved. In particular the adoption of shared services and the re-engineering of back office functions will enable the sector to drive down the total spend and therefore the average spend on back office functions over a period of three to five years. It is reasonable to assume that the savings to be realised are closer to £1bn. PCTs as a sector demonstrate the greatest potential for saving, with back office costs representing approximately 9% of their total spend. This compares with back office costs representing on average 3% of the provider sector spend. In the provider sector mental health trusts show the highest proportional spend, with 4.6% of their resources directed towards back office functions. Within back office functions the spend on HR services as a proportion of turnover is higher than for any other back office function. In general the average cost of a whole time equivalent is between £40–50k, and salary costs are highest for PCTs.
Section 6 describes, against a backcloth of potential savings, how organisations can set about re-engineering their back office functions and realising the savings potential. Organisations will not reduce costs solely through moving into a shared service or outsourcing consortium. It is important that all organisations seek to simplify, standardise and combine back office functions, using a structured approach to transforming their efficiency.
Section 7 describes in detail the different approaches organisations should consider to developing high quality back office functions. These approaches include deploying activity-based costing, eliminating low-value-added transactions, applying lean methodologies, exploiting technology, leveraging cost reduction through scale, improving efficiency through matching resource to process and the wider aggregation of services. A number of examples are highlighted which show how organisations have used these techniques to deliver greater efficiency.
Section 8 describes a series of options for the provision of shared services and evaluates their relevance and applicability. The approaches reviewed include in-house solutions, the development of shared service co-operatives, the creation of a shared service company, the development of joint ventures and partnership
arrangements and outsourcing. Examples are cited providing details of how health, other public sector and commercial organisations have sought to take advantage of these approaches.
Section 9 describes how to approach implementation of shared services using detailed methodology. The purpose of this section is to explain how to achieve the necessary changes. This work focuses on the development of business cases, redesign of back office services, selection of a partner or consortium, establishment of commercial contracts and the formal operation of new services.
Section 10 describes the work necessary in order to achieve sustainable change in the delivery of back office functions.
Section 11 outlines work undertaken within the foundation trust network and the Shared Service Development Network to develop various models of risk sharing agreements. This supports the need for all organisations that develop in-house shared service consortia to maintain ‘skin in the game’ and thus avoid some of the destabilising actions that have characterised some joint ventures.
Section 12 sets out recommendations relating to management costs for PCTs, GP consortia and provider organisations. It is critical that the savings now being realised in SHAs and PCTs are sustained in the transition to the establishment of GP consortia. Specific cash limits are proposed for GP consortia and for regulators. Provider organisations, which arguably face the greatest challenges in re-engineering and reshaping clinical services, should be transparent in communicating their spend on back office and management costs. No specific parameters are proposed for provider organisation management costs.
Section 13 details a range of work for the centre to lead in helping to reduce the burden of bureaucracy and promote easier access to commercial sector expertise to support the future delivery of back office functions. Clearly if we are to secure important benefits and cost efficiencies from the transformation of back office functions, so we must adapt the wider systems and architecture of the NHS to help
10
QIPP national workstream: Back office efficiency and management optimisation
facilitate these changes. The Foundation Trust Network has reviewed specific measures that will assist in reducing low-value-added work. For example, it is important to reduce the resource both commissioners and provider organisations commit to sanctioning payment for activity undertaken. There is a need to continue to review the relevance of future targets including, for example, the appropriateness and cost benefits associated with screening all relevant admissions for MRSA. More work needs to be done to involve provider and commissioner organisations directly in agreeing with Monitor and the Care Quality Commission the information requirement of regulators and how these are best serviced.
The Department of Health (DH) is undertaking work to develop commercial frameworks to facilitate organisations being able to access commercial providers of back office functions in a structured and timelier fashion. This will be done through the creation of public/private sector delivery mechanisms, for example commercial frameworks, and through encouraging the private sector to develop its services to meet NHS demand for the provision of back office services.
In Section 14 we set out further opportunities for greater efficiency. In particular we highlight the potential to further transform middle and front of office functions, including the transformation of patient booking systems. In particular there are substantial efficiency gains to be achieved through transforming GP back office functions, such as the potential to move towards regional and national GP appointment centres.
Finally, Section 15 sets out the immediate actions boards should take in order for organisations to initiate work to re-engineer their back office functions. Within the next four months we recommend that organisations should move to establish a programme team to oversee a range of work, including reviewing the current state of its back office functions, developing options for change and preparing a business case for board consideration, and developing a more detailed road map which sets out actions towards implementation of a re-engineered back office function, predicated on the development of shared provision.
Supporting documents
In addition to this report there are a series of supporting documents that should help organisations make efficiencies from their back office functions. These include:
• Benchmarking templates and analysis provided by the Foundation Trust Network (FTN);
• A compendium of NHS shared service providers;
• A series of case studies which look at how a number of different organisations have approached shared services;
• A description of activities that could be considered when eliminating waste and low value transactions;
• A detailed evaluation of back office models;
• A set of risk sharing agreements provided by organisations which are part of the Shared Services Development Network (SSDN); and
• A series of proposals for reducing the burden of bureaucracy within the NHS.
We ask Chief Executives to share this report with their board and for all organisations to review and compare their current spend on back office functions as a means of generating improved and more efficient services to support provision of frontline care.
QIPP national workstream: Back office efficiency and management optimisation 11
2.1. Recommendations for providers
• All organisations should move towards adopting a shared service model.
• All organisations which have not benchmarked themselves using this approach should do so and identify fully the benefits available to them. Details of those organisations yet to participate and the necessary spreadsheets and completion details are available at www.nhsconfed.org/QIPPbackoffice.
• All organisations should establish regular benchmarking to monitor their progress and comparative performance. With the agreement of the DH, provision is being made for this service to be provided by the Foundation Trust Network for all provider organisations.
• Chairs and CEOs should ensure benchmarking and benefits data is brought to the attention of boards as part of a wider review of back office provision.
• All boards, including those whose costs are at or below the average, should develop plans to re-engineer their back office functions and explore the benefits of shared service collaboration. Organisations should typically seek to establish consortia partners by 1 April 2011.
• All organisations should develop an appropriately structured programme to drive key phases of the timetable and deliver the benefits; details of how to do so are included in this publication. Boards are responsible for ensuring that identified savings are realised. Boards should evidence progress in their annual report from 2011.
• We would encourage organisations to publish KPIs on the performance and efficiency of their back office on an annual basis using the indicators set out in Appendix A.
• All foundation trusts should publish management costs within annual reports for transparency and their boards should review these costs annually.
• All providers should review their front and middle office functions to identify the scope for greater efficiencies.
2.2. Recommendations for commissioners
• The DH completes a further round of benchmarking with PCTs to identify the total spend on core non-clinical functions and uses this as a basis for determining national or regional/multi-regional sourced solutions for the future provision of these services.
• Building on the previous recommendation, work is undertaken to ensure that the national or regional/multi-regional infrastructure should be designed to enable a seamless transfer to GP commissioning.
• All savings achieved through PCT management cost reduction should be reflected in GP consortia cash-limited allocations.
• GPs to review the possibility of moving to call centres for appointment-based bookings
• Cash limits to be implemented for GP consortia which are subject to audit.
2.3. Recommendations for the centre
• The DH should support organisations that have the greatest potential for generating efficiencies savings with a half-day workshop to develop a roadmap for driving out potential savings.
• The DH needs to undertake the work to generate the business case to allow PCT back office functions, regional and national, to become the basis for GP consortia infrastructure.
• Payroll, family health services and vehicle fleet management should be aggregated at a national level.
• Further work should be undertaken by the DH to review regulations and reduce the burden of bureaucracy and ensure investment in frontline services.
• The DH should lead work to review the provision of back office functions in primary care. The review should be complete by April 2011 and should outline options for re-engineering these functions at scale.
2. Recommendations
12
QIPP national workstream: Back office efficiency and management optimisation
Context
The Quality, Innovation, Productivity and Prevention programme was set up to achieve three distinct aims:
• Supporting commissioners to commission for quality and efficiency – e.g. through improved clinical pathways and decommissioning poor value care;
• Supporting providers to respond to the commissioning changes and efficiency pressures by transforming their businesses; and
• Implementing national policy and using system levers to support and drive change, e.g. primary care contracting and commissioning.
Each of the aims is to be delivered by a series of workstreams.
The aim of this workstream is to show how provider and commissioner organisations can achieve real and sustained efficiency savings through adopting a shared service approach to the delivery of back office functions.
Reviews already undertaken by the Treasury,1 the National Audit Office2 and the UK Public Services Audit Agency3 have all signalled the potential to save between 20% and 30% of the current spend on back office and administrative functions, through the careful and focused transformation of these services.
Defining back office functions
In this review, we define back office functions as covering the following areas:
• Finance;
• Human Resources (HR); 1 Operational Efficiency Programme, Final Report, April 2009, HM Treasury 2 The efficiency challenge: The administration costs of revenues and benefits, Audit Commission 3 Value For Money in public sector corporate services, UK Public Sector Audit Agencies
• Information Management and Technology (IM&T);
• Procurement;
• Estates Management – Further detailed work to consider the efficiency of our estates function has been done under the auspices of the Public Value Programme.4
• Payroll; and
• Governance and Risk (the definition of this encompasses researching, reading, preparing for, maintaining and undertaking governance or risk management activities or guidance).
Although procurement represents a separate QIPP workstream and will be the subject of further guidance, we have referred to it within this document as an integral part of back office functions and suggest that organisations consider it as an integral function when considering the integration of key processes.
The purpose of this report
This report describes how, nationally, a minimum of £616m savings can be realised in the NHS, without adversely impacting on service delivery, in terms of quality, quantity or user (patient, provider and commissioner) experience.
These savings could be increased further with review and rationalisation of organisations’ provision of middle and front of office functions.
In reviewing the current approach to the delivery of back office functions and in considering how best to optimise management resources, we have focused on three principal objectives:
• Reducing unnecessary spend on back office functions in order to free up as much resource as possible for reinvestment in frontline services.
4 2009 Value for Money Update, April 2009, HM Treasury
3. Introduction
QIPP national workstream: Back office efficiency and management optimisation 13
• Maintaining the capacity and capability to deliver high quality services.
• Driving greater efficiency through the practical action of boards and other key stakeholders, capitalising on the learning drawn from within health and the commercial sector.
This report enables boards to chart the potential scope for savings within their own organisation, with:
• Information about how to understand the organisation’s current spend on each back office function and compare this with peer organisations and best practice indicators to gauge the potential scope of saving to be realised;
• An evaluation of models for shared service provision, and informing boards as to the relevant application of these models to their own organisation and circumstances;
• Provision of information on how organisations can take cost out in a granular way; and
• Best practice examples of where this is being achieved to guide organisations in focusing on how risks can best be managed and mitigated as shared service arrangements are established.
This report also contributes to the debate on management cost optimisation, emphasising the importance of organisational transparency and the need to plan now so that GP consortia can continue to realise management cost efficiencies by maintaining a consistent approach.
The need for boards to act to ensure greater efficiency for the benefit of frontline services is overwhelming. We urge each NHS organisation to consider the recommendations detailed in this report during autumn 2010 and take steps to implement the necessary transformation of their back office functions.
To assist, we have agreed with the Department of Health steps to review practical inhibitors to greater efficiency, details of which are outlined in this document.
14
QIPP national workstream: Back office efficiency and management optimisation
4.1. The fiscal climate The NHS will need to achieve unprecedented efficiency gains, with savings reinvested in frontline services, to meet the current financial challenge and the future costs of demographic and technological change.5 The NHS is under increasing pressure to deliver better value. The pressure to deliver efficiencies has never been greater. The Quality, Innovation, Productivity and Prevention (QIPP) programme, supported subsequently by the recent White Paper, Equity and excellence: Liberating the NHS, on which the government is currently consulting, has targeted up to £20bn savings from within the health service. A significant proportion of this can be achieved through the rationalisation of back office functions.
The Operational Efficiency Programme (OEP) published by HM Treasury in May 2009 identified £8bn of possible efficiencies within back office functions across the whole of the public sector. This equates to savings of between 20% and 30% of total spend on back office functions. 5 Equity and Excellence: Liberating the NHS. Department of Health July 2010
The banking crisis, the subsequent recession and the increase in the public sector deficit have meant that all NHS organisations need to demonstrate that they are providing improved value for money, by actively reducing inefficiencies, including duplication, within their back office and non-clinical support functions.
The challenge for the NHS is to reduce the cost of these functions on a sustainable basis, without a reduction in the quality of the service delivered. For example, reducing costs in finance functions must go hand-in-hand with maintaining strong financial control.
Through wider adoption of new technology, leveraging the benefits of scale, process redesign and the adoption of a shared service approach, sizeable savings can be realised.
4.2. The challenges in delivering efficient back office functions The key challenges in delivering effective and efficient back office functions across the NHS are well understood and identified in the OEP report:-
• Fragmentation – The NHS is highly fragmented with a large number of individual organisations, many of which have their own back office operations and processes.
• Information – To date there has been a lack of robust and consistent management information on the spend of back office functions, and where information has been available through systems such as Estates Return Information Collection (ERIC), there has not been widespread use of this data. As a consequence it has been hard to identify accurate costs associated with back office functions. In turn this makes it difficult to establish trends, forge comparisons and manage down costs. What is not measured well will not be managed well.
4. The evidence for change
Key messages
• There is a fiscal imperative for NHS organisations to transform the way they work to deliver efficiency savings and high quality frontline services.
• The NHS is paying a premium for its back office functions due to the fragmentation and lack of uniformity across the sector.
• Evidence from the private sector, central government and the NHS has shown that adopting shared services can deliver both significant cost savings and service improvement.
• By adopting shared services in greater numbers the NHS will be able to deliver savings without impacting on patient care.
QIPP national workstream: Back office efficiency and management optimisation 15
• Review – In many instances limited mechanisms exist for reviewing an organisation’s operational effectiveness in respect of its back office functions. This means that operational costs and processes get limited independent scrutiny.
• Uniformity – There is a cost penalty from the lack of standardisation, simplification and sharing of back office functions. Whilst the devolution of delivery can provide greater responsiveness in the provision of these services, left unchecked it can proliferate and can lead to significant increased costs.
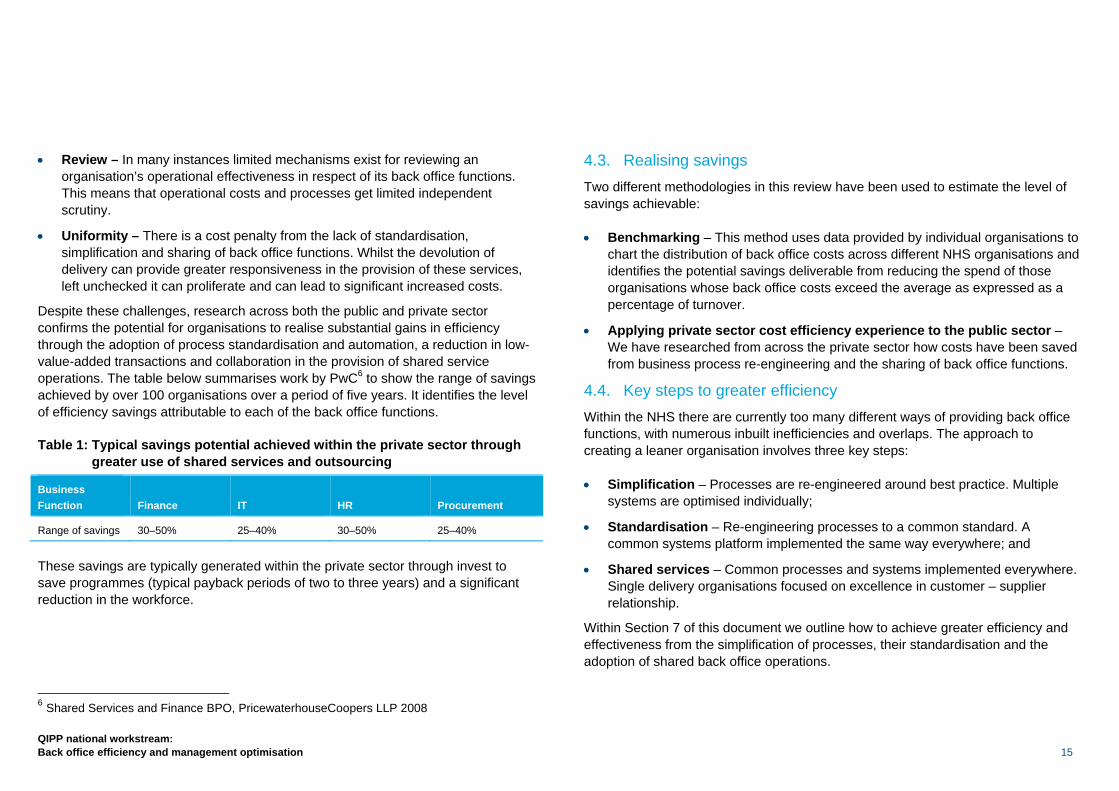
Despite these challenges, research across both the public and private sector confirms the potential for organisations to realise substantial gains in efficiency through the adoption of process standardisation and automation, a reduction in low-value-added transactions and collaboration in the provision of shared service operations. The table below summarises work by PwC6 to show the range of savings achieved by over 100 organisations over a period of five years. It identifies the level of efficiency savings attributable to each of the back office functions.
Table 1: Typical savings potential achieved within the private sector through greater use of shared services and outsourcing
Business Function Finance IT HR Procurement
Range of savings 30–50% 25–40% 30–50% 25–40%
These savings are typically generated within the private sector through invest to save programmes (typical payback periods of two to three years) and a significant reduction in the workforce.
6 Shared Services and Finance BPO, PricewaterhouseCoopers LLP 2008
4.3. Realising savings Two different methodologies in this review have been used to estimate the level of savings achievable:
• Benchmarking – This method uses data provided by individual organisations to chart the distribution of back office costs across different NHS organisations and identifies the potential savings deliverable from reducing the spend of those organisations whose back office costs exceed the average as expressed as a percentage of turnover.
• Applying private sector cost efficiency experience to the public sector – We have researched from across the private sector how costs have been saved from business process re-engineering and the sharing of back office functions.
4.4. Key steps to greater efficiency Within the NHS there are currently too many different ways of providing back office functions, with numerous inbuilt inefficiencies and overlaps. The approach to creating a leaner organisation involves three key steps:
• Simplification – Processes are re-engineered around best practice. Multiple systems are optimised individually;
• Standardisation – Re-engineering processes to a common standard. A common systems platform implemented the same way everywhere; and
• Shared services – Common processes and systems implemented everywhere. Single delivery organisations focused on excellence in customer – supplier relationship.
Within Section 7 of this document we outline how to achieve greater efficiency and effectiveness from the simplification of processes, their standardisation and the adoption of shared back office operations.

16
QIPP national workstream: Back office efficiency and management optimisation
4.5. Shared services Shared services are formed by combining corporate service activities across different parts of an organisation or across different organisations to bring efficiency savings and to improve service.
This is not a new concept; for example, BACS is a joint venture owned by 15 banks that has been processing financial transactions since 1968. The practice of sharing services has become increasingly widespread. Many FTSE-100 companies began to transfer their corporate services to shared service models over the late 1980s and early 1990s.
The benefits to the NHS were identified as early as 2001 when the Department of Health initiated the National Shared Financial Services project which resulted in the creation of two shared service centres in Bristol and Leeds. In 2005, the DH created Shared Business Services (SBS) through a joint venture with the private sector company Xansa, which was subsequently acquired by Steria. SBS currently provides aspects of shared financial services, procurement and payroll services to over 100 trusts within the NHS.
4.6. The drive for greater efficiency and higher standards of service The level of any additional gross savings achievable through shared services correlates closely with what an organisation has already done to improve efficiency and what further options are available to it. Analysis by the National Audit Office identified five recurring attributes that define shared services.
Table 2: Five attributes define shared services
Distinct governance A distinct organisational structure with a dedicated management team delivers the operational aspects of corporate services for one or more organisations
Standard processes Processes are standardised and streamlined
Economies of scale Scale is achieved through combining processes previously executed independently and a subsequent reduction in Full Time Equivalents (FTEs)
Customer driven A culture of service delivery is ingrained within the shared services centre. Resources are committed to key account management, monitoring key performance indicators and the achievement of service level agreements
Continuous process improvement
Dedicated project teams manage process change to drive improvements in both efficiency and levels of service
Shared services themselves bring benefits and challenges. The challenges have to do with the size and complexity of operations. The potential benefits are not simply about financial savings but cover broader issues including improving the quality of service and better information.

QIPP national workstream: Back office efficiency and management optimisation 17
Table 3: Shared services have the potential to bring a range of benefits
Cost savings Achievement of economies of scale, reduced headcount and higher levels of efficiency through simplification and standardisation of processes
Lower investment costs The pooling of transactional activities across an organisation into a single shared service operation makes more efficient use of investment capital
Better information and data Higher levels of technology investment leading to more reliable, richer and consistent management information, which can enable further financial savings, for example in procurement
Customer service From a single location using greater standardisation of processes, it is easier to deliver services to an agreed and documented set of performance standards with an explicit focus on customer service
Shifting focus The aggregation of transactional processing frees up the time of corporate services professionals, allowing their focus to shift towards value-added activities
Comparability The introduction of common standards enables easier comparisons of performance and processes across large organisations
There is no doubt that organisations are already driving greater efficiency from their shared services. Significant savings potential, however, still remains.
There are important lessons here for NHS organisations, in terms of accurately assessing the potential for delivering savings and in improving the quality of service the back office functions provide.
4.7. Responding to the White Paper Publication of the White Paper on 12 July 2010 confirms the importance of two distinct approaches to back office rationalisation and transformation for commissioning and provider organisations. We estimate at least £616m can be saved through business process redesign and shared service collaboration.
Commissioning
A review is being undertaken, led by David Flory, Deputy Chief Executive of the NHS, to evaluate the potential for PCT back office functions to be provided on a national or regional/multi-regional basis.
This is likely to lead to a substantial reduction in total spend and unit costs, by taking advantage of scale and automated process redesign. The benchmarking analysis undertaken for a small pilot group of PCTs suggests, as a minimum, savings of £500m. This is an activity-based costing estimate across all administrative and clerical functions within PCTs.
The analysis within this publication has identified that a minimum saving of £312m can be achieved, drawn from the data submitted directly by PCTs.
In order for this level of saving to be achieved and as much resource as possible directed towards frontline services, it is essential that a large-scale infrastructure is used to provide Payroll, Finance, HR, Information Management and Technology and family health service back office functions to the newly established GP consortia.
We recommend that in addition further work is undertaken to create a platform for GP consortia over the next 18 months.
Providers
Whilst the accent within the White Paper is placed on choice and competition to drive forward the delivery of high quality patient-centred services, this is to be supported by increased collaboration amongst providers in the sourcing of back office functions.
A number of approaches to delivering shared back office operations are set out within this report (Section 8); although it will be for individual boards to determine the option that best suits their circumstances. The evidence, however, from the commercial sector, National Audit Office, CIPFA and the Operational Efficiency Programme is absolutely clear, there are significant efficiency savings to be made across the sector through implementing this approach.

18
QIPP national workstream: Back office efficiency and management optimisation
4.8. The current shared service landscape within the NHS The extent of back office shared services currently within the NHS varies between functional specialisms. It is clear that there are a large number of formal and informal shared service arrangements; these tend to concentrate at present on functional areas such as Financial Services, HR and Payroll. The vast majority of shared service arrangements are ‘captive’ shared services, being in the main formal and informal collaborations between NHS organisations. The prevalence of these arrangements demonstrates that there is a clear acceptance of the advantages collaboration can bring. Most organisations have some experience of shared services, whether it is internal audit consortia or payroll consortia, lease cars or a procurement hub.
One specific characteristic of shared service arrangements within the NHS has been the development of shared technology platforms. An example of this is the North East Patches Shared System Group, established in 2001, where organisations saw a clear advantage of delivering leading systems to eliminate unnecessary processes using technology and aggregated information to leverage procurement savings. The Electronic Staff Record essentially follows a similar principle in that it is a shared system as opposed to a shared service.
Berkshire Shared Services, Anglia Support Partnership and SBS are all examples of successful shared service ventures. Further details on existing suppliers of shared services to the NHS and what they offer can be found in the shared services compendium, www.nhsconfed.org/QIPPbackoffice. We believe such models can be built on further to engineer greater efficiency and cost savings as long as external providers also ensure that they provide a customer-focused service.
However, even within such arrangements there is still scope for substantial further cost efficiency savings through greater standardisation of processes and the wider deployment of technology.
An increasing number of organisations are now moving down the shared service path, determined to re-engineer their services to provide greater efficiency and effectiveness.
Pathfinder 1 University Hospitals Leicester
University Hospitals Leicester (UHL), Leicestershire Partnership Trust, Leicester, Leicestershire and Rutland PCT and Leicester City PCT have performed a high-level top-down scoping study for shared services. The study has considered options for how such services would be delivered, the order of magnitude of potential savings that can be achieved and timescales for implementation. The objective is to design an integrated back office with a technology-enabled solution that will positively support frontline services by 2011. The process has involved reviewing a number of options for both internal shared services and outsourcing. The recommendation is that there is a move to shared services across Facilities Management, HR, IM&T, Finance and Procurement with individual retained client capabilities within each trust. A final decision has yet to be made on the host organisation or workforce structures but the goal is to have shared services implemented for all functions during 2011 and the resultant savings being realised from 2011/12 onwards.
Pathfinder 2 Dorset Health Community
Royal Bournemouth and Christchurch Hospitals NHS Foundation Trust with NHS Dorset are undertaking work to determine the spectrum of back office functions which can be provided by a shared service consortium. This requires a detailed examination of each back office function to determine any aspects which the trust needs to retain as central to the wider functioning of the organisation. This work is underpinned by a detailed cost analysis of each function and enables each organisation to determine what aspects of HR, Finance, and IM&T etc are to be provided via shared service consortia.
The aim is to ensure that as many transactional and management activities as practical are provided through an agreed shared service consortium. Once complete this work will be extended to other trusts in Dorset as a precursor to agreeing the format of the shared services consortia.
QIPP national workstream: Back office efficiency and management optimisation 19
5.1. Informing boards A detailed benchmarking exercise was undertaken in which all PCT, NHS trust and foundation trust organisations were invited to participate. We welcomed the encouragement by Monitor of foundation trusts to participate and a similar endorsement of this approach by strategic health authorities, ensuring a high participation rate.
The objectives in undertaking this work were fourfold:
• To determine accurately the total NHS spend on back office functions;
• To enable detailed analysis of the potential savings that could accrue over a defined time period;
• To allow organisations to compare spend in aggregate and by individual function with their peer organisations and with best practice indicators; and
• To guide boards in undertaking comparative analysis of their organisation’s spend and to use this data to develop plans to transform back office functions.
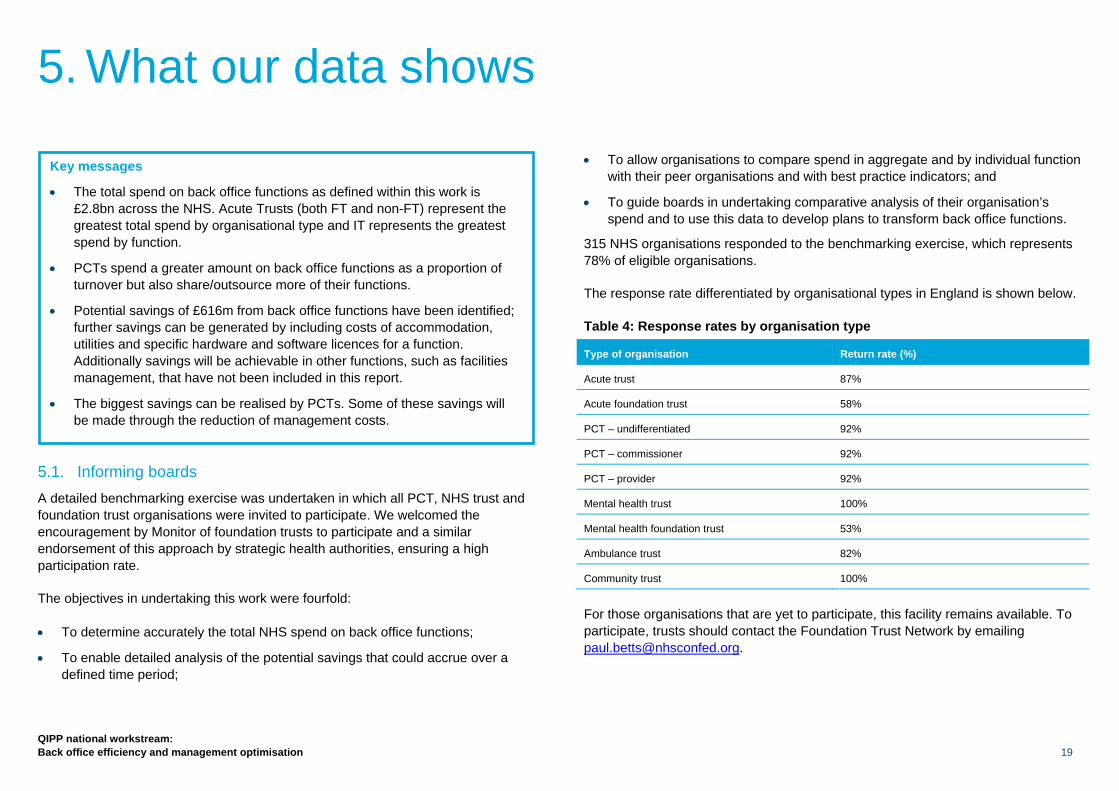
315 NHS organisations responded to the benchmarking exercise, which represents 78% of eligible organisations.
The response rate differentiated by organisational types in England is shown below.
Table 4: Response rates by organisation type
Type of organisation Return rate (%)
Acute trust 87%
Acute foundation trust 58%
PCT – undifferentiated 92%
PCT – commissioner 92%
PCT – provider 92%
Mental health trust 100%
Mental health foundation trust 53%
Ambulance trust 82%
Community trust 100%
For those organisations that are yet to participate, this facility remains available. To participate, trusts should contact the Foundation Trust Network by emailing [email protected].
5. What our data shows
Key messages
• The total spend on back office functions as defined within this work is £2.8bn across the NHS. Acute Trusts (both FT and non-FT) represent the greatest total spend by organisational type and IT represents the greatest spend by function.
• PCTs spend a greater amount on back office functions as a proportion of turnover but also share/outsource more of their functions.
• Potential savings of £616m from back office functions have been identified; further savings can be generated by including costs of accommodation, utilities and specific hardware and software licences for a function. Additionally savings will be achievable in other functions, such as facilities management, that have not been included in this report.
• The biggest savings can be realised by PCTs. Some of these savings will be made through the reduction of management costs.
20
QIPP national workstream: Back office efficiency and management optimisation
The data held represents a live database and the relative standing of individual organisations will be influenced as the remaining organisations participate. However, we do not anticipate this revealing any substantial variations in the relative standing of organisations in the short term. An update with the additional organisations data will be made available to all organisations showing their comparative performance.
In addition to providing each participating organisation with data showing their spend on an aggregated and disaggregated basis (by function), this report provides additional data analysis which shows:-
• The total spend on back office functions, by organisation type and function;
• The average spend on each function across SHAs for each organisation type, based on turnover, total pay, FTEs and cost per FTE by function;
• An analysis of the savings that can be achieved by organisation type; and
• An example of peer-to-peer comparison showing actual spend and potential savings.
5.2. Benchmarking methodology A single template was developed in consultation with members of the FTN and representatives from the DH, to establish a baseline for all provider and commissioner organisations in the NHS. The template broke down several key functions considered as back office into a number of different processes to enable a clear definition of what each function represented. Figures were based on 2009/10 pay budgets and included expenditure on any processes which are shared or outsourced.
Data was independently reviewed and cleansed to remove any potential anomalies. ROCR approval applied for retrospectively
PCTs were specifically requested to differentiate their returns into provider and commissioner functions. In some instances, PCTs were unable to do this and hence the data overleaf distinguishes between those PCT organisations termed undifferentiated, whose back office costs combine both commissioner and provider functions, and the remaining PCTs which were able to complete this exercise successfully.
Many functions which could be described as back office (for example, Finance and IM&T) are integral to front of office functions for PCTs as commissioners. In general, PCTs ascribed a proportion of these functional costs to commissioning and excluded this spend from their returns. Whilst the reason for this distinction is understood and many PCTs have been transparent and explicit in their reasoning, there is potential to understate the efficiency savings to be made from existing PCT functions as a result.
As a consequence, we suggest a further piece of work to identify the total PCT spend ascribed to these key functions. This would more accurately inform the final determination of management allowances for GP commissioners and the resources required to support the ongoing delivery of both PCT and GP commissioning back office functions.
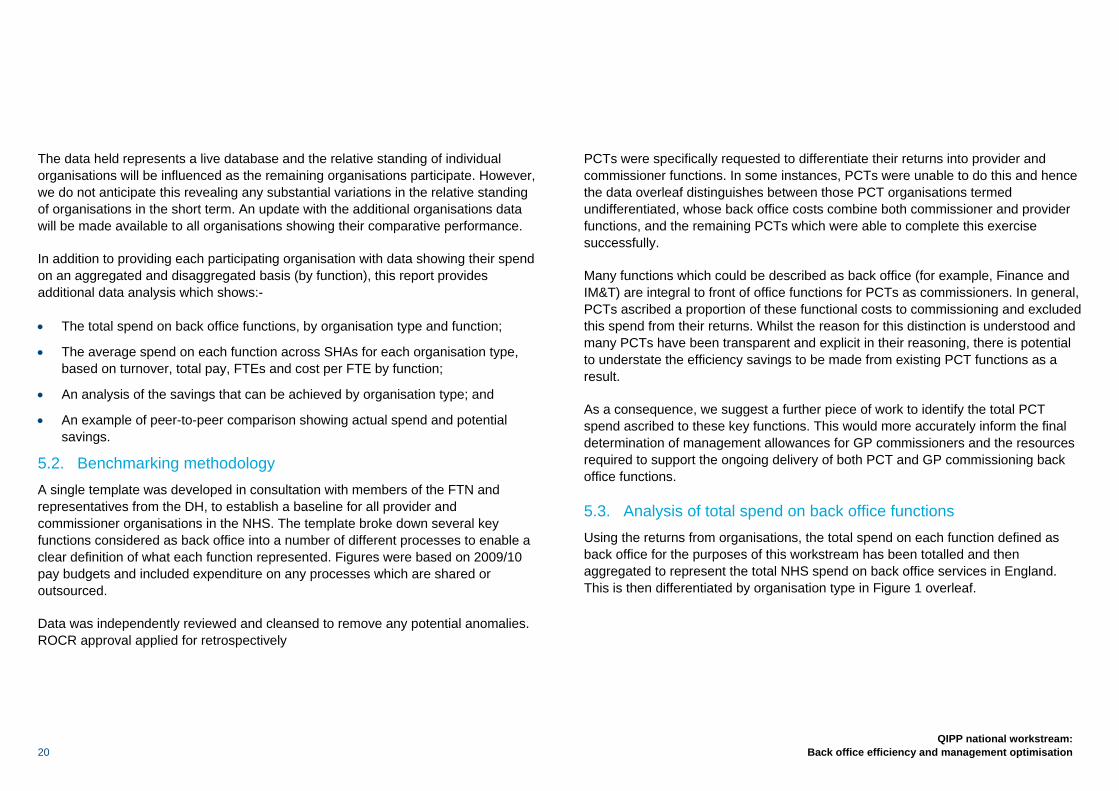
5.3. Analysis of total spend on back office functions Using the returns from organisations, the total spend on each function defined as back office for the purposes of this workstream has been totalled and then aggregated to represent the total NHS spend on back office services in England. This is then differentiated by organisation type in Figure 1 overleaf.
QIPP national workstream: Back office efficiency and management optimisation 21
Figure 1: Total spend on back office functions by organisation type aggregated to 100%
Table 5: Breakdown of spend on back office functions
Organisation type Acute
Acute FT PCT
MH Trust MH FT
Community trust
Ambulance trust
Spend on back office functions
£738.2m £700.0m £958.6m £113.6m £222.0m £9.9m £74.4m
The total spend on back office functions in England is calculated as £2.82bn. PCTs spend the most on back office functions. This expenditure represents a far higher proportion of their total spend (9%) than the provider sector (3%). With regard to provision, the acute sector in total (non-FT plus FT), spends a greater sum on back office functions than any other sector. However, this is in line with expectations, as the combined direct spend and employee numbers of the acute sector is greater than that of PCTs and other organisations.
The acute sector spends 3% of its turnover on back office compared to 4.6% by the mental health trusts. The difference in spend for acute FTs and non-FTs is marginal: both spend approximately similar amounts of turnover on back office functions.
5.4. Analysis of spend on shared services within back office functions Each organisation included in the survey has provided data on the functions and processes they are currently sharing. As can be seen from Figure 2, the majority of shared services are within the Information Management and Technology function.
Figure 2: Total spend on shared or outsourced processes by function type for all organisations aggregated to 100%
The current spend on a shared service approach is an aggregated total of £370m which represents 13% of the total back office spend.
£0.00
£50.00
£100.00 £150.00 £200.00 £250.00 £300.00 £350.00 £400.00
Finance HR&T IT Estates Procurement Payroll Gov&Risk Grand Total
Total spend £m
£0
£200,000,000
£400,000,000
£600,000,000
£800,000,000
£1,000,000,000
£1,200,000,000
Acute Acute FT PCT MH Trust Mental Health FT
Community Trust
AmbulanceTrust
Total spend

22
QIPP national workstream: Back office efficiency and management optimisation
Figure 3: Distribution of shared/outsourced services by organisation type
Figure 4: Distribution of shared/outsourced services by function
Figures 3 and 4 show the distribution of spend on outsourcing and shared services. PCTs have shown a greater appetite for adopting shared services and outsourcing which suggests that the scope for deploying shared services and utilising outsourcing is considerable for the provider sector. Finance and IT are the functions with greatest spend on shared or outsourced services. This is largely due to the fact that there are a number of transactional processes that are relatively easy to share or outsource and deliver quick savings.
21%
7%
38%
14%
11%
9%
0%
Finance
HR&T
IT
Estates
Procurement
Payroll
Gov&Risk
15%
17%
1%6%
11%
50%
Acute
Acute FT
Ambulance Trust
MH Trust
Mental Health FT
PCT
QIPP national workstream: Back office efficiency and management optimisation 23
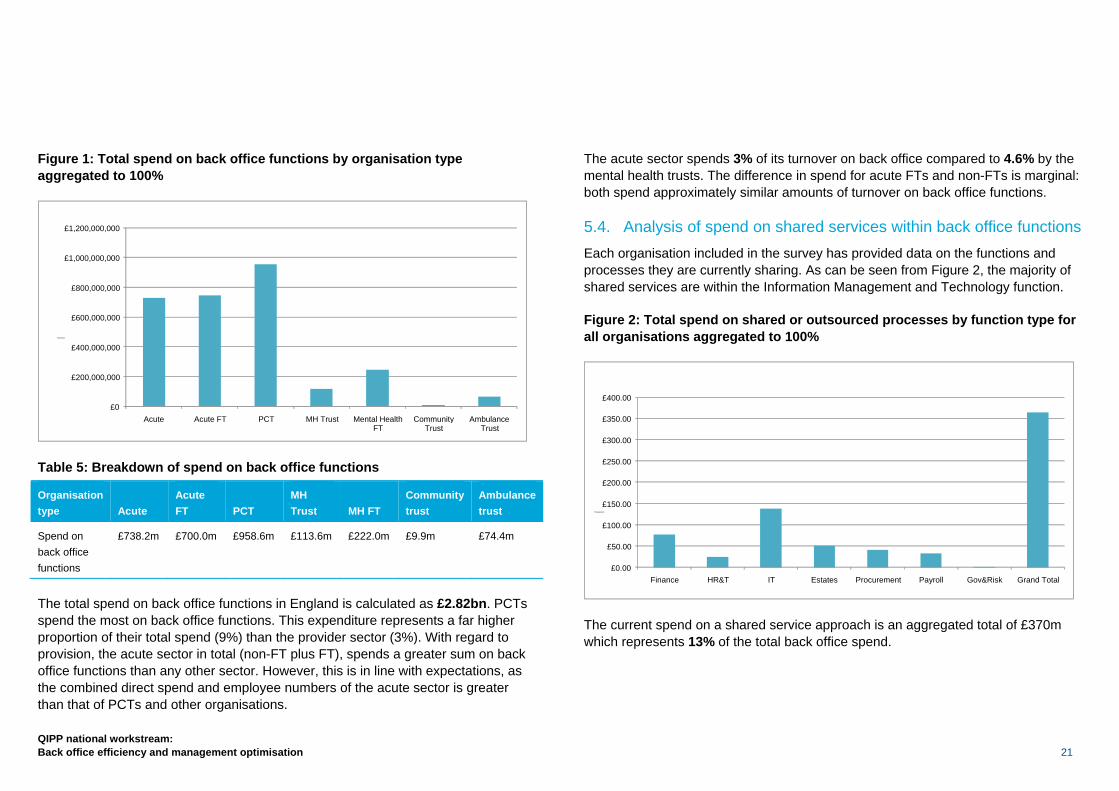
5.5. Analysis of average spend across organisation type To establish a representative analysis of functions, a series of Key Performance Indicators (KPIs) have been developed. The KPIs operate at two levels; the higher level indicators enable boards to assess rapidly the financial efficiency of key back office functions, whilst the second level indicators (not collected in this benchmarking exercise) provide boards with a meaningful analysis of both the financial value and the quality of performance of these services. The top level indicators included here are based on the cost of a function in relation to turnover, total pay and FTEs. Boards will clearly want to review the performance of these services taking account of both quality and performance. Details of the quality-based KPIs are provided in Section 13.
Figure 5: Cost as a % of turnover – national averages by organisation type
In terms of total costs as a percentage of turnover the following points can be highlighted, as shown in Figure 5:
• Mental health trusts have a proportionately greater spend on their back office than any other type of organisation. This is likely to reflect the smaller size and turnover of mental health organisations as compared with acute trusts. The data emphasises the importance of these organisations securing partners for the future provision of back office functions.
• Payroll costs are consistent across each sector, but as is evident from more detailed analysis, could be reduced by a further 15–20% through the wider adoption of e-technology.
Costs for acute trusts (both FT and non-FT) are similar across all back office functions; however, this should not be interpreted as an absence of scope to achieve greater efficiency. Governance costs are highest for PCT providers and in general this is an area that warrants further review and consideration by all organisations, such that boards can be assured they are receiving value for money from this investment.
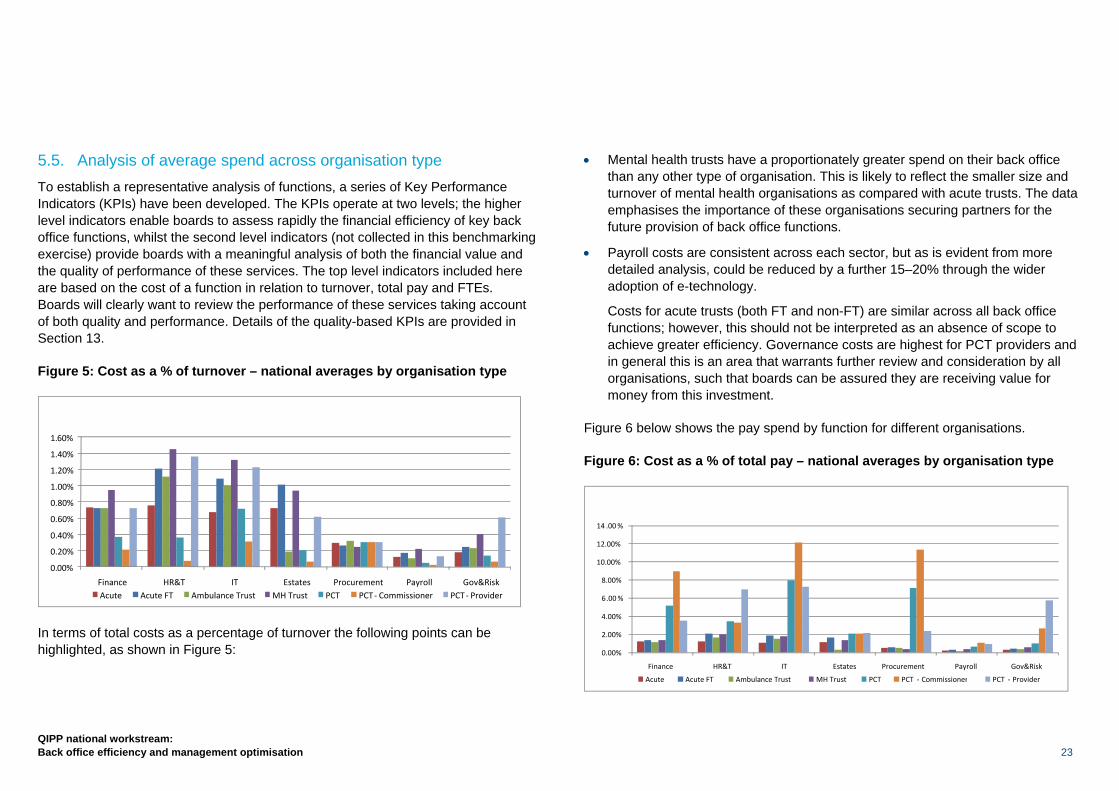
Figure 6 below shows the pay spend by function for different organisations.
Figure 6: Cost as a % of total pay – national averages by organisation type
0.00%
2.00%
4.00%
6.00% 8.00%
10.00% 12.00% 14 .00 %
Finance HR&T IT Estates Procurement Payroll Gov&Risk Acute Acute FT Ambulance Trust MH Trust PCT PCT ‐ Commissioner PCT ‐ Provider
0. 00% 0.20% 0.40% 0.60% 0.80% 1.00% 1.20% 1.40% 1. 60%
Finance HR&T IT Estates Procurement Payroll Gov&RiskAcute Acute FT Ambulance Trust MH Trust PCT PCT ‐ Commissioner PCT ‐ Provider
24
QIPP national workstream: Back office efficiency and management optimisation
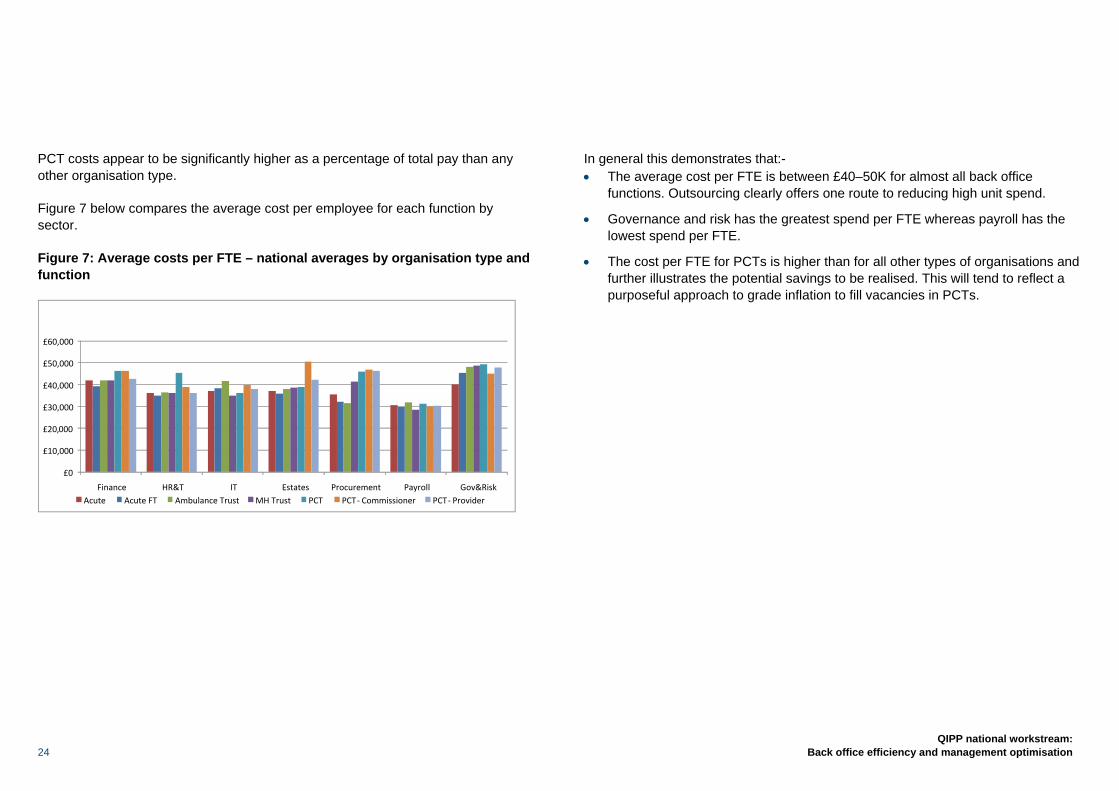
PCT costs appear to be significantly higher as a percentage of total pay than any other organisation type.
Figure 7 below compares the average cost per employee for each function by sector.
Figure 7: Average costs per FTE – national averages by organisation type and function
In general this demonstrates that:- • The average cost per FTE is between £40–50K for almost all back office
functions. Outsourcing clearly offers one route to reducing high unit spend.
• Governance and risk has the greatest spend per FTE whereas payroll has the lowest spend per FTE.
• The cost per FTE for PCTs is higher than for all other types of organisations and further illustrates the potential savings to be realised. This will tend to reflect a purposeful approach to grade inflation to fill vacancies in PCTs.
£0
£10,000 £ 20,000£30,000 £40,000 £50,000 £60,000
Finance HR&T IT Estates Procurement Payroll Gov&RiskAcute Acute FT Ambulance Trust MH Trust PCT PCT ‐ Commissioner PCT ‐ Provider
QIPP national workstream: Back office efficiency and management optimisation 25
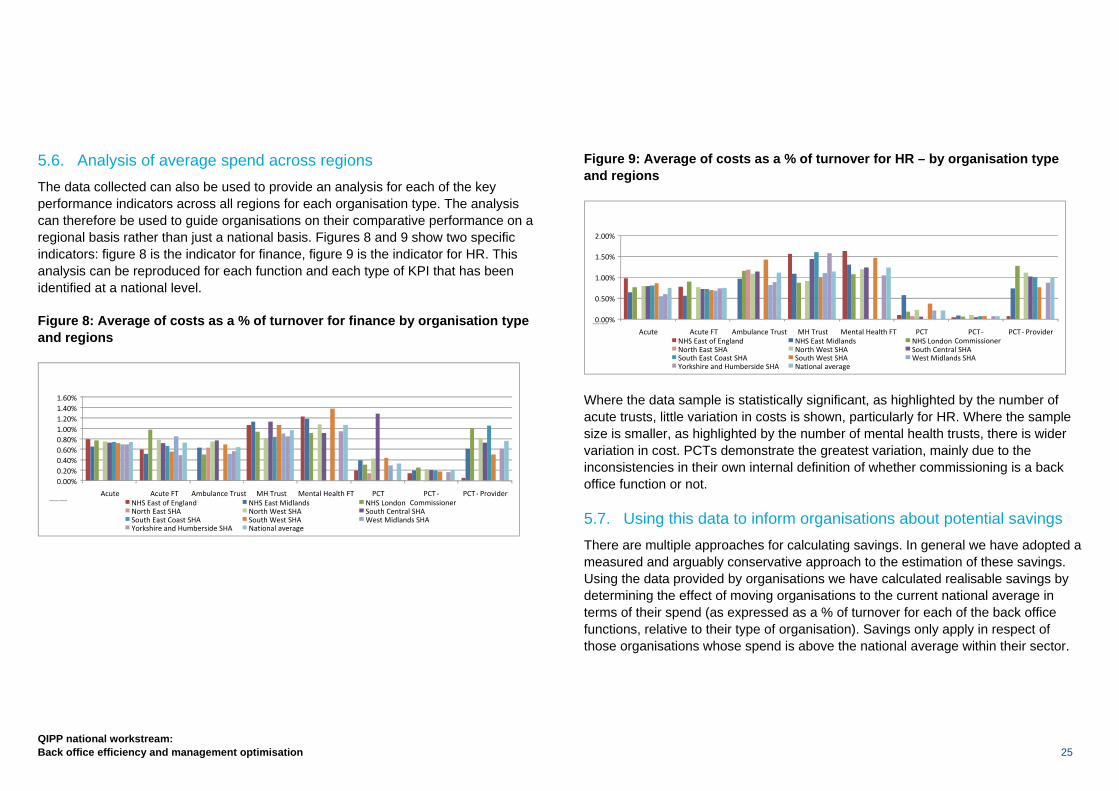
5.6. Analysis of average spend across regions The data collected can also be used to provide an analysis for each of the key performance indicators across all regions for each organisation type. The analysis can therefore be used to guide organisations on their comparative performance on a regional basis rather than just a national basis. Figures 8 and 9 show two specific indicators: figure 8 is the indicator for finance, figure 9 is the indicator for HR. This analysis can be reproduced for each function and each type of KPI that has been identified at a national level.
Figure 8: Average of costs as a % of turnover for finance by organisation type and regions
Figure 9: Average of costs as a % of turnover for HR – by organisation type and regions
Where the data sample is statistically significant, as highlighted by the number of acute trusts, little variation in costs is shown, particularly for HR. Where the sample size is smaller, as highlighted by the number of mental health trusts, there is wider variation in cost. PCTs demonstrate the greatest variation, mainly due to the inconsistencies in their own internal definition of whether commissioning is a back office function or not.
5.7. Using this data to inform organisations about potential savings There are multiple approaches for calculating savings. In general we have adopted a measured and arguably conservative approach to the estimation of these savings. Using the data provided by organisations we have calculated realisable savings by determining the effect of moving organisations to the current national average in terms of their spend (as expressed as a % of turnover for each of the back office functions, relative to their type of organisation). Savings only apply in respect of those organisations whose spend is above the national average within their sector.
0.00%
0.50%
1.00%
1.50%
2.00%
Acute Acute FT Ambulance Trust MH Trust Mental Health FT PCT PCT ‐Commissioner
PCT ‐ Provider HR costs as a % of turnover
NHS East of England NHS East Midlands NHS LondonNorth East SHA North West SHA South Central SHASouth East Coast SHA South West SHA West Midlands SHAYorkshire and Humberside SHA National average
0.00%0.20%0.40%0.60%0.80%1.00%1.20%1.40%1.60%
Acute Acute FT Ambulance Trust MH Trust Mental Health FT PCT PCT ‐Commissioner
PCT ‐ ProviderFinance costs as a % of turnover NHS East of England NHS East Midlands NHS London
North East SHA North West SHA South Central SHASouth East Coast SHA South West SHA West Midlands SHAYorkshire and Humberside SHA National average
26
QIPP national workstream: Back office efficiency and management optimisation
Thus:-
• The national average for each type of organisation for any given function is calculated by:-
− Eliminating the top 25% and the bottom 25% of all organisations to remove any anomalies that may cause over/under-stated benefits; and
− Determining the average of the remaining 50%, thereby creating a more realistic figure through which benefits can be calculated.
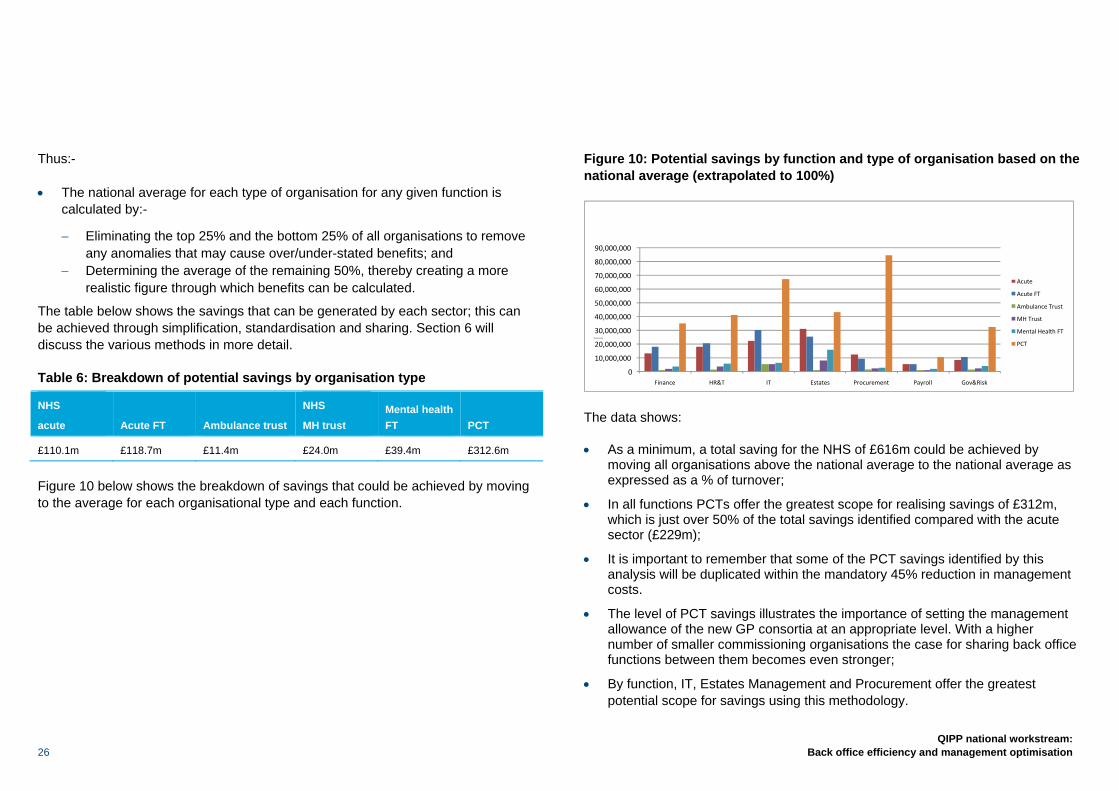
The table below shows the savings that can be generated by each sector; this can be achieved through simplification, standardisation and sharing. Section 6 will discuss the various methods in more detail.
Table 6: Breakdown of potential savings by organisation type
NHS
acute Acute FT Ambulance trust
NHS
MH trust Mental health FT PCT
£110.1m £118.7m £11.4m £24.0m £39.4m £312.6m
Figure 10 below shows the breakdown of savings that could be achieved by moving to the average for each organisational type and each function.
Figure 10: Potential savings by function and type of organisation based on the national average (extrapolated to 100%)
The data shows:
• As a minimum, a total saving for the NHS of £616m could be achieved by moving all organisations above the national average to the national average as expressed as a % of turnover;
• In all functions PCTs offer the greatest scope for realising savings of £312m, which is just over 50% of the total savings identified compared with the acute sector (£229m);
• It is important to remember that some of the PCT savings identified by this analysis will be duplicated within the mandatory 45% reduction in management costs.
• The level of PCT savings illustrates the importance of setting the management allowance of the new GP consortia at an appropriate level. With a higher number of smaller commissioning organisations the case for sharing back office functions between them becomes even stronger;
• By function, IT, Estates Management and Procurement offer the greatest potential scope for savings using this methodology.
0
10,000,000 20,000,000 30,000,000 40,000,000 50,000,000 60,000,000 70,000,000 80,000,000 90,000,000
Finance HR&T IT Estates Procurement Payroll Gov&Risk
Potential savings
Acute
Acute FT Ambulance Trust
MH Trust
Mental Health FT
PCT
QIPP national workstream: Back office efficiency and management optimisation 27
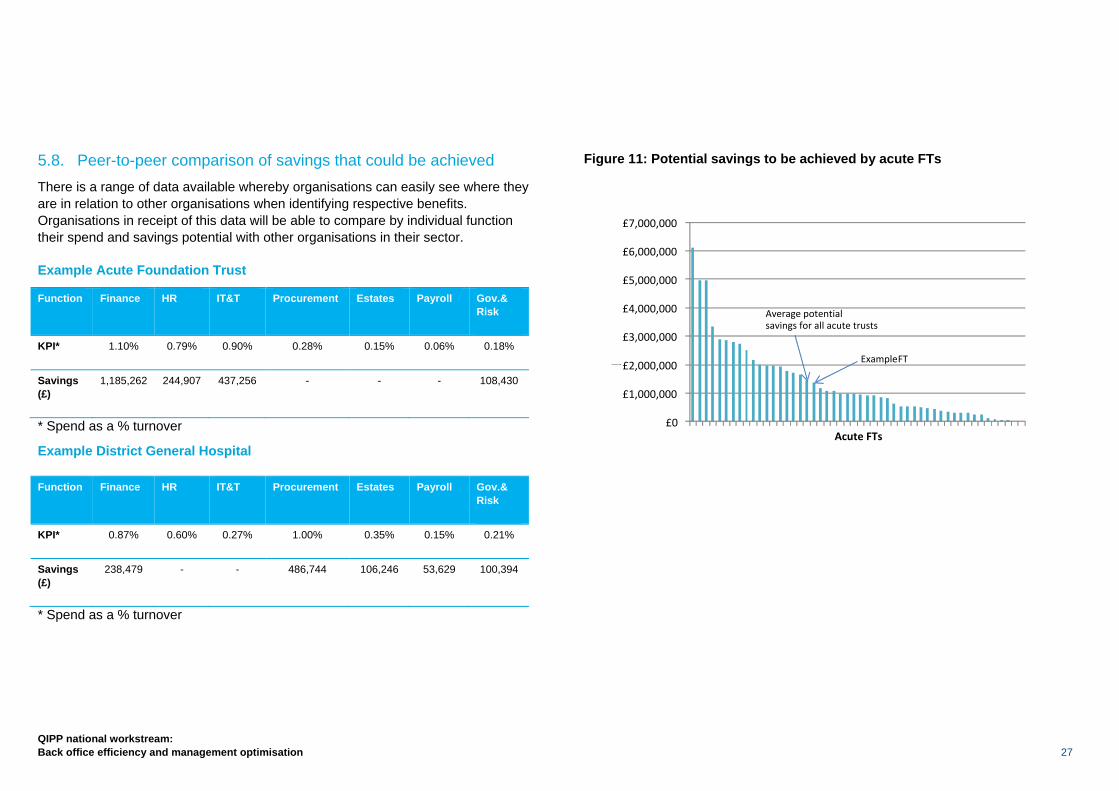
5.8. Peer-to-peer comparison of savings that could be achieved There is a range of data available whereby organisations can easily see where they are in relation to other organisations when identifying respective benefits. Organisations in receipt of this data will be able to compare by individual function their spend and savings potential with other organisations in their sector.
Example Acute Foundation Trust
Function Finance HR IT&T Procurement Estates Payroll Gov.& Risk
KPI* 1.10% 0.79% 0.90% 0.28% 0.15% 0.06% 0.18%
Savings (£)
1,185,262 244,907 437,256 - - - 108,430
* Spend as a % turnover
Example District General Hospital
Function Finance HR IT&T Procurement Estates Payroll Gov.& Risk
KPI* 0.87% 0.60% 0.27% 1.00% 0.35% 0.15% 0.21%
Savings (£)
238,479 - - 486,744 106,246 53,629 100,394
* Spend as a % turnover
Figure 11: Potential savings to be achieved by acute FTs
£0
£1,000,000
£2,000,000
£3,000,000
£4,000,000
£5,000,000
£6,000,000
£7,000,000
Potential savings
Acute FTs
ExampleFT
Average potential savings for all acute trusts
28
QIPP national workstream: Back office efficiency and management optimisation
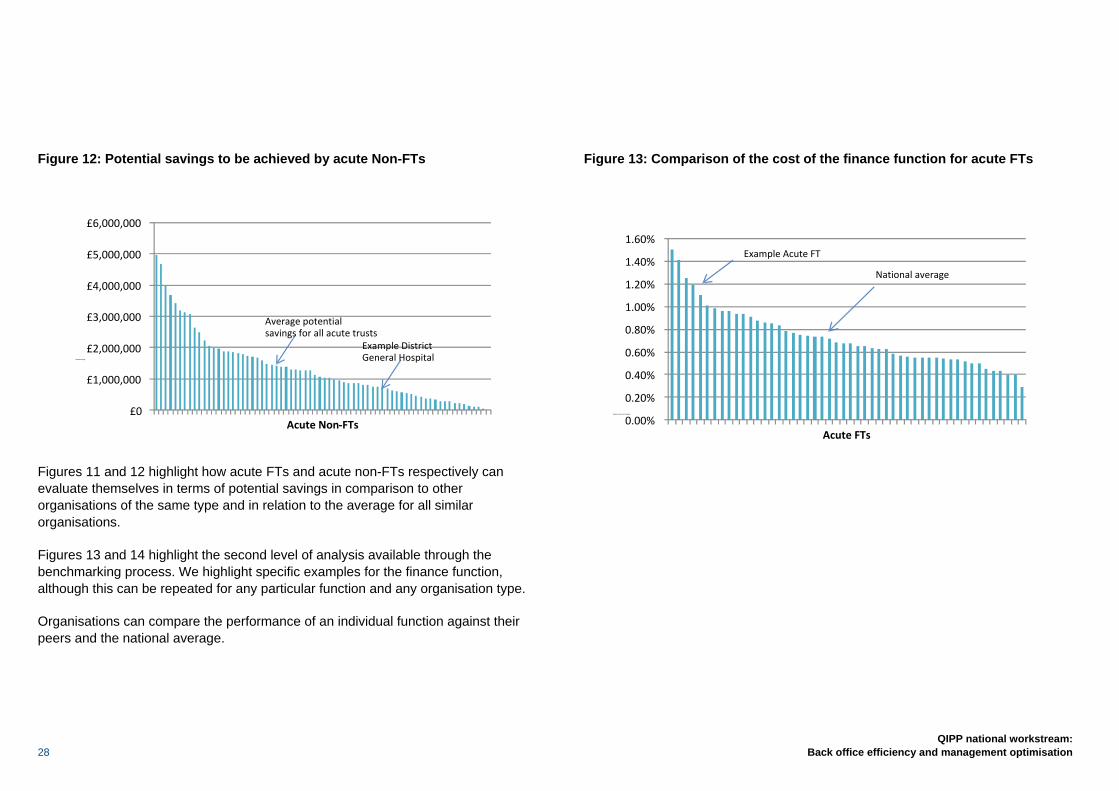
Figure 12: Potential savings to be achieved by acute Non-FTs
Figures 11 and 12 highlight how acute FTs and acute non-FTs respectively can evaluate themselves in terms of potential savings in comparison to other organisations of the same type and in relation to the average for all similar organisations.
Figures 13 and 14 highlight the second level of analysis available through the benchmarking process. We highlight specific examples for the finance function, although this can be repeated for any particular function and any organisation type.
Organisations can compare the performance of an individual function against their peers and the national average.
Figure 13: Comparison of the cost of the finance function for acute FTs
0.00%
0.20%
0.40%
0.60%
0.80%
1.00%
1.20%
1.40%
1.60%
Finance costs as a % of turnover
Acute FTs
Example Acute FT
National average
£0
£1,000,000
£2,000,000
£3,000,000
£4,000,000
£5,000,000
£6,000,000
Potential savings
Acute Non‐FTs
Average potential savings for all acute trusts
Example District General Hospital
QIPP national workstream: Back office efficiency and management optimisation 29
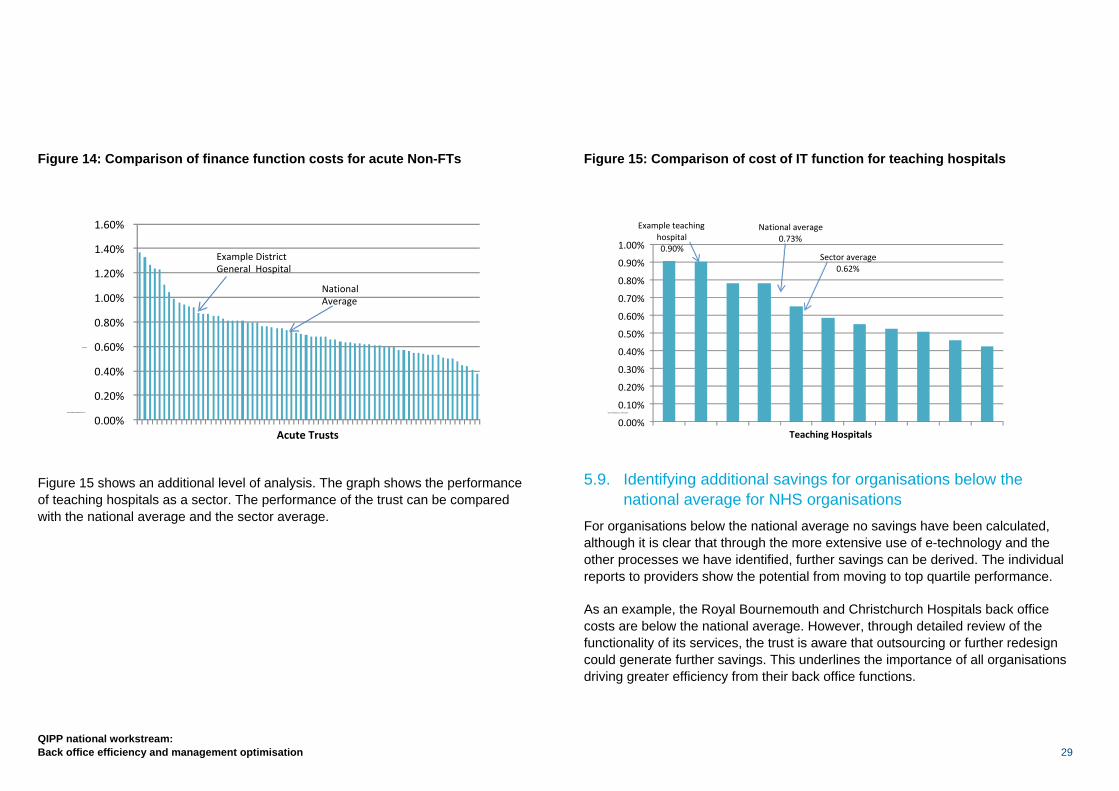
Figure 14: Comparison of finance function costs for acute Non-FTs
Figure 15 shows an additional level of analysis. The graph shows the performance of teaching hospitals as a sector. The performance of the trust can be compared with the national average and the sector average.
Figure 15: Comparison of cost of IT function for teaching hospitals
5.9. Identifying additional savings for organisations below the national average for NHS organisations
For organisations below the national average no savings have been calculated, although it is clear that through the more extensive use of e-technology and the other processes we have identified, further savings can be derived. The individual reports to providers show the potential from moving to top quartile performance.
As an example, the Royal Bournemouth and Christchurch Hospitals back office costs are below the national average. However, through detailed review of the functionality of its services, the trust is aware that outsourcing or further redesign could generate further savings. This underlines the importance of all organisations driving greater efficiency from their back office functions.
0.00%
0.10%
0.20%
0.30%
0.40%
0.50%
0.60%
0.70%
0.80%
0.90%
1.00%
Cost of IT function as a % of turnover
Teaching Hospitals
Example teaching hospital0.90%
National average0.73%
Sector average0.62%
0.00%
0.20%
0.40%
0.60%
0.80%
1.00%
1.20%
1.40%
1.60%
Costs of finance function as a % of
turnover
Acute Trusts
National Average
Example District General Hospital
30
QIPP national workstream: Back office efficiency and management optimisation
The benchmarking work involves peer-to-peer comparisons against a specific definition. We believe that should organisations adopt an industry-standard approach to benchmarking such as Hacketts or Saratoga, and comparisons be made with the private sector, then the actual total benefits to be made by the NHS will be considerably greater.
As part of this work we have engaged Hacketts to provide some best-in-class comparators that organisations can use to see how they compare more broadly with other organisations.
Whilst the precise definitions used by Hacketts vary slightly from those used as part of our benchmarking, the comparisons serve to highlight the potential for further substantial savings if organisations were able to improve efficiency close to the best in class markers. The aim of these is to provide an indication of the variation in benchmarks that organisations can achieve when aiming for the average and best in class.
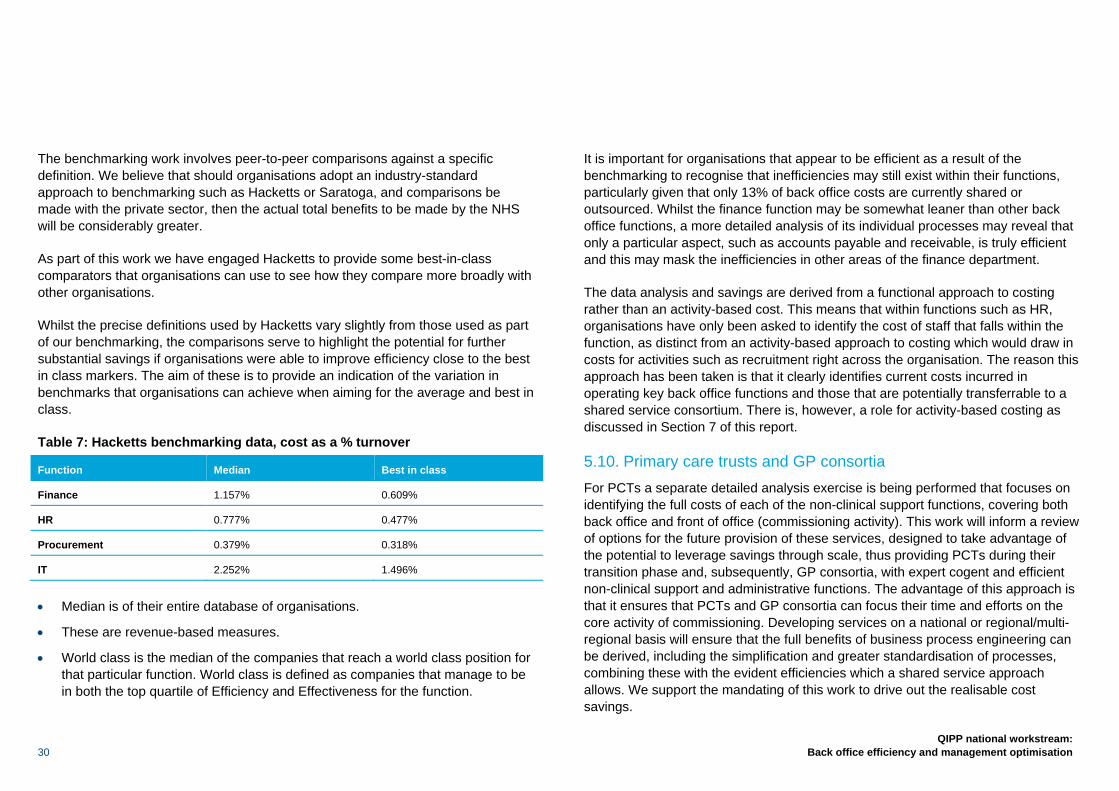
Table 7: Hacketts benchmarking data, cost as a % turnover
Function Median Best in class
Finance 1.157% 0.609%
HR 0.777% 0.477%
Procurement 0.379% 0.318%
IT 2.252% 1.496%
• Median is of their entire database of organisations.
• These are revenue-based measures.
• World class is the median of the companies that reach a world class position for that particular function. World class is defined as companies that manage to be in both the top quartile of Efficiency and Effectiveness for the function.
It is important for organisations that appear to be efficient as a result of the benchmarking to recognise that inefficiencies may still exist within their functions, particularly given that only 13% of back office costs are currently shared or outsourced. Whilst the finance function may be somewhat leaner than other back office functions, a more detailed analysis of its individual processes may reveal that only a particular aspect, such as accounts payable and receivable, is truly efficient and this may mask the inefficiencies in other areas of the finance department.
The data analysis and savings are derived from a functional approach to costing rather than an activity-based cost. This means that within functions such as HR, organisations have only been asked to identify the cost of staff that falls within the function, as distinct from an activity-based approach to costing which would draw in costs for activities such as recruitment right across the organisation. The reason this approach has been taken is that it clearly identifies current costs incurred in operating key back office functions and those that are potentially transferrable to a shared service consortium. There is, however, a role for activity-based costing as discussed in Section 7 of this report.
5.10. Primary care trusts and GP consortia For PCTs a separate detailed analysis exercise is being performed that focuses on identifying the full costs of each of the non-clinical support functions, covering both back office and front of office (commissioning activity). This work will inform a review of options for the future provision of these services, designed to take advantage of the potential to leverage savings through scale, thus providing PCTs during their transition phase and, subsequently, GP consortia, with expert cogent and efficient non-clinical support and administrative functions. The advantage of this approach is that it ensures that PCTs and GP consortia can focus their time and efforts on the core activity of commissioning. Developing services on a national or regional/multi-regional basis will ensure that the full benefits of business process engineering can be derived, including the simplification and greater standardisation of processes, combining these with the evident efficiencies which a shared service approach allows. We support the mandating of this work to drive out the realisable cost savings.
QIPP national workstream: Back office efficiency and management optimisation 31
Of relevance to this work is the contribution services such as IM&T, Finance and HR make to front office activity. The term ‘front of office’ usually encompasses those organisational processes that involve greater customer contact. In some service industries, organisations are adopting structures for end-to-end business process management, coupled with increased automation and a more generic frontline workforce supported by second-line experts. Integration of front office functions with back office computer systems to create a single interface for customers is a good example of this. Sectors including local government are drawing together back, middle and front of office functions. Back office activity should deliver value for money and focus on efficiency, compliance, flexibility and service in the area of transaction, processing and reporting. Middle office should focus on value, governance and financial strategy. It includes processes covering risk management, stewardship and resource optimisation such as treasury and asset management. Front of office activity should focus on value creation and the conversion of business strategy into operational activity. It includes processes that support planning and budgeting and ad hoc decision support as well as scenario modelling. We propose that the work to review PCT and GP consortia should consider the need to establish cohesive end-to-end processes.
In addition we recommend that GP consortia have a common reporting structure such that in-depth financial analysis can be carried out in the future and that their costs are fully transparent.
5.11. Using this data to inform organisations about potential savings The primary purpose of this analysis is to inform boards as to the potential savings to be realised from the re-engineering of back office functions.
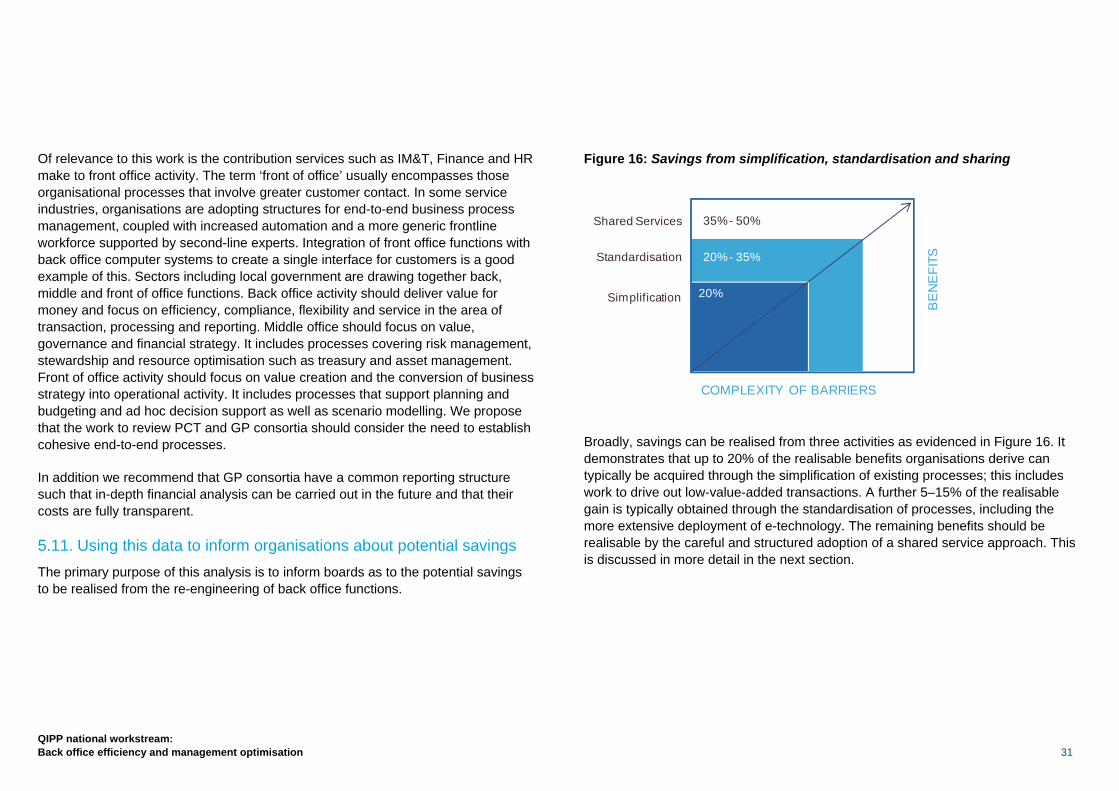
Figure 16: Savings from simplification, standardisation and sharing
Broadly, savings can be realised from three activities as evidenced in Figure 16. It demonstrates that up to 20% of the realisable benefits organisations derive can typically be acquired through the simplification of existing processes; this includes work to drive out low-value-added transactions. A further 5–15% of the realisable gain is typically obtained through the standardisation of processes, including the more extensive deployment of e-technology. The remaining benefits should be realisable by the careful and structured adoption of a shared service approach. This is discussed in more detail in the next section.
Shared Services
COMPLEXITY OF BARRIERS
35% - 50%
20% - 35%
20%
Standardisation
BE
NE
FITS
Simplification
32
QIPP national workstream: Back office efficiency and management optimisation
6.1. Transforming the organisation Research highlights that up to 90% of cost reduction exercises fail within three years, either by failing to deliver the identified savings from the start or because savings are made in the short term, but costs begin to creep back up over time.
Simply moving a function into a shared service or to a commercial partner will not reduce costs. Typically a commercial organisation will charge for re-engineering your organisation’s business processes, which will reduce the level of identified savings that will ultimately be achieved.
A trust needs to redefine what activities it does and how it does them. For this reason we advocate simplify, standardise and share based on a standard process model.
Many of these core processes can be improved in the first instance by simplifying the process. Standardising is more likely to require systems improvements. The advantages are that systems and processes are stabilised before transitioning to a shared service or outsourcing model, and it leverages local expertise to develop standard processes, simplifying the migration process.
Although some benefits can be realised quickly, as the processes improve it will take more time to realise significant benefits, and the benefits are dependent upon systems programme deployment schedules and prone to potential delays which need to be avoided. However, such improvements can happen in parallel to any
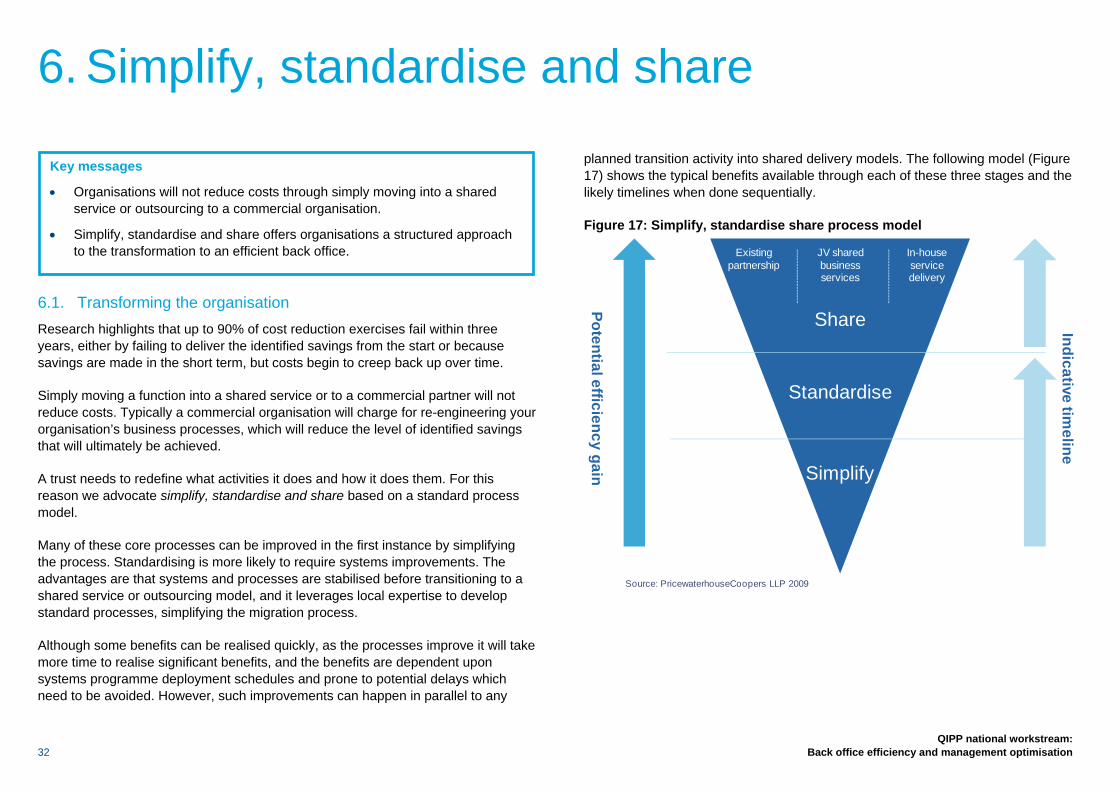
planned transition activity into shared delivery models. The following model (Figure 17) shows the typical benefits available through each of these three stages and the likely timelines when done sequentially.
Figure 17: Simplify, standardise share process model
Existing partnership
JV shared business services
In-house service delivery
Potential efficiency gain
Indicative timeline
Share
Standardise
Simplify
Source: PricewaterhouseCoopers LLP 2009
6. Simplify, standardise and share
Key messages
• Organisations will not reduce costs through simply moving into a shared service or outsourcing to a commercial organisation.
• Simplify, standardise and share offers organisations a structured approach to the transformation to an efficient back office.
QIPP national workstream: Back office efficiency and management optimisation 33
6.2. Simplification The objective of simplification is to ensure that processes, policies and procedures are simple to understand, follow and execute. It involves the following:
• A review of current processes corporately and within the back office functions;
• Challenging the current ways of delivering these processes across the organisation with a view to simplifying them;
• Evaluating whether each step of the process could be either eliminated, automated and/or the work shifted to other areas or staff to undertake;
• Use of lean to remove non-value-adding tasks;
• Use of workflow methodologies to optimise processes; and
• Templates and training manuals so that each employee is following the same process and policy.
6.3. Standardisation The objective of standardisation is to agree common ways of working across the organisation underpinned by a reduced number of systems that provide the functionality required to deliver leading practices and processes adopted in a standard way. It will also avoid the need for technology customisation or local variations. Standardisation involves the following:
• A review of current systems e.g. what systems are in place.
• A review of the current reports produced in each corporate functional area;
• Establishing standard operating procedures;
• Understanding the value of exceptions – assessing to what extent bespoke reports are actually required;
• Assessing to what extent spreadsheets and other stand-alone reporting formats are being used and consolidated to standard processes and solutions; and
• Assessing to what extent these reports could be rationalised.
6.4. Shared services Shared services should not be considered as outsourcing. It is the consolidation of standardised transaction processing to achieve economies of scale, service standardisation or improved data quality, whereby the services are delivered under a service level agreement by a specialist department or entity that remains part of the NHS or the wider public sector.
The scale of operation is an important determinant as to whether shared services are a good solution or not. Below a certain number of employees, it is unlikely that one organisation alone can justify the cost of establishing a shared services operation and whether it can achieve the required economies of scale. Hence, except in particularly large organisations, shared services tend to be established by a combination of organisations in some configuration, although one of these may be the lead player and host the operation.
Technology is important, particularly for organisations which are ultimately considering going to some form of shared service, as the total benefits will not be fully realised without some common or scalable platform, but too often the experience from organisations going through the transformation is that the technology solution becomes the essence of the change. Organisations often think they must implement a standard technology platform and common processes before moving to the shared service. In practice, the common platform can be significantly delayed and it is not uncommon to have a shared service with four or five systems. The resulting labour cost reduction and productivity gains can be invested in the technology. Also, once the processes are under the control of the shared service, it can become less difficult to standardise these processes.
34
QIPP national workstream: Back office efficiency and management optimisation
7.1. Introduction In this section we describe different ways in which organisations can begin to realise the benefits of improved efficiency on the journey to establishing a shared service, including the cost savings our benchmarking work has identified, through simplification and standardisation. The different approaches highlighted in this section are: • Activity-based costing; • Eliminating low-value-added activity; • Lean methodologies applied on existing activities; • Exploiting technology; • Leveraging cost reduction through scale; • Improving efficiency through matching resource to processes; and • Wider aggregation of services.
Outlined in this section are the actions that can be taken by organisations to generate significant efficiencies within their back office functions. Important to note is that any change has to be sustainable for the savings to be realised in the long term.
7.2. Activity-based costing It is vital that organisations determine which of their back office activities truly support the delivery of their priorities and are aligned with long-term strategic objectives. Only after this should managers focus on driving out inefficiencies, otherwise there is a risk that important ‘overhead’ activities could be damaged and costs increased as those activities are restored.
Therefore, rather than jumping straight in with cost reduction, an organisation should identify exactly what each department does, how well those products/services are used, their value and finally how efficiently they are being delivered.
It is important to focus on creating transparency in the true costs of overhead activities so that people at all levels of the organisation can make informed decisions regarding value for money and the real opportunities to reduce costs.
The initial step is to measure the current position accurately, identifying three things:
1 Key mission – what the function exists to do, e.g. a key mission in HR is to recruit and retain high quality staff;
2 Services/products – what a function actually produces, e.g. financial reports generated for the board; and
3 The fully loaded costs of the activities – i.e. assigning the full cost of people (FTEs) and resources for a department across each product/service they deliver. Essentially a form of activity-based costing.
7. Creating an efficient back office
Key messages
• There are a variety of ways in which a more efficient back office can be created.
• The approaches set out in this section are examples of ways to simplify, standardise and share back office functions and can be implemented before, during or after establishing a shared service.
• Many of these approaches have been tried and tested in parts of the NHS, so they have a track record of delivering efficiencies and service improvements.
• Trusts can undertake much of this work before the final transition to shared services in order to maximise the amount of savings that can be achieved and start to realise savings with immediate effect.
QIPP national workstream: Back office efficiency and management optimisation 35
This information then allows an organisation to identify the cost of each activity as well as a basis for considering how each contributes to the overall aims of the function. The organisation can then consider the most appropriate cost reduction strategies, for example:
• Reallocating resources to the highest value activities, e.g. cutting back on reports that may have little impact on business decisions;
• Changing the way services or products are delivered, e.g. through using ‘lean’ methodologies; and
• Centralising where appropriate, e.g. by sharing payroll services.
These strategies aim to ensure that all activities are aligned towards efficiently delivering the priorities and needs of their department and the trust as a whole. It is not simply about managing the same workload with fewer people or crudely cutting the services that are provided. Whilst time consuming, this approach ensures that organisations rigorously review the need for established activities and understand the current cost of such work. In consequence less activity is undertaken and unnecessary spend is eliminated.
Case study
A trust in the South of England has used activity-based costing (ABC) techniques to review a number of its corporate and frontline services. The use of ABC to assess the cost of deployment of facilities staff, including cleaning, was the first project of its kind in the trust. ABC techniques enabled the trust to identify the tasks and processes that staff were doing and the time/cost in conducting those activities. The results highlighted: large variations in service across the hospital between different wards and departments; low value activities costing large amounts of money; and inefficiencies in some processes (poor materials used in buildings that increased cleaning time, variation in equipment etc). The trust identified opportunity to reduce cost by just over 11%, after redeploying some of the efficiency into better outcomes.
7.3. Eliminating waste and low-value-added activity A number of suggestions have been made from within the service to reduce or eliminate low-value-added activity, which in essence is part of the simplification process all organisations should go through prior to moving to a shared service model. In establishing a lean approach to back office functions, it is critical that work is undertaken to drive out low-value-added activity. This is a key task in driving efficiency and reducing organisational spend. It can be achieved through a variety of techniques:
• Reviewing the timing and frequency of activities;
• Reducing the need for physical transfer between sites;
• Standardisation and reducing the need for variation;
• Automation; and
• Lean methodologies.
A number of examples are highlighted in Table 8 below, with an explanation of the potential benefits to organisations. Further details to assist organisations in reviewing their back office specifications are available at www.nhsconfed.org/QIPPbackoffice.
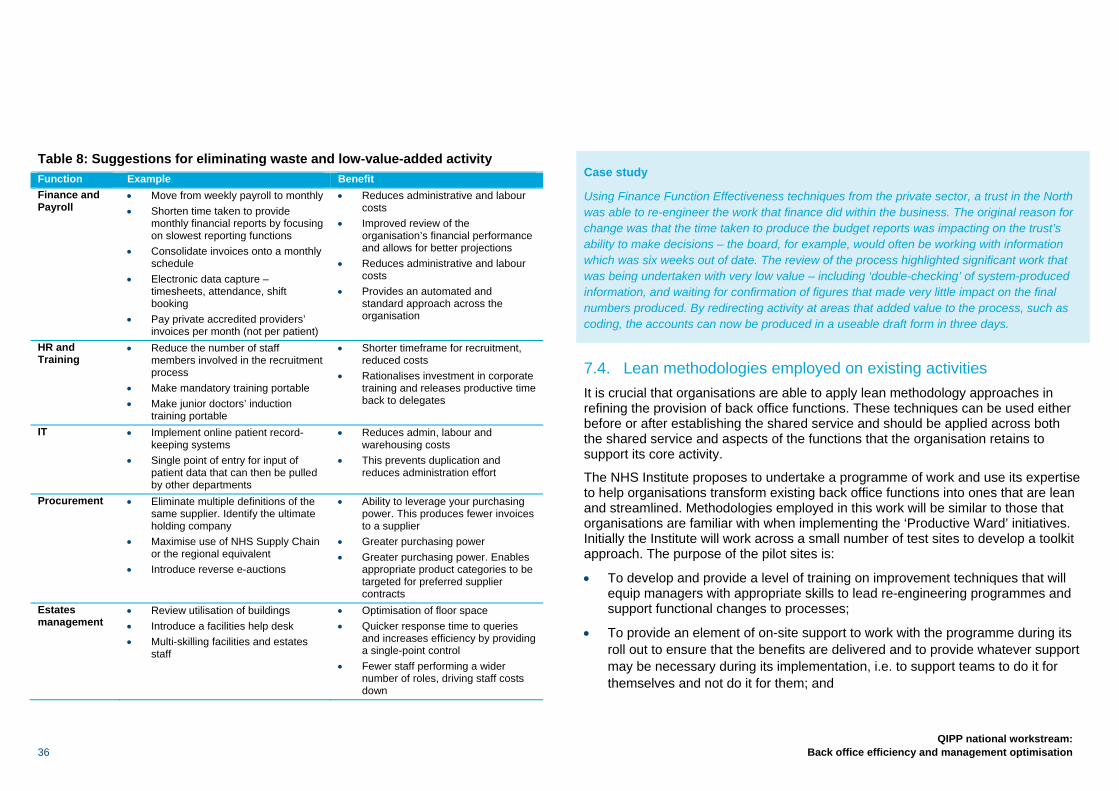
36
QIPP national workstream: Back office efficiency and management optimisation
Table 8: Suggestions for eliminating waste and low-value-added activity Function Example Benefit Finance and Payroll
• Move from weekly payroll to monthly • Shorten time taken to provide
monthly financial reports by focusing on slowest reporting functions
• Consolidate invoices onto a monthly schedule
• Electronic data capture – timesheets, attendance, shift booking
• Pay private accredited providers’ invoices per month (not per patient)
• Reduces administrative and labour costs
• Improved review of the organisation’s financial performance and allows for better projections
• Reduces administrative and labour costs
• Provides an automated and standard approach across the organisation
HR and Training
• Reduce the number of staff members involved in the recruitment process
• Make mandatory training portable • Make junior doctors’ induction
training portable
• Shorter timeframe for recruitment, reduced costs
• Rationalises investment in corporate training and releases productive time back to delegates
IT • Implement online patient record-keeping systems
• Single point of entry for input of patient data that can then be pulled by other departments
• Reduces admin, labour and warehousing costs
• This prevents duplication and reduces administration effort
Procurement • Eliminate multiple definitions of the same supplier. Identify the ultimate holding company
• Maximise use of NHS Supply Chain or the regional equivalent
• Introduce reverse e-auctions
• Ability to leverage your purchasing power. This produces fewer invoices to a supplier
• Greater purchasing power • Greater purchasing power. Enables
appropriate product categories to be targeted for preferred supplier contracts
Estates management
• Review utilisation of buildings • Introduce a facilities help desk • Multi-skilling facilities and estates
staff
• Optimisation of floor space • Quicker response time to queries
and increases efficiency by providing a single-point control
• Fewer staff performing a wider number of roles, driving staff costs down
Case study
Using Finance Function Effectiveness techniques from the private sector, a trust in the North was able to re-engineer the work that finance did within the business. The original reason for change was that the time taken to produce the budget reports was impacting on the trust’s ability to make decisions – the board, for example, would often be working with information which was six weeks out of date. The review of the process highlighted significant work that was being undertaken with very low value – including ‘double-checking’ of system-produced information, and waiting for confirmation of figures that made very little impact on the final numbers produced. By redirecting activity at areas that added value to the process, such as coding, the accounts can now be produced in a useable draft form in three days.
7.4. Lean methodologies employed on existing activities It is crucial that organisations are able to apply lean methodology approaches in refining the provision of back office functions. These techniques can be used either before or after establishing the shared service and should be applied across both the shared service and aspects of the functions that the organisation retains to support its core activity.
The NHS Institute proposes to undertake a programme of work and use its expertise to help organisations transform existing back office functions into ones that are lean and streamlined. Methodologies employed in this work will be similar to those that organisations are familiar with when implementing the ‘Productive Ward’ initiatives. Initially the Institute will work across a small number of test sites to develop a toolkit approach. The purpose of the pilot sites is:
• To develop and provide a level of training on improvement techniques that will equip managers with appropriate skills to lead re-engineering programmes and support functional changes to processes;
• To provide an element of on-site support to work with the programme during its roll out to ensure that the benefits are delivered and to provide whatever support may be necessary during its implementation, i.e. to support teams to do it for themselves and not do it for them; and

QIPP national workstream: Back office efficiency and management optimisation 37
• To generate and provide a set of tools that will enable the delivery of a uniform programme and to steer its implementation to ensure that trusts are able to realise the benefits of lean methodologies.
In addition, the Institute will ensure the delivery of e-learning modules that will provide all back office staff with a rapid base level of training and understanding and a level of accreditation in lean and lean techniques. Accelerated learning events will be available to train the trainer and will be supported by on-site expertise.
The NHS Institute has agreed to provide the service with a number of products specifically designed to build capacity and capability in each organisation. Should you wish to take advantage of these products please contact Julie Stenning direct at the Institute on [email protected].
7.5. Exploiting technology Enhanced automation offers provider organisations a cost-effective approach to integrating processes, technology and staff on a standard platform. It minimises paper transactions, facilitates the flow of information and improves data collection, thus increasing efficiencies and eliminating errors.
There are a number of benefits that can be realised through greater use of technology. These include:
• Improvements in the quality of service experienced by clients;
• Reduced headcount, with consequent savings freed to support frontline services;
• A more consistent and uniform approach to business processes through automation of standard process flows; and
• Rapid turnaround of transactions requiring approval and/or exception handling (workflow).
Organisations making progress towards automation may also realise unexpected benefits. These benefits arise through enhanced organisational responsiveness and adaptiveness and support more innovation. These benefits are not a direct consequence of automation but secondary effects that flow from enabling the organisation to respond in different ways. An example is North East Patches and its use of a finance and procurement technology platform for NHS organisations that is described in the case study below. Electronic Staff Records (ESR) is a similar technology platform which covers the whole of the NHS, providing payroll and HR services.
Case study
A primary care trust in the North of England implemented a new Oracle ‘ERP’ system into its operations to improve many areas of corporate centre performance – but specifically focusing on finance and procurement. The replacement of multiple spreadsheets and independent systems with one joined-up system has released significant benefits in terms of corporate staff time saved, but has also had an impact on those that use the services by reducing the time taken to procure goods, through faster and better information and through a significant reduction in the use of paper processes and re-keyed information.
There is a broad range of technology solutions and applications, some of which are detailed below.
E-rostering
To meet the challenge of controlling workforce costs and, particularly, temporary staffing costs, support has come from the technology available to managers to enable them to draw up cost-efficient and effective rosters. Provider organisations are increasingly using e-rostering packages as the solution – providing better rosters, reducing reliance on expensive temporary staffing resources and consuming far less management time. The Healthcare Finance Management Association has produced a paper on the benefits of e-rostering and typical solutions.7 It also reviews
7 HFMA briefing: E-Rostering, July 2008
38
QIPP national workstream: Back office efficiency and management optimisation
the experience of four trusts in implementing e-rostering: South Devon Healthcare NHS Foundation Trust, Salford Royal NHS Foundation Trust, Cambridge University Hospitals NHS Foundation Trust and Homerton University Hospital NHS Foundation Trust.
Digital imaging
Examples of digital imaging include scanning and OCR (optical character recognition). This facilitates document movement around an organisation and also in and out of organisations. It also enables electronic storage of documents and supports access to information. The benefits of this are considerable as the traditional model of storage, retrieval and use of hard copy documentation is costly and also carries a risk of misplacing or losing documents.
Document scanning and electronic document management systems offer simplification and standardisation of each step of the process. The process offers users quick retrieval of information and enables the organisation to remove administrative staff responsible for delivering and keeping track of where hard-copy data is stored and where it physically is at any given time and who should be able to access it.
Efficiency is increased since all areas of electronic document management require a lot less time than any traditional hard-copy document management system would.
E-invoicing
E-invoicing is typically defined as the electronic delivery of an invoice and other information from an organisation. A proper e-invoice scheme can provide benefits through elimination of:
• Printing a paper invoice and putting it in the envelope;
• The mailing costs of the paper invoice;
• Opening the invoice letter and archiving the paper invoice; and
• Manual input of the invoice data to the payables/accounting system at the payer. It provides a basis for the re-engineering of accounts payable departments with significant savings for organisations.
E-HR
The Institute for Employment Studies defines e-HR as ‘the application of conventional, web and voice technologies to improve HR administration, transactions and process performance’. It involves using technology to provide HR services, such as recording and monitoring systems, automating aspects of recruitment and disseminating information such as HR policies on the intranet.
HR management information systems can also provide a means of collecting and monitoring performance indicators, which will provide evidence of whether or not organisations are meeting their objectives.
e-HR can also be used to streamline administrative processes and facilitate pay modelling.
In performance management e-HR can help consolidate, rationalise and monitor employee feedback through automated appraisal records, 360-degree appraisals and competency framework systems. E-HR can help with the evaluation of skills and development opportunities. In addition, there may be greater scope to enhance skills through the use of e-learning methods. Sickness absence can be managed more effectively by using e-HR technologies such as electronic monitoring. E-HR can be used to accurately monitor and promote action to support equality and diversity in the workforce.
QIPP national workstream: Back office efficiency and management optimisation 39
Case study
NOMS (National Offender Management Service) provides HR, finance and procurement services to staff in NOMS headquarters, the Prison Service and the Home Office.
The shared HR service provides a single source of HR support and advice through a customer-focused shared service centre and a self-service system. This has enabled a reduction in the number of staff engaged in HR administration while also providing greater consistency in advice and decision making.
Key benefits have included:
70% to 90% of queries resolved on first contact (up from 50%);
Annual savings of £30m in running costs (across finance, HR & procurement).
A key feature in the success was the training and engagement of all staff prior to going live.
Workflow
Workflow is a process tool which delivers the right work to the right people at the right time and, in doing so, optimises the processing time within your operations. Workflow solutions manage, distribute and monitor work as it progresses through pre-defined business processes and therefore assist with the efficient running of an organisation’s operations. Workflow enables a range of benefits including process visibility – which is essential for tracking progress and improvement.
The benefit of workflow technology is that it streamlines and simplifies clinical and business processes, connecting providers directly to the information they need – where, when, and how they need it. By managing care transitions and information gaps between diverse systems, departments and facilities, workflow technology can deliver crucial patient information with speed, efficiency and logic. It bridges the gap between the business and the clinicians.
7.6. Wider aggregation of services We have considered specifically the advantages to the NHS of providing specific functions at scale, thus maximising the benefits that would accrue from wider
aggregation. In reviewing back office functions three transactional areas merit more detailed consideration in terms of how these services are provided for the NHS:
• Payroll;
• Family health services (FHS); and
• Vehicle fleet management.
With regard to payroll services, the majority of NHS organisations have some experience of shared service consortia in the provision of this service. Relatively few consortia, however, have as yet been able to take advantage of e-time sheets, e-pay slips, e-expenses and other forms of technology which offer scope to improve the timeliness of the payroll service and drive down costs even further. Provider organisations naturally remain free to choose a payroll provider of their choice. Most providers would, however, benefit from an independent appraisal of options which allowed them to compare their current service and costs with options to provide payroll services on a far wider aggregated basis. We are therefore proposing, with the agreement of the FTN, that work is commissioned with representatives of the provider units across the 10 SHAs to develop options for wider consideration by boards for the centralisation of payroll services on a regional, sub-regional or national basis. To date SBS has been successful in expanding payroll services to approximately 52 trusts. We would propose that it continues to offer an option in providing these services taking advantage of e-technology. Specifically SBS estimates that the introduction of e-technology will drive down current costs by between 20–30%.
Family health services is a similar function in terms of its transactional nature which affords the opportunity for it to be provided by high quality service providers using a trading centre approach. We propose that the future options for the provision of this service are reviewed as part of the work being led by David Flory. Current providers, such as SBS and LaSCA, cover a significant number of PCTs, but neither has the capacity at present to offer service across the whole of the NHS. With the greater adoption of technology however, both have the capacity to substantially expand their coverage to far more commissioning organisations.
40
QIPP national workstream: Back office efficiency and management optimisation
Vehicle fleet management is another area where there has been a drive towards shared service provision. Currently across the NHS there are upwards of 20,000 ‘lease cars’. Management of these fleets has traditionally been delivered in-house by individual trusts but over the last few years more trusts have outsourced this to a small number of recognised specialist fleet management organisations, using both the NHS and the private sector. It is presently estimated that 60% of NHS vehicles are managed in this way. These organisations often demonstrate both expertise and economies of scale. We would recommend that all organisations use an established vehicle fleet management provider. Analysis shows that through increased efficiency the service as a whole would save £3.5m.
It is also evident that there is significant variation in reimbursement for mileage paid to staff relative to their type of vehicles and the policies adopted by individual organisations that operate lease car and private schemes. Derwent Shared Services has recently undertaken an exercise to review the impact of standardisation. The results show the potential for significant savings estimated at £14m per annum.
An average lease car will cover 6,000 miles per annum. There are approximately 22,000 lease vehicles in the NHS (including pool vehicles); the fleet covers around 130m miles per annum. Every 1p change in mileage allowance equates to a saving across the NHS of £1.3m.
7.7. Leveraging cost reduction through scale The size and complexity of the NHS affords the opportunity to use its critical mass and purchasing power to advantage in leveraging sizeable efficiencies and cost reductions through its scale. This is a key driver behind the work proposed to reshape provision of PCT and GP consortia back office functions.
The data contained in Section 5 highlights that larger organisations achieve greater efficiency in the delivery of their back office functions. To capitalise on this we would encourage provider organisations, when considering future options for service provision, to ensure that the partnering options achieve a scale necessary to drive significant efficiencies from economies of scale. As a minimum, providers should work across whole health economies when considering establishing trading fund arrangements which should serve a minimum of 20,000 employees. Joint ventures or outsourcing will typically cover a far larger workforce and thus generate natural efficiencies from scale.
Case study
There are numerous examples of simple and effective ways of sharing capacity and reducing costs. Two groups of trusts in the North West SHA have shown particularly strong examples of this behaviour which can produce synergy benefits beyond cost savings. One set of trusts has a shared IT and HR function, enabling them not only to reduce costs but also to secure roles (such as Organisational Development Manager) that they would not be able to afford as individual trusts. Another group share elements of procurement and estates with similar benefits in reduced cost and increased scope of service.
Case study
Cost Improvement plans for corporate areas are often based around the individual department silos – HR, Finance, Information etc. Only trusts that have engendered a ‘corporate centre’ culture rather than a departmental silo are able to consider a wider aggregation of services in order to offer a better service for less money. A trust in the Midlands has done just that by considering the services offered to directorates across the whole of the corporate centre – it now provides services into the service lines using a combined team of information, HR and finance staff to reduce the number of individual touch-points with the service lines, to create more flexible and efficient teams, and to provide a single point of contact to permit better understanding of the needs of the corporate centre customers.
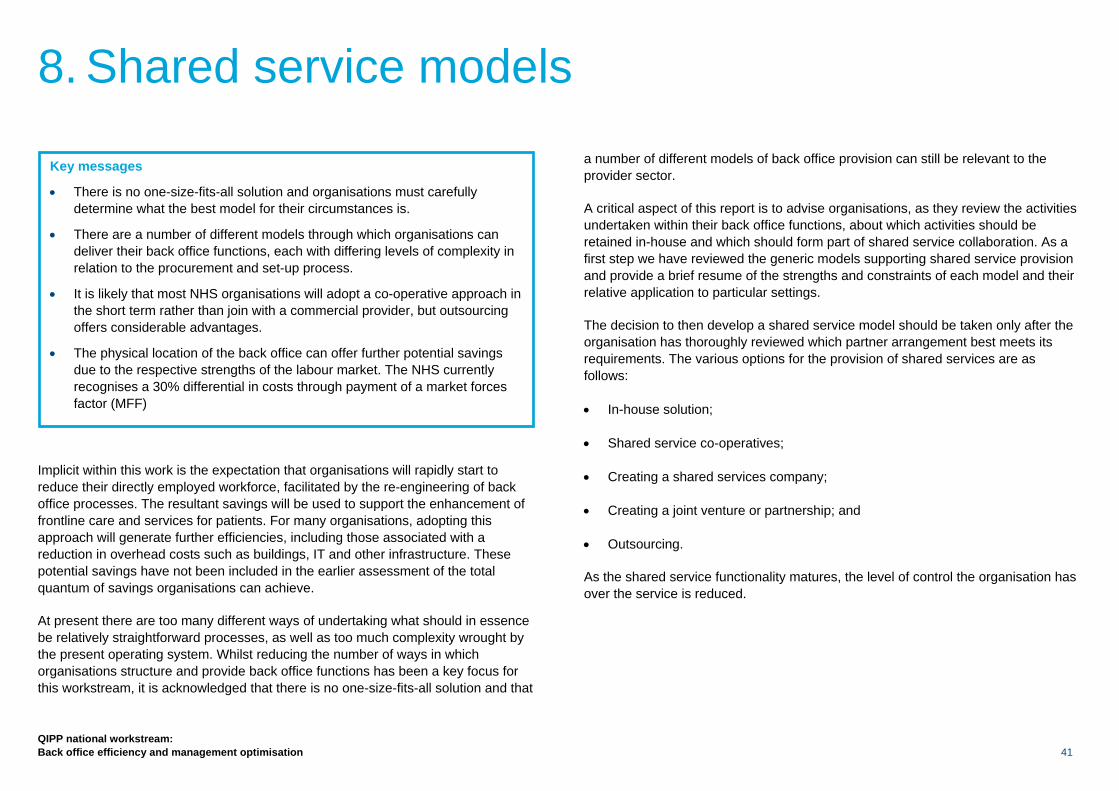
QIPP national workstream: Back office efficiency and management optimisation 41
Implicit within this work is the expectation that organisations will rapidly start to reduce their directly employed workforce, facilitated by the re-engineering of back office processes. The resultant savings will be used to support the enhancement of frontline care and services for patients. For many organisations, adopting this approach will generate further efficiencies, including those associated with a reduction in overhead costs such as buildings, IT and other infrastructure. These potential savings have not been included in the earlier assessment of the total quantum of savings organisations can achieve.
At present there are too many different ways of undertaking what should in essence be relatively straightforward processes, as well as too much complexity wrought by the present operating system. Whilst reducing the number of ways in which organisations structure and provide back office functions has been a key focus for this workstream, it is acknowledged that there is no one-size-fits-all solution and that
a number of different models of back office provision can still be relevant to the provider sector.
A critical aspect of this report is to advise organisations, as they review the activities undertaken within their back office functions, about which activities should be retained in-house and which should form part of shared service collaboration. As a first step we have reviewed the generic models supporting shared service provision and provide a brief resume of the strengths and constraints of each model and their relative application to particular settings.
The decision to then develop a shared service model should be taken only after the organisation has thoroughly reviewed which partner arrangement best meets its requirements. The various options for the provision of shared services are as follows:
• In-house solution;
• Shared service co-operatives;
• Creating a shared services company;
• Creating a joint venture or partnership; and
• Outsourcing.
As the shared service functionality matures, the level of control the organisation has over the service is reduced.
8. Shared service models
Key messages
• There is no one-size-fits-all solution and organisations must carefully determine what the best model for their circumstances is.
• There are a number of different models through which organisations can deliver their back office functions, each with differing levels of complexity in relation to the procurement and set-up process.
• It is likely that most NHS organisations will adopt a co-operative approach in the short term rather than join with a commercial provider, but outsourcing offers considerable advantages.
• The physical location of the back office can offer further potential savings due to the respective strengths of the labour market. The NHS currently recognises a 30% differential in costs through payment of a market forces factor (MFF)
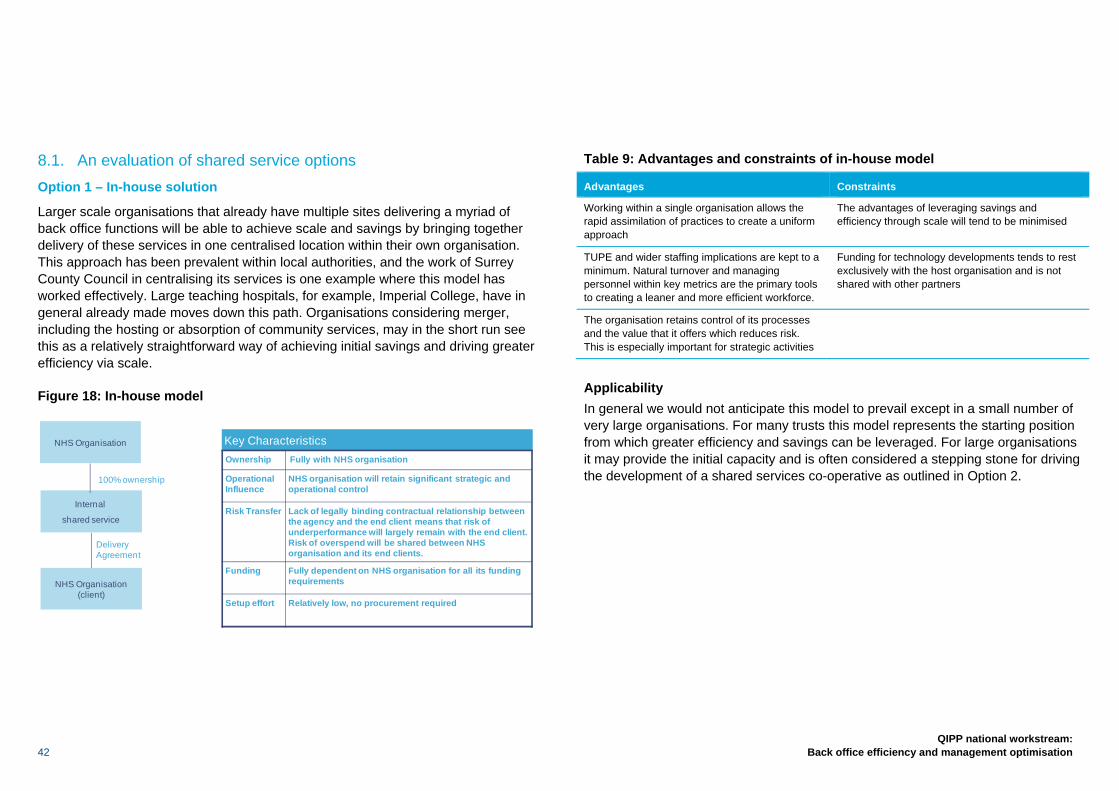
42
QIPP national workstream: Back office efficiency and management optimisation
8.1. An evaluation of shared service options Option 1 – In-house solution
Larger scale organisations that already have multiple sites delivering a myriad of back office functions will be able to achieve scale and savings by bringing together delivery of these services in one centralised location within their own organisation. This approach has been prevalent within local authorities, and the work of Surrey County Council in centralising its services is one example where this model has worked effectively. Large teaching hospitals, for example, Imperial College, have in general already made moves down this path. Organisations considering merger, including the hosting or absorption of community services, may in the short run see this as a relatively straightforward way of achieving initial savings and driving greater efficiency via scale.
Figure 18: In-house model
Table 9: Advantages and constraints of in-house model
Advantages Constraints
Working within a single organisation allows the rapid assimilation of practices to create a uniform approach
The advantages of leveraging savings and efficiency through scale will tend to be minimised
TUPE and wider staffing implications are kept to a minimum. Natural turnover and managing personnel within key metrics are the primary tools to creating a leaner and more efficient workforce.
Funding for technology developments tends to rest exclusively with the host organisation and is not shared with other partners
The organisation retains control of its processes and the value that it offers which reduces risk. This is especially important for strategic activities
Applicability In general we would not anticipate this model to prevail except in a small number of very large organisations. For many trusts this model represents the starting position from which greater efficiency and savings can be leveraged. For large organisations it may provide the initial capacity and is often considered a stepping stone for driving the development of a shared services co-operative as outlined in Option 2.
NHS Organisation (client)
DeliveryAgreement
Internal
shared service
NHS Organisation
100% ownership
Key CharacteristicsOwnership Fully with NHS organisation
Operational Influence
NHS organisation will retain significant strategic and operational control
Risk Transfer Lack of legally binding contractual relationship between the agency and the end client means that risk of underperformance will largely remain with the end client. Risk of overspend will be shared between NHS organisation and its end clients.
Funding Fully dependent on NHS organisation for all its funding requirements
Setup effort Relatively low, no procurement required

QIPP national workstream: Back office efficiency and management optimisation 43
Case study
Cheshire HR Service is a single function service provided to three organisations. Cheshire HR Service employs 125 staff drawn from the three founding organisations and provides HR services back. There is no retained HR staff outside the virtual organisation. The new business- and customer-focused approach has led to many service benefits:
• Improved customer satisfaction;
• Increased knowledge sharing;
• Better internal benchmarking;
• More commercial and cost-aware attitude;
• Higher productivity;
• Proactive workload balancing and greater flexibility; and
• Better career opportunities and training for HR staff.
Option 2 – Shared services co-operative
A host-sponsored agency delivering shared services to other organisations through non legally binding service agreements. In Section 12 we deal specifically with the sharing of risk for those organisations considering either hosting or participating as a client in this venture. Agreements are typically based on service level agreements (SLAs) and operating level agreements (OLAs) rather than legally binding contracts.
Figure 19: Shared service co-operative
Examples: Anglia Support Partnership
Other ClientsCo-operative partners
DeliveryAgreement
Shared ServiceCo-operative
NHS organisation (host)
100% ownership
Key CharacteristicsOwnership Fully with co-operative partners
Operational Influence
Will retain significant strategic and operational control
Risk Transfer Lack of legally binding contractual relationship between the co-operative and the end client means that risk of underperformance will largely remain with the end client. Risk of overspend will be shared between host and its co-operative partners.
Funding Co-operative can retain profits to reinvest in its services, but remaining funding requirements need to be fully met by partners
Setup effort Relatively low, no procurement required
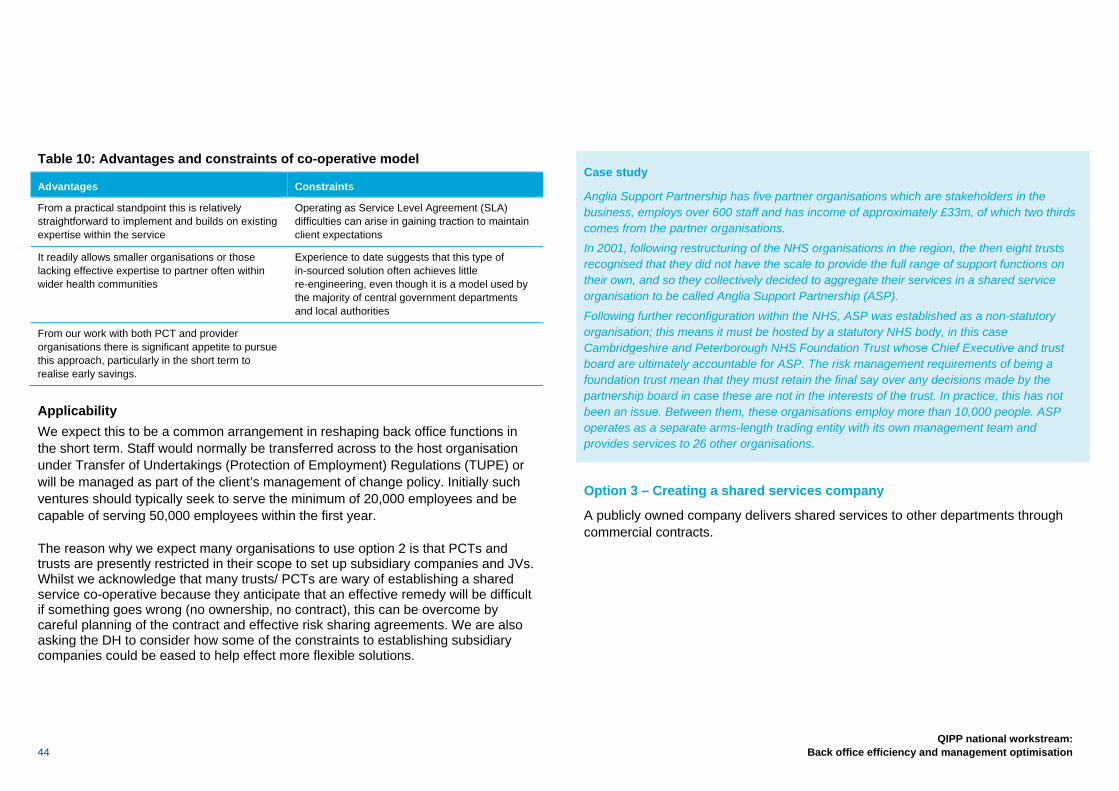
44
QIPP national workstream: Back office efficiency and management optimisation
Table 10: Advantages and constraints of co-operative model
Advantages Constraints
From a practical standpoint this is relatively straightforward to implement and builds on existing expertise within the service
Operating as Service Level Agreement (SLA) difficulties can arise in gaining traction to maintain client expectations
It readily allows smaller organisations or those lacking effective expertise to partner often within wider health communities
Experience to date suggests that this type of in-sourced solution often achieves little re-engineering, even though it is a model used by the majority of central government departments and local authorities
From our work with both PCT and provider organisations there is significant appetite to pursue this approach, particularly in the short term to realise early savings.
Applicability We expect this to be a common arrangement in reshaping back office functions in the short term. Staff would normally be transferred across to the host organisation under Transfer of Undertakings (Protection of Employment) Regulations (TUPE) or will be managed as part of the client’s management of change policy. Initially such ventures should typically seek to serve the minimum of 20,000 employees and be capable of serving 50,000 employees within the first year.
The reason why we expect many organisations to use option 2 is that PCTs and trusts are presently restricted in their scope to set up subsidiary companies and JVs. Whilst we acknowledge that many trusts/ PCTs are wary of establishing a shared service co-operative because they anticipate that an effective remedy will be difficult if something goes wrong (no ownership, no contract), this can be overcome by careful planning of the contract and effective risk sharing agreements. We are also asking the DH to consider how some of the constraints to establishing subsidiary companies could be eased to help effect more flexible solutions.
Case study
Anglia Support Partnership has five partner organisations which are stakeholders in the business, employs over 600 staff and has income of approximately £33m, of which two thirds comes from the partner organisations.
In 2001, following restructuring of the NHS organisations in the region, the then eight trusts recognised that they did not have the scale to provide the full range of support functions on their own, and so they collectively decided to aggregate their services in a shared service organisation to be called Anglia Support Partnership (ASP).
Following further reconfiguration within the NHS, ASP was established as a non-statutory organisation; this means it must be hosted by a statutory NHS body, in this case Cambridgeshire and Peterborough NHS Foundation Trust whose Chief Executive and trust board are ultimately accountable for ASP. The risk management requirements of being a foundation trust mean that they must retain the final say over any decisions made by the partnership board in case these are not in the interests of the trust. In practice, this has not been an issue. Between them, these organisations employ more than 10,000 people. ASP operates as a separate arms-length trading entity with its own management team and provides services to 26 other organisations.
Option 3 – Creating a shared services company
A publicly owned company delivers shared services to other departments through commercial contracts.
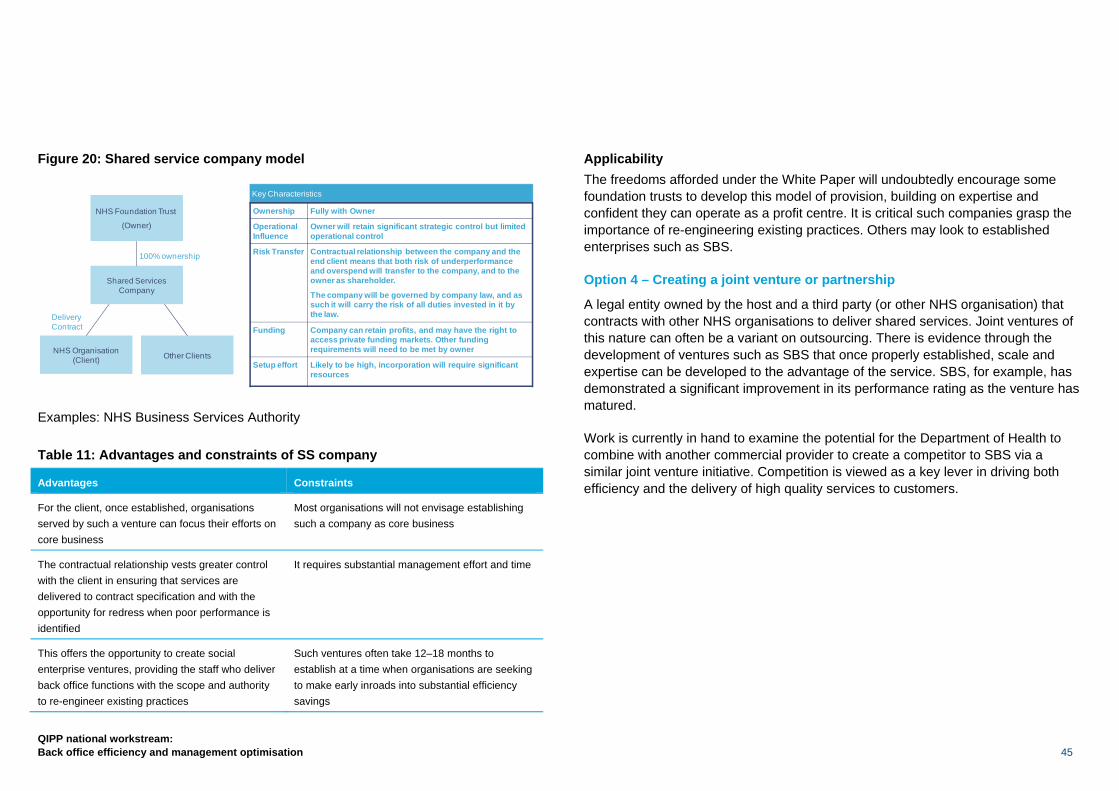
QIPP national workstream: Back office efficiency and management optimisation 45
Figure 20: Shared service company model
Examples: NHS Business Services Authority Table 11: Advantages and constraints of SS company
Advantages Constraints
For the client, once established, organisations served by such a venture can focus their efforts on core business
Most organisations will not envisage establishing such a company as core business
The contractual relationship vests greater control with the client in ensuring that services are delivered to contract specification and with the opportunity for redress when poor performance is identified
It requires substantial management effort and time
This offers the opportunity to create social enterprise ventures, providing the staff who deliver back office functions with the scope and authority to re-engineer existing practices
Such ventures often take 12–18 months to establish at a time when organisations are seeking to make early inroads into substantial efficiency savings
Applicability The freedoms afforded under the White Paper will undoubtedly encourage some foundation trusts to develop this model of provision, building on expertise and confident they can operate as a profit centre. It is critical such companies grasp the importance of re-engineering existing practices. Others may look to established enterprises such as SBS.
Option 4 – Creating a joint venture or partnership
A legal entity owned by the host and a third party (or other NHS organisation) that contracts with other NHS organisations to deliver shared services. Joint ventures of this nature can often be a variant on outsourcing. There is evidence through the development of ventures such as SBS that once properly established, scale and expertise can be developed to the advantage of the service. SBS, for example, has demonstrated a significant improvement in its performance rating as the venture has matured.
Work is currently in hand to examine the potential for the Department of Health to combine with another commercial provider to create a competitor to SBS via a similar joint venture initiative. Competition is viewed as a key lever in driving both efficiency and the delivery of high quality services to customers.
Other ClientsNHS Organisation (Client)
DeliveryContract
Shared ServicesCompany
NHS Foundation Trust
(Owner)
100% ownership
Key Characteristics
Ownership Fully with Owner
Operational Influence
Owner will retain significant strategic control but limited operational control
Risk Transfer Contractual relationship between the company and the end client means that both risk of underperformance and overspend will transfer to the company, and to the owner as shareholder.
The company will be governed by company law, and as such it will carry the risk of all duties invested in it by the law.
Funding Company can retain profits, and may have the right to access private funding markets. Other funding requirements will need to be met by owner
Setup effort Likely to be high, incorporation will require significant resources

46
QIPP national workstream: Back office efficiency and management optimisation
Figure 21: Joint venture/partnership model
Examples: NHS Shared Business Services, SouthWest One Table 12: Advantages and constraints of joint venture
Advantages Constraints
Typically there is a concentration of expertise in delivering back office functions
Some of the profit is redistributed outside the NHS
Such ventures by nature of their scale typically offer better value for money for the customer. The use of single IT platforms drives simplification and consistency of approach across the NHS, delivering substantial benefits for customers and the taxpayer
There can at times be a divergence and incongruence between the provider and customer goals
The cost of employment and, subject to negotiation, the cost of redeployment can be spread over an agreed time period, therefore releasing early savings to the NHS
Historically there have been difficulties in extending services beyond the initial suite of those provided. This often requires separate negotiations with each partner
This can bring greater innovation to the sector through working closely with commercial partners as opposed to option 3.
Applicability There is a natural limit to the number of joint ventures the service can establish. Too many will obviate optimising the advantages of scale in driving efficiency savings for the NHS. Presently, there is insufficient capacity to serve all NHS providers. There is the potential, however, for example within the South West Strategic Health Authority, for a joint venture company to offer a suite of services across the whole of a geographic area, subject to agreement with individual trusts, and if realised this would offer substantial operating gains.
Case study
Southwest One is a public/private shared service joint venture between Somerset County Council, Taunton Deane Borough Council, Avon & Somerset Police and IBM.
The original partnership considered (but rejected) straight outsourcing, in part because they wished to second rather than transfer staff, but also, by using the private sector in a joint venture, efficiency savings could be quickly achieved.
The agreement with IBM includes a profit-sharing arrangement, with IBM bearing the greatest share of risk and reward. This has been vital to deliver early cash savings to the partners as IBM is able to absorb the risks on service delivery and set-up costs in the early years.
Option 5 – Outsourcing
A private sector supplier delivers shared services to providers through commercial contracts. It is envisaged that this will become a more common feature of back office provision. Undoubtedly the commercial sector has substantial expertise in providing these services for multinational and FTSE100 companies. There is less expertise within the health field and this does engender some reticence in partnering with commercial providers. As their market penetration develops and there is building
JV Company
NHS Foundation Trust(Owner)
3rd Party supplier
DWP (client) Other Clients
X% Ownership Y% Ownership
Delivery Contract
Key Characteristics
Ownership Host will own majority or minority of the JV, depending on the commercial agreement
Operational Influence
Host may retain some strategic control but operational control is likely to be limited, depending on the overall commercial framework
Risk Transfer Contractual relationship between the company and the end client means that both risk of underperformance and overspend will transfer to the company, and partly transfer to host as shareholder in line with the size of its % ownership.
Funding Company can retain profits, can obtain funding from the supplier and the wider private funding markets.
Setup effort Likely to be high, as the supplier will need to be selected through a procurement process
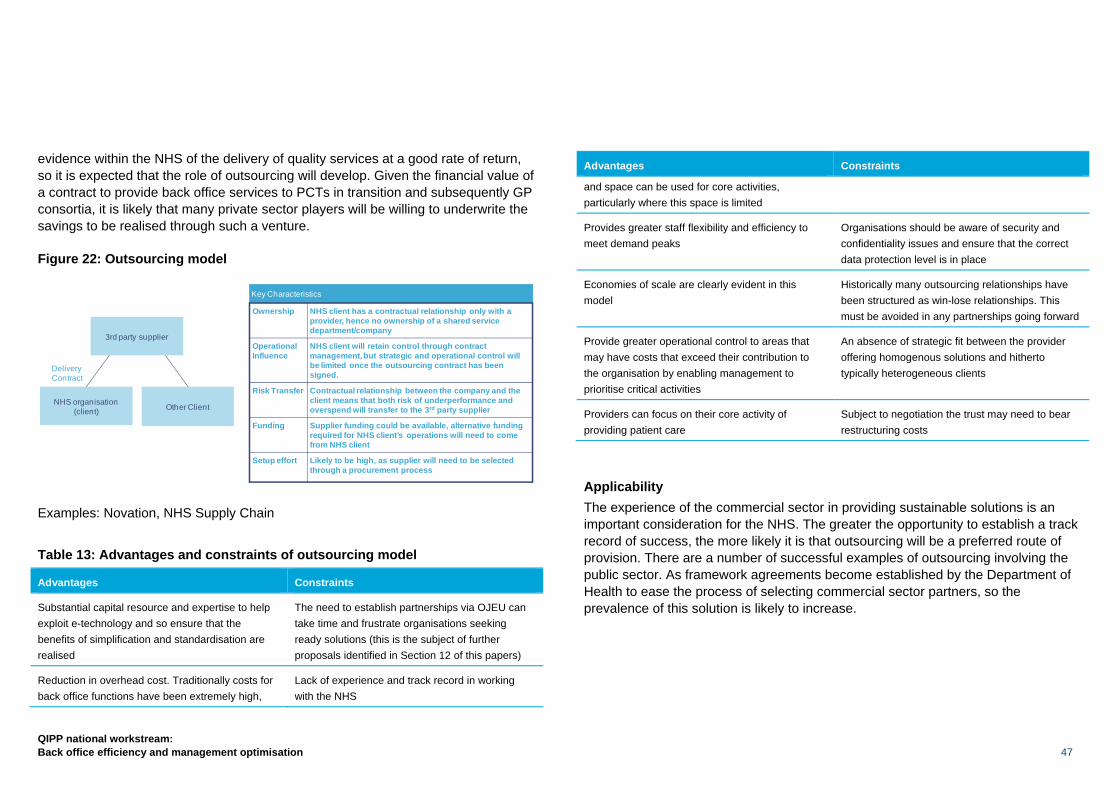
QIPP national workstream: Back office efficiency and management optimisation 47
evidence within the NHS of the delivery of quality services at a good rate of return, so it is expected that the role of outsourcing will develop. Given the financial value of a contract to provide back office services to PCTs in transition and subsequently GP consortia, it is likely that many private sector players will be willing to underwrite the savings to be realised through such a venture.
Figure 22: Outsourcing model
Examples: Novation, NHS Supply Chain Table 13: Advantages and constraints of outsourcing model
Advantages Constraints
Substantial capital resource and expertise to help exploit e-technology and so ensure that the benefits of simplification and standardisation are realised
The need to establish partnerships via OJEU can take time and frustrate organisations seeking ready solutions (this is the subject of further proposals identified in Section 12 of this papers)
Reduction in overhead cost. Traditionally costs for back office functions have been extremely high,
Lack of experience and track record in working with the NHS
Advantages Constraints
and space can be used for core activities, particularly where this space is limited
Provides greater staff flexibility and efficiency to meet demand peaks
Organisations should be aware of security and confidentiality issues and ensure that the correct data protection level is in place
Economies of scale are clearly evident in this model
Historically many outsourcing relationships have been structured as win-lose relationships. This must be avoided in any partnerships going forward
Provide greater operational control to areas that may have costs that exceed their contribution to the organisation by enabling management to prioritise critical activities
An absence of strategic fit between the provider offering homogenous solutions and hitherto typically heterogeneous clients
Providers can focus on their core activity of providing patient care
Subject to negotiation the trust may need to bear restructuring costs
Applicability The experience of the commercial sector in providing sustainable solutions is an important consideration for the NHS. The greater the opportunity to establish a track record of success, the more likely it is that outsourcing will be a preferred route of provision. There are a number of successful examples of outsourcing involving the public sector. As framework agreements become established by the Department of Health to ease the process of selecting commercial sector partners, so the prevalence of this solution is likely to increase.
Other ClientNHS organisation (client)
DeliveryContract
3rd party supplier
Key Characteristics
Ownership NHS client has a contractual relationship only with a provider, hence no ownership of a shared service department/company
Operational Influence
NHS client will retain control through contract management, but strategic and operational control will be limited once the outsourcing contract has been signed.
Risk Transfer Contractual relationship between the company and the client means that both risk of underperformance and overspend will transfer to the 3rd party supplier
Funding Supplier funding could be available, alternative funding required for NHS client’s operations will need to come from NHS client
Setup effort Likely to be high, as supplier will need to be selected through a procurement process
48
QIPP national workstream: Back office efficiency and management optimisation
Case study
Southampton University Hospital has been consistently using partnerships and outsourcing since 2006. This has involved both sharing services with other NHS organisations and actually outsourcing others. They began with some of the more transactional functions such as payroll but have extended to others, and the trust is continually reassessing opportunities. The outsourcing of their procurement and supply functions has saved £2–3m per annum, as well as an extra £300,000 from freeing up space for other uses. As they have become more expert at setting up and managing contracts they have established extra value, for example by building in guaranteed savings and releasing space for other uses.
8.2. Offshoring Many commercial organisations will seek to offshore elements of their services. The difference between outsourcing and offshoring is that offshoring can provide greater cost efficiencies due to access to a more cost-effective but no less technically able workforce. One of the considerations for organisations agreeing to an offshore arrangement is the management of staff displaced by this transfer. We would expect organisations to manage the consequent reduction in directly employed staff in accordance with its established policies governing organisational change. Separately further work is underway via an advisory workstream to review these implications nationally and trusts will wish to apprise themselves of the status of this work prior to any precipitive action.
8.3. Onshoring There is the opportunity for organisations to relocate their back office functions to areas where the costs of labour and operations are lower as a result of weaker labour costs. The added benefit is that this can help disadvantaged areas with significant investment. When considering moving to a shared services company or a club partnership, organisations should review the impact of the physical location of the shared service centre on the business case.
8.4. A service provider’s perspective on outsourcing The life and pensions sector is the closest to the NHS in terms of maturity of the business process outsourcing (BPO) market, as the L&P sector has only recently adopted BPO in a significant way. Potential savings for L&P clients range from 30% to 40% (and sometimes more) for in-scope services. Taking two specific examples, a contract with a large insurer signed in 2008 is on track to deliver £120m savings by the end of this year and for another global insurance company their price per policy for administration has reduced by 60%. In both cases these savings were accompanied by measurable quality improvements. However, L&P is a very different business from the NHS, so this is an example only and not a suggestion that comparable savings are necessarily achievable.
The local government (LG) sector is the closest to the NHS in terms of similarity of business, however BPO for LG is much more mature, and partnerships being put in place now are often second or even third generation outsourcing deals. Hence much of the efficiency has been driven out and the potential is lower. Typically, savings for LG clients range from 5% to 30% for in-scope services. For example at one London borough, £37m of savings were delivered in the first three years. For a large metropolitan city council, £1.6bn savings are targeted over the 10-year period of the contract.
Outsourcing is not just limited to back office functions: the same principle can be applied to other areas of trusts. Providers believe that the scope of transferable services can represent anywhere between 15% and 25% of the trust’s income.
QIPP national workstream: Back office efficiency and management optimisation 49
8.5. Summary Individual organisations need to review the respective models outlined in the report or, indeed, variants to them:
• In-house solutions offer relatively little in terms of the need to transform existing processes and are often a reflection of the status quo. The absence of scale and expertise limits the need to re-engineer simplification and standardisation of processes;
• Shared service co-operatives are more likely to be attractive in the short term since this model offers scope to secure benefits by leveraging scale. The limitations of the model are often reflected through the limited expertise available to drive re-engineering of existing processes, although we hope this report will assist in this task. The primary advantage is that this change can be made relatively quickly and will result in early efficiency savings for most organisations. We would envisage this approach as one step on the journey to a more substantive solution. The step up effort required to establish such arrangements will be significant in the forming period and therefore this is unlikely to be fully adopted;
• Joint ventures within the NHS offer a number of advantages over the in-house option, particularly with regard to economies of scale through the pooling of resources. However, there is limited evidence that they address adequately the complexity of such deals and changes in working practices. Joint ventures with external commercial partners are likely to offer a good fit going forward, bringing additional expertise to the provision of shared services. Trusts will need to guard against the potential for external partners to drive provision of services in a direction which differs from the needs of the organisation; and
• Outsourcing arrangements will offer a good solution for organisations seeking to divest their non-core activities and provide specific expertise and scale. We are keen to encourage and support pathfinder projects which enable a track record to be established with outsourcing partners. Interested organisations should contact Paul Betts at [email protected] in the first instance.
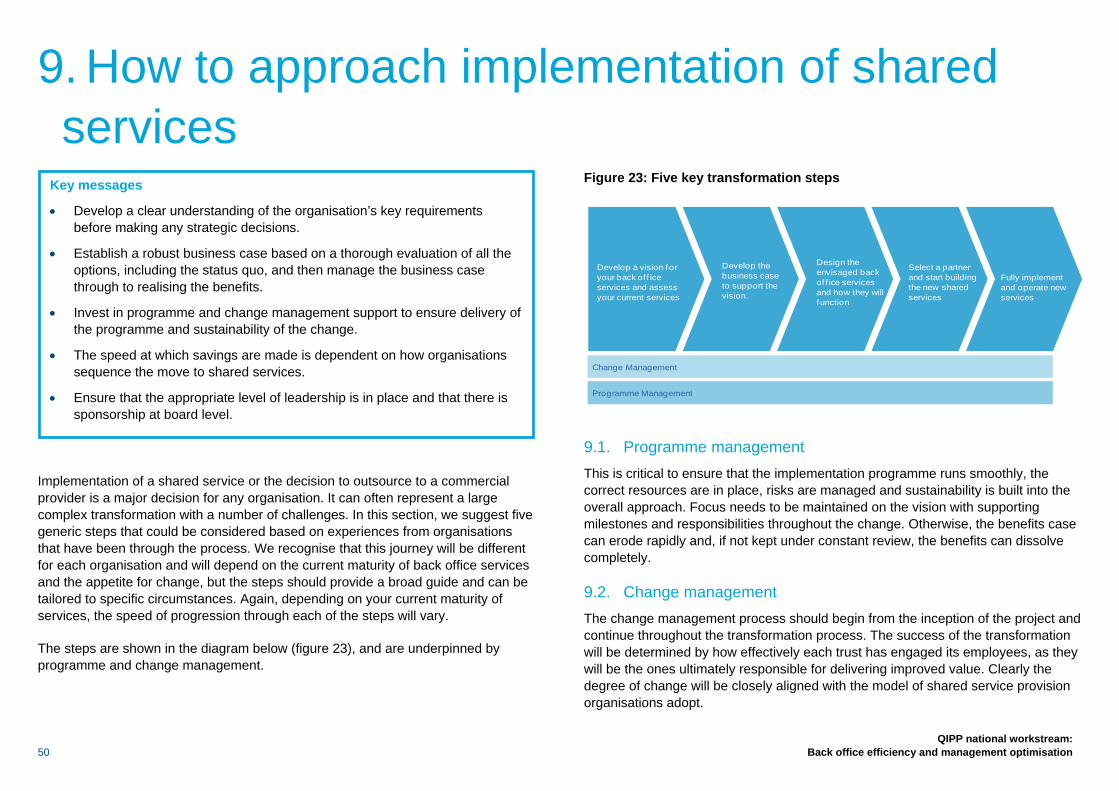
50
QIPP national workstream: Back office efficiency and management optimisation
Implementation of a shared service or the decision to outsource to a commercial provider is a major decision for any organisation. It can often represent a large complex transformation with a number of challenges. In this section, we suggest five generic steps that could be considered based on experiences from organisations that have been through the process. We recognise that this journey will be different for each organisation and will depend on the current maturity of back office services and the appetite for change, but the steps should provide a broad guide and can be tailored to specific circumstances. Again, depending on your current maturity of services, the speed of progression through each of the steps will vary.
The steps are shown in the diagram below (figure 23), and are underpinned by programme and change management.
Figure 23: Five key transformation steps
9.1. Programme management This is critical to ensure that the implementation programme runs smoothly, the correct resources are in place, risks are managed and sustainability is built into the overall approach. Focus needs to be maintained on the vision with supporting milestones and responsibilities throughout the change. Otherwise, the benefits case can erode rapidly and, if not kept under constant review, the benefits can dissolve completely.
9.2. Change management The change management process should begin from the inception of the project and continue throughout the transformation process. The success of the transformation will be determined by how effectively each trust has engaged its employees, as they will be the ones ultimately responsible for delivering improved value. Clearly the degree of change will be closely aligned with the model of shared service provision organisations adopt.
Change Management
Programme Management
Select a partner and start building the new shared services
Design the envisaged back of f ice services and how they will function
Develop the business case to support the vision.
Develop a vision for your back of f ice services and assess your current services
Fully implement and operate new services
9. How to approach implementation of shared services
Key messages
• Develop a clear understanding of the organisation’s key requirements before making any strategic decisions.
• Establish a robust business case based on a thorough evaluation of all the options, including the status quo, and then manage the business case through to realising the benefits.
• Invest in programme and change management support to ensure delivery of the programme and sustainability of the change.
• The speed at which savings are made is dependent on how organisations sequence the move to shared services.
• Ensure that the appropriate level of leadership is in place and that there is sponsorship at board level.
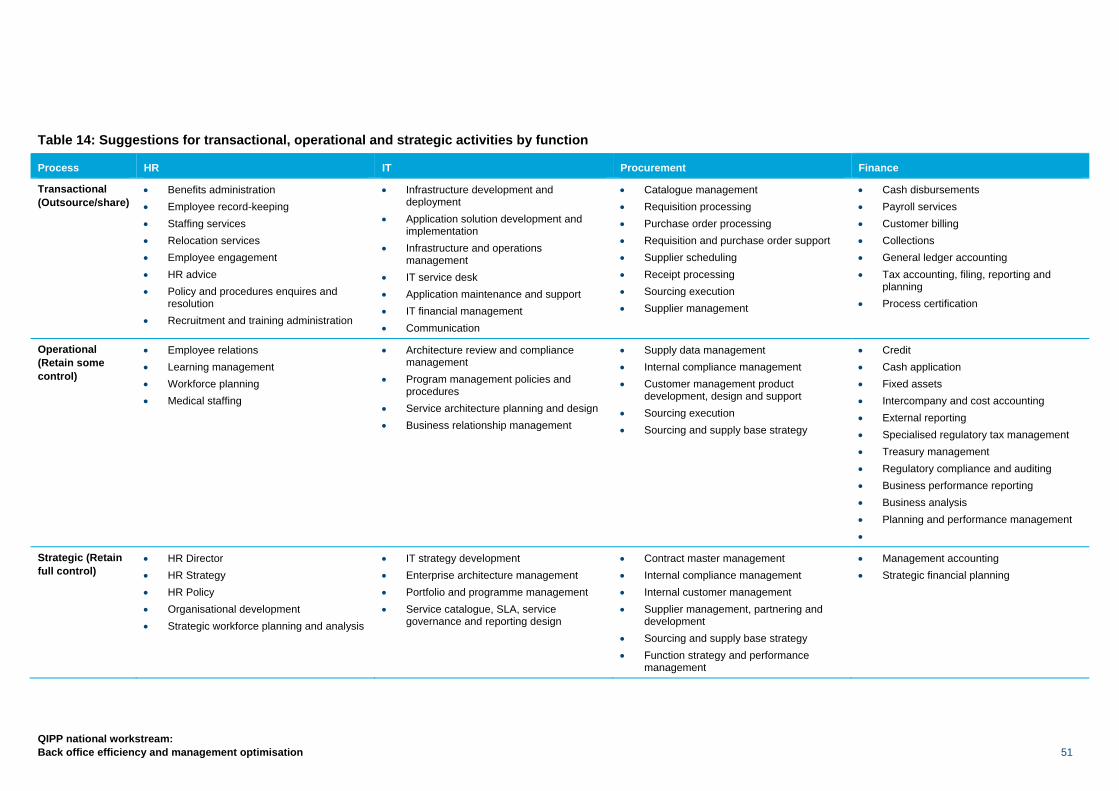
QIPP national workstream: Back office efficiency and management optimisation 51
Table 14: Suggestions for transactional, operational and strategic activities by function
Process HR IT Procurement Finance
Transactional (Outsource/share)
• Benefits administration • Employee record-keeping • Staffing services • Relocation services • Employee engagement • HR advice • Policy and procedures enquires and
resolution • Recruitment and training administration
• Infrastructure development and deployment
• Application solution development and implementation
• Infrastructure and operations management
• IT service desk • Application maintenance and support • IT financial management • Communication
• Catalogue management • Requisition processing • Purchase order processing • Requisition and purchase order support • Supplier scheduling • Receipt processing • Sourcing execution • Supplier management
• Cash disbursements • Payroll services • Customer billing • Collections • General ledger accounting • Tax accounting, filing, reporting and
planning • Process certification
Operational (Retain some control)
• Employee relations • Learning management • Workforce planning • Medical staffing
• Architecture review and compliance management
• Program management policies and procedures
• Service architecture planning and design • Business relationship management
• Supply data management • Internal compliance management • Customer management product
development, design and support • Sourcing execution • Sourcing and supply base strategy
• Credit • Cash application • Fixed assets • Intercompany and cost accounting • External reporting • Specialised regulatory tax management • Treasury management • Regulatory compliance and auditing • Business performance reporting • Business analysis • Planning and performance management •
Strategic (Retain full control)
• HR Director • HR Strategy • HR Policy • Organisational development • Strategic workforce planning and analysis
• IT strategy development • Enterprise architecture management • Portfolio and programme management • Service catalogue, SLA, service
governance and reporting design
• Contract master management • Internal compliance management • Internal customer management • Supplier management, partnering and
development • Sourcing and supply base strategy • Function strategy and performance
management
• Management accounting • Strategic financial planning
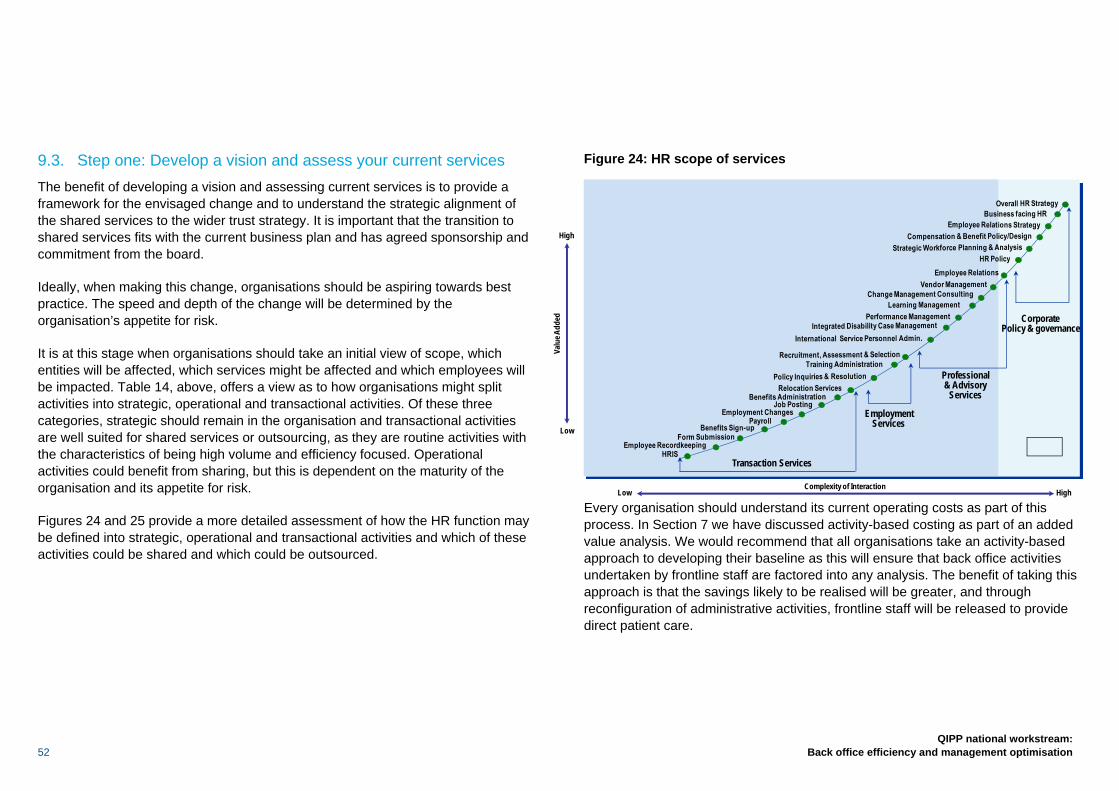
52
QIPP national workstream: Back office efficiency and management optimisation
9.3. Step one: Develop a vision and assess your current services The benefit of developing a vision and assessing current services is to provide a framework for the envisaged change and to understand the strategic alignment of the shared services to the wider trust strategy. It is important that the transition to shared services fits with the current business plan and has agreed sponsorship and commitment from the board.
Ideally, when making this change, organisations should be aspiring towards best practice. The speed and depth of the change will be determined by the organisation’s appetite for risk.
It is at this stage when organisations should take an initial view of scope, which entities will be affected, which services might be affected and which employees will be impacted. Table 14, above, offers a view as to how organisations might split activities into strategic, operational and transactional activities. Of these three categories, strategic should remain in the organisation and transactional activities are well suited for shared services or outsourcing, as they are routine activities with the characteristics of being high volume and efficiency focused. Operational activities could benefit from sharing, but this is dependent on the maturity of the organisation and its appetite for risk.
Figures 24 and 25 provide a more detailed assessment of how the HR function may be defined into strategic, operational and transactional activities and which of these activities could be shared and which could be outsourced.
Figure 24: HR scope of services
Every organisation should understand its current operating costs as part of this process. In Section 7 we have discussed activity-based costing as part of an added value analysis. We would recommend that all organisations take an activity-based approach to developing their baseline as this will ensure that back office activities undertaken by frontline staff are factored into any analysis. The benefit of taking this approach is that the savings likely to be realised will be greater, and through reconfiguration of administrative activities, frontline staff will be released to provide direct patient care.
Valu
e Add
ed
HighLowComplexity of Interaction
High
Low
EmploymentServices
Professional& Advisory
Services
CorporatePolicy & governance
Transaction Services
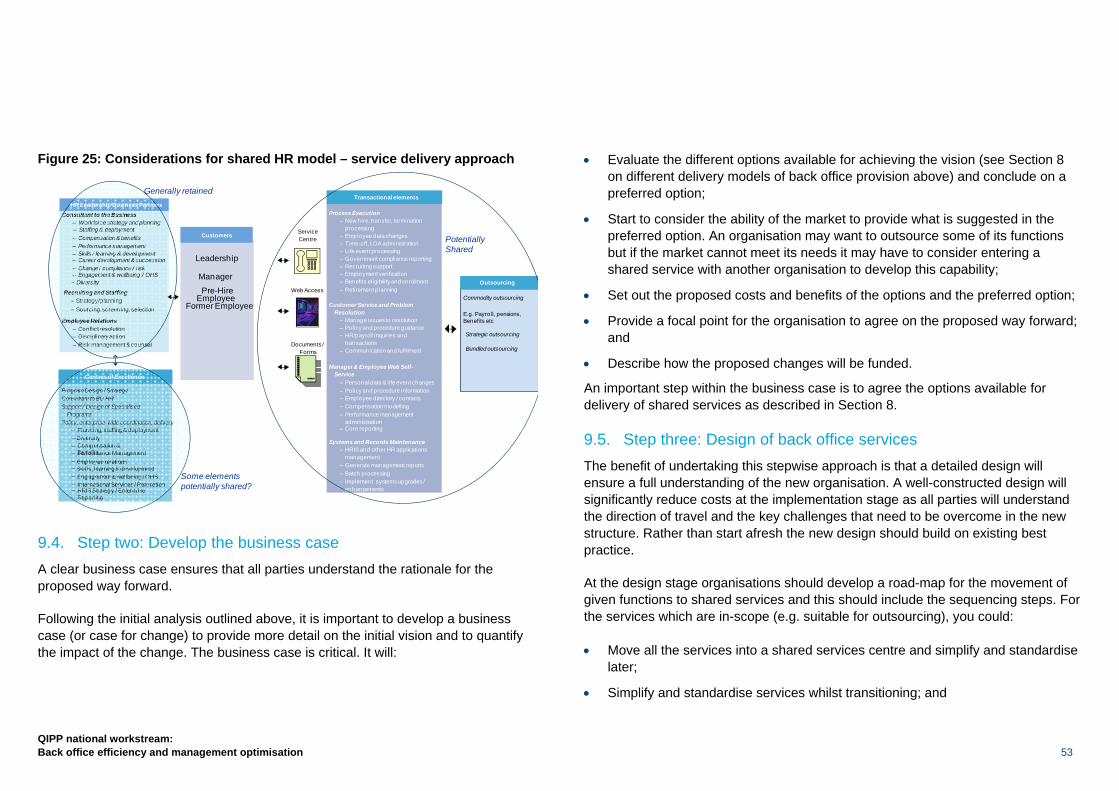
QIPP national workstream: Back office efficiency and management optimisation 53
Figure 25: Considerations for shared HR model – service delivery approach
9.4. Step two: Develop the business case A clear business case ensures that all parties understand the rationale for the proposed way forward.
Following the initial analysis outlined above, it is important to develop a business case (or case for change) to provide more detail on the initial vision and to quantify the impact of the change. The business case is critical. It will:
• Evaluate the different options available for achieving the vision (see Section 8 on different delivery models of back office provision above) and conclude on a preferred option;
• Start to consider the ability of the market to provide what is suggested in the preferred option. An organisation may want to outsource some of its functions but if the market cannot meet its needs it may have to consider entering a shared service with another organisation to develop this capability;
• Set out the proposed costs and benefits of the options and the preferred option;
• Provide a focal point for the organisation to agree on the proposed way forward; and
• Describe how the proposed changes will be funded.
An important step within the business case is to agree the options available for delivery of shared services as described in Section 8.
9.5. Step three: Design of back office services The benefit of undertaking this stepwise approach is that a detailed design will ensure a full understanding of the new organisation. A well-constructed design will significantly reduce costs at the implementation stage as all parties will understand the direction of travel and the key challenges that need to be overcome in the new structure. Rather than start afresh the new design should build on existing best practice.
At the design stage organisations should develop a road-map for the movement of given functions to shared services and this should include the sequencing steps. For the services which are in-scope (e.g. suitable for outsourcing), you could:
• Move all the services into a shared services centre and simplify and standardise later;
• Simplify and standardise services whilst transitioning; and
Process Execution– New hire, transfer, termination
processing– Employee data changes– Time-off, LOA administration– Life event processing– Government compliance reporting– Recruiting support– Employment verification– Benefits eligibility and enrolment– Retirement planning
Customer Service and ProblemResolution
– Manage issues to resolution– Policy and procedure guidance– HR/payroll inquiries and
transactions– Communication and fulfilment
Manager & Employee Web Self-Service
– Personal data & life event changes– Policy and procedure information– Employee directory / contacts– Compensation modelling– Performance management
administration– Core reporting
Systems and Records Maintenance– HRIS and other HR applications
management– Generate management reports– Batch processing– Implement systems upgrades /
enhancements
ServiceCentre
Web Access
Documents /Forms
Customers
Manager
Leadership
Pre-HireEmployee
Former Employee
Program Design / StrategyConsultant to BU HRSupport / Design of Specialised
ProgramsPolicy, enterprise-wide coordination, delivery
– Planning, staffing & deployment– Diversity
International Services / Relocation
– Performance Management– Compensation &
Benefits
–HRIS Strategy / EnterpriseReporting
Consultant to the Business
– Compensation & benefits– Performance management
Skills / learning & development
– Staffing & deployment
Career development & succession– Change / compliance / risk– Engagement & wellbeing / OHS
Recruiting and Staffing– Strategy/planning– Sourcing, screening, selection
Employee Relations– Conflict resolution– Disciplinary action– Risk management & counsel
HR Leadership Business Partners
Centres of Excellence
Transactional elements
Commodity outsourcing
E.g. Payroll, pensions, Benefits etc
Outsourcing
Strategic outsourcing
Bundled outsourcing
Employee relations–
–
Skills, learning & development–
PotentiallyShared
– Workforce strategy and planning
––
– Diversity
–
Generally retained
Engagement & wellbeing / OHS Some elements potentially shared?–
54
QIPP national workstream: Back office efficiency and management optimisation
• Simplify and standardise services and then transition.
There are advantages and disadvantages to each option. The decision will depend on the appetite for change and availability of resources to make this happen and the model chosen. For options that involve a commercial provider, there is often a premium to be paid when moving to the shared service and simplifying and standardising at a later stage. Hence, the savings are typically greater where organisations pursue a process to simplify and standardise services first and then transition.
Sequencing will also affect the speed at which cost comes out of the back office. By going through a sequential route of simplification, standardisation and then sharing, savings are often slower to be realised, whilst moving all the shared services can result in rapid realisation of savings but the process needs to be more tightly managed and the risks are greater.
At the end of the design stage, trusts should revisit their business case to evaluate whether the costs and benefits set out remain unchanged following full design of the shared service centre solution.
Shared services design
In parallel to designing the process of standardisation and simplification, the detail of the proposed shared service centre should be developed, in particular how it will be organised, where it will be located, what activities will be simplified and what will be standardised. This is the stage where much of the detailed work is carried out. This is a complex area and at this stage you may want to consider whether external specialist support is required.
For all of the above, if organisations select a model at business case stage which involves a third party or partners, they will need to start thinking about the interface between the new operating model and the third party. Organisations will also need to develop a set of draft service level agreements (SLAs), which set out the
proposed levels of service expected (e.g. response times, expected turnaround times for invoices, expected turnaround times for payroll).
The output of the shared service design will be a ‘blueprint’ document which sets out in detail:
• Definition, management structure and proposed governance of the new organisation;
• Detailed process design and proposed technology infrastructure; and
• The impact on people and how roles will change between the old and new organisation.
9.6. Step four: Select a partner and start building the new shared service centre
As we do not recommend an in-house solution for organisations, a partner or multiple partners will need to be selected. It can be a lengthy process, particularly if using a commercial provider which will involve OJEU procurement.
Some of the key considerations when selecting a working partner are outlined below:
• Ensure all parties agree on a workable model – All parties will need to be bought into the solution to ensure the initiative gets off the ground, recognising that it may be difficult for some stakeholders to agree to any loss of control and accountability;
• Ensure senior commitment to shared services from all sides – This is a strategic initiative and will need support and ongoing sponsorship from the board in order to be successful;
• Conduct a rigorous due diligence exercise – It is essential to know exactly where each partner stands in terms of existing contracts, exit provisions and intellectual property rights in order to preserve the integrity of the arrangement;
QIPP national workstream: Back office efficiency and management optimisation 55
• Identify each organisation’s own capacity and appetite for change – It is critical to align capacity and capability to drive forward this work;
• Understand the cost and possible funding options of future investment – Some participants could be keener to put money in than others and private sector partners might agree to help with up-front investment;
• Agree on the amount of risk each organisation is prepared to carry – This will play an important role in contract negotiations and feed into the business case process; and
• Agree on the governance, leadership and hosting – It is important to agree the appropriate shared service option: who will be the lead partner and the host in any shared service arrangement. Adopting good governance should ensure that any issues that arise are managed effectively and that there is transparency between partners.
Agreeing SLAs/commercial contracts
Our research has shown that for any commercial transaction the structure of the deal is important, and that defining a tight scope, asset and contract base is critical to obtaining price certainty. The commercial and contract structures need to reflect the business objectives and ensure value for money over the full term of the contract.
The payment and performance mechanism, supported by SLAs, is the critical tool to transfer risk and needs to reflect future volume and performance levels. The contract should allow for sufficient flexibility to deal with changing circumstances.
The agreement should be completely tied up at contract signature stage to avoid cost creep. Ensure a competent contract management team is in place that has been involved in the contract negotiation and understands the contract. More information about managing the risk in co-operative shared service agreements is provided in Section 11.
In parallel to selection of the partner, you will need to transition to the new shared service centre.
There are three key elements to the transition process:
1 Deliver the change – Being clear about operational responsibility split between supplier and client. Ensure a retained organisation is in place that interfaces well with the supplier;
2 Identify quick wins – Have short-term deliverables in place that help generate savings and build confidence and momentum; and
3 Manage the transition – Engage fully with the affected staff and consider carefully the implications of these changes for them. Manage the TUPE and pensions issues from the outset.
9.7. Step 5: Operate the new services At this stage, the shared service centre is up and running. The focus will move from design and construction to ongoing maintenance and improvement.
Benefits should now be realised for the organisation, time should be freed up to focus on core business activities, and cost savings should be realised. If the shared services are well managed, the cost savings should continue to increase as the shared services are embedded into the business.
The services should be evaluated against best practice to ensure performance is being maintained. Consider the use of benchmarking. The shared service should continue to be optimised using lean methodologies to ensure that continuous improvement is embedded within the organisation.
Further implementation of technology, greater simplification and standardisation will result in greater efficiencies being generated. As the shared service becomes more

56
QIPP national workstream: Back office efficiency and management optimisation
mature or the relationship with the supplier develops further, more activities and processes can be shared.
9.8. Critical success factors While each situation is different, the case studies have revealed a number of key messages about the critical factors for ensuring success, particularly in relation to shared services. More detail on each case study can be found at www.nhsconfed.org/QIPPbackoffice.
First is the importance of having the right people in place, both to manage the initial project or implementation and then to run and staff the shared services on an ongoing basis. The complexity of the implementation means it is highly advantageous to have people who have done it before. On an ongoing basis most operations are established with a customer service ethos and it is important to recruit or develop people so that they have this mindset to work in the centre.
Consistent and strong leadership from the top of the organisation is critical; to ensure that the shared service is embraced and managers do not fall back on less efficient ways of operating. This also can require a perspective on the longer term as the return on investment can take time to be achieved.
There is also a need to retain an intelligent client capability within the partner or client organisations. That is to say the ability to understand what the shared service operation is providing and challenge this in a way to ensure that organisations are getting the service required and not simply abdicating responsibility to the shared service.
It is also important to aim for the highest degree of standardisation and automation possible to drive out the greatest level of savings. Ideally this should be done before the creation of the shared service but will also continue afterwards. Implicit is the need to re-engineer many internal processes including those involving frontline managers.
Whilst the focus of most shared services is on saving costs initially, it is also an opportunity to improve service quality and consistency, and both should be part of the planning process.
In all cases, it is likely that the service will change for staff in the client organisations and a well-managed change programme is essential to ensure the success of the implementation.
Since these types of arrangements are typically collaborations between different organisations, building strong, trusting relationships is important and these need to be supported by putting in place the correct governance arrangements.
Having a strong suite of performance indicators tied to the objectives of the shared service and its clients is important for the overall governance but also for the ability of the operation’s management team to continue to improve its efficiency and service.

QIPP national workstream: Back office efficiency and management optimisation 57
Whatever option an organisation chooses to deliver, the key message from this report is that it is important to create a sustainable solution. Too often the experience of the NHS is that organisations have gone into a shared service arrangement or an outsourcing agreement and found that the quality of service they expected is not being delivered and they subsequently recreate the work they have devolved from their organisation, thereby eroding the business case.
The sustainability of change will be dependent on identifying the benefits of change, keeping them at the heart of the change and focusing on the actions that will make a difference fast. For example, quickly identifying and agreeing what is business-specific and what could be enhanced by moving to a shared service.
Change programmes often fail because of a failure to engage people whose behaviour we want to change:
• First, in being clear about what we want to change;
• Second, in securing the participation and commitment of those who can deliver that change; and
• Third, by linking the benefits of the change to benefits to them as individuals.
As the organisation no longer undertakes certain activities staff may feel a loss of control and may compensate by recreating reports and activities from before the change. Thus it is important that trusts invest in good programme and change management to bring their staff with them into the new operating model. Furthermore, this needs to be supported by changing systems, processes and the culture such that it reinforces the change.
Ensuring that an ‘intelligent’ client function is retained within the trust is essential and should be part of the business case. This will enable the organisation to make robust decisions relating to how the service provider is engaged to work as part of a partnership focused on delivering value for all parties. Once intelligence is lost, knowledge of what to contract can be too, as well the ability to monitor, evaluate and manage the performance of the service provider. As these aspects are lost, so the business benefits begin to erode.
The experience and lessons learnt from organisations that have been through the process, both in the private and public sector, highlight the importance of:
1. Putting the people agenda first, considering the impacts and opportunities that the new structure will have for staff and career paths to help engage their support;
2. Equally as important, creating a culture that is obsessive about continuous improvement and quality and that is focused on adopting new ways of working; and
3. Finally, the whole focus of making these changes needs to be on delivering benefits and managing risk, with enough momentum to bring the organisation along with the change and enough time taken to ensure that the benefits achieved are sustainable.
10. Creating sustainable change
Key messages
Achieving sustainable change involves having a change approach that: • Focuses on achieving identified benefits and sets up measures to track
them.
• Encourages the involvement of the people who will deliver the change in practice; ensuring purposeful communication and balancing those activities that should be driven by senior executives, and those built on the ideas and successes of the teams on the front line.
• Builds sustainability by embedding new ways of working into performance management and training processes.
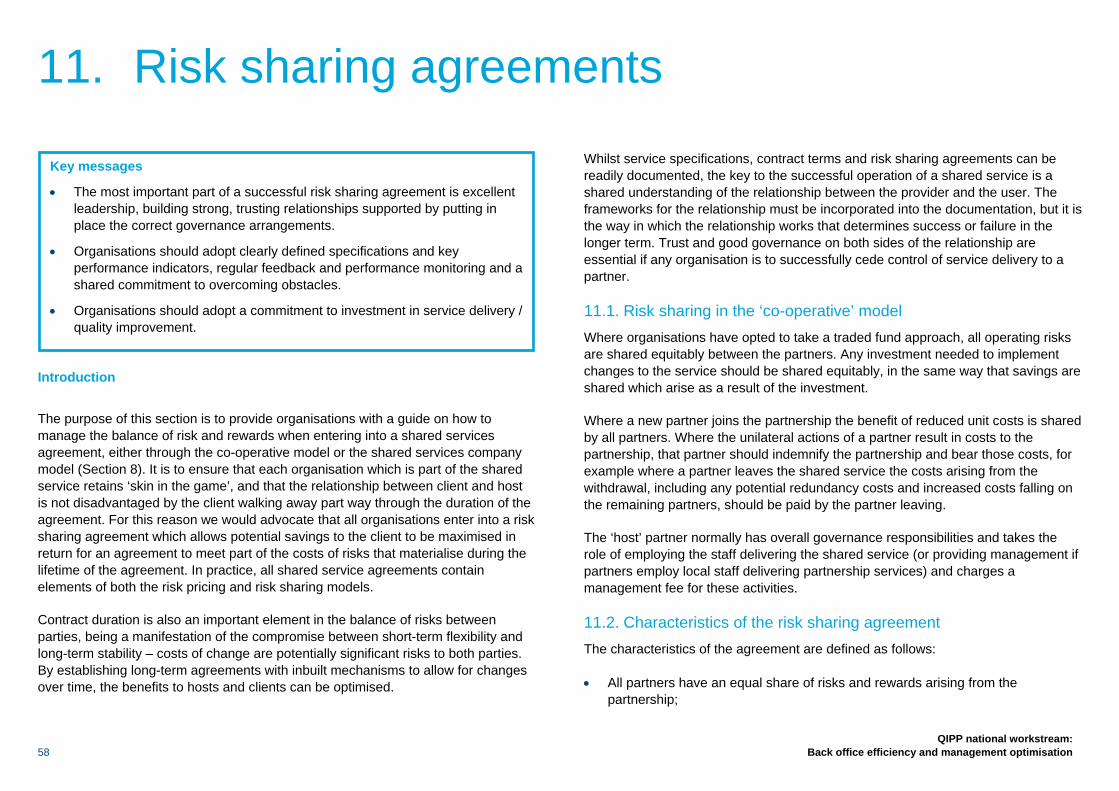
58
QIPP national workstream: Back office efficiency and management optimisation
Introduction
The purpose of this section is to provide organisations with a guide on how to manage the balance of risk and rewards when entering into a shared services agreement, either through the co-operative model or the shared services company model (Section 8). It is to ensure that each organisation which is part of the shared service retains ‘skin in the game’, and that the relationship between client and host is not disadvantaged by the client walking away part way through the duration of the agreement. For this reason we would advocate that all organisations enter into a risk sharing agreement which allows potential savings to the client to be maximised in return for an agreement to meet part of the costs of risks that materialise during the lifetime of the agreement. In practice, all shared service agreements contain elements of both the risk pricing and risk sharing models.
Contract duration is also an important element in the balance of risks between parties, being a manifestation of the compromise between short-term flexibility and long-term stability – costs of change are potentially significant risks to both parties. By establishing long-term agreements with inbuilt mechanisms to allow for changes over time, the benefits to hosts and clients can be optimised.
Whilst service specifications, contract terms and risk sharing agreements can be readily documented, the key to the successful operation of a shared service is a shared understanding of the relationship between the provider and the user. The frameworks for the relationship must be incorporated into the documentation, but it is the way in which the relationship works that determines success or failure in the longer term. Trust and good governance on both sides of the relationship are essential if any organisation is to successfully cede control of service delivery to a partner.
11.1. Risk sharing in the ‘co-operative’ model Where organisations have opted to take a traded fund approach, all operating risks are shared equitably between the partners. Any investment needed to implement changes to the service should be shared equitably, in the same way that savings are shared which arise as a result of the investment.
Where a new partner joins the partnership the benefit of reduced unit costs is shared by all partners. Where the unilateral actions of a partner result in costs to the partnership, that partner should indemnify the partnership and bear those costs, for example where a partner leaves the shared service the costs arising from the withdrawal, including any potential redundancy costs and increased costs falling on the remaining partners, should be paid by the partner leaving.
The ‘host’ partner normally has overall governance responsibilities and takes the role of employing the staff delivering the shared service (or providing management if partners employ local staff delivering partnership services) and charges a management fee for these activities.
11.2. Characteristics of the risk sharing agreement The characteristics of the agreement are defined as follows:
• All partners have an equal share of risks and rewards arising from the partnership;
11. Risk sharing agreements
Key messages
• The most important part of a successful risk sharing agreement is excellent leadership, building strong, trusting relationships supported by putting in place the correct governance arrangements.
• Organisations should adopt clearly defined specifications and key performance indicators, regular feedback and performance monitoring and a shared commitment to overcoming obstacles.
• Organisations should adopt a commitment to investment in service delivery / quality improvement.

QIPP national workstream: Back office efficiency and management optimisation 59
• All partners have an equal say in the development and activities of the partnership;
• The ‘host’ partner is indemnified against the majority of risks arising from the operations of the shared service;
• Day-to-day costs are minimised by absence of profit or risk premium;
• Stability – risk sharing and exit penalties will ensure that organisations joining the partnership are fully committed prior to entry; and
• All partners have the entitlement to benefit from ongoing savings as and when they can be delivered.
Whilst the above appears relatively straightforward, organisations need to be aware that there are significant challenges to developing an effective risk sharing agreement under this model. The ability to invest and the decisions on what the priorities for investment are need to be carefully considered.
As the remaining provider organisations move to foundation trust status the impact of being a host can complicate the ability of an organisation to meet the obligations of Monitor financial risk ratings, particularly as they are expected to deliver cash-releasing efficiency savings (CIPS) on the costs of the shared service and to deliver CIPS through reduced costs to other partners.
As the agreement is based on consensus there needs to be vigilance over any inflexibility and protracted decision making and every effort must be made to ensure that governance is clear and responsibilities are not masked by the existence of a ‘partnership’ which has no legal status.
11.3. Risk sharing in the ‘shared services company’ model Where organisations have decided to operate on a commercial basis with one organisation as a host to the clients, all risk and rewards of operating the service are carried by the host, financed from the risk premium and profit built in to the price. Any investment needed to implement changes to the service provision is financed
on a commercial basis by the provider, as are any savings that arise as a result of the investment.
The decision to use the shared service is dependent on a commercial assessment by the client, possibly by market testing or benchmarking of costs. Where a new client takes up the shared service, the host has the benefit of any increased profit. The host has overall governance responsibility and takes the role of employing the staff delivering the shared service financed from the income arising from operations.
The commercial arrangements between the host and the client are individually negotiated – the amount of risk premium included in the price for the service to individual clients may vary, depending on the ability/willingness of the client to indemnify the provider for unilateral decisions, e.g. to pay an exit penalty at the end of the contract term.
11.4. Characteristics of the risk sharing agreement The characteristics are defined as follows:
• The price for the service is agreed in advance without the potential for additional unplanned cash calls on service users;
• Any exit charges are agreed in advance as a component of the total contract terms;
• Clients carry no risk other than that quantified in contracts;
• The host operates on a commercial basis, generating profits and cash flows for investment in service improvement;
• Flexibility for clients who can exercise choice through market testing/benchmarking;
• Investment decisions are driven by commercial considerations to improve quality, reduce cost and increase market share;
60
QIPP national workstream: Back office efficiency and management optimisation
• Where the host is a foundation trust, sufficient margins to meet higher Monitor financial risk ratings can be built into a commercial pricing structure.
One of the incentives to calibrate in any risk sharing agreement is the extent to which the host will not be incentivised to prioritise investment into continuous improvement of the service when the contract is open to commercial competition through client market testing.
Examples of risk sharing agreements and a risk management plan when moving to a shared service can be found at www.nhsconfed.org/QIPPbackoffice
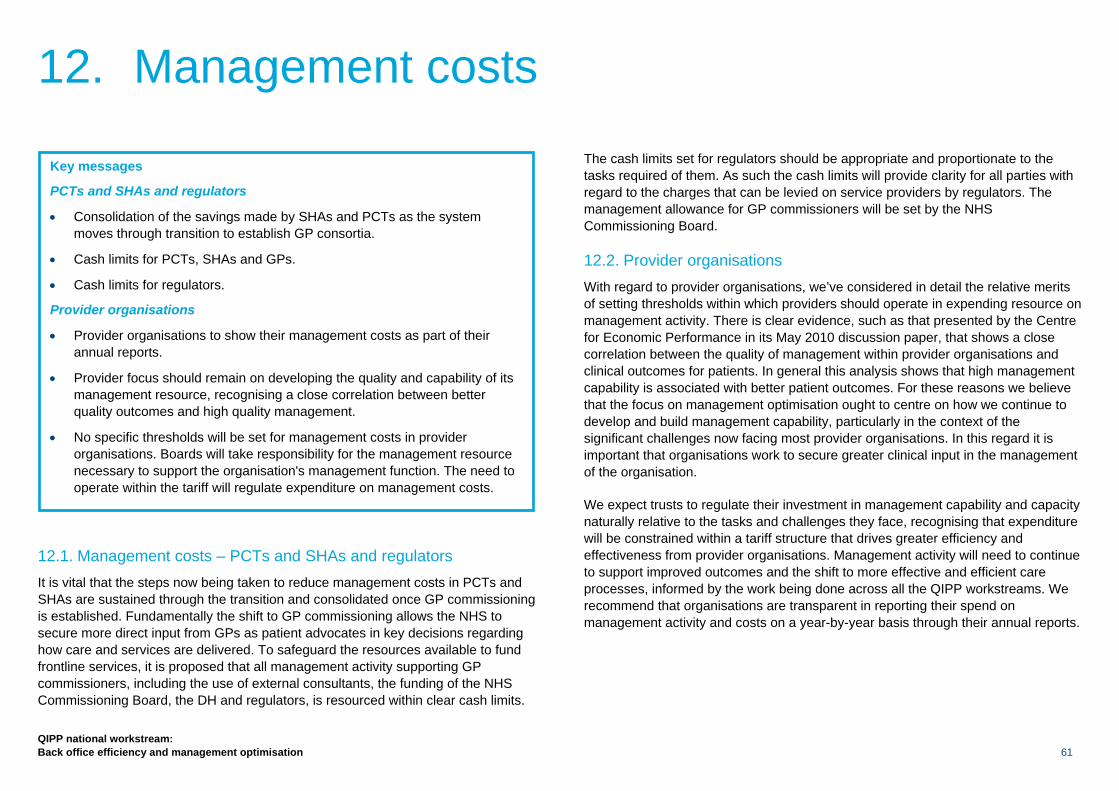
QIPP national workstream: Back office efficiency and management optimisation 61
12.1. Management costs – PCTs and SHAs and regulators It is vital that the steps now being taken to reduce management costs in PCTs and SHAs are sustained through the transition and consolidated once GP commissioning is established. Fundamentally the shift to GP commissioning allows the NHS to secure more direct input from GPs as patient advocates in key decisions regarding how care and services are delivered. To safeguard the resources available to fund frontline services, it is proposed that all management activity supporting GP commissioners, including the use of external consultants, the funding of the NHS Commissioning Board, the DH and regulators, is resourced within clear cash limits.
The cash limits set for regulators should be appropriate and proportionate to the tasks required of them. As such the cash limits will provide clarity for all parties with regard to the charges that can be levied on service providers by regulators. The management allowance for GP commissioners will be set by the NHS Commissioning Board.
12.2. Provider organisations With regard to provider organisations, we’ve considered in detail the relative merits of setting thresholds within which providers should operate in expending resource on management activity. There is clear evidence, such as that presented by the Centre for Economic Performance in its May 2010 discussion paper, that shows a close correlation between the quality of management within provider organisations and clinical outcomes for patients. In general this analysis shows that high management capability is associated with better patient outcomes. For these reasons we believe that the focus on management optimisation ought to centre on how we continue to develop and build management capability, particularly in the context of the significant challenges now facing most provider organisations. In this regard it is important that organisations work to secure greater clinical input in the management of the organisation.
We expect trusts to regulate their investment in management capability and capacity naturally relative to the tasks and challenges they face, recognising that expenditure will be constrained within a tariff structure that drives greater efficiency and effectiveness from provider organisations. Management activity will need to continue to support improved outcomes and the shift to more effective and efficient care processes, informed by the work being done across all the QIPP workstreams. We recommend that organisations are transparent in reporting their spend on management activity and costs on a year-by-year basis through their annual reports.
12. Management costs
Key messages
PCTs and SHAs and regulators
• Consolidation of the savings made by SHAs and PCTs as the system moves through transition to establish GP consortia.
• Cash limits for PCTs, SHAs and GPs.
• Cash limits for regulators.
Provider organisations
• Provider organisations to show their management costs as part of their annual reports.
• Provider focus should remain on developing the quality and capability of its management resource, recognising a close correlation between better quality outcomes and high quality management.
• No specific thresholds will be set for management costs in provider organisations. Boards will take responsibility for the management resource necessary to support the organisation's management function. The need to operate within the tariff will regulate expenditure on management costs.
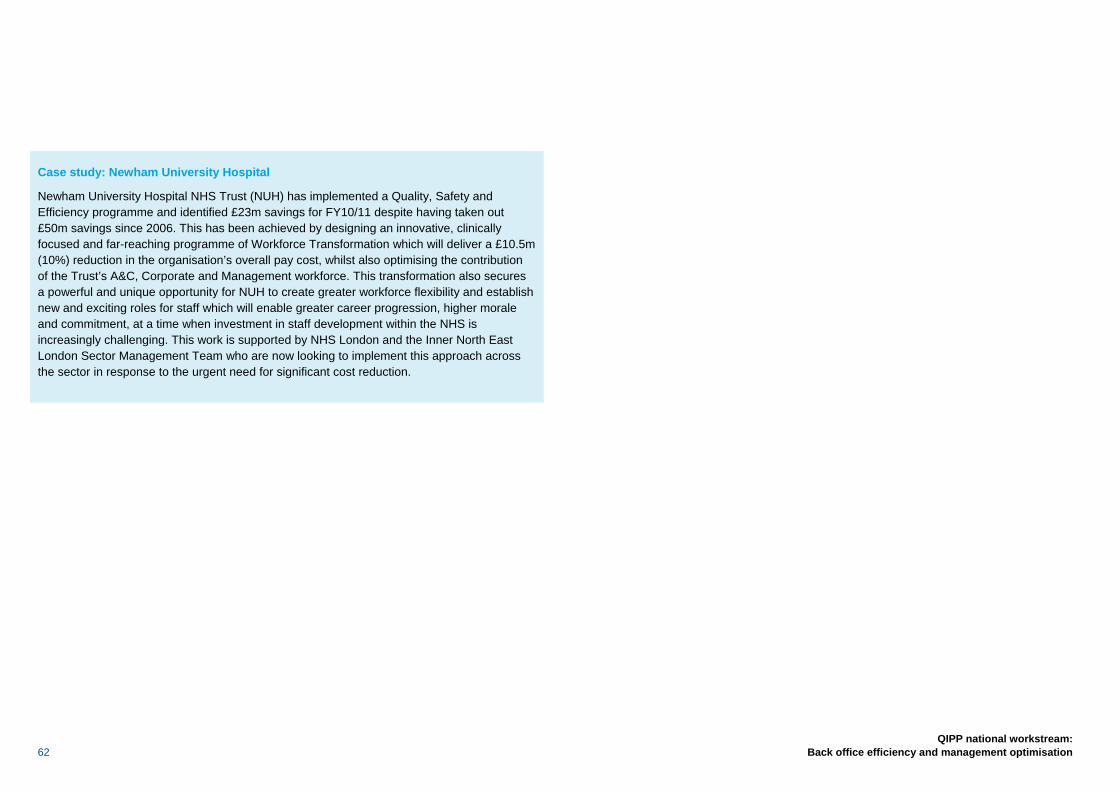
62
QIPP national workstream: Back office efficiency and management optimisation
Case study: Newham University Hospital
Newham University Hospital NHS Trust (NUH) has implemented a Quality, Safety and Efficiency programme and identified £23m savings for FY10/11 despite having taken out £50m savings since 2006. This has been achieved by designing an innovative, clinically focused and far-reaching programme of Workforce Transformation which will deliver a £10.5m (10%) reduction in the organisation’s overall pay cost, whilst also optimising the contribution of the Trust’s A&C, Corporate and Management workforce. This transformation also secures a powerful and unique opportunity for NUH to create greater workforce flexibility and establish new and exciting roles for staff which will enable greater career progression, higher morale and commitment, at a time when investment in staff development within the NHS is increasingly challenging. This work is supported by NHS London and the Inner North East London Sector Management Team who are now looking to implement this approach across the sector in response to the urgent need for significant cost reduction.
QIPP national workstream: Back office efficiency and management optimisation 63
13.1. Compulsion versus organisational freedoms The case for shared services in the private sector is often predicated on a clear mandate from the corporate board. There is a view that in the absence of such a mandate, the likelihood of achieving the full benefit of identified potential savings is fundamentally undermined. From the perspective of commissioning organisations it will be critical for the Department of Health to set the appropriate level of management allowance to cover provision of efficient back office services. However, from the perspective of provider organisations, all of which will become autonomous, such action is inappropriate and would be counter productive, additionally it is not supported by Monitor. Foundation trusts will therefore have the freedom to evaluate which shared service solutions best meet their needs, having regard to their duty to maintain economic and efficient services. Additionally we are also mindful that there is limited commercial sector experience to take on this work for the NHS should it be mandated.
The financial challenge facing the NHS, and the resetting of the tariff, should provide the necessary incentives for boards and Chief Executives in all organisations to drive internal and local improvements in back office functions and management costs, with the centre providing a supportive rather than controlling role. For those organisations that experience financial difficulty, regulators should reasonably
expect boards to demonstrate that they have re-engineered their back office functions and realised the savings available to them.
13.2. Reducing the burden of bureaucracy Clearly if we are to realise important benefits and cost efficiencies from the transformation of back office functions, so we must adapt the wider systems and architecture of the NHS to help facilitate these changes. Many reviews that have been undertaken specifically focused on actions to ease the perceived burden of bureaucracy. In particular, the review group built upon the work of the NHS Confederation, which has published multiple reports on the burden of bureaucracy,8and the work led by Peter Mount, who led the Provider Advisory Group on this topic. The White Paper, including the subsequent revisions to the Operating Framework, has sought to address many of the concerns initially expressed.
Detailed below are a range of proposals the Department of Health has agreed to give further consideration to:
1. The nature of the contracting process has led to both commissioners and provider organisations developing significant infrastructure to review, debate and challenge activity paid for under the tariff. The extension of the tariff to a wider range of activity will reduce the time spent in negotiating block contracts and further work will be done to investigate how we use systems, including the Secondary Uses Service (SUS), as a means of executing payment for activity undertaken in a more timely and less resource-intense way;
2. There will be a more detailed review of existing targets with emphasis continuing to be placed on patient outcomes rather than process-related targets;
8 http://www.nhsconfed.org/Publications/Documents/Whats_it_all_for.pdf http://www.nhsconfed.org/Publications/Pages/ThebureaucraticburdenintheNHS.aspx
13. Making it happen from the centre
Key messages
• The DH will create a business case to evaluate the provision of regional (multi-regional or national) back office services for PCTs and GP commissioners.
• The DH is looking at a number of ways of reducing the burden of central bureaucracy and will involve the service in this work.
• The DH is reviewing a number of options to create greater market competition on the expiry of the SBS contract in March 2012 via a framework agreement.
64
QIPP national workstream: Back office efficiency and management optimisation
3. Trusts have made excellent progress in managing MRSA. Current MRSA screening guidance should be reviewed in the light of clinical experience and cost benefits. Any savings that might be realised by a revised screening regime might be released for direct patient care;
4. We would invite Monitor, the Foundation Trust Network, the NHS Confederation and the Care Quality Commission to work together as a means of enabling NHS organisations to have more direct input into consideration of the information demands placed upon organisations;
5. Most NHS organisations spend considerable time and energy in reviewing how they can legitimately minimise payment of VAT. It is clearly not a good use of public resource and we will, therefore, raise with the Treasury the potential to make aspects of healthcare zero rated, thus streamlining VAT processes. In so doing, however, we would expect this to have a zero sum gain, with the Treasury agreeing adjustments to the tariff and PCT/GP commissioner allocations. Nevertheless there is significant benefit in reducing the time currently spent in undertaking this task. Similarly we will also explore with HM Revenue and Customs appropriate streamlining in information provided by the NHS;
6. In general we welcome the review of health and safety regulations, recognising the importance of continuing to protect staff and the public. It is evident that patients and the service would benefit from some revision and realignment to current rules and regulations to reduce unnecessary and unhelpful bureaucracy. We will input into this review;
7. In conjunction with the National Health Service Litigation Authority, work will be undertaken to review the streamlining of payment and settlement schemes which will also speed payments for claimants; and
8. We will take into account the Government review of CRB checks and consider how we can further streamline the approach to conducting CRB checks.
Full details of the proposals which emerged from the working group are contained at www.nhsconfed.org/QIPPbackoffice
13.3. Creating greater transparency In Section 5, we have highlighted the need to inform boards of the potential scope to realise efficiency savings through the reshaping of back office functions. We have also recommended that organisations regularly benchmark their back office functions to understand progress they are making on deriving efficiencies from their back office functions. This facility will be available through the FTN. Despite the existence of a range of value for money indicators, it is important that boards focus on a succinct, hard-hitting number of measures.
Whilst we do not advocate a mandate to share services across the sector, Monitor is in agreement that organisations should be more transparent over back office costs and, following our recommendation, will embark on a full consultation within the foundation trusts on publishing their spend on back office functions within the annual report against the headline indicators.
We would also recommend that the Department of Health, through the SHAs, place the same requirements on PCTs, NHS trusts and GP consortia to publish these indicators.
Table 15 below outlines a broader range of indicators identified by the project group which boards may wish to consider in reviewing both the quality and cost effectiveness of their services. Many of the indicators are equivalent to those produced by the Chartered Institute of Public Finance and Accountancy (CIPFA) and may already be used by organisations to determine costs of their back office. Whilst the seven headline indicators should be used at board level to ensure focus, a combination of secondary and non-financial indicators should be used to create a balanced scorecard for each function. This will ensure that organisations are focused on both productivity and quality from their back office functions.
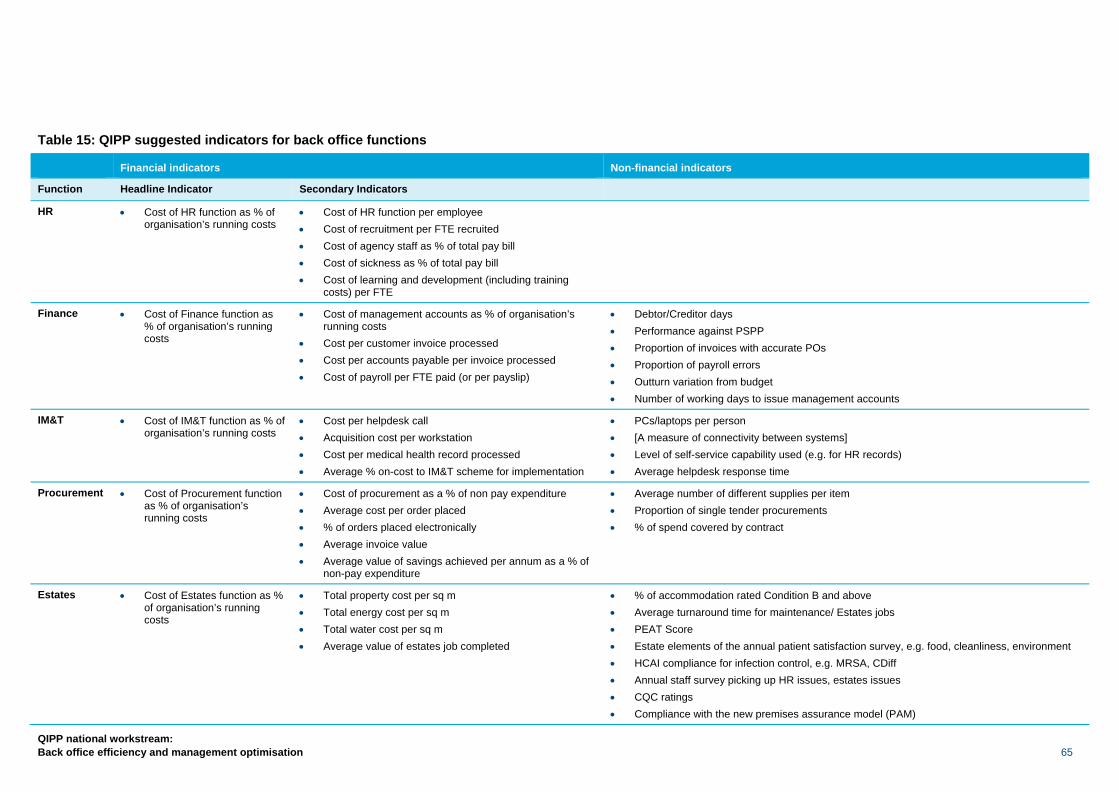
QIPP national workstream: Back office efficiency and management optimisation 65
Table 15: QIPP suggested indicators for back office functions
Financial indicators Non-financial indicators
Function Headline Indicator Secondary Indicators
HR • Cost of HR function as % of organisation’s running costs
• Cost of HR function per employee • Cost of recruitment per FTE recruited • Cost of agency staff as % of total pay bill • Cost of sickness as % of total pay bill • Cost of learning and development (including training
costs) per FTE
Finance • Cost of Finance function as % of organisation’s running costs
• Cost of management accounts as % of organisation’s running costs
• Cost per customer invoice processed • Cost per accounts payable per invoice processed • Cost of payroll per FTE paid (or per payslip)
• Debtor/Creditor days • Performance against PSPP • Proportion of invoices with accurate POs • Proportion of payroll errors • Outturn variation from budget • Number of working days to issue management accounts
IM&T • Cost of IM&T function as % of organisation’s running costs
• Cost per helpdesk call • Acquisition cost per workstation • Cost per medical health record processed • Average % on-cost to IM&T scheme for implementation
• PCs/laptops per person • [A measure of connectivity between systems] • Level of self-service capability used (e.g. for HR records) • Average helpdesk response time
Procurement • Cost of Procurement function as % of organisation’s running costs
• Cost of procurement as a % of non pay expenditure • Average cost per order placed • % of orders placed electronically • Average invoice value • Average value of savings achieved per annum as a % of
non-pay expenditure
• Average number of different supplies per item • Proportion of single tender procurements • % of spend covered by contract
Estates • Cost of Estates function as % of organisation’s running costs
• Total property cost per sq m • Total energy cost per sq m • Total water cost per sq m • Average value of estates job completed
• % of accommodation rated Condition B and above • Average turnaround time for maintenance/ Estates jobs • PEAT Score • Estate elements of the annual patient satisfaction survey, e.g. food, cleanliness, environment • HCAI compliance for infection control, e.g. MRSA, CDiff • Annual staff survey picking up HR issues, estates issues • CQC ratings • Compliance with the new premises assurance model (PAM)
66
QIPP national workstream: Back office efficiency and management optimisation
13.4. Commercial frameworks There is a well-developed commercial sector supply market that can provide considerable expertise when outsourcing back office functions; however, there is at present insufficient provision to drive competition and meet the needs of the NHS. Moreover there are few commercial providers with a demonstrable track record in the NHS.
The Department of Health is exploring opportunities to facilitate, encourage and create the development of a more competitive market for the shared service provision of back office/middle office services. The aim is to help nurture well-informed and enthusiastic demand from NHS organisations, and efficient and effective suppliers to meet the demand, through actions that may include the following:
• A baseline-setting exercise to confirm the multi-functional areas of the requirements across the NHS;
• Exploring the potential to create and creating alternative delivery models,
possibly including public/private partnerships;
• Encouraging the private sector to develop its services to meet NHS demand for the provision of back office services;
• Providing standard documentation for NHS organisations to use; and
• Continuing to support work to demonstrate the benefits to the NHS of
utilising shared services and outsourcing. 13.5. Traction It is essential that the NHS is able to realise quickly the benefits afforded by transformation of back office functions at scale. Improved efficiency provides scope to direct a greater proportion of taxpayers’ money to support the provision of frontline services. Consequently, back office functions for GP commissioners and PCTs in
transition should be provided on a regional/multi-regional or national basis. Work to establish the necessary support infrastructure to establish this capability will be led nationally. It is important that GP commissioners are able to focus directly on commissioning services for their local population, including defining and overseeing the provision of evidence-based primary and secondary care services. They should be able to rely on the provision of high quality, consistent back office functions to support their commissioning role, without having to dedicate time to establishing or maintaining these functions. Management allocations will be set to reflect the organisation of these services at scale, provided on a co-ordinated basis.
Whilst there will be no direct mandating of provider organisations to configure their back office functions in a particular way, the tariff will reflect the need to achieve greater efficiency in this and other QIPP areas. Provider boards will need to satisfy themselves that they are providing services economically, efficiently and effectively. Similarly, commissioning organisations will wish to ensure that they are not resourcing inefficient back office functions when negotiating overhead costs associated with the provision of block contract services. Provider organisations will be expected to co-operate to establish shared service consortia or take advantage of the market.
13.6. Ongoing support In order to provide organisations with further assistance in the transformation of their back office, the members of the Foundation Trust Network have offered their support in whatever way they are able to do so.
The NHS Evidence project will hold a library of case studies supporting this work and also other workstreams which may be of some assistance, whilst the QIPP technology and digital vision workstream is looking at national plans for rolling out technology solutions and may be able to signpost organisations as to what to look for when implementing technology and appropriate solutions.
As we have already mentioned in Section 7 of this report, the NHS Institute will provide further support on lean methodologies.
QIPP national workstream: Back office efficiency and management optimisation 67
Introduction
The workstream’s primary goal was to establish the savings that could be generated from reviewing corporate functions within the NHS and to advise on how these savings could be derived. We do, however, recognise that there is a greater opportunity for completely transforming the way that the NHS operates by reviewing what is termed front office (customer entry points to a hospital) and middle office (support services to clinicians). It is estimated that these savings could potentially be up to a further 5% of turnover and we would recommend that further work be established to quantify the potential benefits of transforming front and middle office areas and what the various vehicles to deliver those savings could be.
14.1. Middle office The aim of this work should be to reduce the administrative burden on clinical staff and allow them to focus on their core clinical activities. Transformation of the middle office will require an investment in technology as an integral and fundamental part of the strategy. Through this process organisations should be able to fully realise the potential to deliver higher quality care and improved patient outcomes in increasingly efficient ways through the use of information technology and process redesign.
Some of the key areas of opportunity for organisations in the middle office are:
Administration of patient flows and clinical care records – We would expect that patient records, clinical notes and discharge summaries are automated. This would ensure that clinicians and administrative support staff are given the information to move patients more efficiently through the care pathway. Also operational processes should be improved to minimise the costs of variation in demand patterns to make better use of scarce resources.
Administration of patient bookings – Clinicians and administrative support staff should have the ability to choose and the technology to book directly for secondary care treatment provided they have access to the right quality of data, and the operational processes and protocols that support this should be reviewed and changed to improve the quality of referrals.
Administration of orders and results – Electronic support for placing clinical orders, e.g. diagnostic tests, and online viewing of results; elimination of chasing for results and repeating lost results.
A recent paper9 written by Gerard Newman for a Diploma in Advanced Strategy, Said Business School, University of Oxford and authored jointly with Dr Richard Jones, Consultant Chemical Pathologist, University of Leeds / Leeds Teaching Hospitals NHS Trust, has reviewed the applicability of the shared services model to pathology and suggests that in a local health economy superior efficiencies and savings could be delivered.
Administration of prescribing – Electronic support for transfer of prescriptions between prescriber, pharmacy and the Prescription Pricing Authority leading to improved processes for the patient to receive the right drugs and the authorisation/dispensing of repeat prescriptions.
9 Can the use of different business models in transformation and transitioning of back offices for public services be applied to Pathology services? Gerard Newman, Dr Richard Jones, 2010.
14. Future opportunities
Key messages
• Further opportunity for reducing costs within the NHS is through the transformation of the middle office and front office functions. The shared service model can apply equally across each of these areas.
• There is considerable scope to generate substantial efficiencies and savings for redeployment into frontline primary, community and secondary care services.
68
QIPP national workstream: Back office efficiency and management optimisation
14.2. Front office At present there are a number of entry points for patients in a hospital which form part of the pre-attendance and attendance process. Whilst the aim of each process is different, there is duplication of processes, creating inbuilt inefficiencies and often less than optimum patient experience. A number of commercial business process outsourcing (BPO) organisations have worked with local government to deliver the equivalent of:
1 A contact centre providing multichannel access for patients before and after they attend the hospital.
2 A ‘Welcome Centre’ providing a single face-to-face point for outpatients.
Apart from the face to-face patient contact services (such as the welcome centre), many of these administrative services could be moved off-site to free up on-site space for other patient and related services, further reducing costs and freeing up space for patient care.
The benefits of moving to this model would be that the patient journey would be captured and managed from the start, providing the service with a better understanding of the demand profile. As a net result the quality of care could be improved through having a more responsive service to the needs of the patient.
A number of trusts are now implementing ‘airline check in’ type facilities for out-patient appointments. We commend and endorse this approach for wider implementation.
We would be keen to hear from organisations which are willing to become pathfinders in transforming either their middle or front office. Please contact Paul Betts at [email protected].
14.3. Back office GP services A specific area of work which offers significant potential for increasing efficiency is the back office functions directly supporting the delivery of primary care services. The majority of GP practices have dedicated administrative support teams, often undertaking identical tasks, including the organisation and booking of patient appointments. This system should be radically re-engineered. There is considerable scope to generate substantial efficiencies and savings for redeployment into frontline primary, community and secondary care services. We recommend that the Department of Health commissions work to evaluate the options redefining how these functions ought to be undertaken. This work should directly involve primary care clinicians and aim to report with a set of recommendations by September 2011.
14.4. Sharing with other organisations in the public sector Further scale and efficiencies could be achieved by extending the partners in a shared service to other organisations within the public sector. There could also be additional benefits around closer working and streamlining across organisational boundaries by such approaches. Local authorities in particular have been sharing back office functions over a longer period and have greater experience which the NHS could benefit from. Examples of such wider public sector shared services include: South West One, a public/private shared service joint venture between Somerset County Council, Taunton Deane Borough Council, Avon & Somerset Police and IBM; and National Offender Management Service (NOMS) which provides HR, finance and procurement services to staff in NOMS headquarters, the Prison Service and the Home Office. Details of both these case studies are available at www.nhsconfed.org/QIPPbackoffice
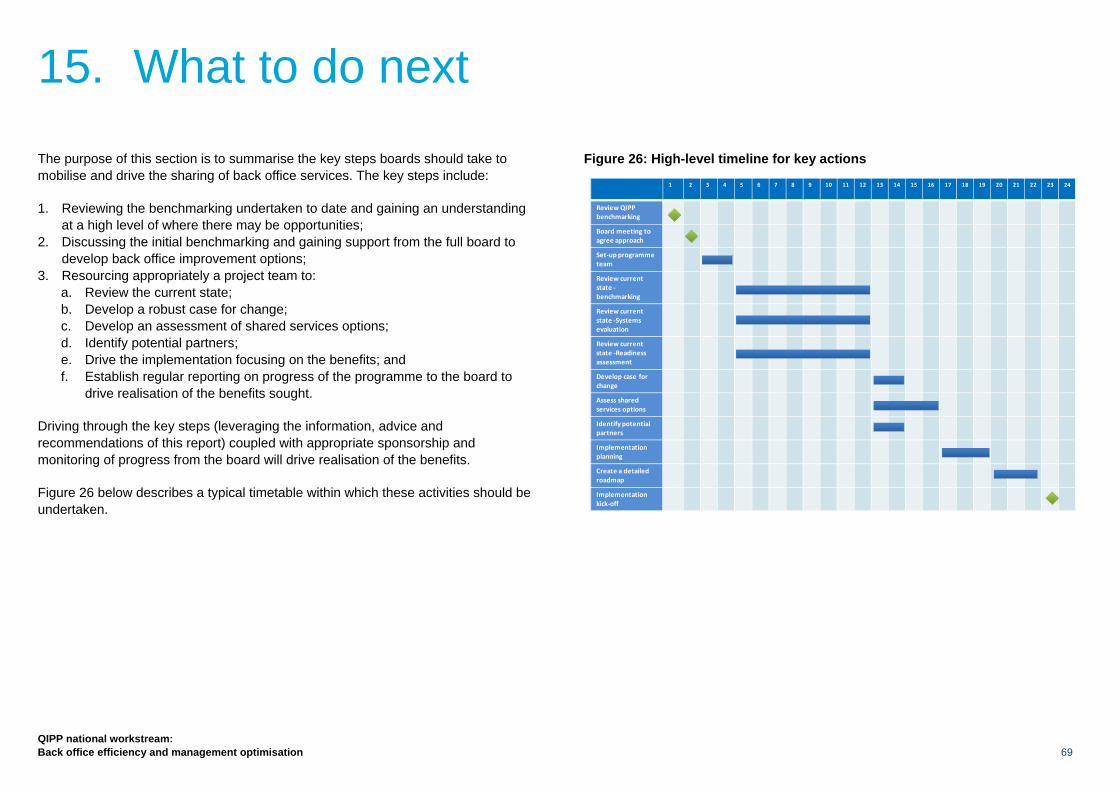
QIPP national workstream: Back office efficiency and management optimisation 69
The purpose of this section is to summarise the key steps boards should take to mobilise and drive the sharing of back office services. The key steps include:
1. Reviewing the benchmarking undertaken to date and gaining an understanding at a high level of where there may be opportunities;
2. Discussing the initial benchmarking and gaining support from the full board to develop back office improvement options;
3. Resourcing appropriately a project team to: a. Review the current state; b. Develop a robust case for change; c. Develop an assessment of shared services options; d. Identify potential partners; e. Drive the implementation focusing on the benefits; and f. Establish regular reporting on progress of the programme to the board to
drive realisation of the benefits sought.
Driving through the key steps (leveraging the information, advice and recommendations of this report) coupled with appropriate sponsorship and monitoring of progress from the board will drive realisation of the benefits.
Figure 26 below describes a typical timetable within which these activities should be undertaken.
Figure 26: High-level timeline for key actions
1 2 3 4 5 6 7 8 9 10 11 12 13 14 15 16 17 18 19 20 21 22 23 24
Review QIPP benchmarking
Board meeting to agree approach
Set‐up programme team
Review current state ‐benchmarking
Review current state ‐Systems evaluation
Review current state ‐Readiness assessment
Develop case for change
Assess shared services options
Identify potential partners
Implementation planning
Create a detailed roadmap
Implementation kick‐off
15. What to do next
70
QIPP national workstream: Back office efficiency and management optimisation
15.1. Setting up a programme team
• Organisations should review the benchmarking data and make an assessment of where they are in relation to their peers and in what areas efficiencies can be made (Section 5.8).
• Organisations that have yet to benchmark themselves should do so using the FTN contact point.
• A programme manager should be appointed to be responsible for developing an implementation plan and subsequently delivering a transformed back office for the organisation.
• A steering group of stakeholders should be set up to oversee the transformation. The Chief Executive or a member of the board should have ultimate responsibility for ensuring that the efficiencies are made.
15.2. Review the current state of the organisation
• Rigorous and robust benchmarking, measurement and analysis of the organisation’s current financial, operational and workforce position are critical to developing a compelling case for change. This will provide a firm basis on which a detailed implementation and delivery plan can be developed and implemented.
• All analytical information should be robustly validated to ensure that the transformation design options are based on fully accurate and relevant data.
• An activity-based costing exercise should be set up to determine the actual costs of processes and functions for the organisation as outlined in Section 7.1 of this report. This will inform the case for change.
• Opportunities for service improvement should be clearly identified, particularly for non-value-adding activities (including process, systems and data) as described in Section 7.3.
• A thorough and robust assessment needs to be made of whether the organisation is ready to go through a transformation programme. This assessment will drive the detailed implementation plan and highlight potential risks and barriers to successful implementation. This assessment should include a review of:
− Maturity, preparedness and capability of the board/executive team to undertake this change;
− Level of effective partnership working between management and trade unions;
− Robustness of existing communication mechanisms at all levels within the organisation; and
− Consideration of any organisational learning from previous change programmes/processes.
15.3. Develop the case for change A clear and compelling case for change should be developed, with the engagement of key stakeholders, which is underpinned by the measurement, benchmarking and analysis work undertaken which reflects the organisation’s strategic vision for the transformation of back office functions.
The case for change should include a robust analysis of each of the options set out in Section 8. This should be evidenced with appropriate analysis which is validated and prioritised to enable the organisation to make a firm decision regarding the preferred organisational design. The options analysis should be based on:
QIPP national workstream: Back office efficiency and management optimisation 71
• A firm set of design principles for the transformation of back office functions, which have been developed through good engagement with staff and relevant stakeholders;
• A full assessment of the shared service options described in Section 8, including implementing different options over time, for example moving from option 8.2 (shared service co-operative) through to 8.5 (outsourcing); and
• Identification of potential shared service partners and an assessment of the benefits and challenges of sharing services with them.
A clear and compelling business case should be developed which captures the anticipated organisational benefits from the preferred design, particularly in terms of cost efficiencies and service improvement. The business case should:
• Provide a clear explanation of organisational benefits, showing links to the programme objectives and how benefits will be tracked going forward;
• Highlight the ongoing costs and benefits, including the one-off investment costs for implementing the recommended organisation design; and
• Outline the key steps that will be required to realise these organisational benefits.
15.4. Create a detailed roadmap
• This is the high-level plan showing the appropriate roadmap phasing with practical steps to achieve the selected organisation design over time, with interdependencies and milestones.
• Put in place change and communication plans outlining involvement of stakeholders and the broader business.
• The plan should take into account and include existing business initiatives and projects.
15.5. Focus on implementation A firm organisational focus and commitment to timely and robust implementation is crucial to delivering the new model and the associated benefits within an acceptable timeframe. The following organisational enablers are necessary for effectively delivering transformed back office functions:
• Strong executive/board champions and leadership for implementing the transformation. This should include a steering group of stakeholders to oversee the transformation. The Chief Executive or a member of the board should have ultimate responsibility for ensuring that the efficiencies are made;
• Adequate and dedicated resources, capability and capacity for making the transformation happen;
• Clear and unambiguous success criteria and KPIs for the transformation of back office functions, over the short, medium and long term;
• A capable, competent and empowered programme team, led by a suitably skilled programme manager; and
• A clear approach for engaging staff-side organisations in all stages of the implementation, prior to and during formal periods of consultation.
72
QIPP national workstream: Back office efficiency and management optimisation
Tony Spotswood, Chief Executive, Royal Bournemouth and Christchurch Hospitals NHS FT. Lead for the programme and chair of the review group
Bill Street, Deputy Director of Finance – Special projects, Chelsea & Westminster
Bob Telford, Commercial Director, Northumbria Healthcare NHS FT
Carl Vincent, Deputy Director of Commercial Operations, Department of Health
Clare Curran, Director of Human Resources and Organisational Development, North Tees and Hartlepool NHS FT
David Young, Director of Finance, Calderstones NHS Partnership FT
Jayne Payling, Director of Finance, Papworth NHS FT
Guy Musson, HR Director, Leeds Partnership NHS FT
Heather Lawrence, Chief Executive, Chelsea & Westminster
Institute of Employment Studies
Jim Mackey, Chief Executive, Northumbria Healthcare NHS FT
Julie Stenning, Assistant Director of Finance, NHS Institute
Keith Griffiths, Director of Finance and Information, Wrightington, Wigan & Leigh NHS FT
Malcom Cassells, Director of Finance and Procurement, Salisbury NHS FT
Mckinsey & Company
Mike Sexton, Director of Finance, University Hospitals Birmingham NHS FT
Neil Griffiths, The Capita Group Plc
Neil Robertson, Assistant Director of Fleet, Derwent Shared Services
Paul Betts, Economic Adviser, Foundation Trust Network
Paul Jones, Interim Executive
PricewaterhouseCoopers LLP
Richard Alexander, Director of Finance, UCL NHS FT
Suzanne Tracey, Director of Finance and Business Development, Royal Devon and Exeter NHS FT
Sue Lorimer, Director of Finance and Commissioning, Alder Hey Childrens NHS FT
The Shared Service Development Network
16. Contributors to this report