Embed Size (px)
Citation preview
CoP/Training Call
A Framework for Measuring the
Triple Aim, with a Special Focus on
Equity and Disparities
Guest Speakers:
Kevin Nolan, Mstat, MA
Matt Stiefel, MPH
Sharon Takeda Platt, PhD
May 14, 2013
2:00 PM Eastern Time
2
Agenda
• DNCC Update
• Training
3
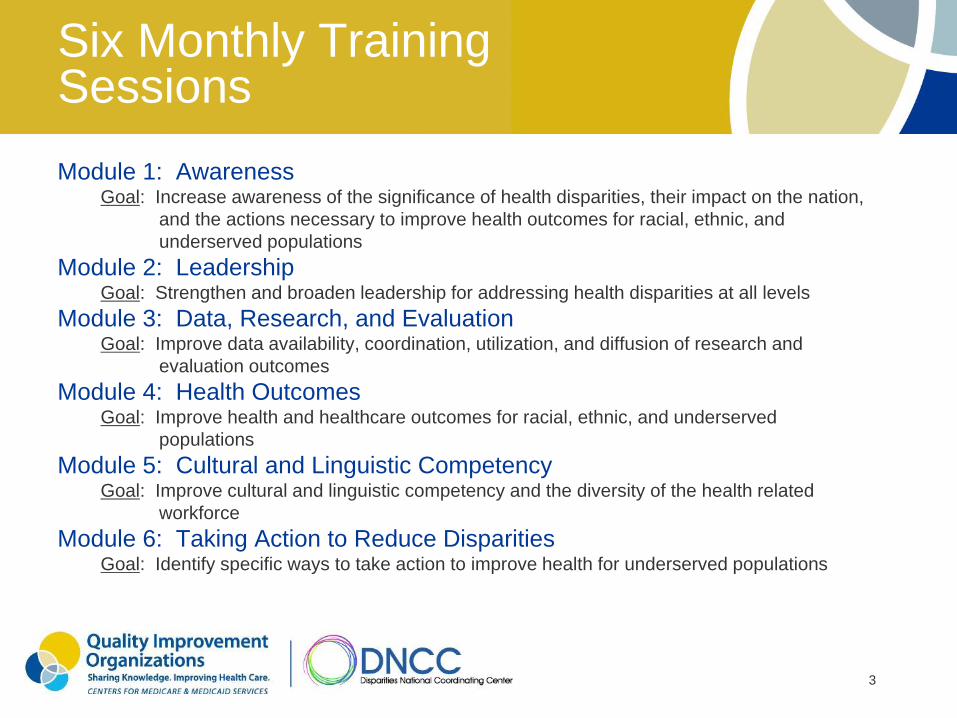
Six Monthly Training Sessions
Module 1: Awareness Goal: Increase awareness of the significance of health disparities, their impact on the nation,
and the actions necessary to improve health outcomes for racial, ethnic, and
underserved populations
Module 2: Leadership Goal: Strengthen and broaden leadership for addressing health disparities at all levels
Module 3: Data, Research, and Evaluation Goal: Improve data availability, coordination, utilization, and diffusion of research and
evaluation outcomes
Module 4: Health Outcomes Goal: Improve health and healthcare outcomes for racial, ethnic, and underserved
populations
Module 5: Cultural and Linguistic Competency Goal: Improve cultural and linguistic competency and the diversity of the health related
workforce
Module 6: Taking Action to Reduce Disparities Goal: Identify specific ways to take action to improve health for underserved populations
Update from the DNCC
5
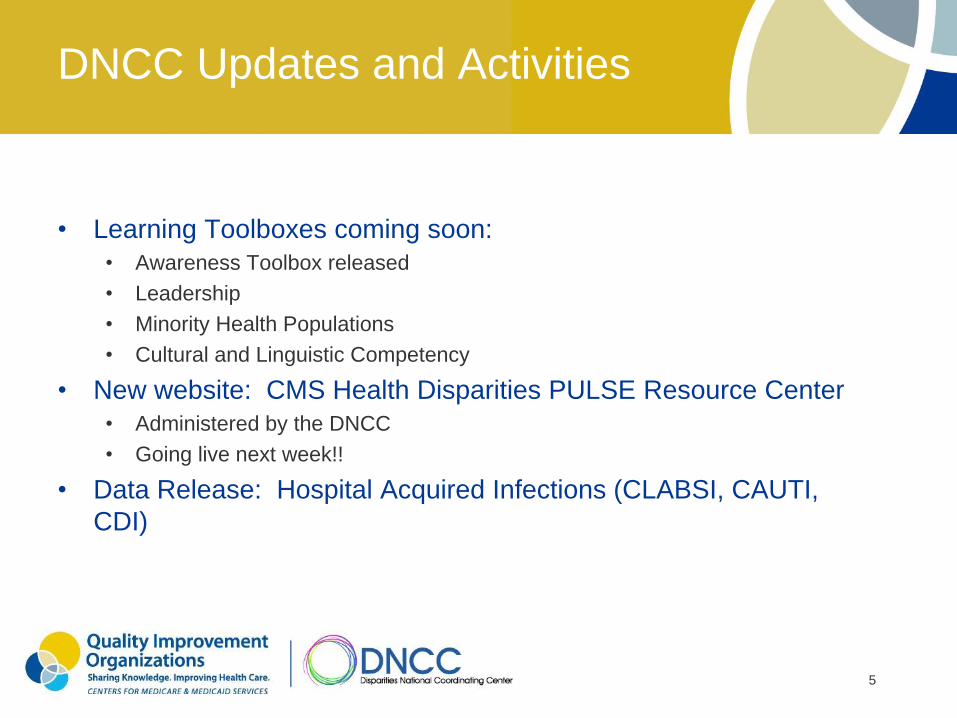
DNCC Updates and Activities
• Learning Toolboxes coming soon:
• Awareness Toolbox released
• Leadership
• Minority Health Populations
• Cultural and Linguistic Competency
• New website: CMS Health Disparities PULSE Resource Center
• Administered by the DNCC
• Going live next week!!
• Data Release: Hospital Acquired Infections (CLABSI, CAUTI,
CDI)
6
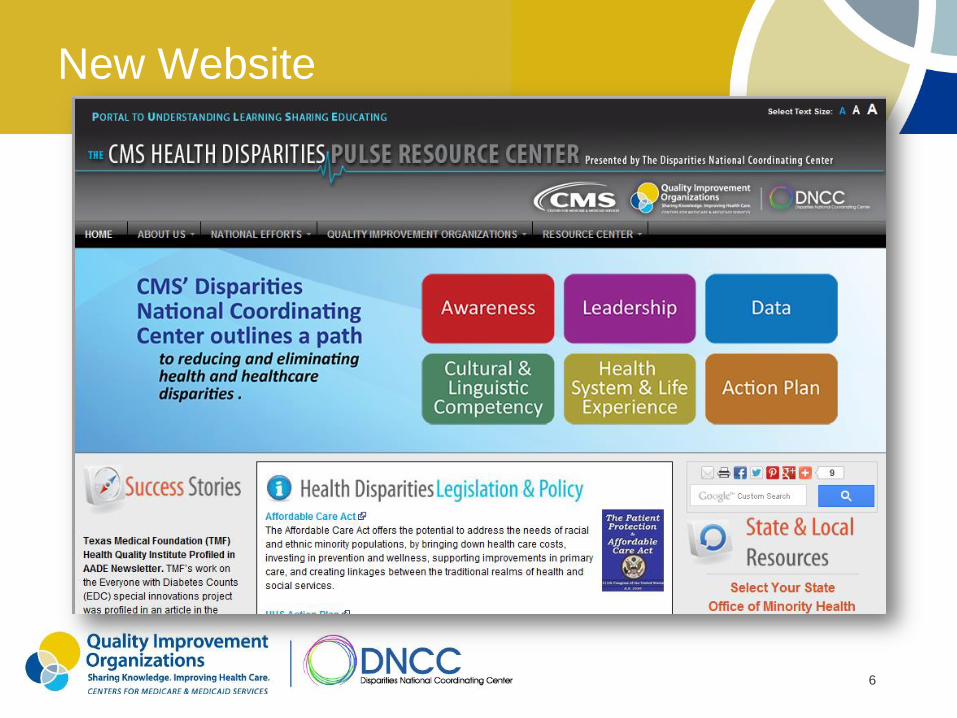
New Website
7
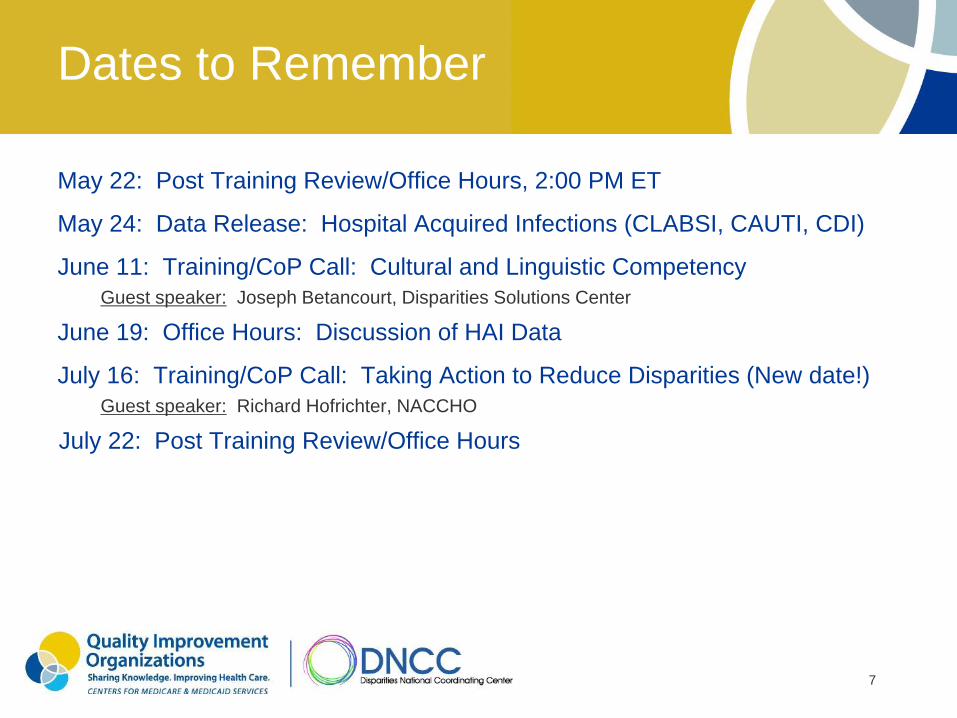
Dates to Remember
May 22: Post Training Review/Office Hours, 2:00 PM ET
May 24: Data Release: Hospital Acquired Infections (CLABSI, CAUTI, CDI)
June 11: Training/CoP Call: Cultural and Linguistic Competency
Guest speaker: Joseph Betancourt, Disparities Solutions Center
June 19: Office Hours: Discussion of HAI Data
July 16: Training/CoP Call: Taking Action to Reduce Disparities (New date!)
Guest speaker: Richard Hofrichter, NACCHO
July 22: Post Training Review/Office Hours
8
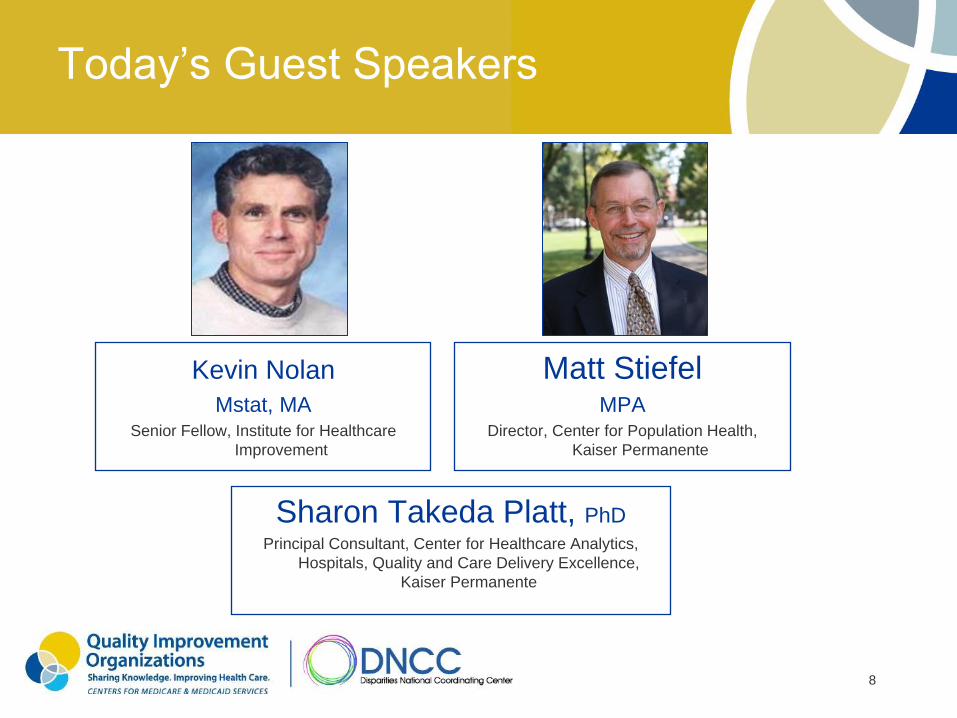
Today’s Guest Speakers
Matt Stiefel MPA
Director, Center for Population Health,
Kaiser Permanente
Kevin Nolan Mstat, MA
Senior Fellow, Institute for Healthcare
Improvement
Sharon Takeda Platt, PhD
Principal Consultant, Center for Healthcare Analytics,
Hospitals, Quality and Care Delivery Excellence,
Kaiser Permanente
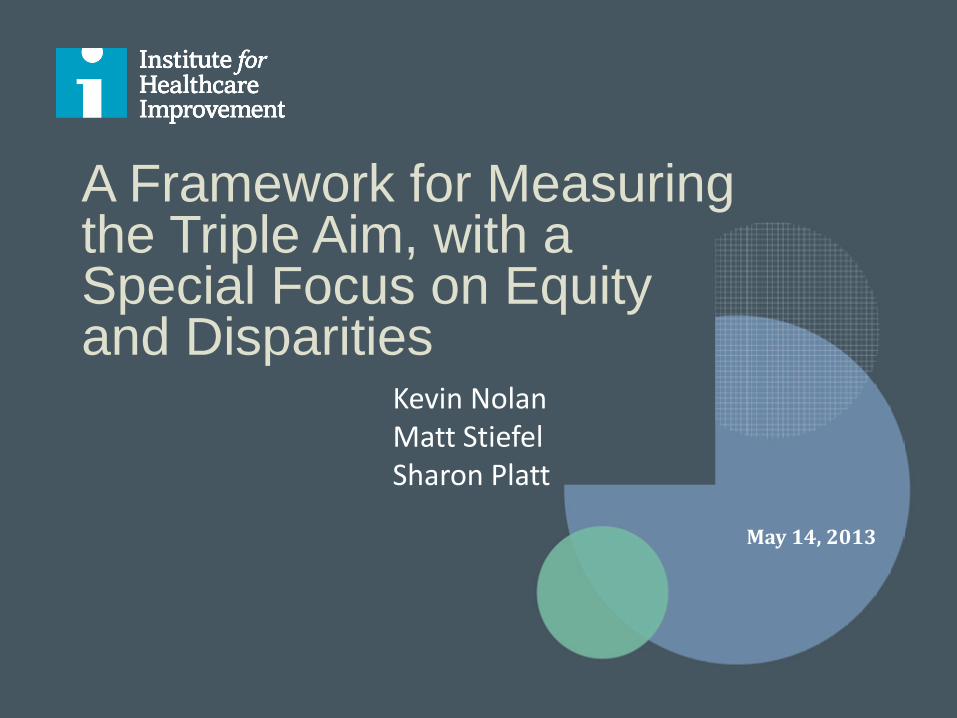
A Framework for Measuring the Triple Aim, with a Special Focus on Equity and Disparities
May 14, 2013
Kevin Nolan Matt Stiefel Sharon Platt
10
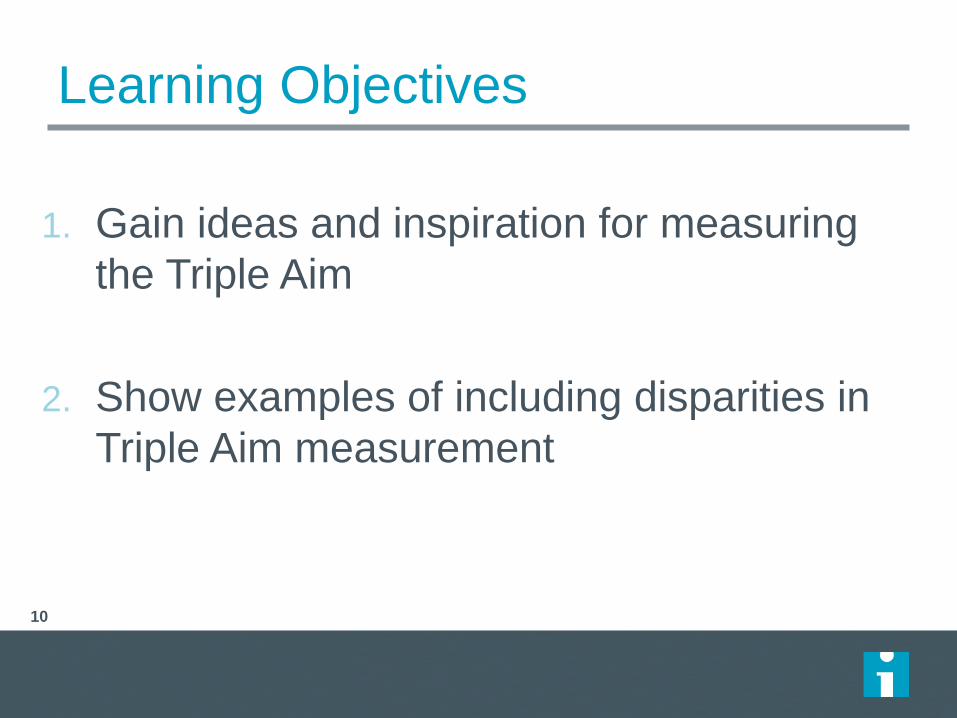
Learning Objectives
1. Gain ideas and inspiration for measuring
the Triple Aim
2. Show examples of including disparities in
Triple Aim measurement
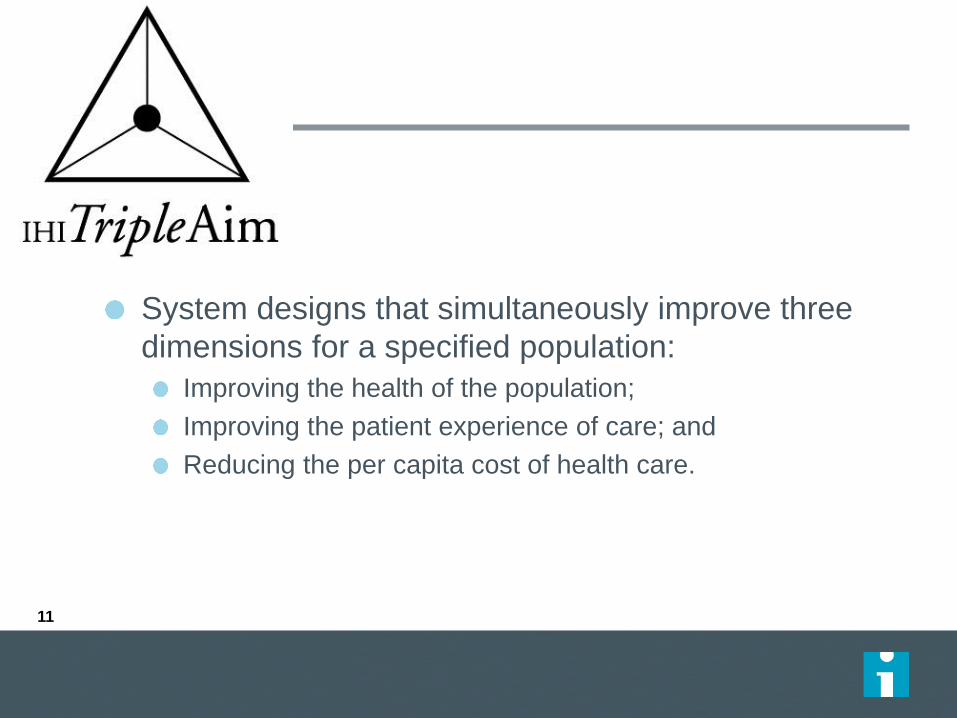
Definition
System designs that simultaneously improve three
dimensions for a specified population:
Improving the health of the population;
Improving the patient experience of care; and
Reducing the per capita cost of health care.
11
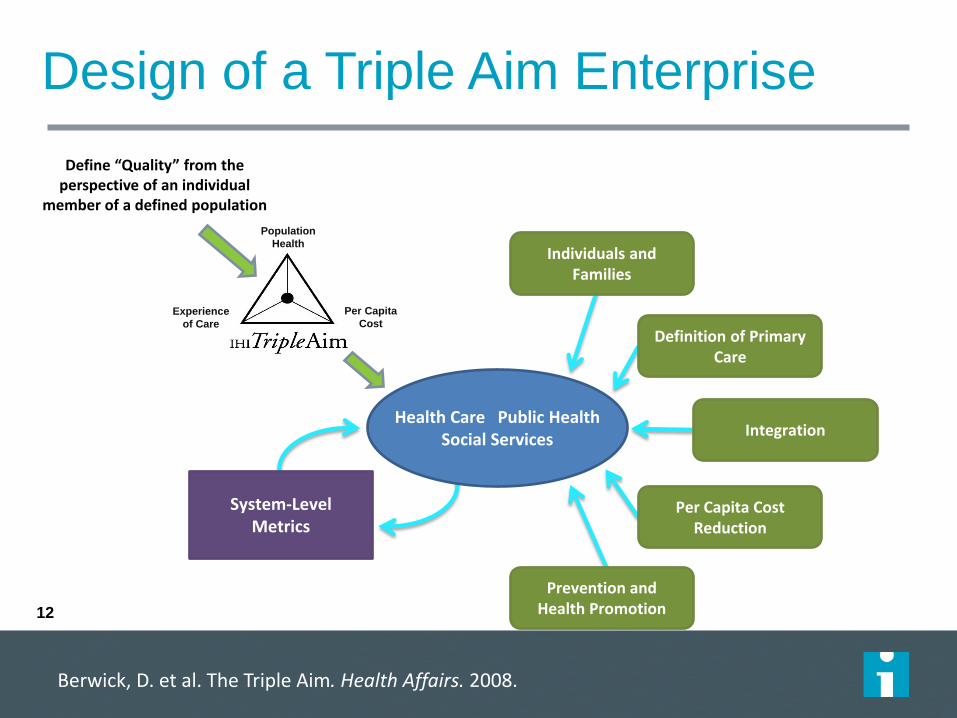
Design of a Triple Aim Enterprise
Define “Quality” from the perspective of an individual
member of a defined population
Per Capita
Cost Experience
of Care
Population
Health
Health Care Public Health Social Services
Individuals and Families
Definition of Primary Care
Integration
Per Capita Cost Reduction
Prevention and Health Promotion
System-Level Metrics
Berwick, D. et al. The Triple Aim. Health Affairs. 2008.
12
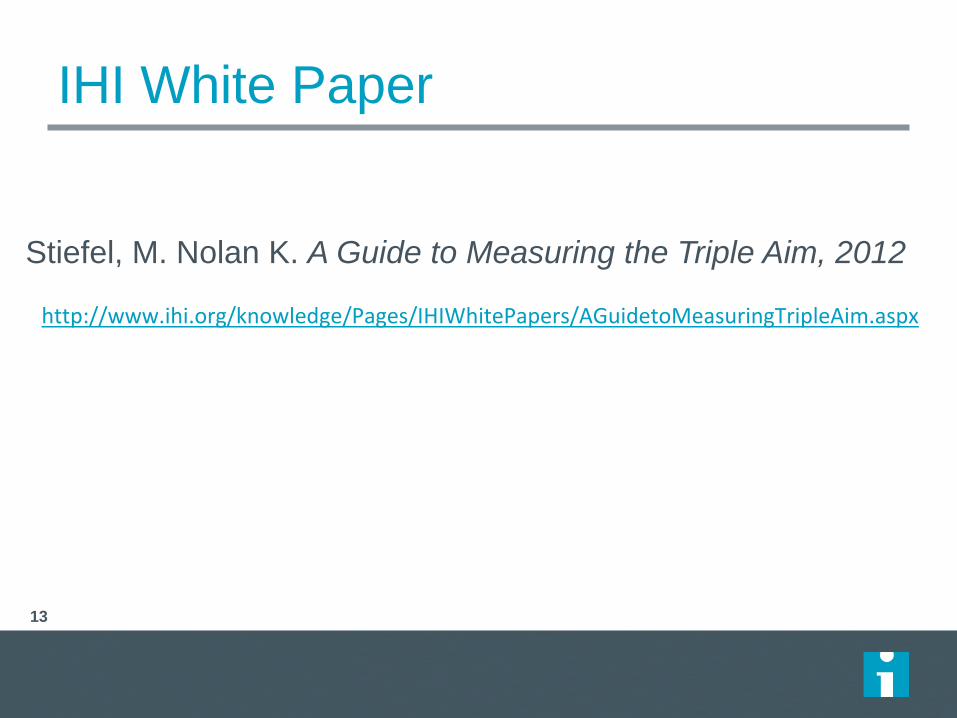
IHI White Paper
13
A Guide to Measuring the Triple Aim http://www.ihi.org/knowledge/Pages/IHIWhitePapers/AGuidetoMeasuringTripleAim.aspx
Stiefel, M. Nolan K. A Guide to Measuring the Triple Aim, 2012
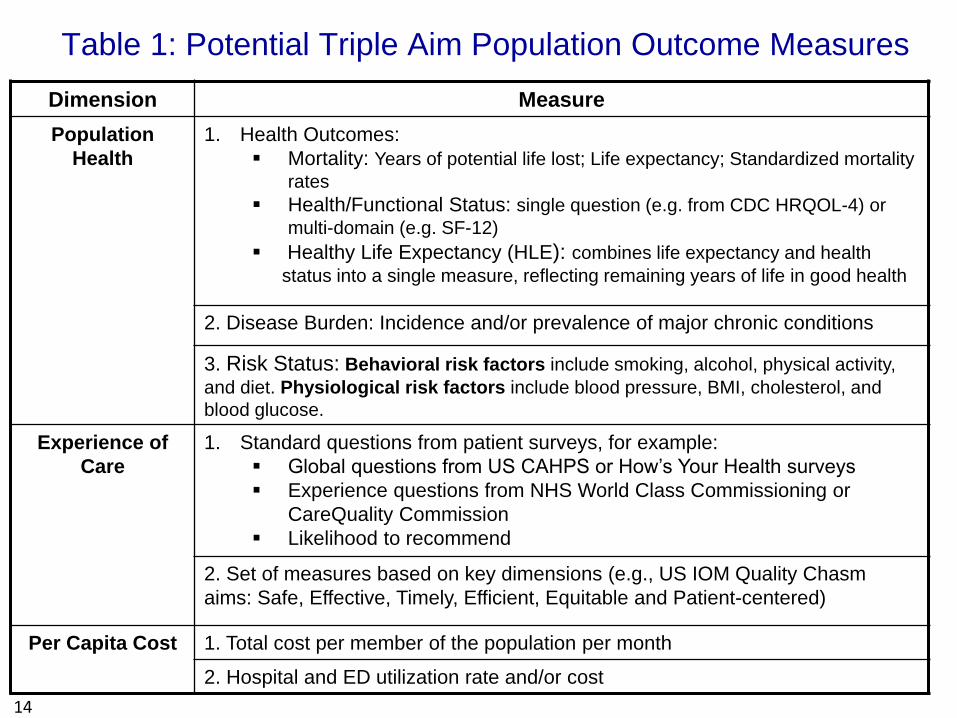
Table 1: Potential Triple Aim Population Outcome Measures
14
Dimension Measure
Population
Health
1. Health Outcomes:
Mortality: Years of potential life lost; Life expectancy; Standardized mortality
rates
Health/Functional Status: single question (e.g. from CDC HRQOL-4) or
multi-domain (e.g. SF-12)
Healthy Life Expectancy (HLE): combines life expectancy and health
status into a single measure, reflecting remaining years of life in good health
2. Disease Burden: Incidence and/or prevalence of major chronic conditions
3. Risk Status: Behavioral risk factors include smoking, alcohol, physical activity,
and diet. Physiological risk factors include blood pressure, BMI, cholesterol, and
blood glucose.
Experience of
Care
1. Standard questions from patient surveys, for example:
Global questions from US CAHPS or How’s Your Health surveys
Experience questions from NHS World Class Commissioning or
CareQuality Commission
Likelihood to recommend
2. Set of measures based on key dimensions (e.g., US IOM Quality Chasm
aims: Safe, Effective, Timely, Efficient, Equitable and Patient-centered)
Per Capita Cost 1. Total cost per member of the population per month
2. Hospital and ED utilization rate and/or cost
15
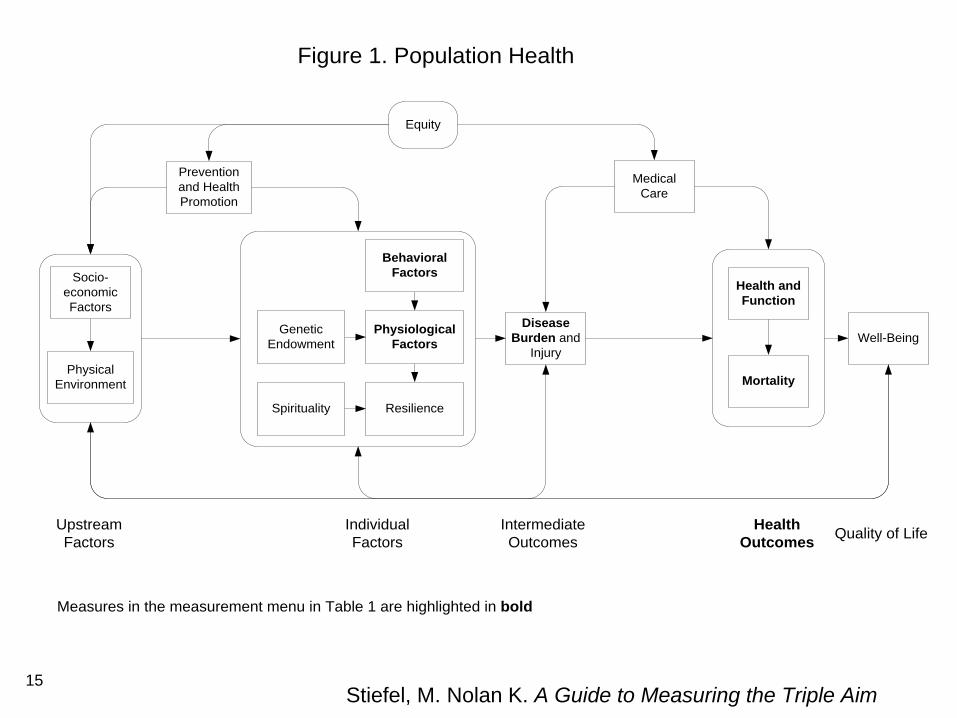
Health and
Function
Physical
Environment
Disease
Burden and
Injury
Well-Being
Mortality
Figure 1. Population Health
Upstream
Factors
Individual
Factors
Intermediate
Outcomes
Health
OutcomesQuality of Life
Prevention
and Health
Promotion
Medical
Care
Socio-
economic
Factors
Physiological
Factors
Behavioral
Factors
Resilience
Equity
Genetic
Endowment
Spirituality
Measures in the measurement menu in Table 1 are highlighted in bold
Stiefel, M. Nolan K. A Guide to Measuring the Triple Aim
16
17
18
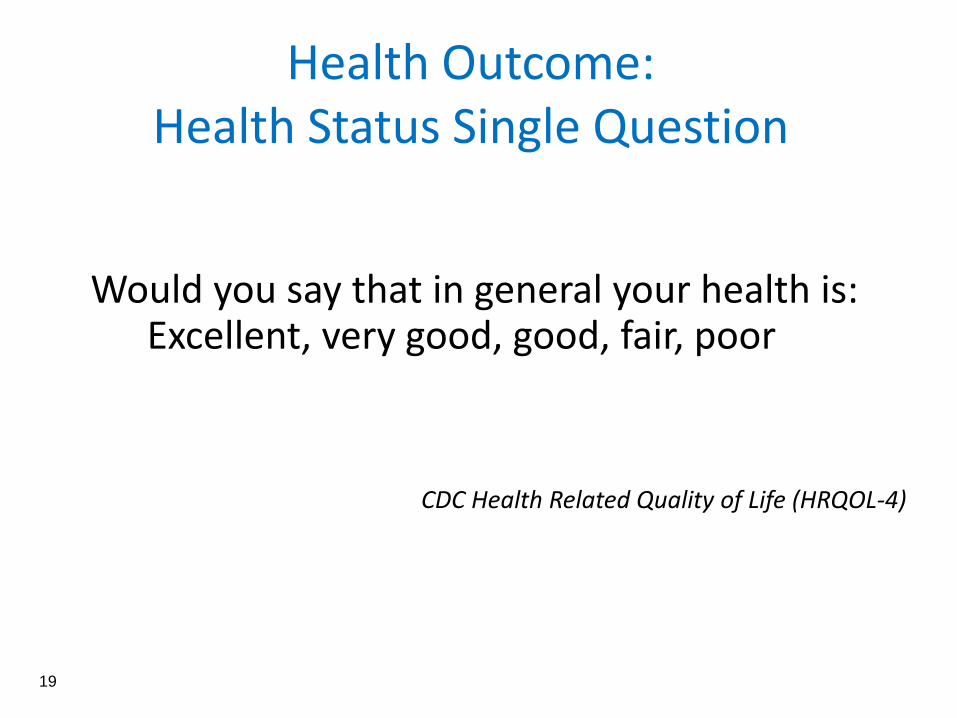
Health Outcome: Health Status Single Question
Would you say that in general your health is: Excellent, very good, good, fair, poor
CDC Health Related Quality of Life (HRQOL-4)
19
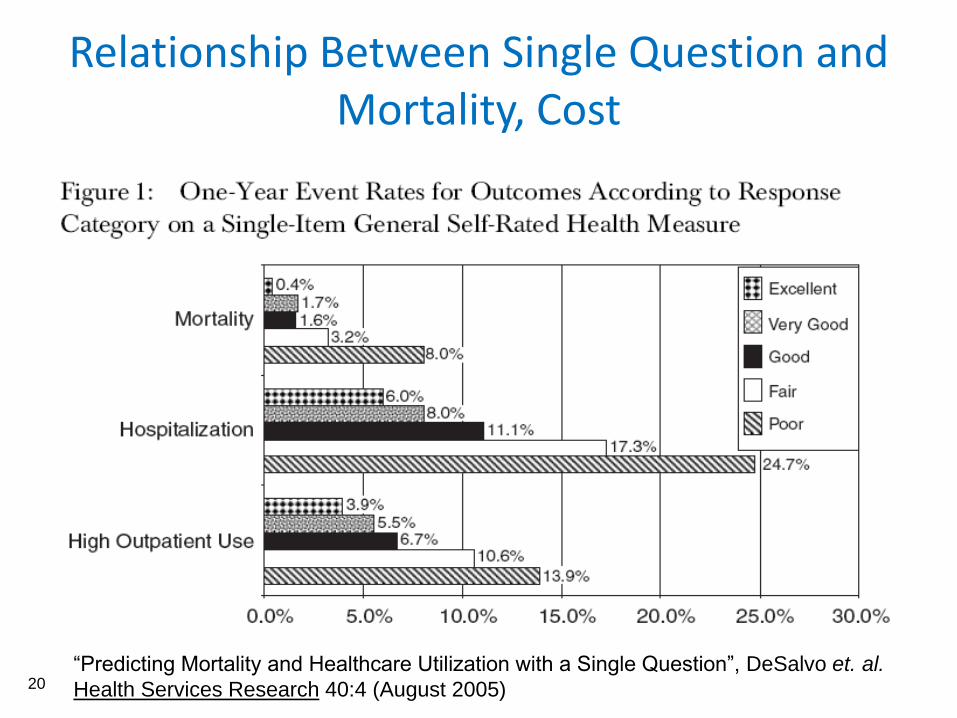
Relationship Between Single Question and Mortality, Cost
“Predicting Mortality and Healthcare Utilization with a Single Question”, DeSalvo et. al.
Health Services Research 40:4 (August 2005)
20
21
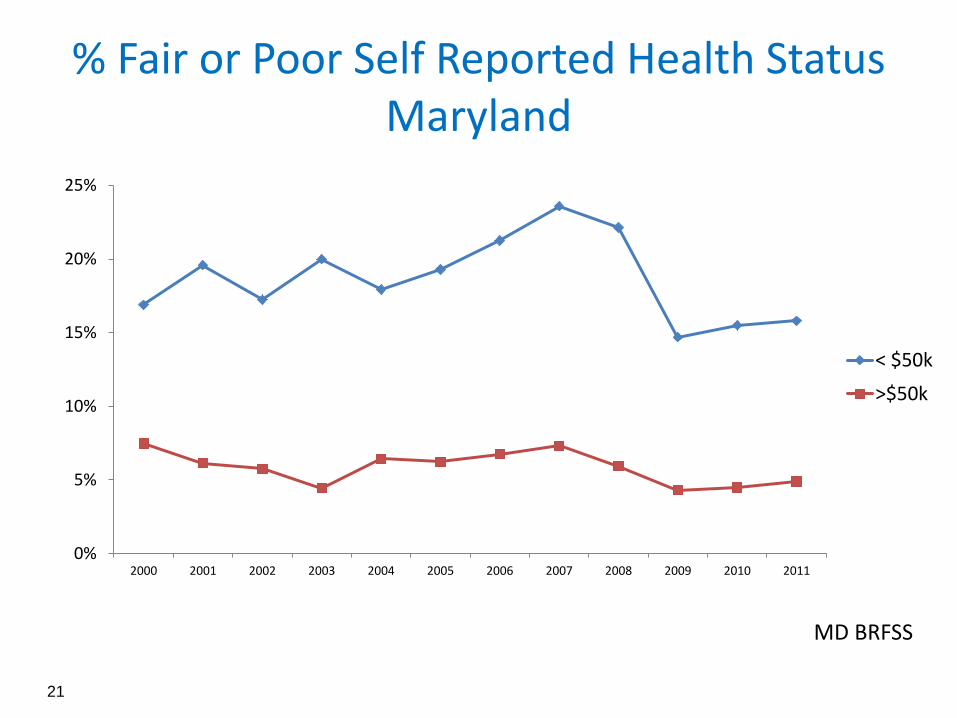
% Fair or Poor Self Reported Health Status Maryland
MD BRFSS
0%
5%
10%
15%
20%
25%
2000 2001 2002 2003 2004 2005 2006 2007 2008 2009 2010 2011
< $50k
>$50k
Stiefel, M. Nolan K. A Guide to Measuring the Triple Aim
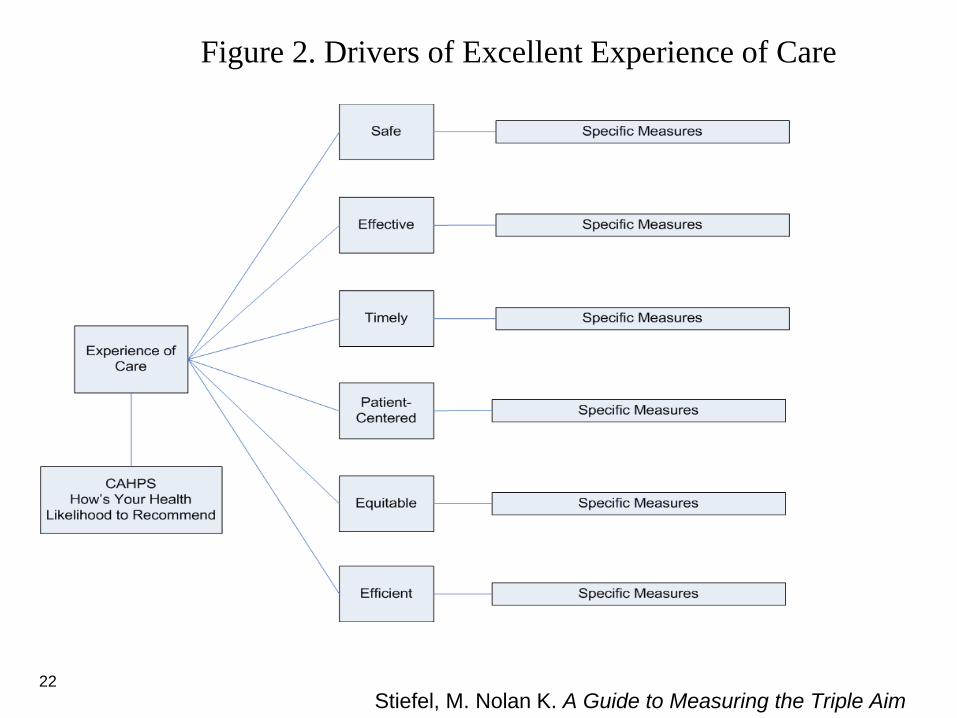
Figure 2. Drivers of Excellent Experience of Care
22
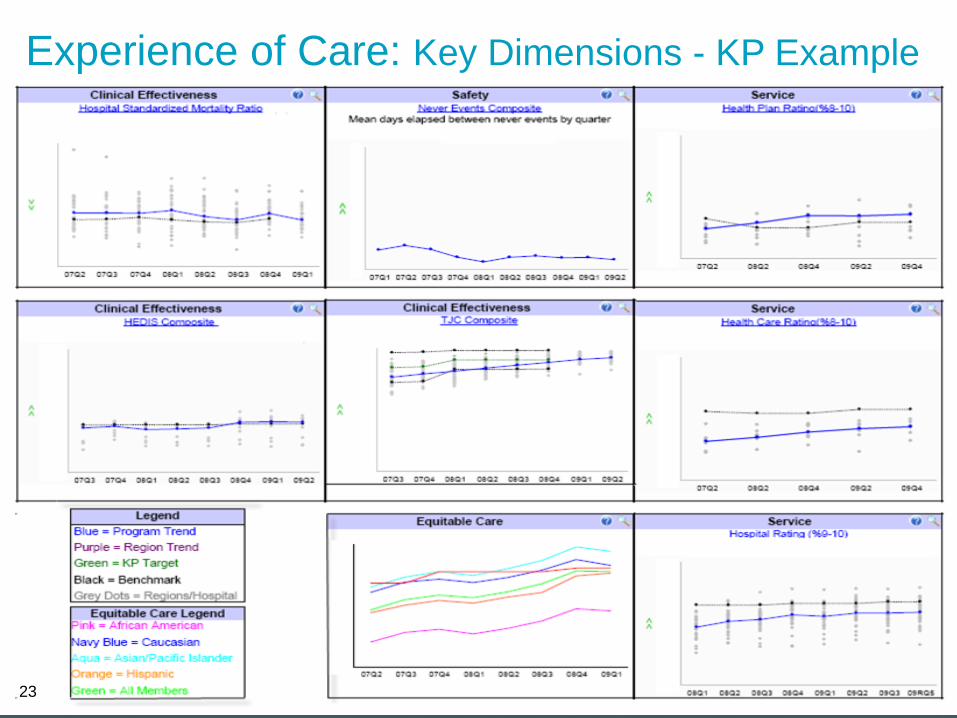
Experience of Care: Key Dimensions - KP Example
23
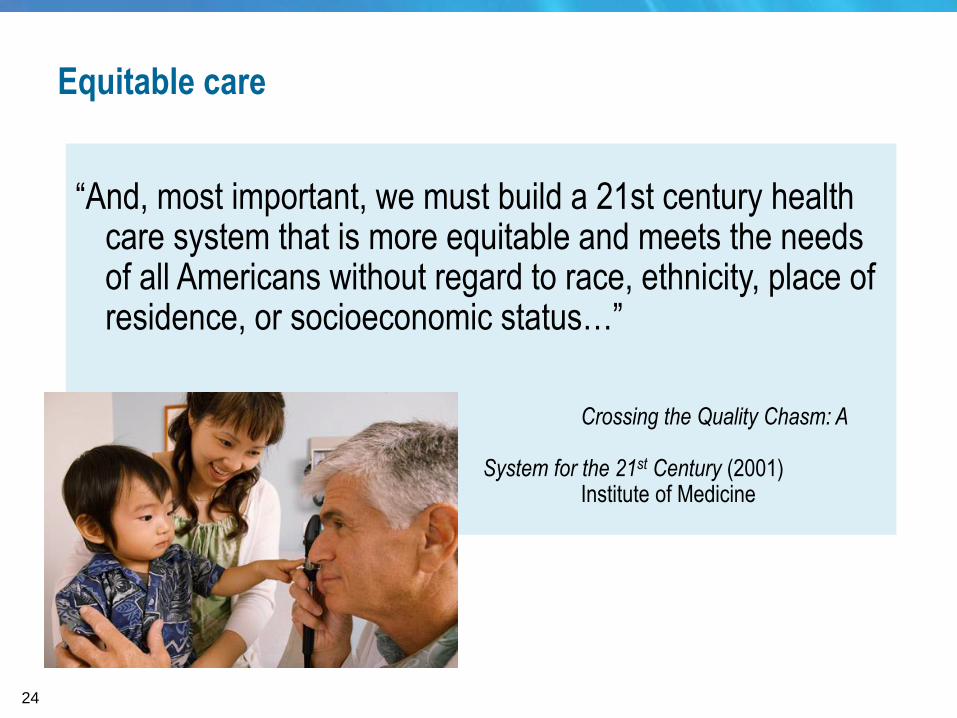
Equitable care
“And, most important, we must build a 21st century health care system that is more equitable and meets the needs of all Americans without regard to race, ethnicity, place of residence, or socioeconomic status…”
Crossing the Quality Chasm: A
New Health System for the 21st Century (2001) Institute of Medicine
24
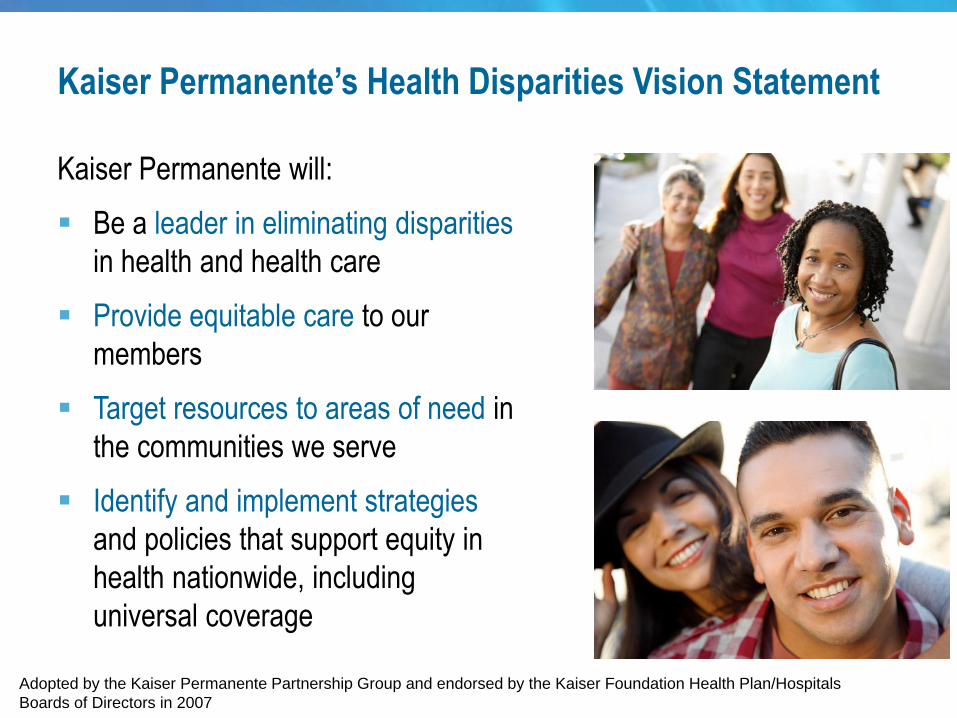
Kaiser Permanente’s Health Disparities Vision Statement
Kaiser Permanente will:
Be a leader in eliminating disparities
in health and health care
Provide equitable care to our
members
Target resources to areas of need in
the communities we serve
Identify and implement strategies
and policies that support equity in
health nationwide, including
universal coverage
Adopted by the Kaiser Permanente Partnership Group and endorsed by the Kaiser Foundation Health Plan/Hospitals
Boards of Directors in 2007
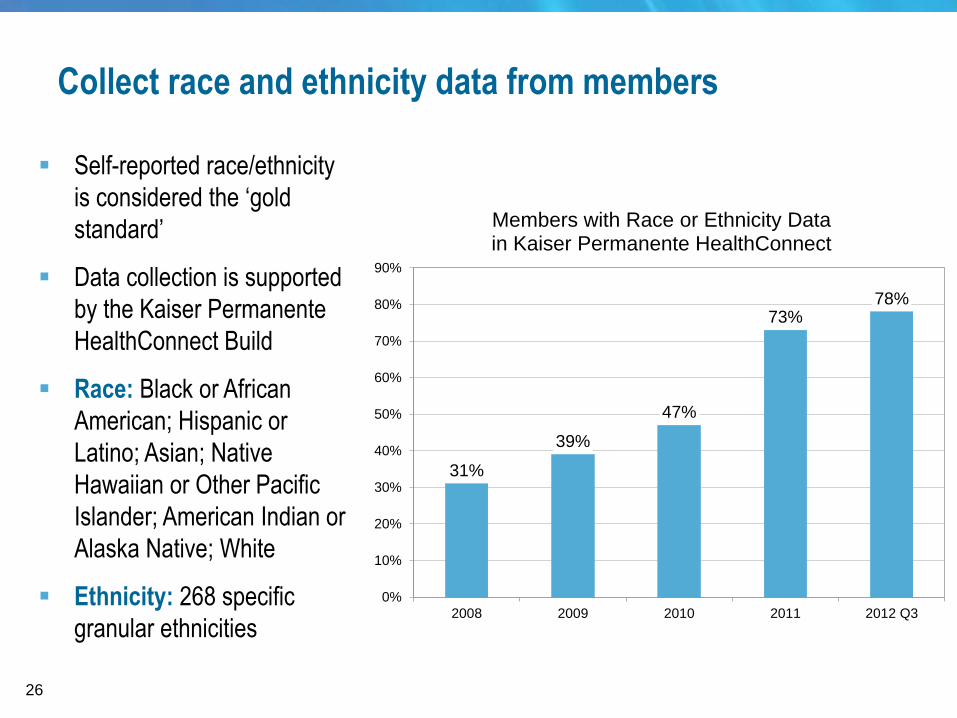
Collect race and ethnicity data from members
Self-reported race/ethnicity
is considered the ‘gold
standard’
Data collection is supported
by the Kaiser Permanente
HealthConnect Build
Race: Black or African
American; Hispanic or
Latino; Asian; Native
Hawaiian or Other Pacific
Islander; American Indian or
Alaska Native; White
Ethnicity: 268 specific
granular ethnicities
31%
39%
47%
73%78%
0%
10%
20%
30%
40%
50%
60%
70%
80%
90%
2008 2009 2010 2011 2012 Q3
Members with Race or Ethnicity Data in Kaiser Permanente HealthConnect
26
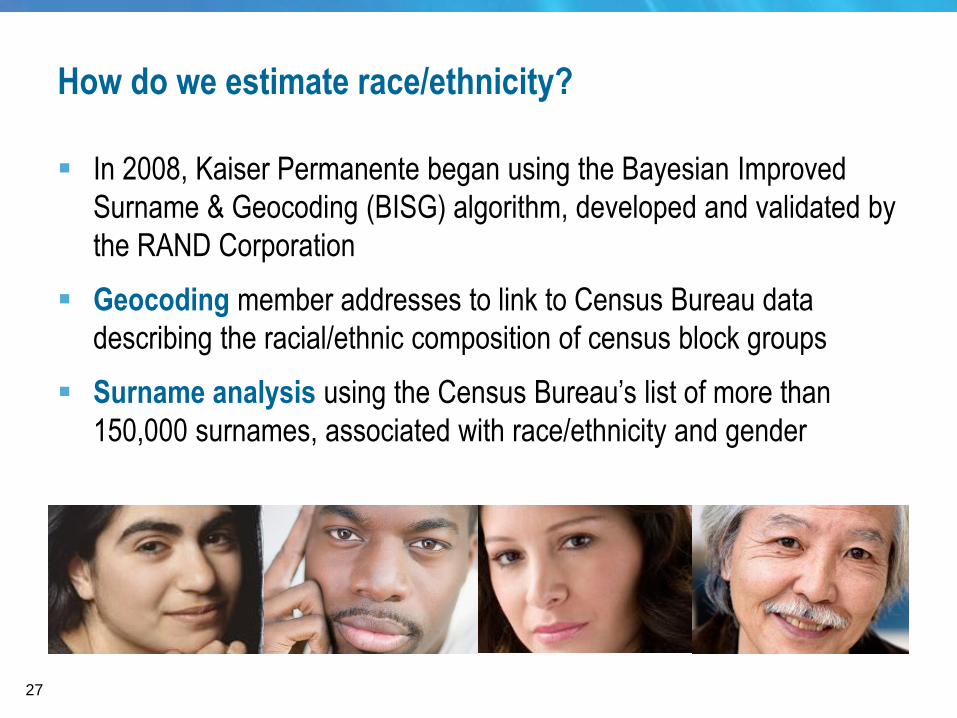
How do we estimate race/ethnicity?
In 2008, Kaiser Permanente began using the Bayesian Improved
Surname & Geocoding (BISG) algorithm, developed and validated by
the RAND Corporation
Geocoding member addresses to link to Census Bureau data
describing the racial/ethnic composition of census block groups
Surname analysis using the Census Bureau’s list of more than
150,000 surnames, associated with race/ethnicity and gender
27
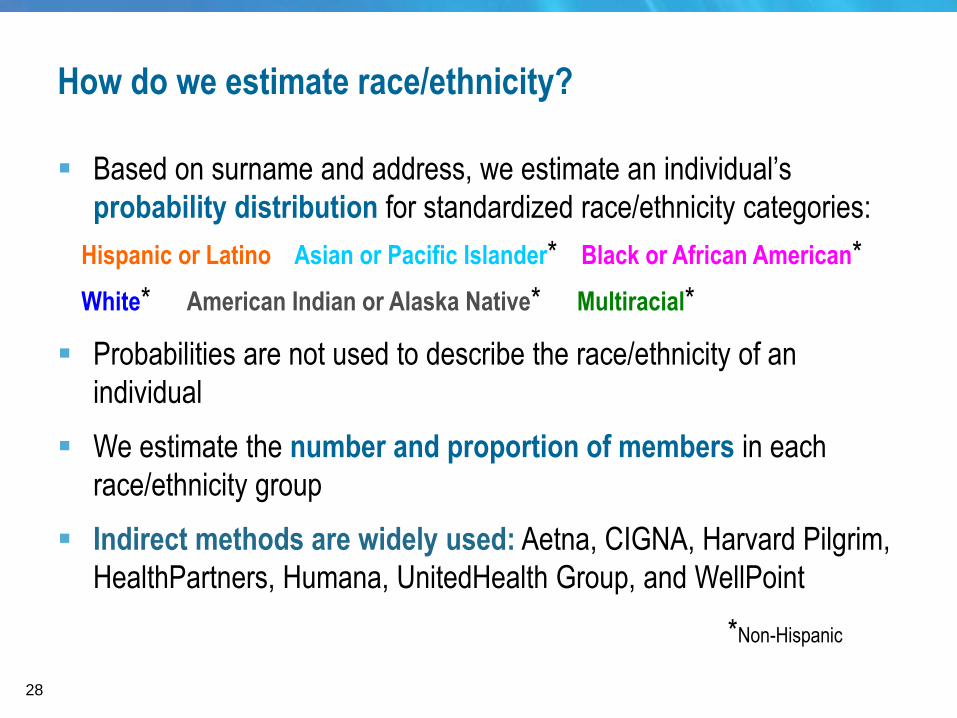
How do we estimate race/ethnicity?
Based on surname and address, we estimate an individual’s
probability distribution for standardized race/ethnicity categories:
Hispanic or Latino Asian or Pacific Islander* Black or African American*
White* American Indian or Alaska Native* Multiracial*
Probabilities are not used to describe the race/ethnicity of an
individual
We estimate the number and proportion of members in each
race/ethnicity group
Indirect methods are widely used: Aetna, CIGNA, Harvard Pilgrim,
HealthPartners, Humana, UnitedHealth Group, and WellPoint
*Non-Hispanic
28
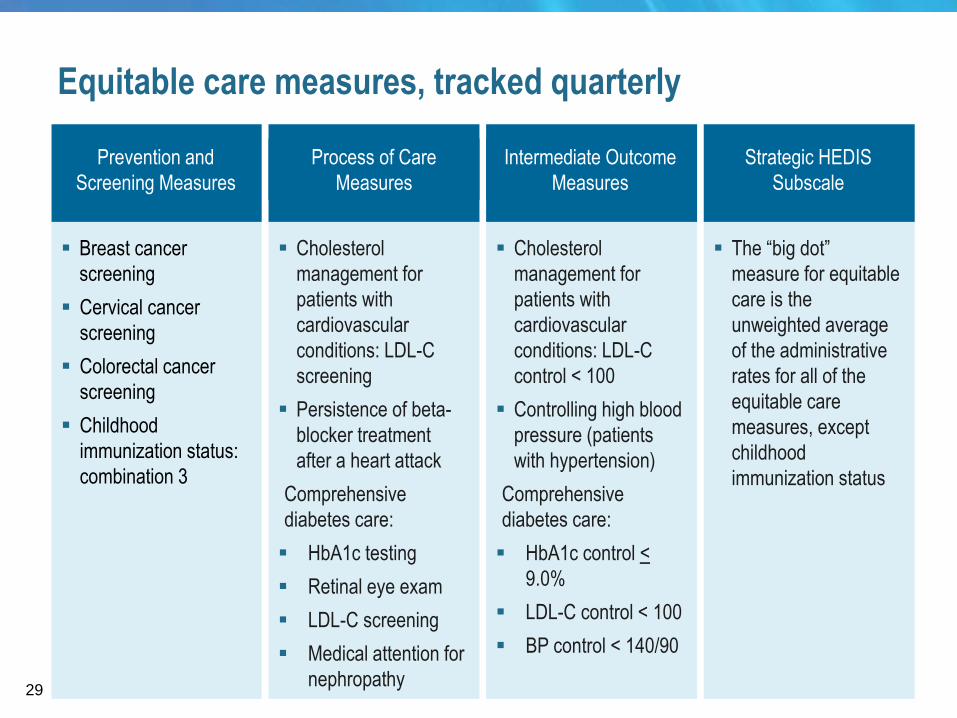
Prevention and
Screening Measures
Breast cancer
screening
Cervical cancer
screening
Colorectal cancer
screening
Childhood
immunization status:
combination 3
Intermediate Outcome
Measures
Process of Care
Measures
Strategic HEDIS
Subscale
Cholesterol
management for
patients with
cardiovascular
conditions: LDL-C
control < 100
Controlling high blood
pressure (patients
with hypertension)
Comprehensive
diabetes care:
HbA1c control <
9.0%
LDL-C control < 100
BP control < 140/90
The “big dot”
measure for equitable
care is the
unweighted average
of the administrative
rates for all of the
equitable care
measures, except
childhood
immunization status
Equitable care measures, tracked quarterly
Cholesterol
management for
patients with
cardiovascular
conditions: LDL-C
screening
Persistence of beta-
blocker treatment
after a heart attack
Comprehensive
diabetes care:
HbA1c testing
Retinal eye exam
LDL-C screening
Medical attention for
nephropathy 29
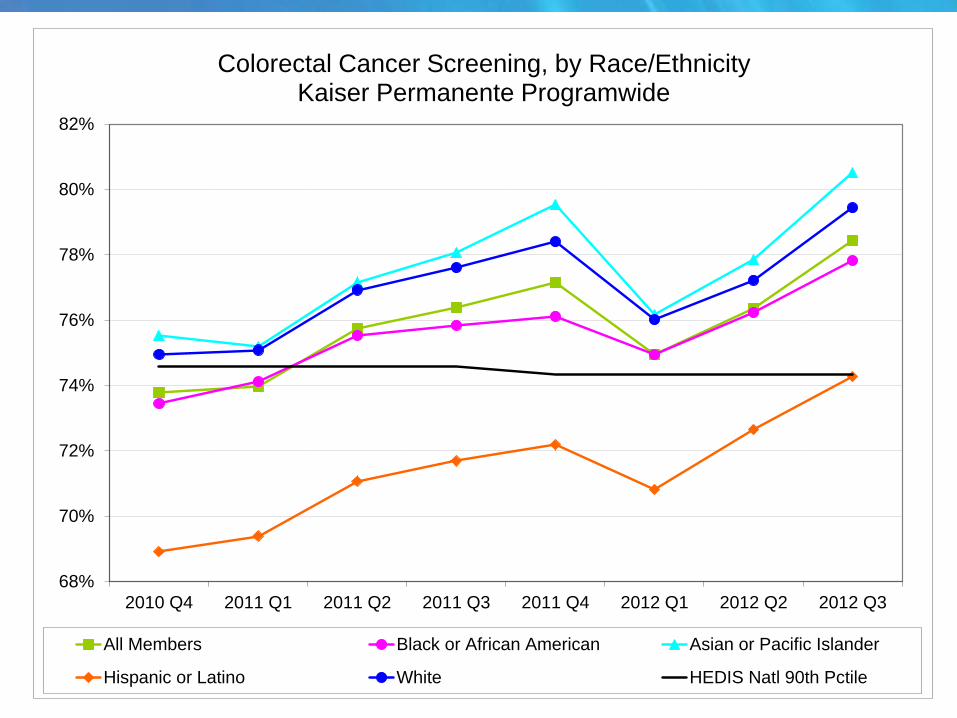
68%
70%
72%
74%
76%
78%
80%
82%
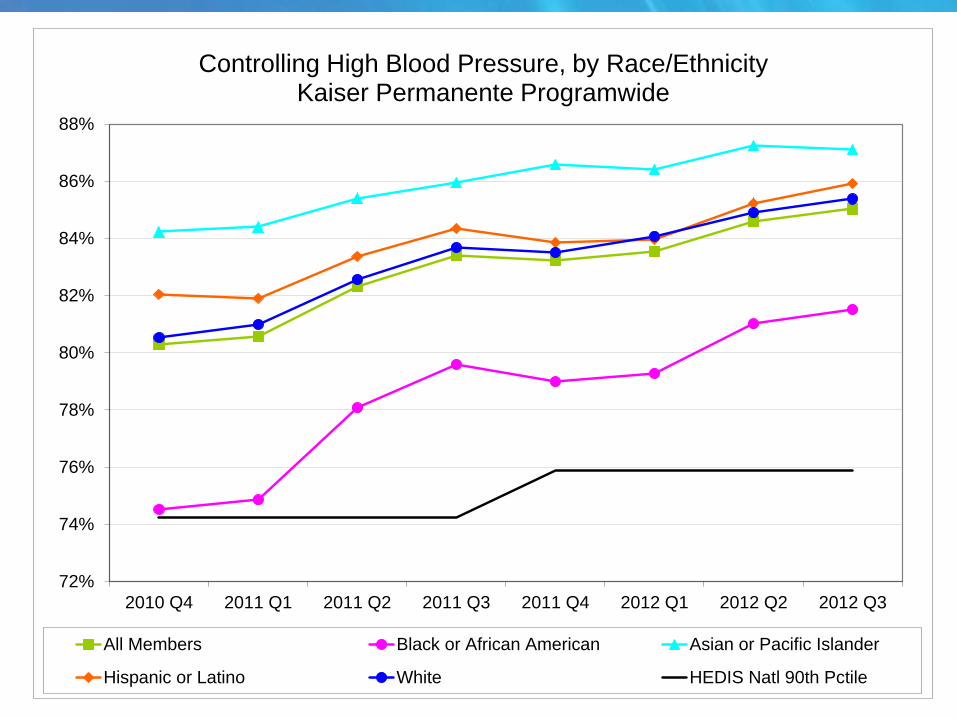
2010 Q4 2011 Q1 2011 Q2 2011 Q3 2011 Q4 2012 Q1 2012 Q2 2012 Q3
All Members Black or African American Asian or Pacific Islander
Hispanic or Latino White HEDIS Natl 90th Pctile
Colorectal Cancer Screening, by Race/EthnicityKaiser Permanente Programwide
72%
74%
76%
78%
80%
82%
84%
86%
88%
2010 Q4 2011 Q1 2011 Q2 2011 Q3 2011 Q4 2012 Q1 2012 Q2 2012 Q3
All Members Black or African American Asian or Pacific Islander
Hispanic or Latino White HEDIS Natl 90th Pctile
Controlling High Blood Pressure, by Race/EthnicityKaiser Permanente Programwide
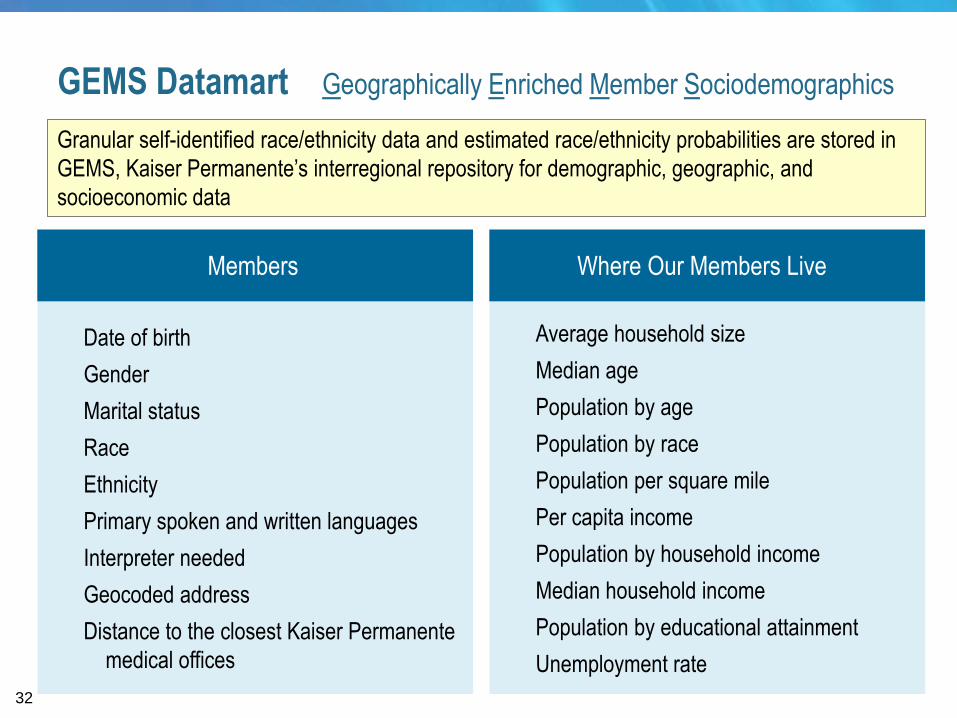
Average household size
Median age
Population by age
Population by race
Population per square mile
Per capita income
Population by household income
Median household income
Population by educational attainment
Unemployment rate
Date of birth
Gender
Marital status
Race
Ethnicity
Primary spoken and written languages
Interpreter needed
Geocoded address
Distance to the closest Kaiser Permanente
medical offices
Where Our Members Live
Granular self-identified race/ethnicity data and estimated race/ethnicity probabilities are stored in
GEMS, Kaiser Permanente’s interregional repository for demographic, geographic, and
socioeconomic data
Members
GEMS Datamart Geographically Enriched Member Sociodemographics
32
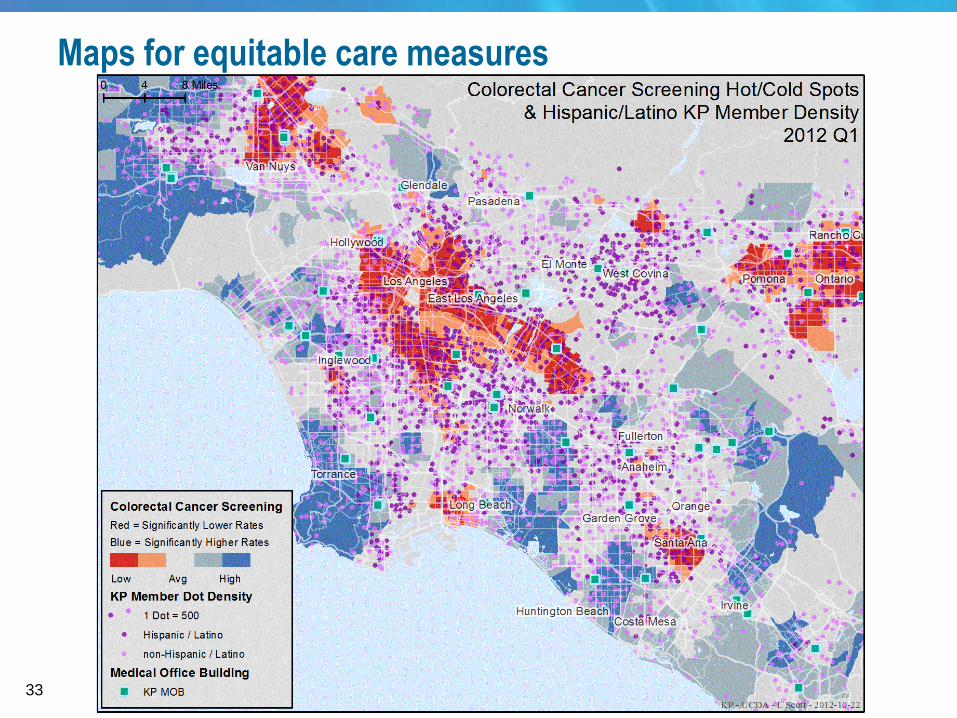
Maps for equitable care measures
33
Berwick D, Nolan T, Whittington J. The Triple Aim: Care, Cost, and Quality. Health Affairs. 2008;27(3):
759-769.
County Health Rankings: Mobilizing Action Toward Community Health:
http://www.countyhealthrankings.org/
Elliott MN, Morrison PA, et al., "Using the Census Bureau's Surname List to Improve Estimates of
Race/Ethnicity and Associated Disparities," Health Services and Outcomes Research Methodology,
9(2):69-83, 2009
Evans RG, Stoddart GL. Producing health, consuming health care. Soc Sci Med.1990;31(12):1347–1363.
Evans RG, Barer ML, Marmor TR, eds. Why are Some People Healthy and Others Not? The Determinants
of Health of Populations. Hawthorne, NY: Aldine De Gruyter; 1994.
Kindig D, Stoddart G. What is population health? Am J Public Health. 2003;93(3):380-383.
McGinnis JM, Williams-Russo P, Knickman JR. The case for more active policy attention to health
promotion. Health Aff. 2002;21(2):78-93.
Parrish RG. Measuring Population Health Outcomes. Prev Chronic Dis 2010:7(4).
http://www.cdc.gov/pcd/issues/2010/jul/10_0005.htm
Stiefel MC, Perla RJ, Zell BL. A Healthy Bottom Line: Healthy Life Expectancy as an Outcome Measure for
Health Improvement Efforts. The Milbank Quarterly. 2010;88(1):30-53.
DeSalvo, K.B., N. Bloser, K. Reynolds, J. He, and P. Muntner. 2006. Mortality Prediction with a Single
General Self-RatedHealth Question. A Meta-analysis. Journal of General Internal Medicine 21:267–75.
Crossing the Quality Chasm: A New Health System for the 21st Century (2001) - Institute of Medicine
Health Partners: Total Cost of Care – www.healthpartners.com/tcoc
Selected References
35
Q&A Press 14 to enter the queue to ask a question.
36
After Today’s Webinar
Evaluation
• Evaluation: Please fill out our evaluation at the end of today’s
call. Questions will also be sent via listserve.
Slides, recording, and transcript will be posted online.
• www.healthcarecommunities.org
Post-Training Review/Office Hours
• May 22nd, 2:00 ET
• This is an opportunity to discuss today’s presentation topic with
guest speakers and fellow QIOs.
37
Join the DNCC Community
To Join the DNCC Listserve:
• Log onto the SDPS system.
• Open Internet Explorer. Your default homepage should be qionet.sdps.org.
• At the top of the page, you should see a tab labeled “Listserve.” Click “Listserve.”
• Enter your user information at the top of the page and scroll down to “Disparities”.
Join “Discussion” and “Notify”.
• Click “Subscribe”.
To Join DNCC Healthcare Communities:
• Log onto www.healthcarecommunities.org
• Sign in, or create an account.
• Scroll over the “Communities” tab, scroll down to “Available Communities” and
select “QIO 10TH SOW”.
• Scroll down to DNCC and select “Join DNCC”.
38
Thank you for participating in today’s webinar.
At the close of the presentation, you will
automatically be directed to an evaluation screen.
This material was prepared by the Delmarva Foundation for Medical
Care (DFMC), the Disparities National Coordinating Center, under
contract with the Centers for Medicare & Medicaid Services (CMS),
an agency of the U.S. Department of Health and Human
Services. The contents presented do not necessarily reflect CMS
policy. 10SOW-MD-DNCC-050913-103.