Embed Size (px)
Citation preview
QI, in a nutshellQuality and Safety Educator’s Academy, Society of Hospital Medicineand Georgia McIntosh, MD
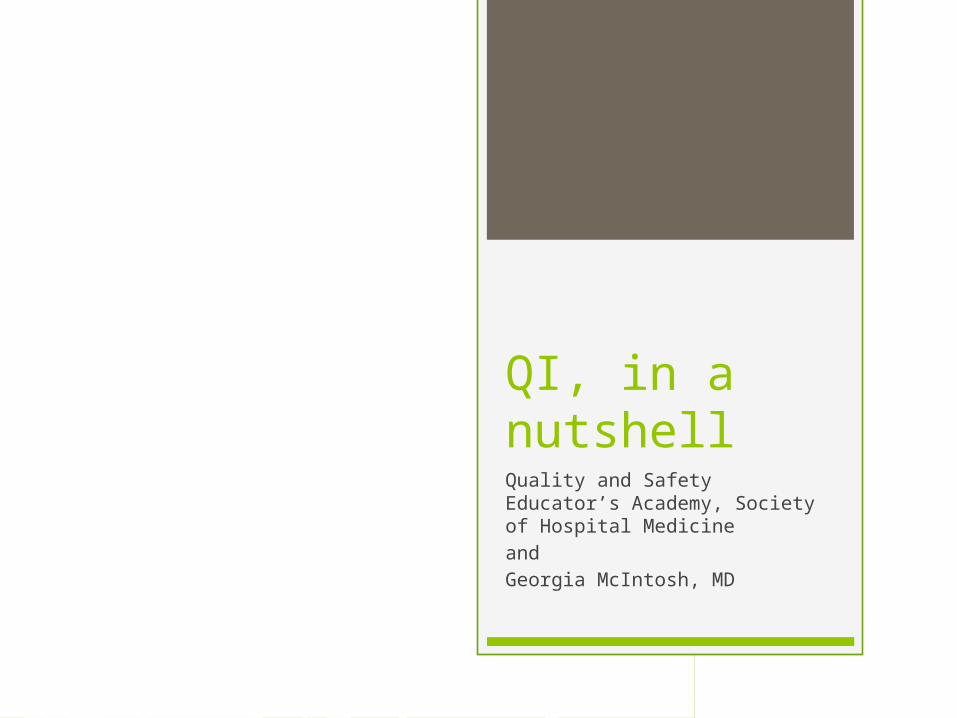
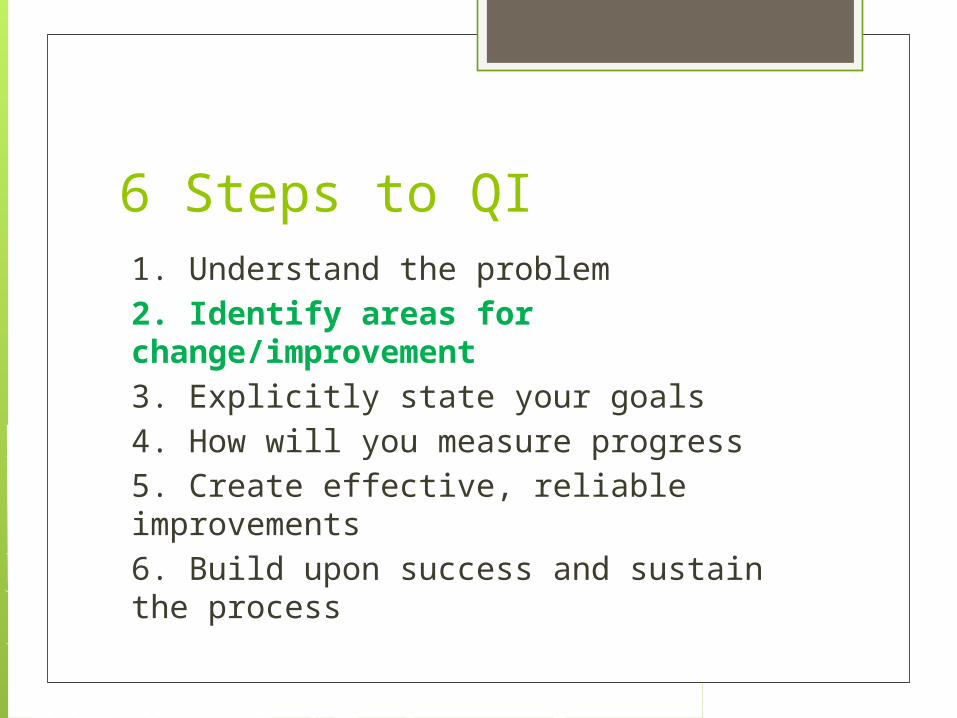
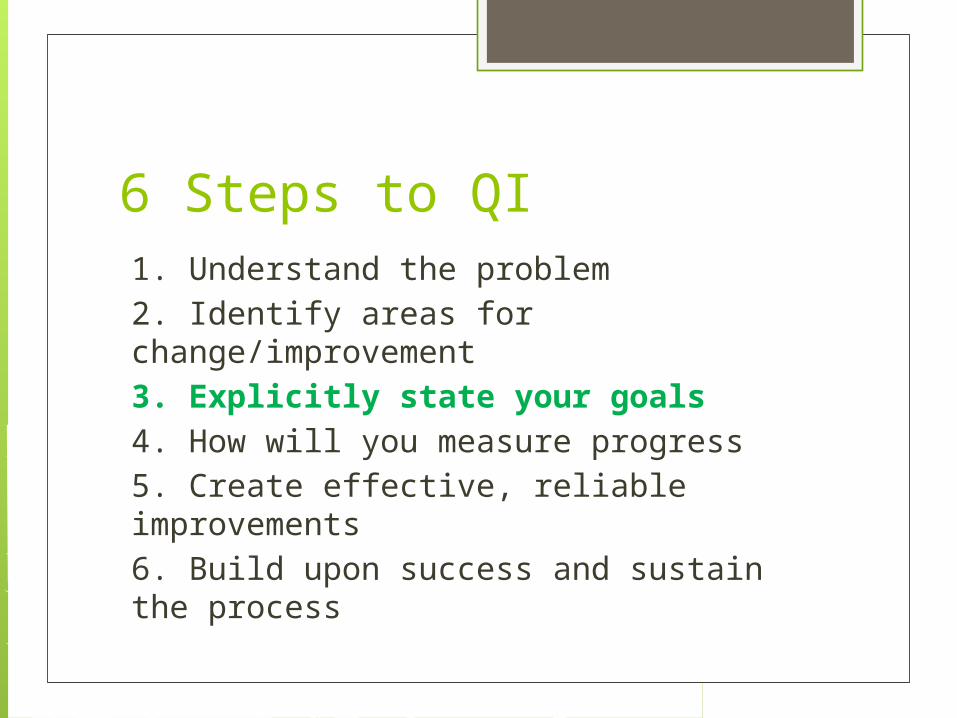
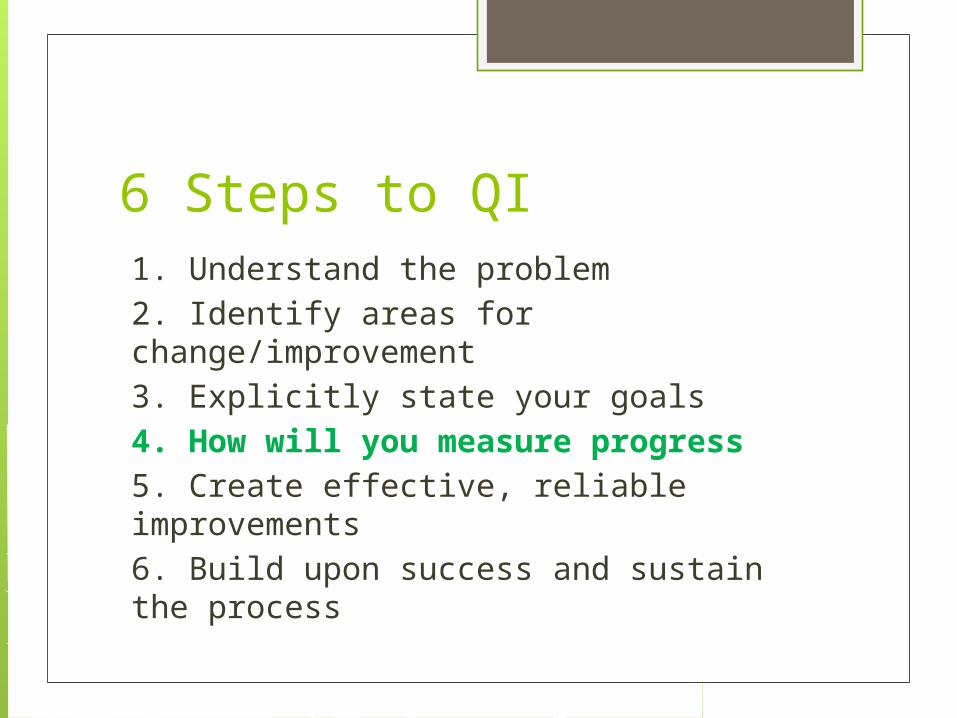
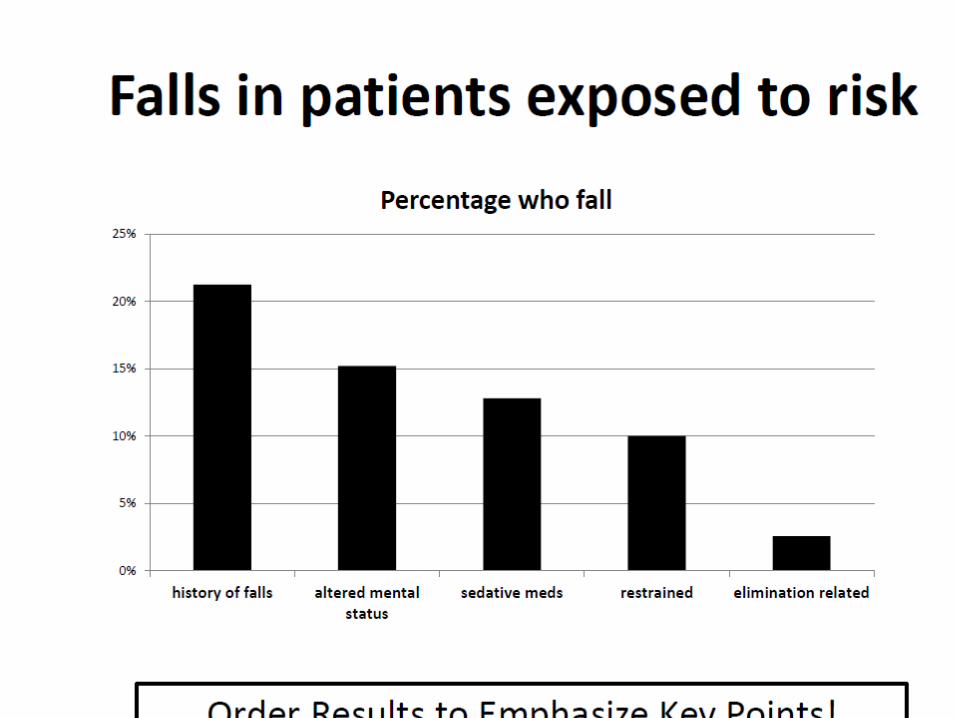
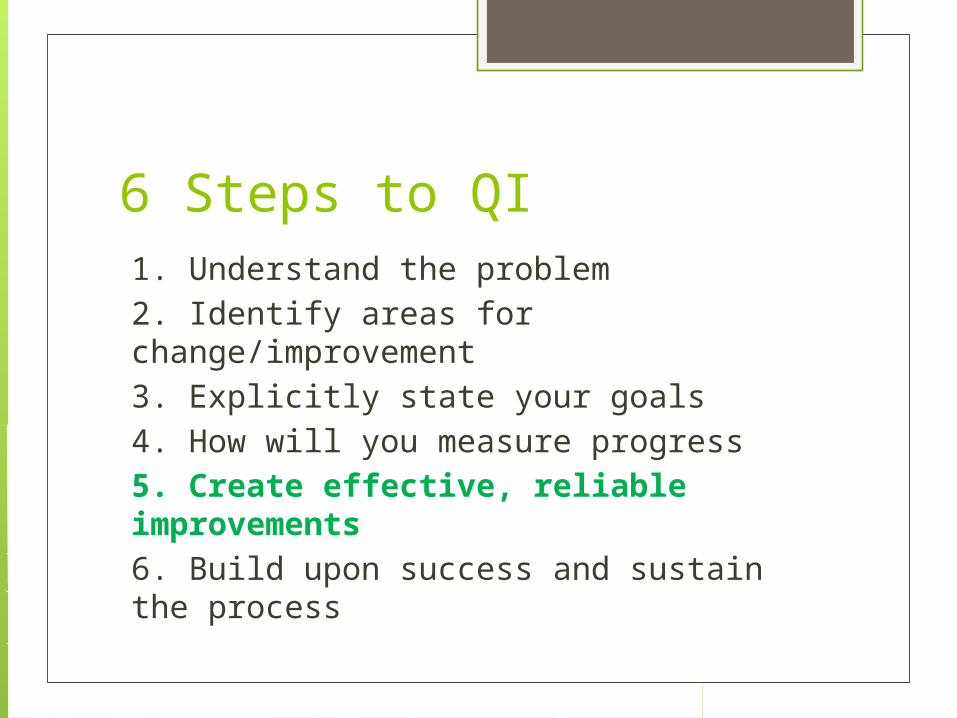
6 Steps to QI1. Understand the problem2. Identify areas for change/improvement3. Explicitly state your goals4. How will you measure progress5. Create effective, reliable improvements6. Build upon success and sustain the process
6 Steps to QI1. Understand the problem2. Identify areas for change/improvement3. Explicitly state your goals4. How will you measure progress5. Create effective, reliable improvements6. Build upon success and sustain the process
Process Modeling Tools Cause and Effect Diagram or Fishbone
diagram Standard Flow diagram Deployment Flowchart or Swim-lane
Diagram Mind Map
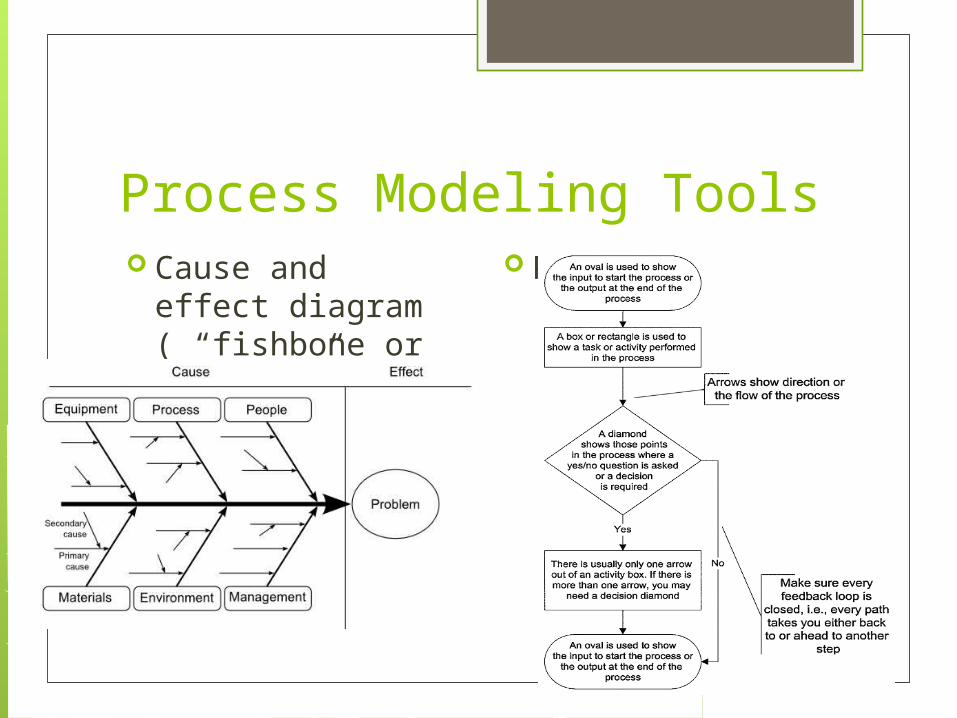
Process Modeling Tools Cause and effect
diagram ( “fishbone or ishikawa”)
Process Map
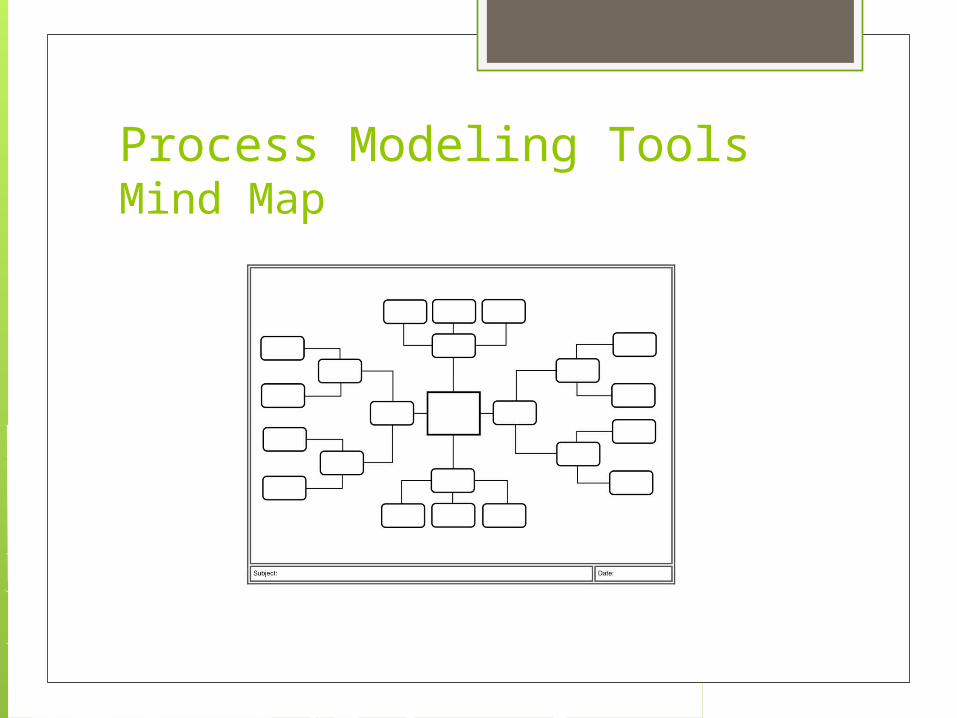
Process Modeling ToolsMind Map
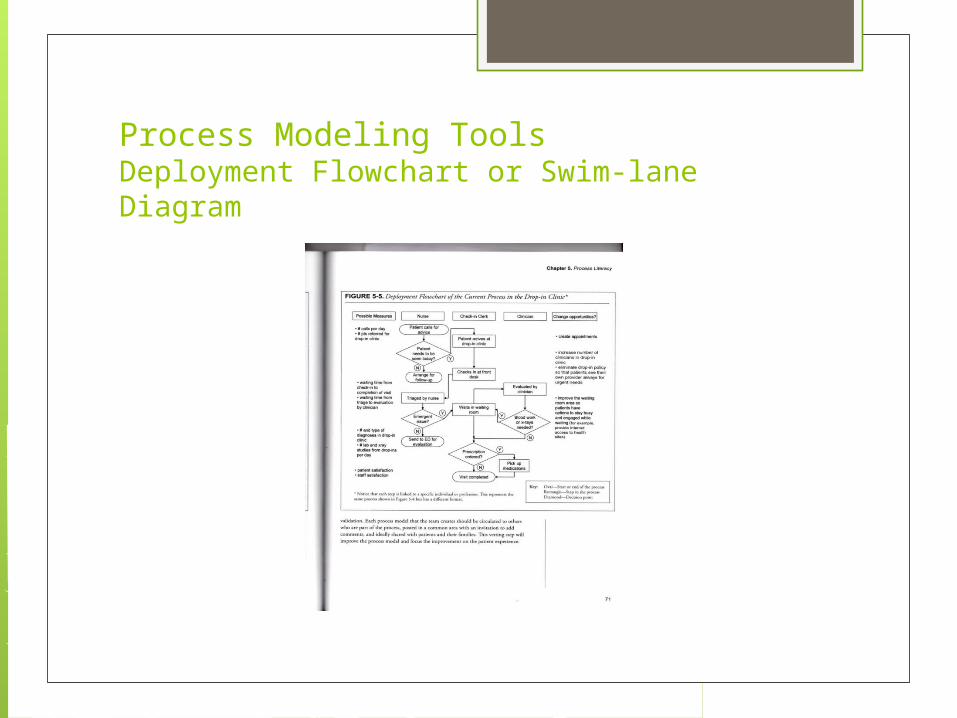
Process Modeling ToolsDeployment Flowchart or Swim-lane Diagram
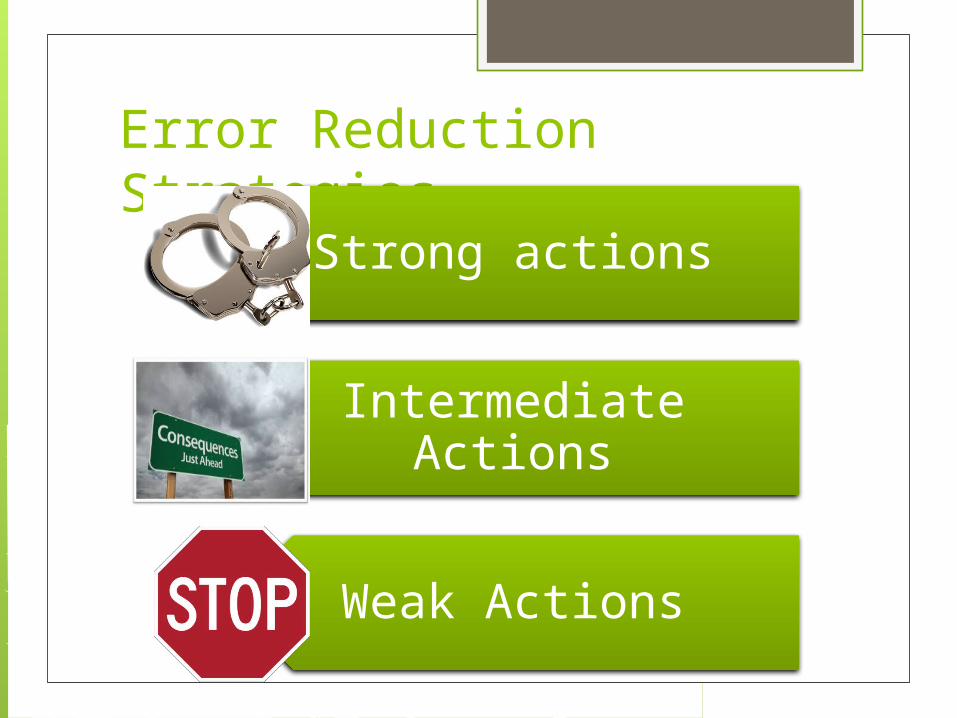
Error Reduction StrategiesStrong actions
Intermediate Actions
Weak Actions
6 Steps to QI1. Understand the problem2. Identify areas for change/improvement3. Explicitly state your goals4. How will you measure progress5. Create effective, reliable improvements6. Build upon success and sustain the process
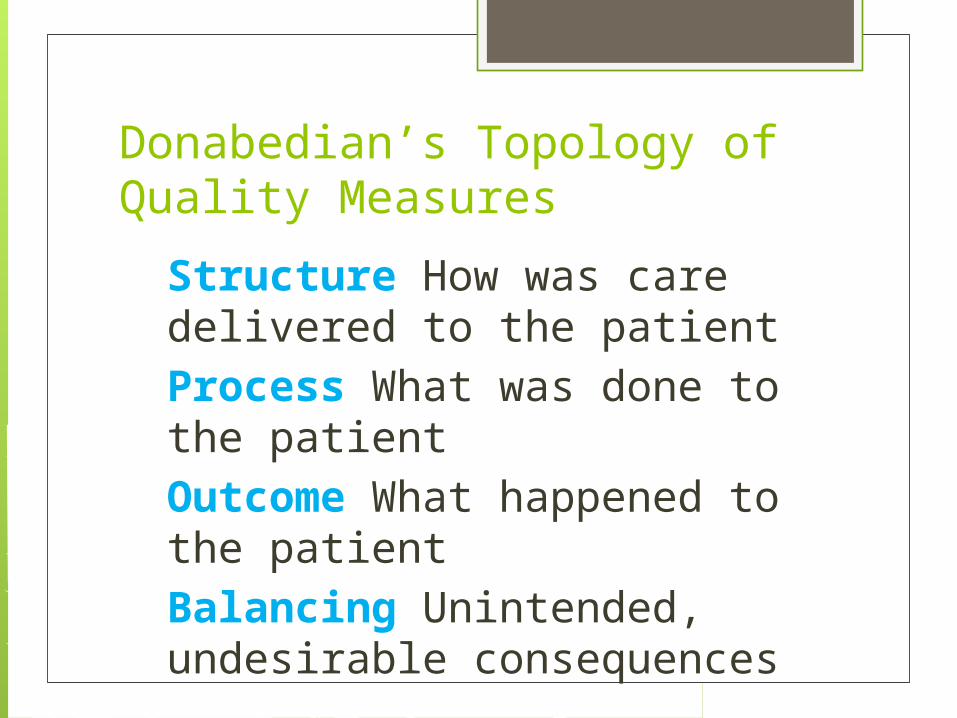
Donabedian’s Topology of Quality Measures
Structure How was care delivered to the patient Process What was done to the patient Outcome What happened to the patient Balancing Unintended, undesirable consequences
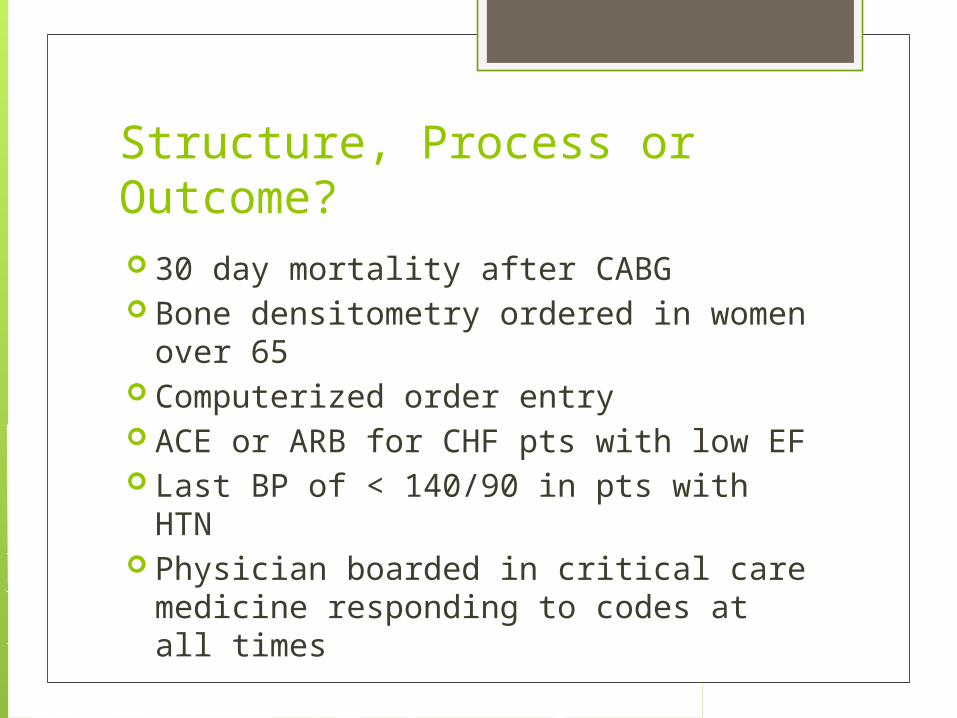
Structure, Process or Outcome? 30 day mortality after CABG Bone densitometry ordered in women
over 65 Computerized order entry ACE or ARB for CHF pts with low EF Last BP of < 140/90 in pts with HTN Physician boarded in critical care
medicine responding to codes at all times
6 Steps to QI1. Understand the problem2. Identify areas for change/improvement3. Explicitly state your goals4. How will you measure progress5. Create effective, reliable improvements6. Build upon success and sustain the process
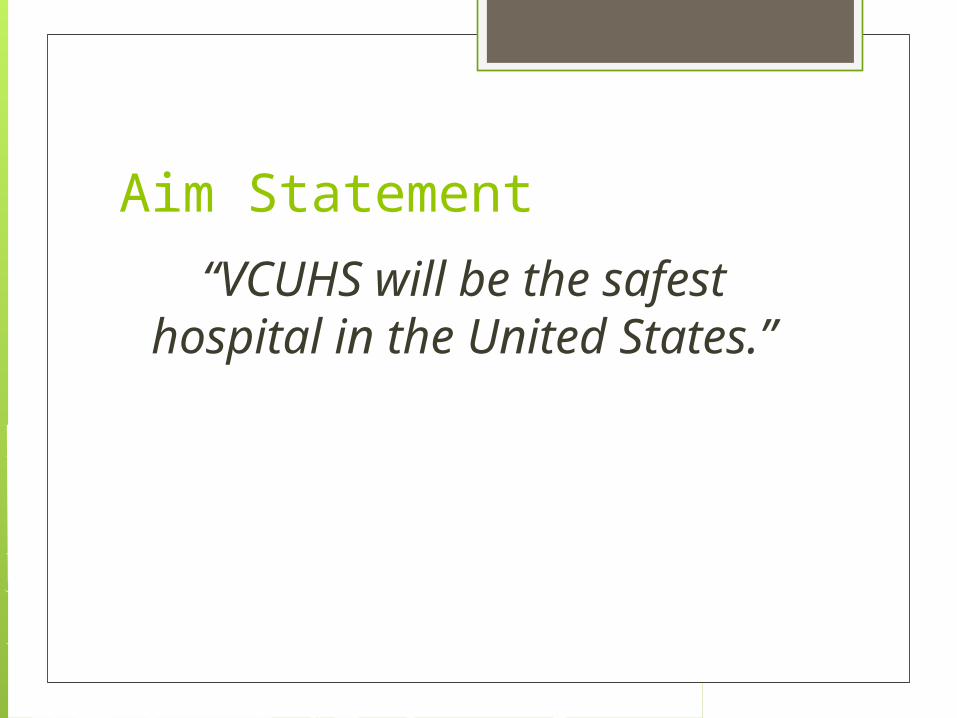
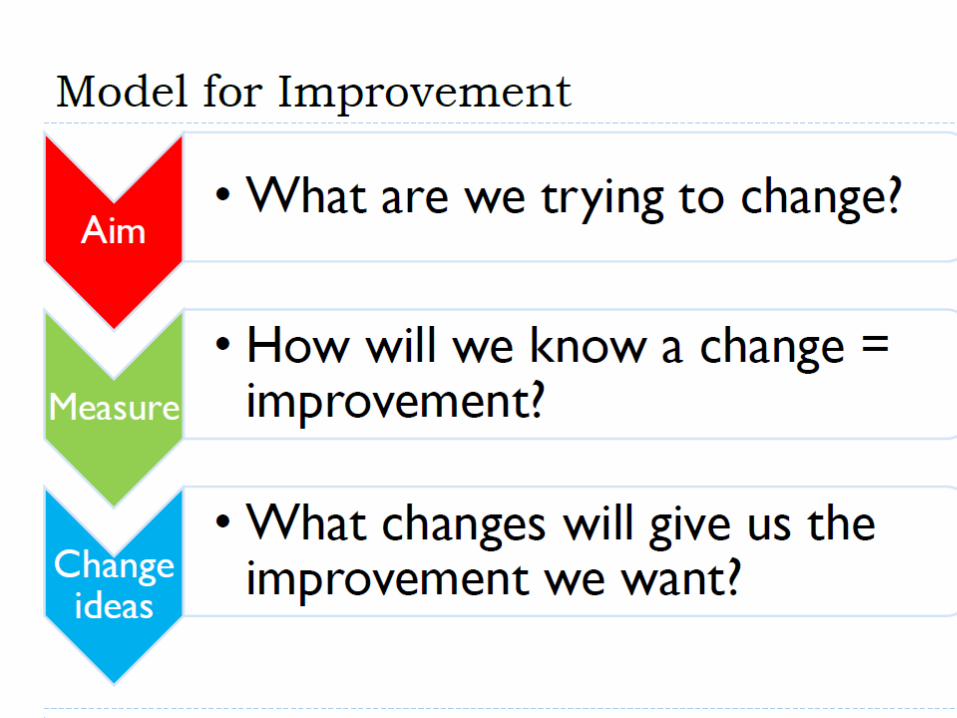
Aim Statement
“VCUHS will be the safest hospital in the United
States.”
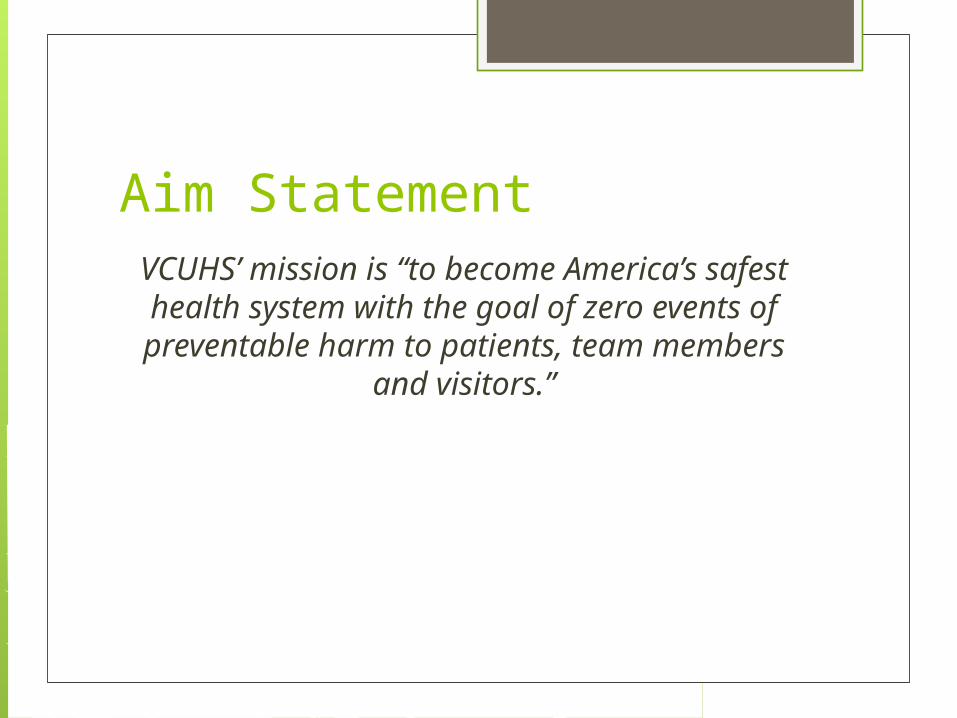
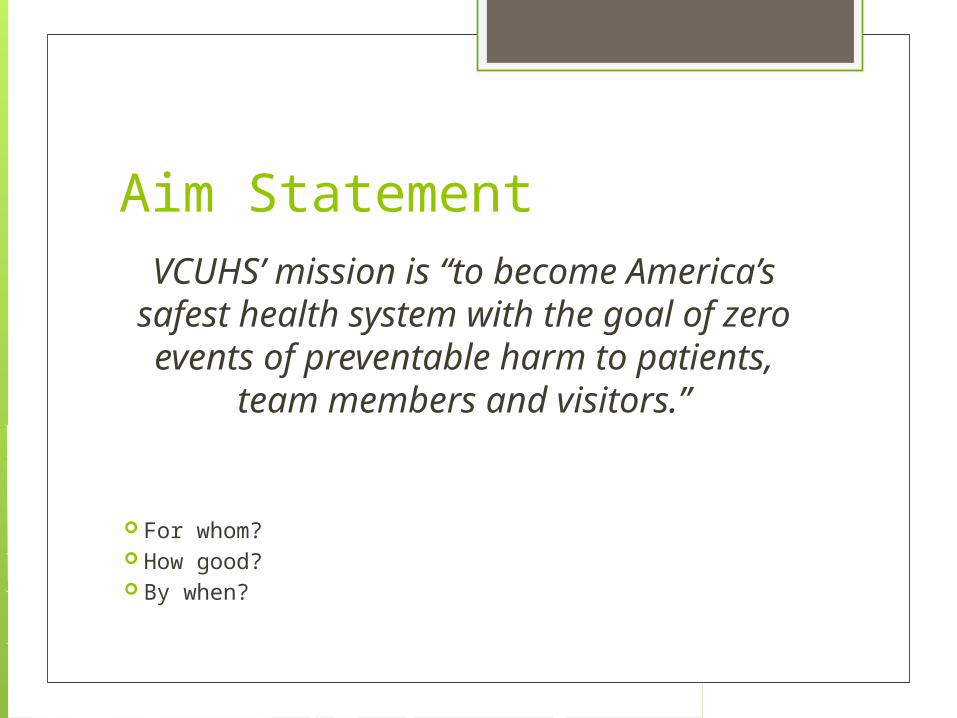
Aim StatementVCUHS’ mission is “to become America’s safest health system with the goal of zero events of preventable harm to patients,
team members and visitors.”
Aim StatementVCUHS’ mission is “to become America’s
safest health system with the goal of zero events of preventable harm to
patients, team members and visitors.”
For whom? How good? By when?
6 Steps to QI1. Understand the problem2. Identify areas for change/improvement3. Explicitly state your goals4. How will you measure progress5. Create effective, reliable improvements6. Build upon success and sustain the process
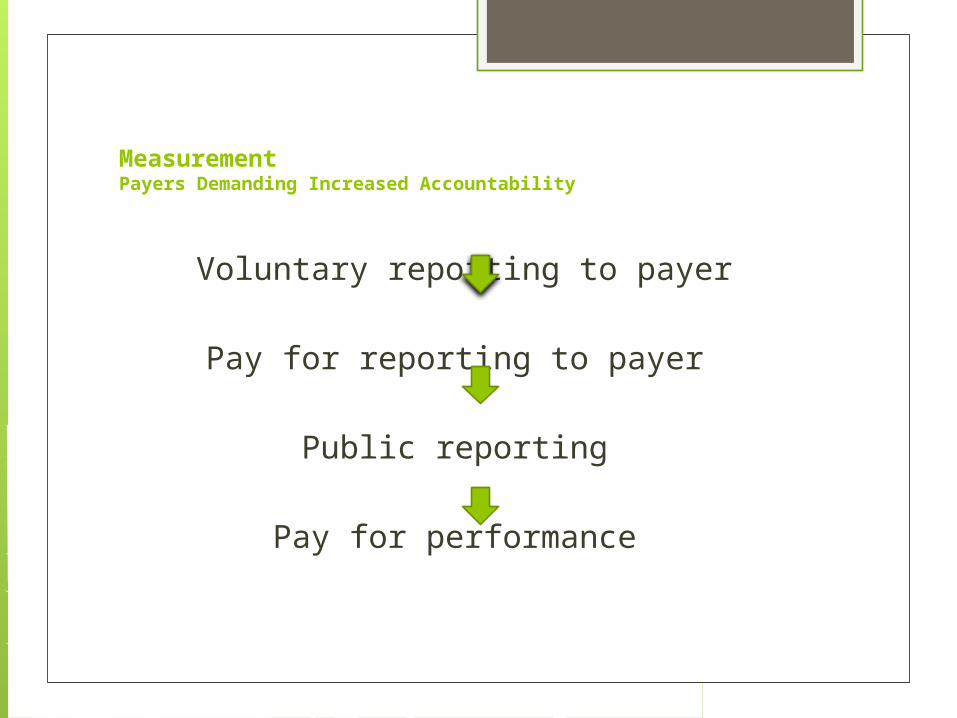
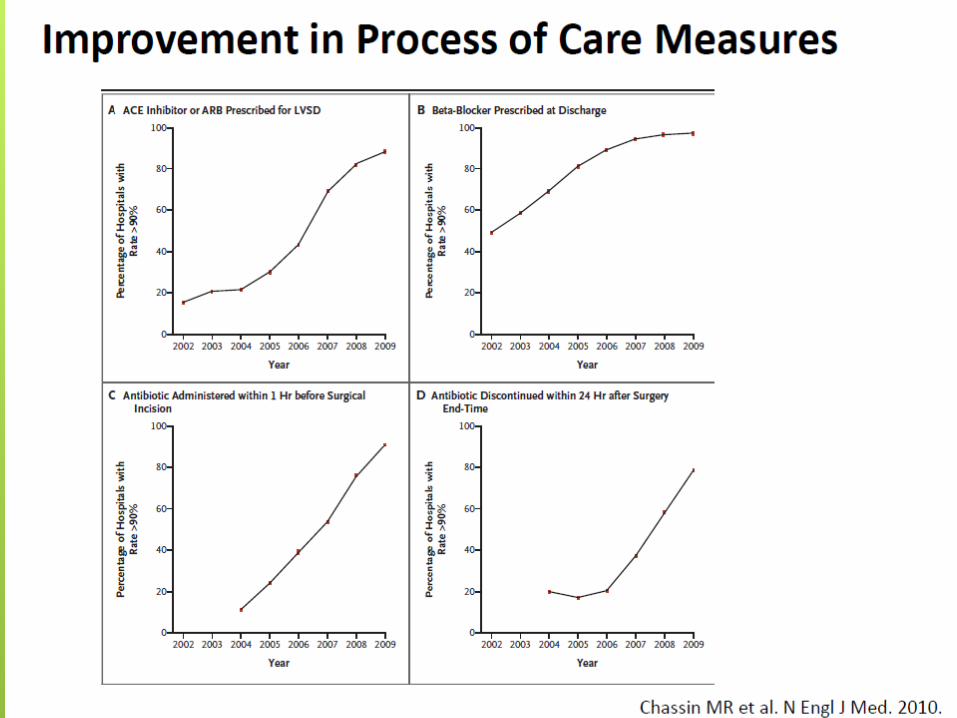
MeasurementPayers Demanding Increased Accountability
Voluntary reporting to payer
Pay for reporting to payer
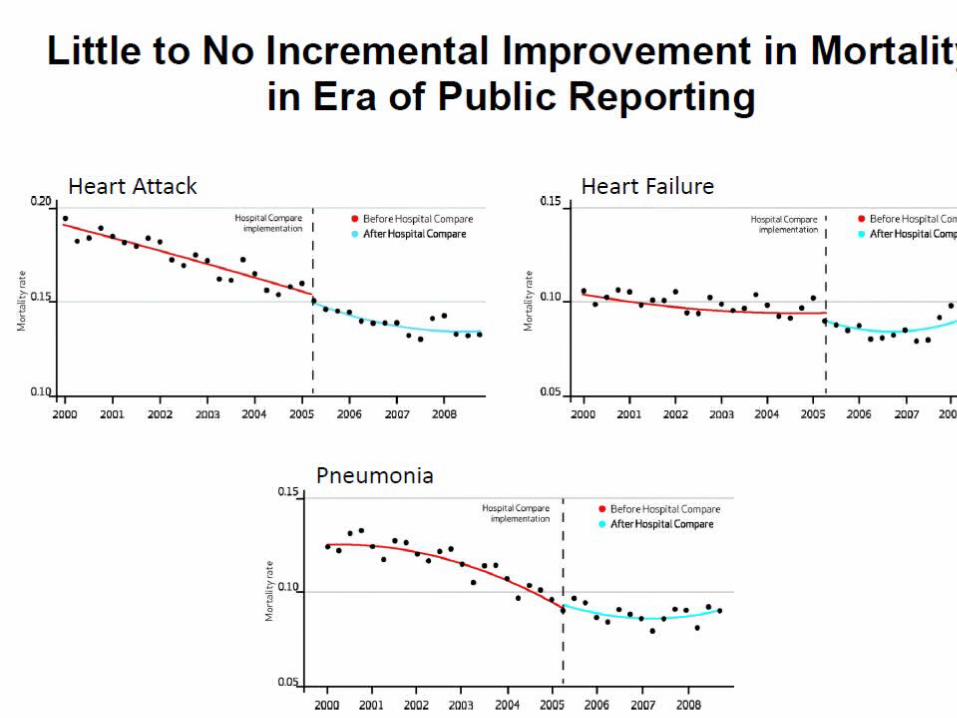
Public reporting
Pay for performance
6 Steps to QI1. Understand the problem2. Identify areas for change/improvement3. Explicitly state your goals4. How will you measure progress5. Create effective, reliable improvements6. Build upon success and sustain the process
6 Steps to QI1. Understand the problem2. Identify areas for change/improvement3. Explicitly state your goals4. How will you measure progress5. Create effective, reliable improvements6. Build upon success and sustain the process
1. Recently, several complaints have been filed by patients in your clinic about excessive wait times in the lobby. As a member of the quality team at your clinic, you are charged to study and fix this problem. Which of the following improvement methodologies would be most successful at reducing wait times for patients in the clinic lobby?
a. LEANb. Six Sigmac. Cause-and-effect diagrammingd. Swim lane diagramminge. Failure mode and effects analysis
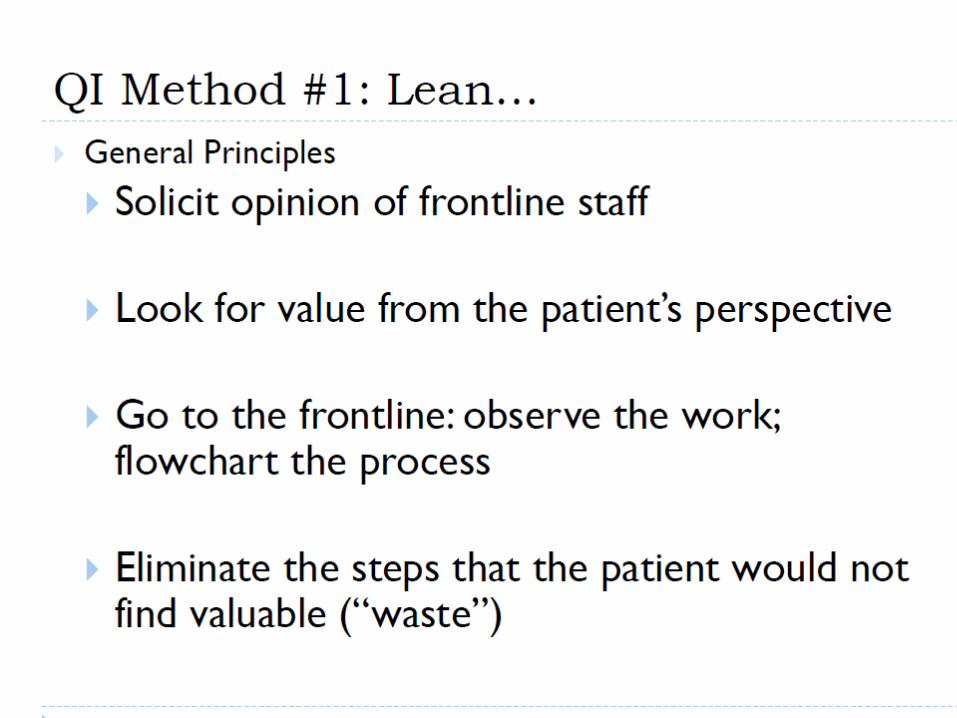
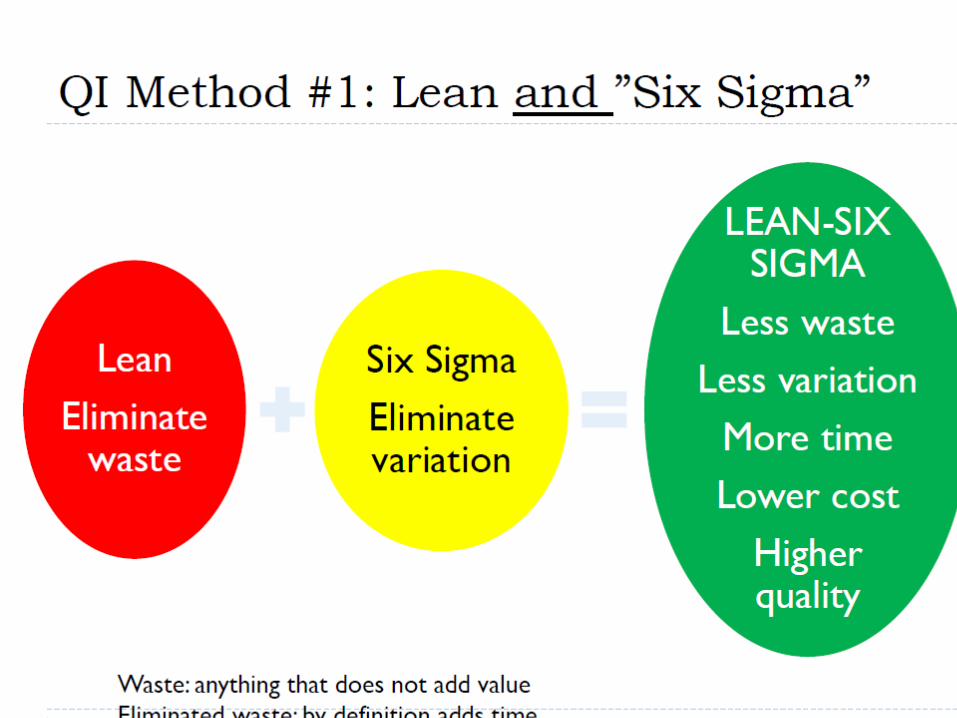
LEAN Developed by Toyota Aim to eliminate waste in the system Most common waste is patient wait time
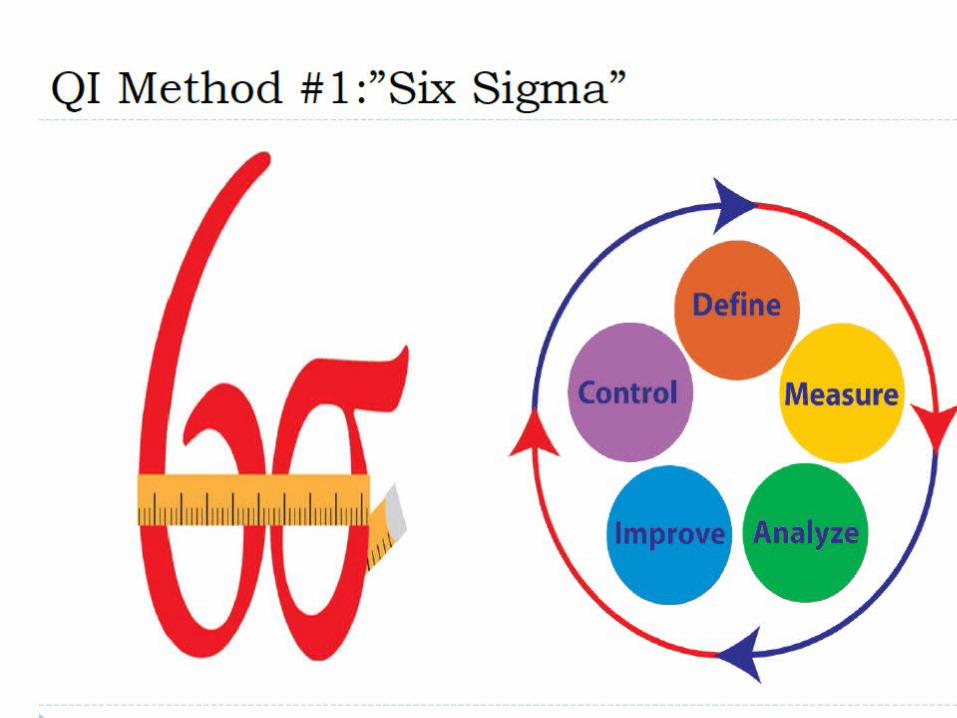
Six Sigma Invented by Motorola Designed to remove defects and
variations from a system Six sigma means 6 standard deveiations
from the mean which represents 3.4 defects per 1 million opportunities
Utilizes DMAIC methodology Design, Measure, Analyze, Improve,
Control
Cause and effect diagramming AKA Fishbone diagram Uncovers the factors that influence an
outcome Hypothesis-generating tool

Deployment Flowchart or Swim-lane Diagram
Failure mode and effects analysis Tool for classifying errors by severity
and likelihood of recurrence for use in prioritizing quality initiatives
Failure Mode and Effects Analysis systematic, proactive method for
evaluating a process to identify where and how it might fail, and to assess the relative impact of different failures in order to identify the parts of the process that are most in need of change.
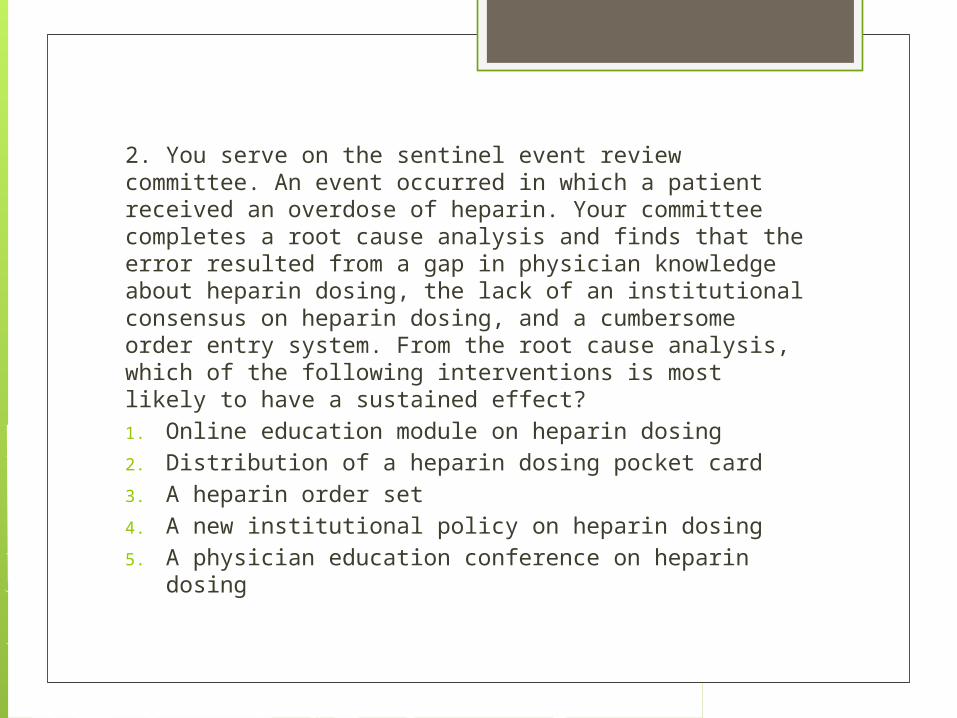
2. You serve on the sentinel event review committee. An event occurred in which a patient received an overdose of heparin. Your committee completes a root cause analysis and finds that the error resulted from a gap in physician knowledge about heparin dosing, the lack of an institutional consensus on heparin dosing, and a cumbersome order entry system. From the root cause analysis, which of the following interventions is most likely to have a sustained effect?1. Online education module on heparin dosing2. Distribution of a heparin dosing pocket card3. A heparin order set4. A new institutional policy on heparin dosing5. A physician education conference on heparin
dosing
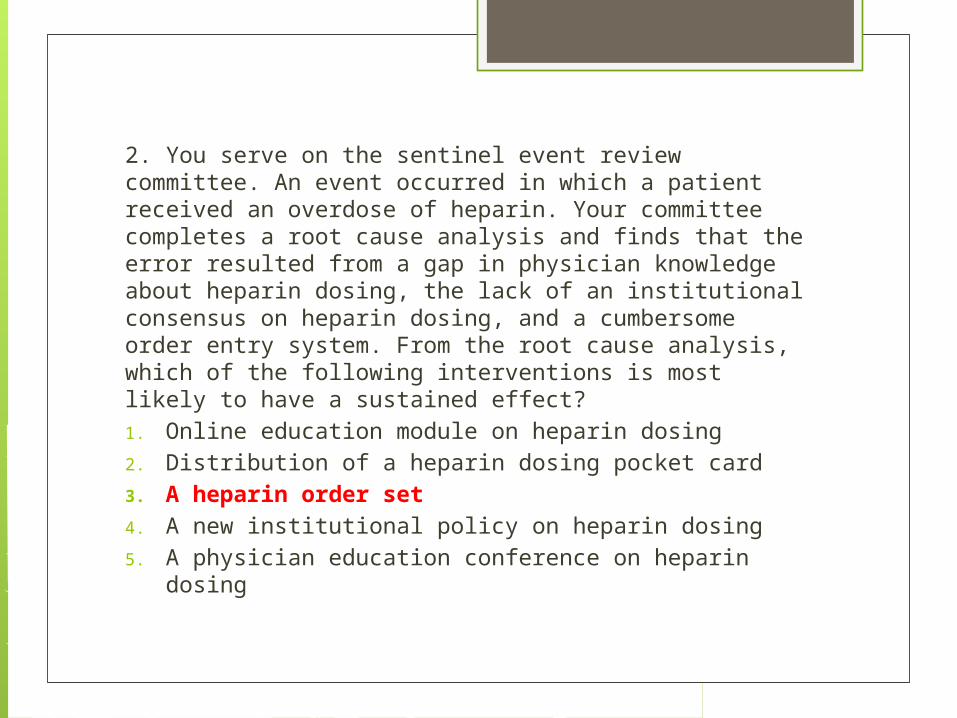
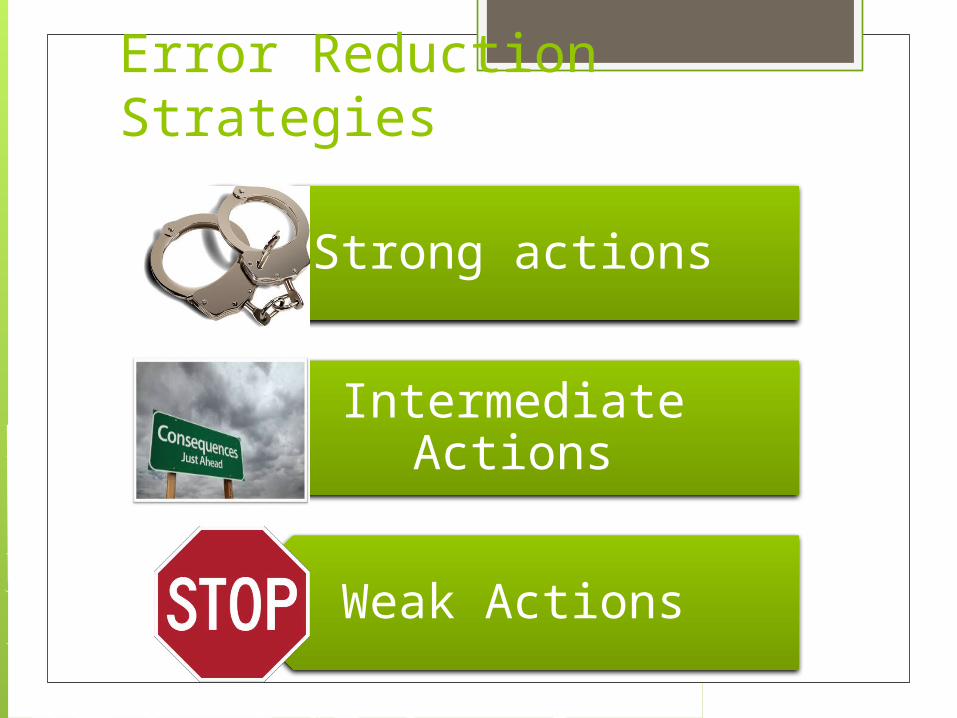
Error Reduction Strategies
Strong actions
Intermediate Actions
Weak Actions
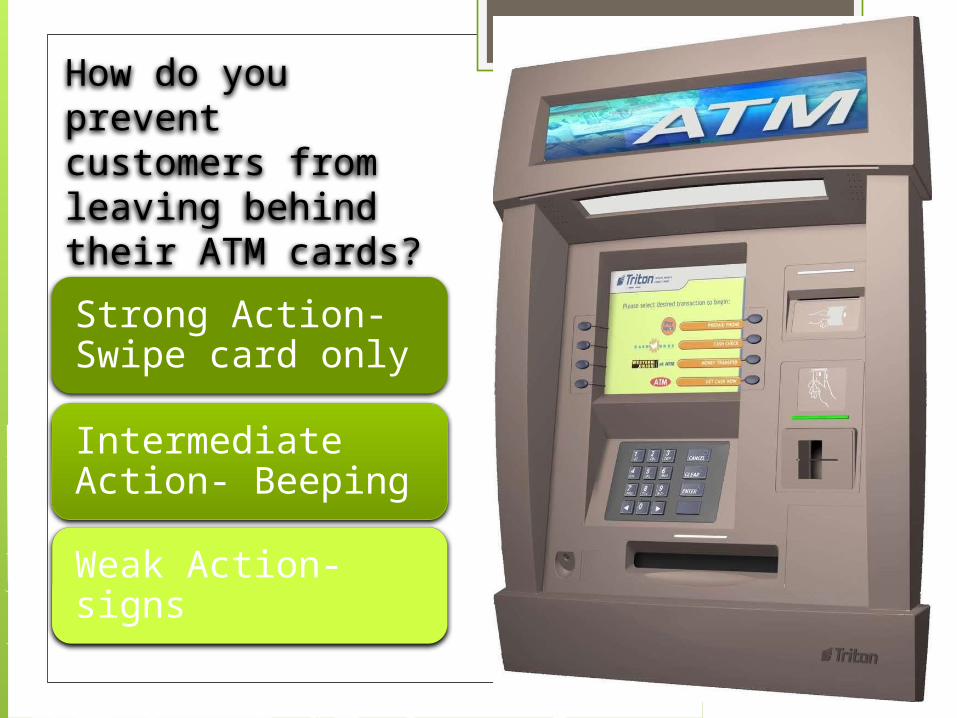
How do you prevent customers from leaving behind their ATM cards?
Strong Action- Swipe card only
Intermediate Action- Beeping
Weak Action- signs