Embed Size (px)
Citation preview
© 2012 International Monetary Fund January 2012 IMF Country Report No. 12/19
January 4, 2012 January 29, 2001 January 29, 2001 January 29, 2001 January 29, 2001
Qatar: Selected Issues
This Selected Issues Paper on Qatar was prepared by a staff team of the International Monetary Fund as background documentation for the periodic consultation with the member country. It is based on the information available at the time it was completed on January 17, 2012. The views expressed in this document are those of the staff team and do not necessarily reflect the views of the government of Qatar or the Executive Board of the IMF. The policy of publication of staff reports and other documents by the IMF allows for the deletion of market-sensitive information.
Copies of this report are available to the public from
International Monetary Fund Publication Services 700 19th Street, N.W. Washington, D.C. 20431
Telephone: (202) 623-7430 Telefax: (202) 623-7201 E-mail: [email protected] Internet: http://www.imf.org
International Monetary Fund Washington, D.C.
INTERNATIONAL MONETARY FUND
QATAR
Selected Issues
Prepared by Zsofia Arvai and Ghada Fayad
Approved by the Middle East and Central Asia Department
January 17, 2012
I. Fiscal Policy in Qatar ...........................................................................................................3 A. Introduction ..................................................................................................................3 B. Evolution of Revenues, Expenditures and the Oil Price ..............................................4 C. The Evolution of the Fiscal Policy Stance ...................................................................8 D. Current Fiscal Stance .................................................................................................10
References ................................................................................................................................13
II. Financial Linkages Across Banks in Qatar .......................................................................14 A. Background ................................................................................................................14 B. Data ............................................................................................................................16 C. Methodologies and Results ........................................................................................16 D. Distress Dependence Approach .................................................................................20 E. Bank Stability Index (BSI) .........................................................................................20 F. Distress Dependence and Spillover Coefficients ........................................................21 G. Policy Implications ....................................................................................................23
References ................................................................................................................................24
Tables 1. Co-VaR Estimates for Qatari Banks Jan 2008–June 2011 ..................................................19 2. Change in Co-VaR Estimates for Qatari Banks Jan 2008–June 2001 .................................19
Figures 1. Total Revenues, Expenditures and the Oil Price, 1990–2010 .............................................4 2. Share of Major Revenue Categories in Total Revenue, 1986–2010 ....................................5 3. Government Hydrocarbon Revenues and Total Expenditure, 1990–2010 ..........................6 4. Share of Capital and Current Expenditures in Total Expenditures, 1990–2010 ..................6 5. Evolution of Wages and Salaries in Current and Total Expenditures, 1990–2011 .............7 6. Government Hydrocarbon Revenues and Nonhydrocarbon Primary Deficit, 1990–2010 ...........................................................................................................7 7. Net Cash Flow to the State from Qatar Petroleum, 2004–16 ..............................................8
2
8. Nonhydrocarbon Primary Balance and the Oil Price, 1990–2010 .......................................8 9. Real Nonhydrocarbon GDP Growth, 1990–2010 ................................................................9 10. The Nonhydrocarbon Output Gap and Inflation, 1990–2010 ............................................10 11. Medium-term Fiscal Stance Before and After the Salary Increase, 2006–16 (Nonhydrocarbon balance concept) ..................................................................................11 12. Medium-term Fiscal Stance Before and After the Salary Increase, 2006–16 (Nonhydrocarbon primary balance concept) ....................................................................11 13. Projected and Sustainable Nonhydrocarbon Primary Deficit, 2008–16 ............................12 14. Qatar Banking System, December 2010 ...........................................................................15 15. Stock Prices and Default Probabilities of Qatari Banks, 2008–11 ...................................17 16. Qatar Banks Stability Index, 2008–11 ..............................................................................21 17. Qatar Banking system: Spillover Coefficients, 2008–11 ...................................................22
3
FISCAL POLICY IN QATAR1
The analysis finds that reducing fiscal dependency on the hydrocarbon sector will take considerable time. Qatar intends to fully finance the budget from nonhydrocarbon revenues and returns from the Qatar Investment Authority’s (QIA) investments by 2020. The recent increases in current expenditures, and the large public sector salary and pension increase for Qataris announced in September, in particular, led to an expansionary fiscal stance in 2011/12, and set back the narrowing of the deficit by 3–4 percentage points of GDP. According to staff’s calculation, the nonhydrocarbon revenue would cover about 63 percent of the total expenditure by 2016/17, implying the need for more effort by the authorities to achieve their target. Given the authorities’ objective and for building buffers for shocks, staff encourages the authorities to save more, especially during booms.
A. Introduction
1. This note provides background analysis for the assessment of fiscal policy in recent years and the impact of recent fiscal measures. Data limitations allow for an analysis based only on the central government sector.2 The budget is currently prepared for a single year and it is on a cash basis.3 The Ministry of Economy and Finance (MOEF) has been working with consultants to prepare for 3-year program budgeting. It will be introduced in phases, and there are ongoing efforts to prepare the 2012/13 budget on a three-year budgeting basis, though the budget will only be announced for one year in the beginning.
2. The analysis is structured as follows: Section B presents the main stylized facts on the evolution of revenues and expenditures and the relationship with oil prices. Section C analyzes the evolution of the fiscal policy stance in the run-up to and after the global financial crisis. Finally, Section D assesses the current fiscal stance in the context of the authorities’ own objective of fully financing the budget from 2020 onwards from its non-hydrocarbon revenues.
1 Prepared by Zsofia Arvai. 2 In addition to the central and general government, the Public Corporations Sector makes up a large share of the economy. The main segments are (i) the hydrocarbon value chain and manufacturing organized under Qatar Petroleum (QP); (ii) the real estate sector comprising Qatari Diar and Barwa; (iii) Qatar National Bank; (iv) Qatar Airways, Al Jazeera and Qtel in the transportation and communication segment; and (v) the hospital segment. 3 The fiscal year covers the April to March period, in contrast with the corporate sector’s fiscal year that is on a calendar year basis.
4
B. Evolution of Revenues, Expenditures and the Oil Price
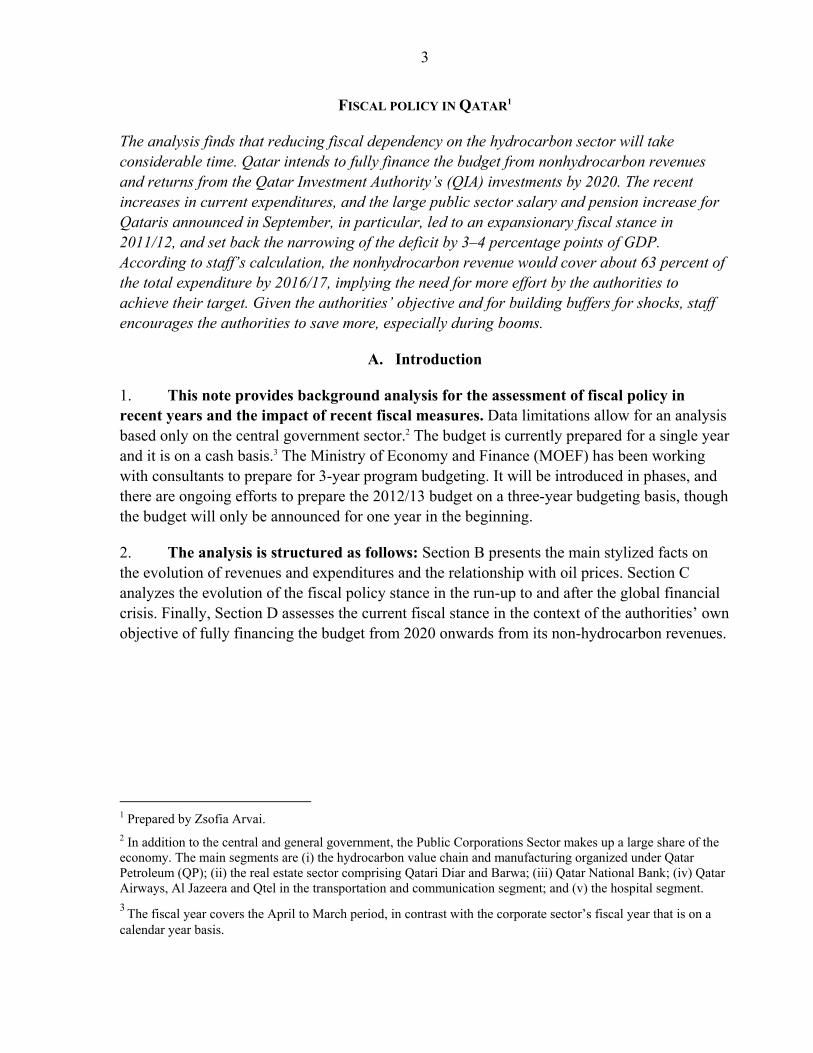
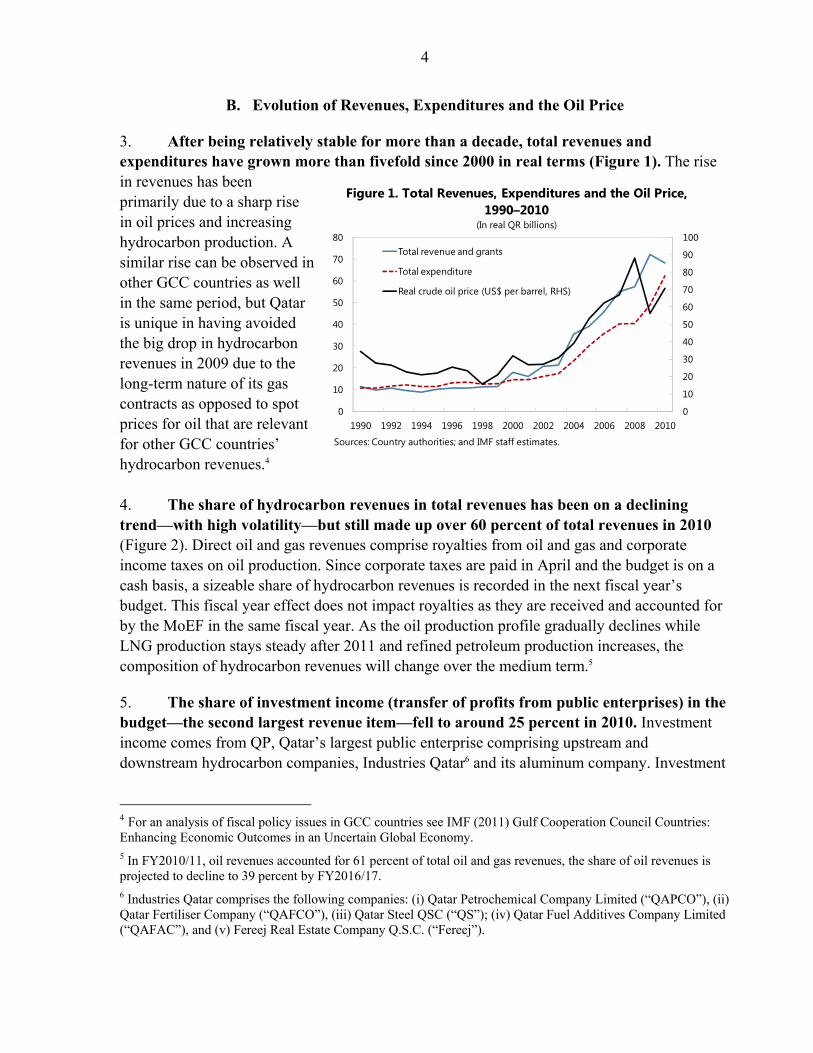
3. After being relatively stable for more than a decade, total revenues and expenditures have grown more than fivefold since 2000 in real terms (Figure 1). The rise in revenues has been primarily due to a sharp rise in oil prices and increasing hydrocarbon production. A similar rise can be observed in other GCC countries as well in the same period, but Qatar is unique in having avoided the big drop in hydrocarbon revenues in 2009 due to the long-term nature of its gas contracts as opposed to spot prices for oil that are relevant for other GCC countries’ hydrocarbon revenues.4 4. The share of hydrocarbon revenues in total revenues has been on a declining trend—with high volatility—but still made up over 60 percent of total revenues in 2010 (Figure 2). Direct oil and gas revenues comprise royalties from oil and gas and corporate income taxes on oil production. Since corporate taxes are paid in April and the budget is on a cash basis, a sizeable share of hydrocarbon revenues is recorded in the next fiscal year’s budget. This fiscal year effect does not impact royalties as they are received and accounted for by the MoEF in the same fiscal year. As the oil production profile gradually declines while LNG production stays steady after 2011 and refined petroleum production increases, the composition of hydrocarbon revenues will change over the medium term.5
5. The share of investment income (transfer of profits from public enterprises) in the budget—the second largest revenue item—fell to around 25 percent in 2010. Investment income comes from QP, Qatar’s largest public enterprise comprising upstream and downstream hydrocarbon companies, Industries Qatar6 and its aluminum company. Investment
4 For an analysis of fiscal policy issues in GCC countries see IMF (2011) Gulf Cooperation Council Countries: Enhancing Economic Outcomes in an Uncertain Global Economy. 5 In FY2010/11, oil revenues accounted for 61 percent of total oil and gas revenues, the share of oil revenues is projected to decline to 39 percent by FY2016/17. 6 Industries Qatar comprises the following companies: (i) Qatar Petrochemical Company Limited (“QAPCO”), (ii) Qatar Fertiliser Company (“QAFCO”), (iii) Qatar Steel QSC (“QS”); (iv) Qatar Fuel Additives Company Limited (“QAFAC”), and (v) Fereej Real Estate Company Q.S.C. (“Fereej”).
0
10
20
30
40
50
60
70
80
90
100
0
10
20
30
40
50
60
70
80
1990 1992 1994 1996 1998 2000 2002 2004 2006 2008 2010
Total revenue and grants
Total expenditure
Real crude oil price (US$ per barrel, RHS)
Figure 1. Total Revenues, Expenditures and the Oil Price, 1990–2010
(In real QR billions)
Sources: Country authorities; and IMF staff estimates.
5
income is the net income of QP after taxes and royalties. In Qatar’s fiscal accounts, investment income is treated as part of nonhydrocarbon revenues.7
6. The accounting of investment income in government revenues has not been straightforward. QP has been making monthly cash contributions to the budget based on its cash flows. The MoEF and QP are currently working on developing a more rule-based mechanism to guide the investment income contribution to the budget. Investment income dipped to QR36 billion in FY2010/11 from QR54 billion in FY2009/10, but this does not reflect QP’s actual net income of QR61 billion, as a QR25 billion capital contribution to QP was netted out instead of being recorded as a financing item.
7. Other revenues—primarily corporate income taxes— have been slowly picking up in recent years. A corporate income tax of 10 percent is levied on foreign companies and the increasing revenues reflect the continued high profits and the widening of tax coverage of the corporate sector. The contribution of the recently introduced withholding tax to revenues is not expected to be significant compared to the corporate income tax because of the low tax rate and narrow base. Custom duties make up the bulk of the remaining nonhydrocarbon revenues.
7 The breakdown of QP’s net income into hydrocarbon and nonhydrocarbon income is not available.
0%
10%
20%
30%
40%
50%
60%
70%
80%
90%
0%
10%
20%
30%
40%
50%
60%
70%
80%
90%
1986 1988 1990 1992 1994 1996 1998 2000 2002 2004 2006 2008 2010
Oil/Gas revenues Investment Income Other revenue
Figure 2. Share of Major Revenue Categories in Total Revenue, 1986–2010 (In percent of Total Revenue)
Sources: Country authorities; and IMF staff estimates.
6
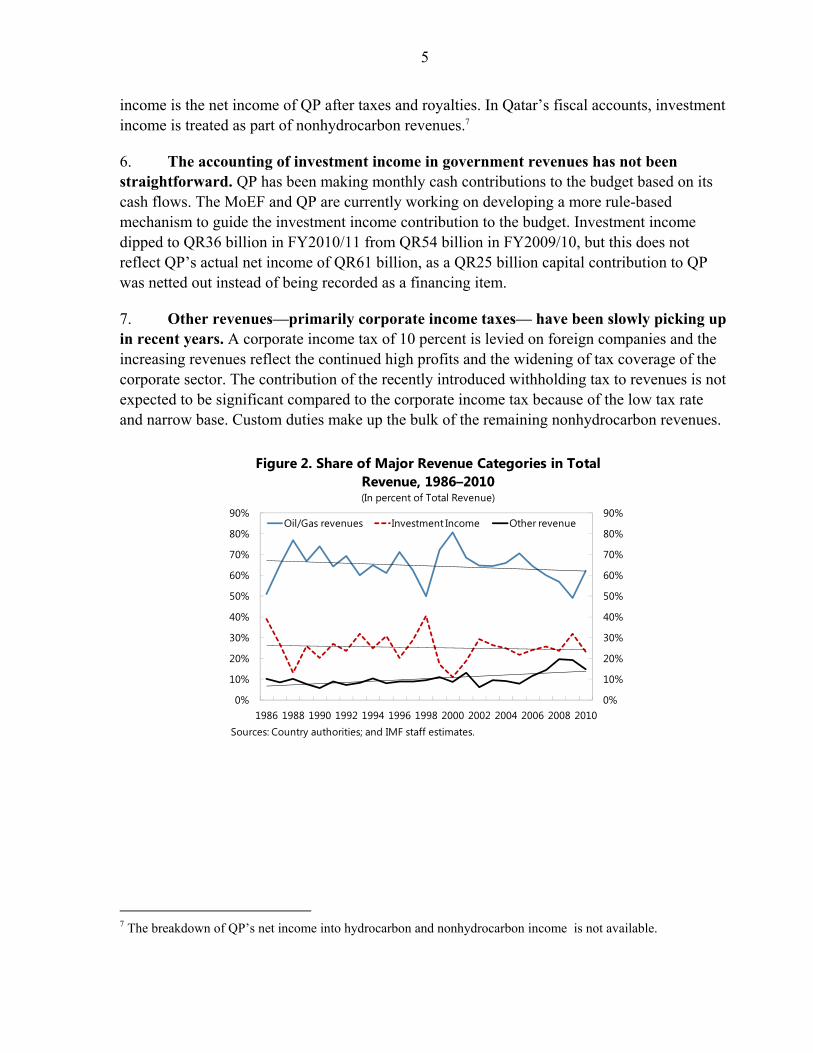
8. Total government expenditures picked up more strongly than hydrocarbon revenues in the 2000s (Figure 3). Unlike in the other GCC countries in recent boom years, total expenditures have consistently exceeded hydrocarbon revenues in Qatar with investment income being a major revenue item in the budget to complement hydrocarbon revenues. Given low tax revenues from the nonhydrocarbon sector as a result of low tax rates and a small tax base, the strong pick-up in expenditures was only possible because of the steadily increasing hydrocarbon revenues and a very strong rise in investment income after 2000.
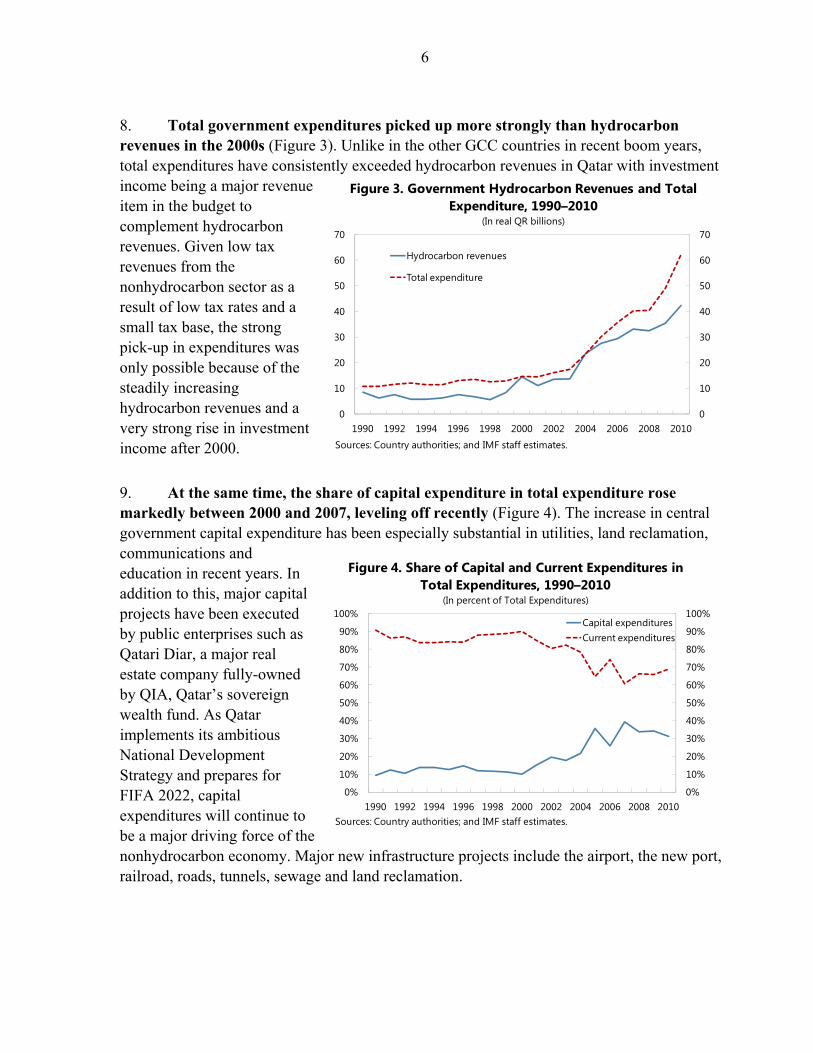
9. At the same time, the share of capital expenditure in total expenditure rose markedly between 2000 and 2007, leveling off recently (Figure 4). The increase in central government capital expenditure has been especially substantial in utilities, land reclamation, communications and education in recent years. In addition to this, major capital projects have been executed by public enterprises such as Qatari Diar, a major real estate company fully-owned by QIA, Qatar’s sovereign wealth fund. As Qatar implements its ambitious National Development Strategy and prepares for FIFA 2022, capital expenditures will continue to be a major driving force of the nonhydrocarbon economy. Major new infrastructure projects include the airport, the new port, railroad, roads, tunnels, sewage and land reclamation.
0
10
20
30
40
50
60
70
0
10
20
30
40
50
60
70
1990 1992 1994 1996 1998 2000 2002 2004 2006 2008 2010
Hydrocarbon revenues
Total expenditure
Figure 3. Government Hydrocarbon Revenues and Total Expenditure, 1990–2010
(In real QR billions)
Sources: Country authorities; and IMF staff estimates.
0%
10%
20%
30%
40%
50%
60%
70%
80%
90%
100%
0%
10%
20%
30%
40%
50%
60%
70%
80%
90%
100%
1990 1992 1994 1996 1998 2000 2002 2004 2006 2008 2010
Capital expendituresCurrent expenditures
Figure 4. Share of Capital and Current Expenditures in Total Expenditures, 1990–2010
(In percent of Total Expenditures)
Sources: Country authorities; and IMF staff estimates.
7
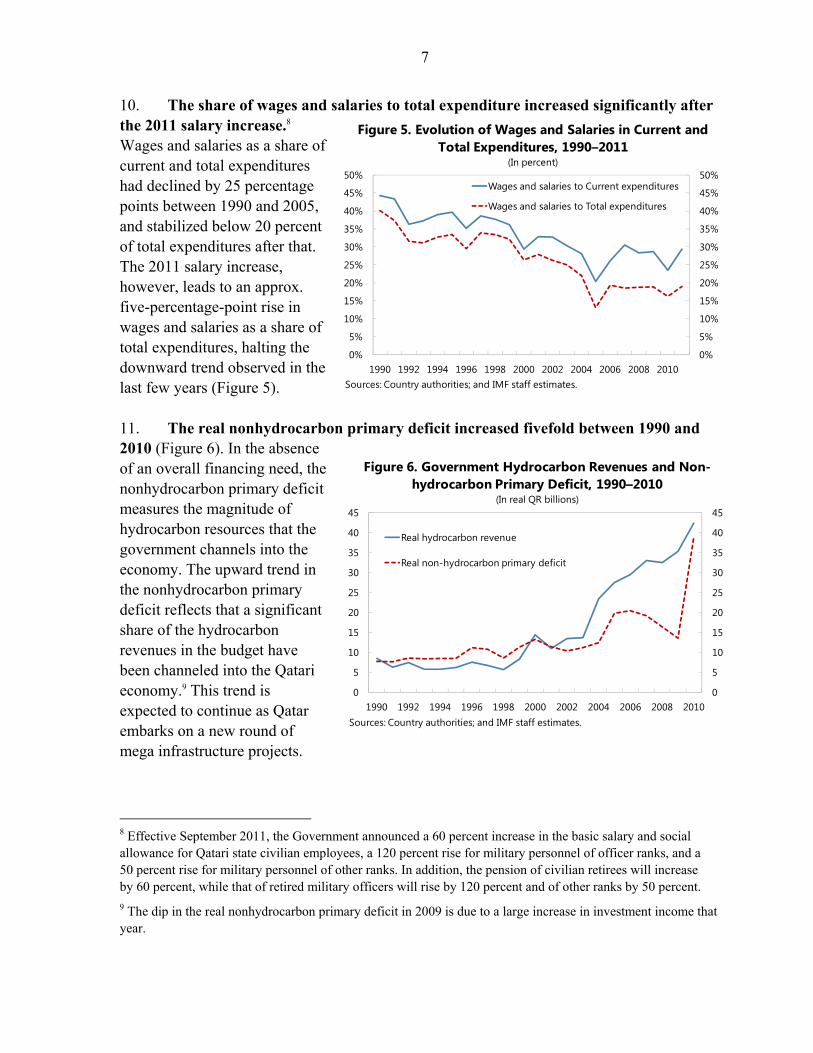
10. The share of wages and salaries to total expenditure increased significantly after the 2011 salary increase.8 Wages and salaries as a share of current and total expenditures had declined by 25 percentage points between 1990 and 2005, and stabilized below 20 percent of total expenditures after that. The 2011 salary increase, however, leads to an approx. five-percentage-point rise in wages and salaries as a share of total expenditures, halting the downward trend observed in the last few years (Figure 5).
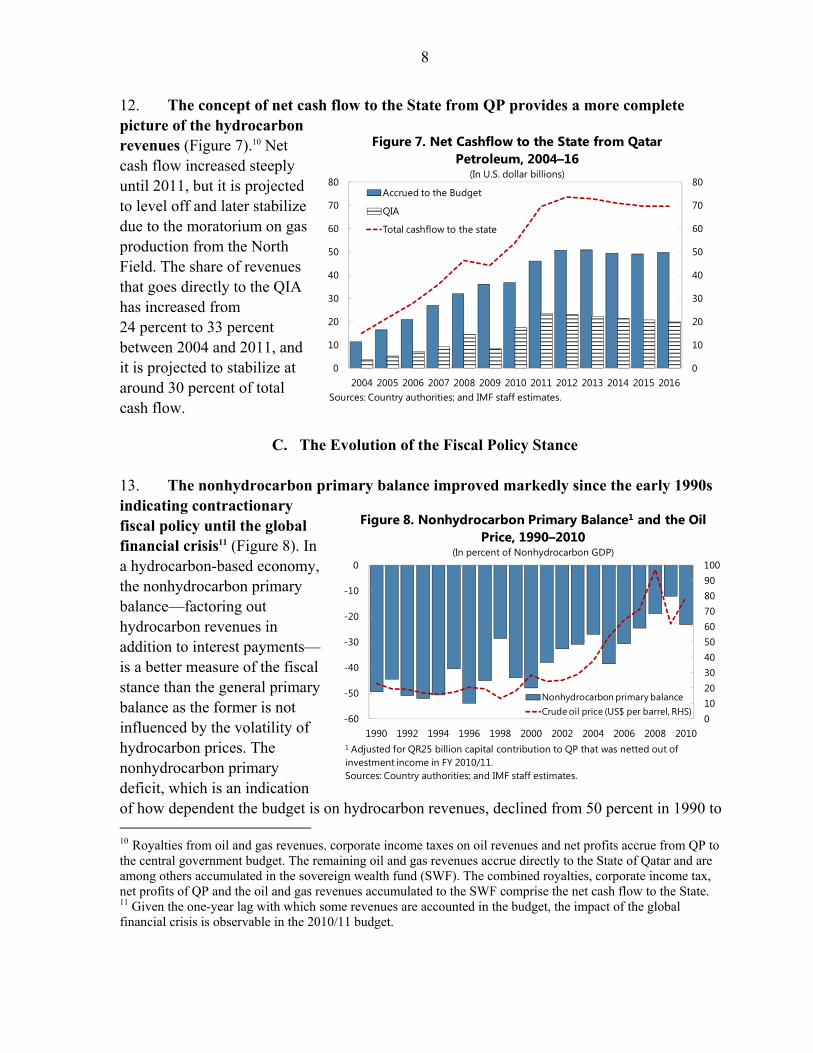
11. The real nonhydrocarbon primary deficit increased fivefold between 1990 and 2010 (Figure 6). In the absence of an overall financing need, the nonhydrocarbon primary deficit measures the magnitude of hydrocarbon resources that the government channels into the economy. The upward trend in the nonhydrocarbon primary deficit reflects that a significant share of the hydrocarbon revenues in the budget have been channeled into the Qatari economy.9 This trend is expected to continue as Qatar embarks on a new round of mega infrastructure projects.
8 Effective September 2011, the Government announced a 60 percent increase in the basic salary and social allowance for Qatari state civilian employees, a 120 percent rise for military personnel of officer ranks, and a 50 percent rise for military personnel of other ranks. In addition, the pension of civilian retirees will increase by 60 percent, while that of retired military officers will rise by 120 percent and of other ranks by 50 percent.
9 The dip in the real nonhydrocarbon primary deficit in 2009 is due to a large increase in investment income that year.
0%
5%
10%
15%
20%
25%
30%
35%
40%
45%
50%
0%
5%
10%
15%
20%
25%
30%
35%
40%
45%
50%
1990 1992 1994 1996 1998 2000 2002 2004 2006 2008 2010
Wages and salaries to Current expenditures
Wages and salaries to Total expenditures
Figure 5. Evolution of Wages and Salaries in Current and Total Expenditures, 1990–2011
(In percent)
Sources: Country authorities; and IMF staff estimates.
0
5
10
15
20
25
30
35
40
45
0
5
10
15
20
25
30
35
40
45
1990 1992 1994 1996 1998 2000 2002 2004 2006 2008 2010
Real hydrocarbon revenue
Real non-hydrocarbon primary deficit
Figure 6. Government Hydrocarbon Revenues and Non-hydrocarbon Primary Deficit, 1990–2010
(In real QR billions)
Sources: Country authorities; and IMF staff estimates.
8
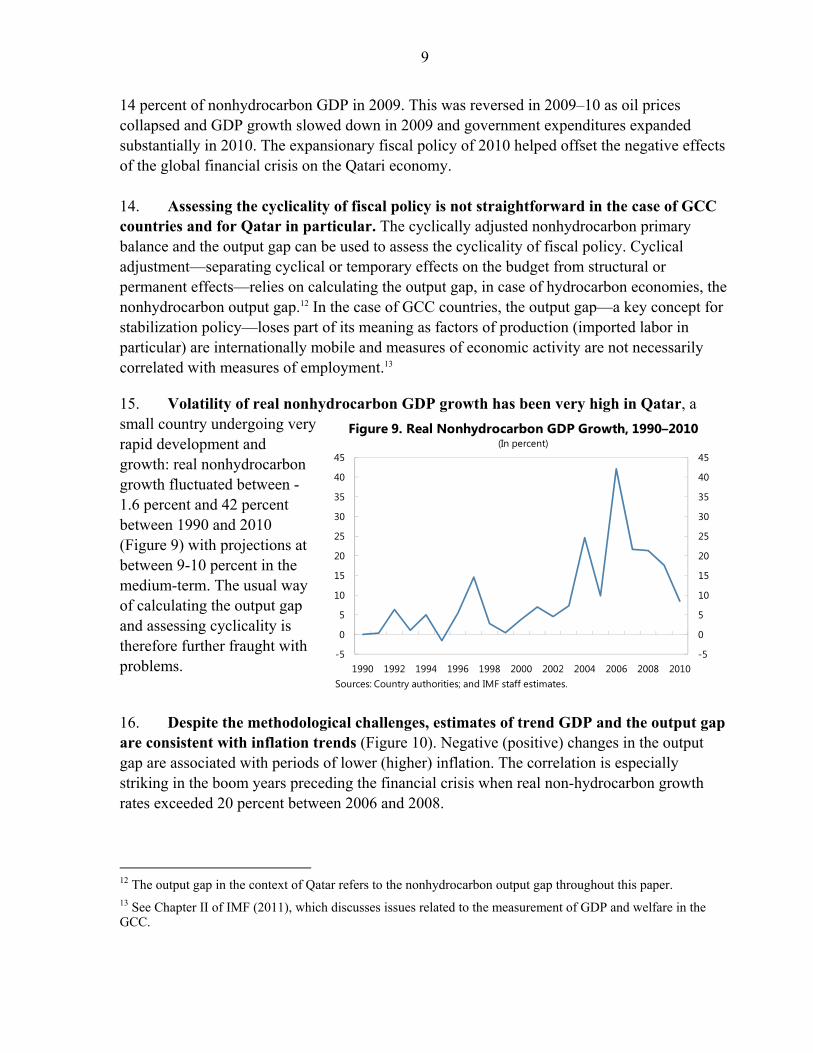
12. The concept of net cash flow to the State from QP provides a more complete picture of the hydrocarbon revenues (Figure 7).10 Net cash flow increased steeply until 2011, but it is projected to level off and later stabilize due to the moratorium on gas production from the North Field. The share of revenues that goes directly to the QIA has increased from 24 percent to 33 percent between 2004 and 2011, and it is projected to stabilize at around 30 percent of total cash flow.
C. The Evolution of the Fiscal Policy Stance
13. The nonhydrocarbon primary balance improved markedly since the early 1990s indicating contractionary fiscal policy until the global financial crisis11 (Figure 8). In a hydrocarbon-based economy, the nonhydrocarbon primary balance—factoring out hydrocarbon revenues in addition to interest payments—is a better measure of the fiscal stance than the general primary balance as the former is not influenced by the volatility of hydrocarbon prices. The nonhydrocarbon primary deficit, which is an indication of how dependent the budget is on hydrocarbon revenues, declined from 50 percent in 1990 to 10 Royalties from oil and gas revenues, corporate income taxes on oil revenues and net profits accrue from QP to the central government budget. The remaining oil and gas revenues accrue directly to the State of Qatar and are among others accumulated in the sovereign wealth fund (SWF). The combined royalties, corporate income tax, net profits of QP and the oil and gas revenues accumulated to the SWF comprise the net cash flow to the State. 11 Given the one-year lag with which some revenues are accounted in the budget, the impact of the global financial crisis is observable in the 2010/11 budget.
0
10
20
30
40
50
60
70
80
0
10
20
30
40
50
60
70
80
2004 2005 2006 2007 2008 2009 2010 2011 2012 2013 2014 2015 2016
Accrued to the Budget
QIA
Total cashflow to the state
Figure 7. Net Cashflow to the State from Qatar Petroleum, 2004–16
(In U.S. dollar billions)
Sources: Country authorities; and IMF staff estimates.
0102030405060708090100
-60
-50
-40
-30
-20
-10
0
1990 1992 1994 1996 1998 2000 2002 2004 2006 2008 2010
Nonhydrocarbon primary balanceCrude oil price (US$ per barrel, RHS)
Figure 8. Nonhydrocarbon Primary Balance1 and the Oil Price, 1990–2010
(In percent of Nonhydrocarbon GDP)
1 Adjusted for QR25 billion capital contribution to QP that was netted out of investment income in FY 2010/11.Sources: Country authorities; and IMF staff estimates.
9
14 percent of nonhydrocarbon GDP in 2009. This was reversed in 2009–10 as oil prices collapsed and GDP growth slowed down in 2009 and government expenditures expanded substantially in 2010. The expansionary fiscal policy of 2010 helped offset the negative effects of the global financial crisis on the Qatari economy. 14. Assessing the cyclicality of fiscal policy is not straightforward in the case of GCC countries and for Qatar in particular. The cyclically adjusted nonhydrocarbon primary balance and the output gap can be used to assess the cyclicality of fiscal policy. Cyclical adjustment—separating cyclical or temporary effects on the budget from structural or permanent effects—relies on calculating the output gap, in case of hydrocarbon economies, the nonhydrocarbon output gap.12 In the case of GCC countries, the output gap—a key concept for stabilization policy—loses part of its meaning as factors of production (imported labor in particular) are internationally mobile and measures of economic activity are not necessarily correlated with measures of employment.13
15. Volatility of real nonhydrocarbon GDP growth has been very high in Qatar, a small country undergoing very rapid development and growth: real nonhydrocarbon growth fluctuated between -1.6 percent and 42 percent between 1990 and 2010 (Figure 9) with projections at between 9-10 percent in the medium-term. The usual way of calculating the output gap and assessing cyclicality is therefore further fraught with problems.
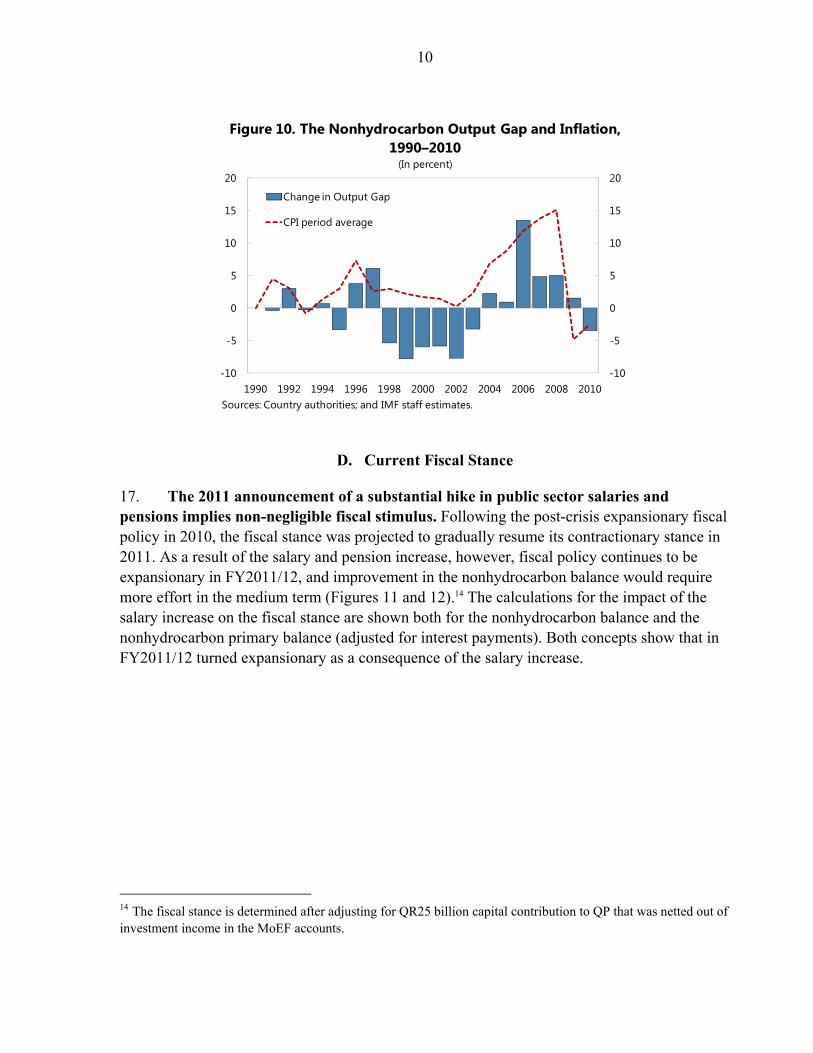
16. Despite the methodological challenges, estimates of trend GDP and the output gap are consistent with inflation trends (Figure 10). Negative (positive) changes in the output gap are associated with periods of lower (higher) inflation. The correlation is especially striking in the boom years preceding the financial crisis when real non-hydrocarbon growth rates exceeded 20 percent between 2006 and 2008.
12 The output gap in the context of Qatar refers to the nonhydrocarbon output gap throughout this paper. 13 See Chapter II of IMF (2011), which discusses issues related to the measurement of GDP and welfare in the GCC.
-5
0
5
10
15
20
25
30
35
40
45
-5
0
5
10
15
20
25
30
35
40
45
1990 1992 1994 1996 1998 2000 2002 2004 2006 2008 2010
Figure 9. Real Nonhydrocarbon GDP Growth, 1990–2010(In percent)
Sources: Country authorities; and IMF staff estimates.
10
D. Current Fiscal Stance
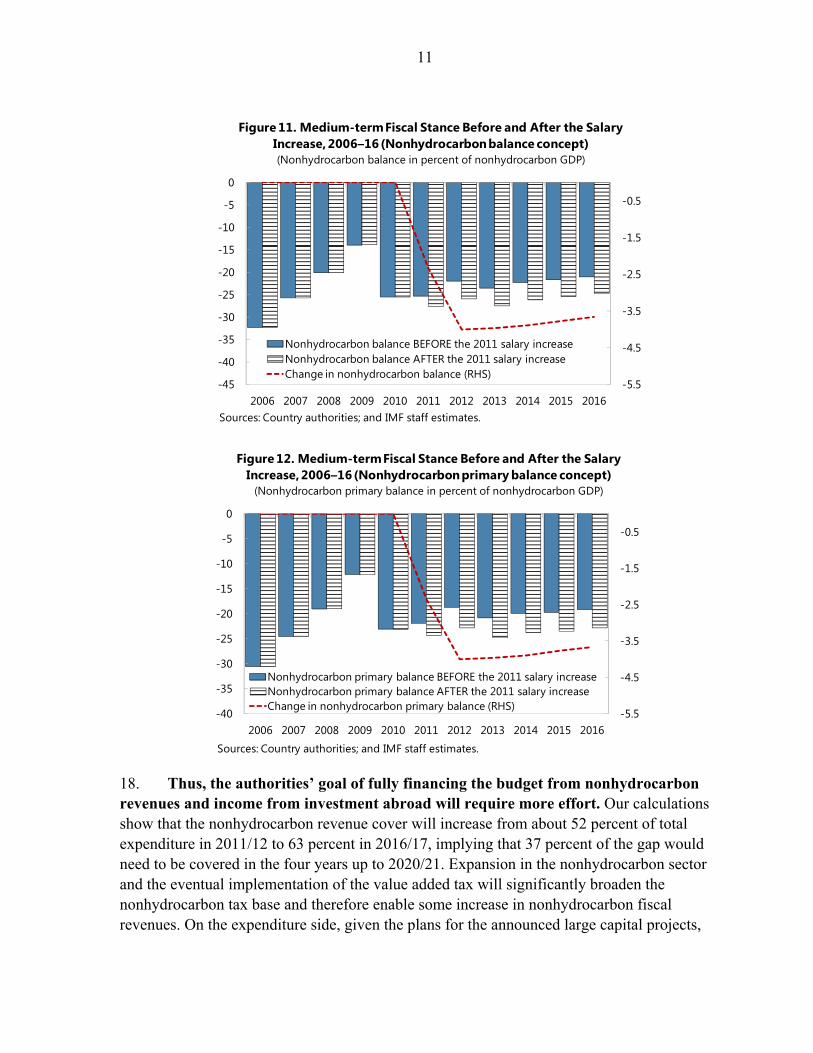
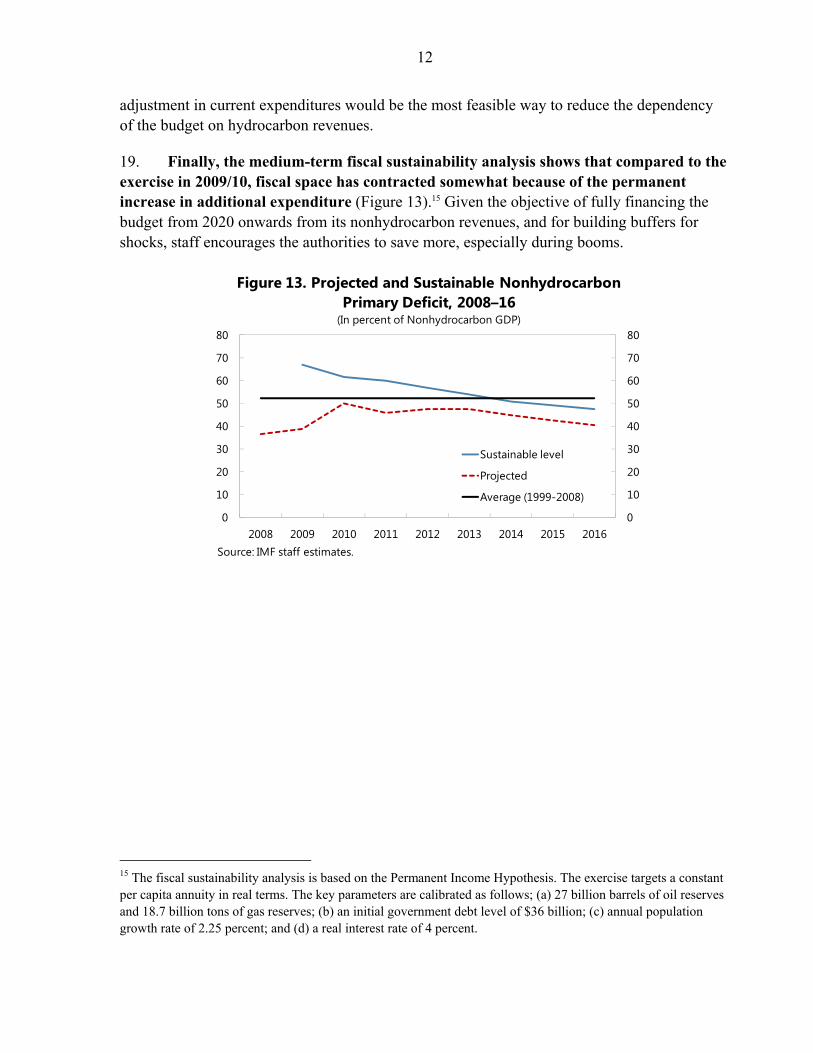
17. The 2011 announcement of a substantial hike in public sector salaries and pensions implies non-negligible fiscal stimulus. Following the post-crisis expansionary fiscal policy in 2010, the fiscal stance was projected to gradually resume its contractionary stance in 2011. As a result of the salary and pension increase, however, fiscal policy continues to be expansionary in FY2011/12, and improvement in the nonhydrocarbon balance would require more effort in the medium term (Figures 11 and 12).14 The calculations for the impact of the salary increase on the fiscal stance are shown both for the nonhydrocarbon balance and the nonhydrocarbon primary balance (adjusted for interest payments). Both concepts show that in FY2011/12 turned expansionary as a consequence of the salary increase.
14 The fiscal stance is determined after adjusting for QR25 billion capital contribution to QP that was netted out of investment income in the MoEF accounts.
-10
-5
0
5
10
15
20
-10
-5
0
5
10
15
20
1990 1992 1994 1996 1998 2000 2002 2004 2006 2008 2010
Change in Output Gap
CPI period average
Figure 10. The Nonhydrocarbon Output Gap and Inflation, 1990–2010
(In percent)
Sources: Country authorities; and IMF staff estimates.
11
18. Thus, the authorities’ goal of fully financing the budget from nonhydrocarbon revenues and income from investment abroad will require more effort. Our calculations show that the nonhydrocarbon revenue cover will increase from about 52 percent of total expenditure in 2011/12 to 63 percent in 2016/17, implying that 37 percent of the gap would need to be covered in the four years up to 2020/21. Expansion in the nonhydrocarbon sector and the eventual implementation of the value added tax will significantly broaden the nonhydrocarbon tax base and therefore enable some increase in nonhydrocarbon fiscal revenues. On the expenditure side, given the plans for the announced large capital projects,
-5.5
-4.5
-3.5
-2.5
-1.5
-0.5
-45
-40
-35
-30
-25
-20
-15
-10
-5
0
2006 2007 2008 2009 2010 2011 2012 2013 2014 2015 2016
Nonhydrocarbon balance BEFORE the 2011 salary increase Nonhydrocarbon balance AFTER the 2011 salary increase Change in nonhydrocarbon balance (RHS)
Figure 11. Medium-term Fiscal Stance Before and After the Salary Increase, 2006–16 (Nonhydrocarbon balance concept)(Nonhydrocarbon balance in percent of nonhydrocarbon GDP)
Sources: Country authorities; and IMF staff estimates.
-5.5
-4.5
-3.5
-2.5
-1.5
-0.5
-40
-35
-30
-25
-20
-15
-10
-5
0
2006 2007 2008 2009 2010 2011 2012 2013 2014 2015 2016
Nonhydrocarbon primary balance BEFORE the 2011 salary increase Nonhydrocarbon primary balance AFTER the 2011 salary increase Change in nonhydrocarbon primary balance (RHS)
Figure 12. Medium-term Fiscal Stance Before and After the Salary Increase, 2006–16 (Nonhydrocarbon primary balance concept)
(Nonhydrocarbon primary balance in percent of nonhydrocarbon GDP)
Sources: Country authorities; and IMF staff estimates.
12
adjustment in current expenditures would be the most feasible way to reduce the dependency of the budget on hydrocarbon revenues.
19. Finally, the medium-term fiscal sustainability analysis shows that compared to the exercise in 2009/10, fiscal space has contracted somewhat because of the permanent increase in additional expenditure (Figure 13).15 Given the objective of fully financing the budget from 2020 onwards from its nonhydrocarbon revenues, and for building buffers for shocks, staff encourages the authorities to save more, especially during booms.
15 The fiscal sustainability analysis is based on the Permanent Income Hypothesis. The exercise targets a constant per capita annuity in real terms. The key parameters are calibrated as follows; (a) 27 billion barrels of oil reserves and 18.7 billion tons of gas reserves; (b) an initial government debt level of $36 billion; (c) annual population growth rate of 2.25 percent; and (d) a real interest rate of 4 percent.
0
10
20
30
40
50
60
70
80
0
10
20
30
40
50
60
70
80
2008 2009 2010 2011 2012 2013 2014 2015 2016
Sustainable level
Projected
Average (1999-2008)
Figure 13. Projected and Sustainable Nonhydrocarbon Primary Deficit, 2008–16
(In percent of Nonhydrocarbon GDP)
Source: IMF staff estimates.
13
References
Abdih, Y., Lopez-Murphy, P. Roitman, A., and Sahay, R. (2010) “The Cyclicality of Fiscal Policy in the Middle East and Central Asia: Is the Current Crisis Different?” IMF Working Paper. WP/10/68. Fedelino, A., Ivanova, A., and Horton, M. (2009) “Computing Cyclically Adjusted Balances and Automatic Stabilizers”, International Monetary Fund Technical Notes and Manuals. International Monetary Fund (2011) “Gulf Cooperation Council Countries: Enhancing Economic Outcomes in an Uncertain Global Economy”.
14
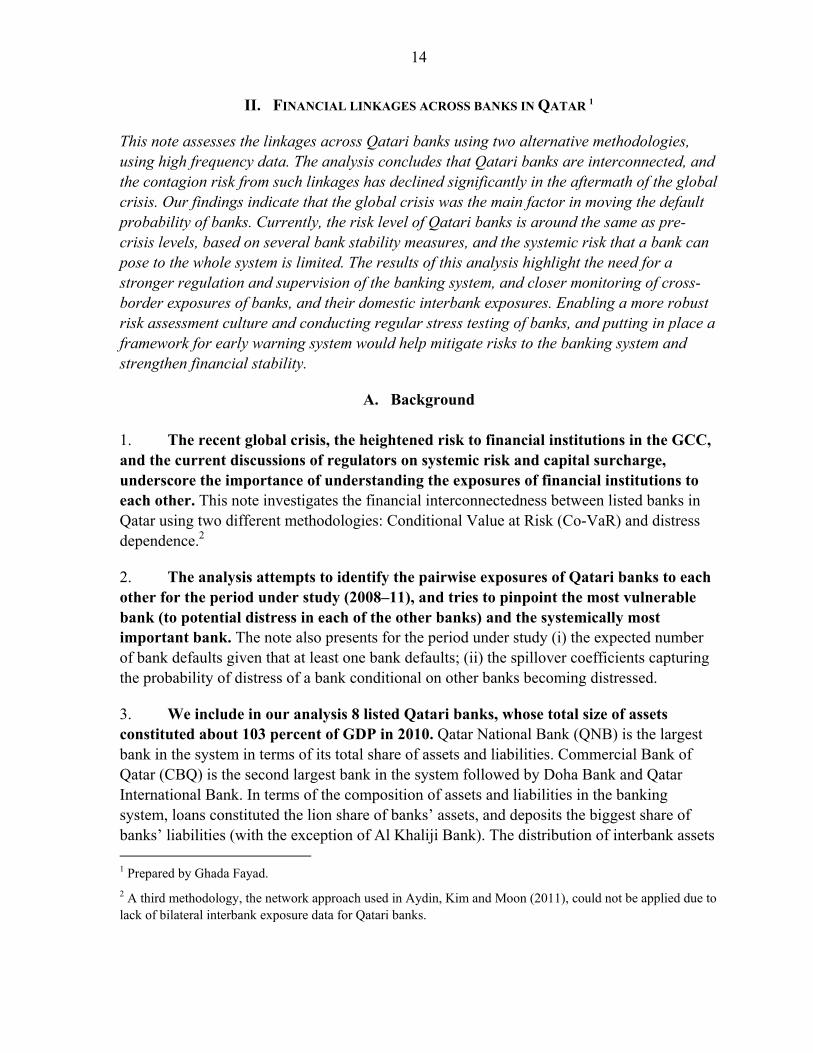
II. FINANCIAL LINKAGES ACROSS BANKS IN QATAR 1
This note assesses the linkages across Qatari banks using two alternative methodologies, using high frequency data. The analysis concludes that Qatari banks are interconnected, and the contagion risk from such linkages has declined significantly in the aftermath of the global crisis. Our findings indicate that the global crisis was the main factor in moving the default probability of banks. Currently, the risk level of Qatari banks is around the same as pre-crisis levels, based on several bank stability measures, and the systemic risk that a bank can pose to the whole system is limited. The results of this analysis highlight the need for a stronger regulation and supervision of the banking system, and closer monitoring of cross-border exposures of banks, and their domestic interbank exposures. Enabling a more robust risk assessment culture and conducting regular stress testing of banks, and putting in place a framework for early warning system would help mitigate risks to the banking system and strengthen financial stability.
A. Background 1. The recent global crisis, the heightened risk to financial institutions in the GCC, and the current discussions of regulators on systemic risk and capital surcharge, underscore the importance of understanding the exposures of financial institutions to each other. This note investigates the financial interconnectedness between listed banks in Qatar using two different methodologies: Conditional Value at Risk (Co-VaR) and distress dependence.2
2. The analysis attempts to identify the pairwise exposures of Qatari banks to each other for the period under study (2008–11), and tries to pinpoint the most vulnerable bank (to potential distress in each of the other banks) and the systemically most important bank. The note also presents for the period under study (i) the expected number of bank defaults given that at least one bank defaults; (ii) the spillover coefficients capturing the probability of distress of a bank conditional on other banks becoming distressed.
3. We include in our analysis 8 listed Qatari banks, whose total size of assets constituted about 103 percent of GDP in 2010. Qatar National Bank (QNB) is the largest bank in the system in terms of its total share of assets and liabilities. Commercial Bank of Qatar (CBQ) is the second largest bank in the system followed by Doha Bank and Qatar International Bank. In terms of the composition of assets and liabilities in the banking system, loans constituted the lion share of banks’ assets, and deposits the biggest share of banks’ liabilities (with the exception of Al Khaliji Bank). The distribution of interbank assets 1 Prepared by Ghada Fayad.
2 A third methodology, the network approach used in Aydin, Kim and Moon (2011), could not be applied due to lack of bilateral interbank exposure data for Qatari banks.
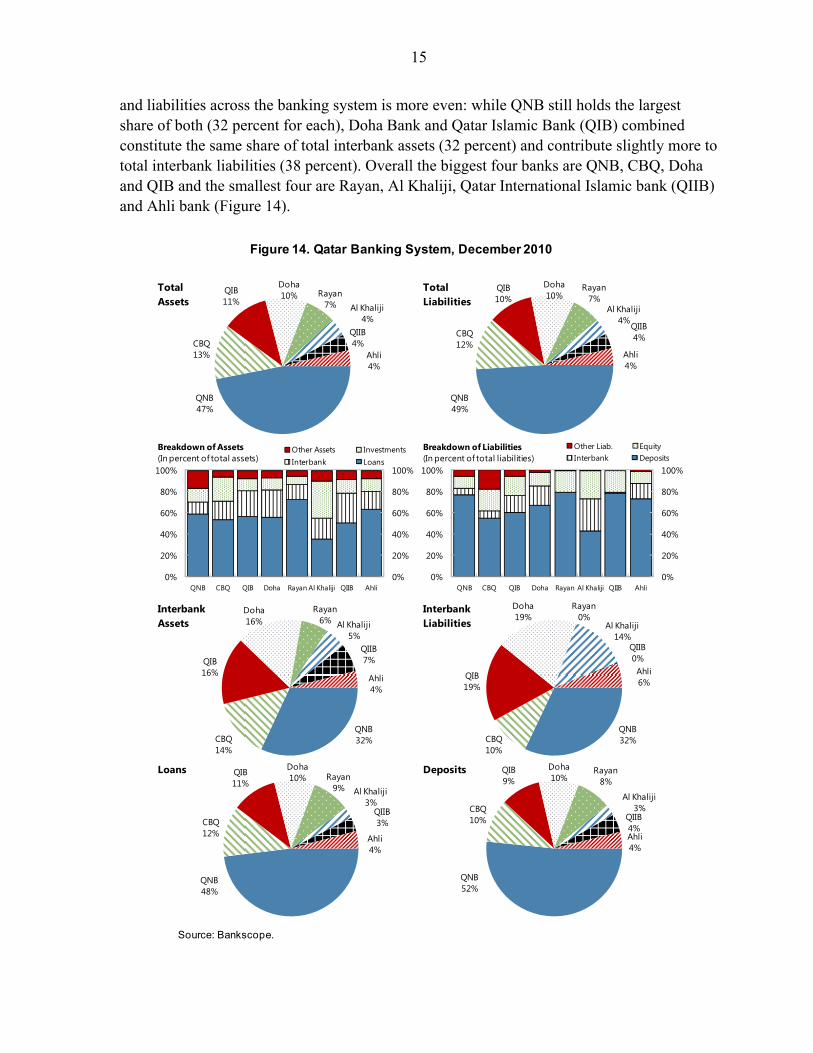
15
and liabilities across the banking system is more even: while QNB still holds the largest share of both (32 percent for each), Doha Bank and Qatar Islamic Bank (QIB) combined constitute the same share of total interbank assets (32 percent) and contribute slightly more to total interbank liabilities (38 percent). Overall the biggest four banks are QNB, CBQ, Doha and QIB and the smallest four are Rayan, Al Khaliji, Qatar International Islamic bank (QIIB) and Ahli bank (Figure 14).
Figure 14. Qatar Banking System, December 2010
Source: Bankscope.
QNB47%
CBQ13%
QIB11%
Doha10% Rayan
7% Al Khaliji4%
QIIB4%
Ahli4%
Total Assets
QNB49%
CBQ12%
QIB10%
Doha10%
Rayan7%
Al Khaliji4%
QIIB4%
Ahli4%
Total Liabilities
0%
20%
40%
60%
80%
100%
0%
20%
40%
60%
80%
100%
QNB CBQ QIB Doha Rayan Al Khaliji QIIB Ahli
Other Assets InvestmentsInterbank Loans
Breakdown of Assets(In percent of total assets)
0%
20%
40%
60%
80%
100%
0%
20%
40%
60%
80%
100%
QNB CBQ QIB Doha Rayan Al Khaliji QIIB Ahli
Other Liab. EquityInterbank Deposits
Breakdown of Liabilities(In percent of total liabilities)
QNB32%CBQ
14%
QIB16%
Doha16%
Rayan6% Al Khaliji
5%QIIB7%
Ahli4%
Interbank Assets
QNB32%CBQ
10%
QIB19%
Doha19%
Rayan0%
Al Khaliji14%
QIIB0%Ahli6%
Interbank Liabilities
QNB48%
CBQ12%
QIB11%
Doha10% Rayan
9% Al Khaliji3%
QIIB3%
Ahli4%
Loans
QNB52%
CBQ10%
QIB9%
Doha10%
Rayan8%
Al Khaliji3%
QIIB4%Ahli4%
Deposits
16
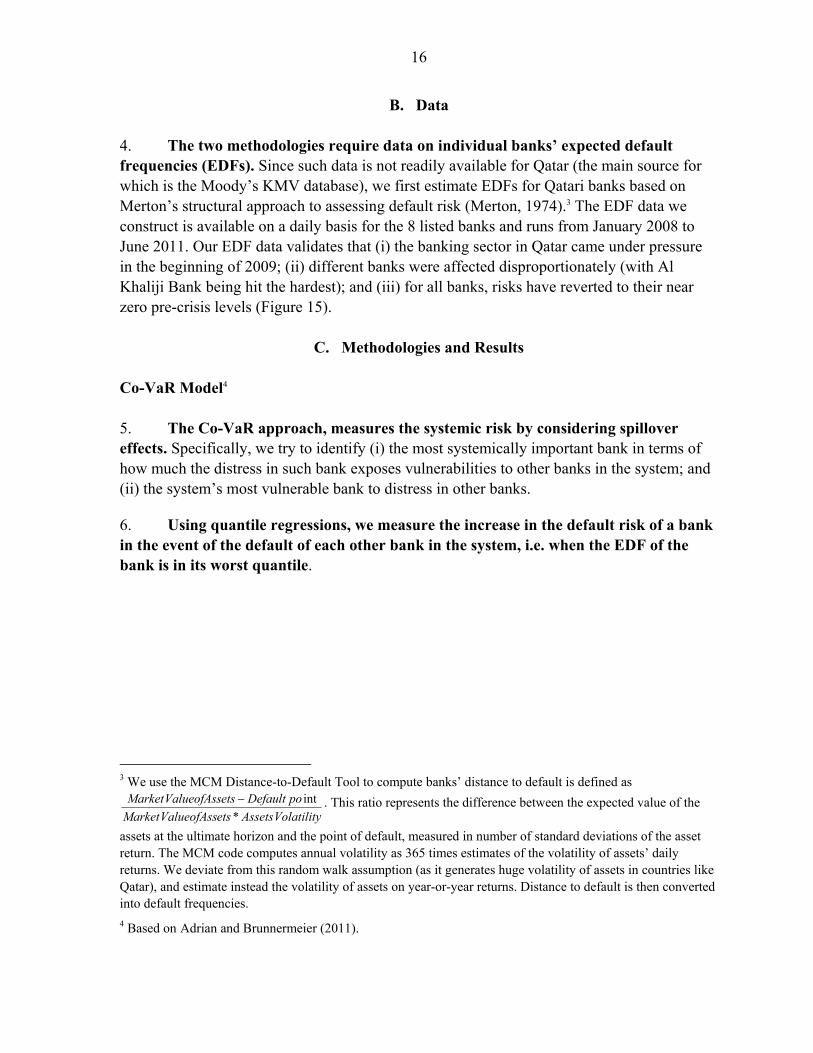
B. Data 4. The two methodologies require data on individual banks’ expected default frequencies (EDFs). Since such data is not readily available for Qatar (the main source for which is the Moody’s KMV database), we first estimate EDFs for Qatari banks based on Merton’s structural approach to assessing default risk (Merton, 1974).3 The EDF data we construct is available on a daily basis for the 8 listed banks and runs from January 2008 to June 2011. Our EDF data validates that (i) the banking sector in Qatar came under pressure in the beginning of 2009; (ii) different banks were affected disproportionately (with Al Khaliji Bank being hit the hardest); and (iii) for all banks, risks have reverted to their near zero pre-crisis levels (Figure 15).
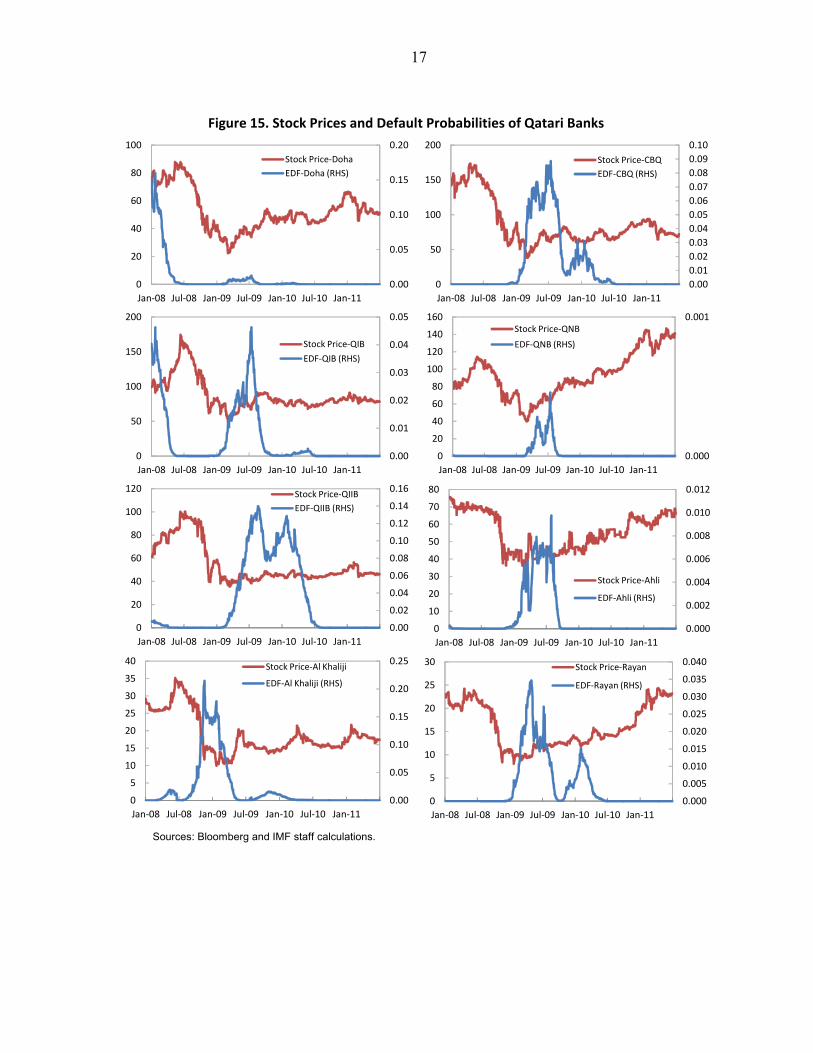
C. Methodologies and Results Co-VaR Model4 5. The Co-VaR approach, measures the systemic risk by considering spillover effects. Specifically, we try to identify (i) the most systemically important bank in terms of how much the distress in such bank exposes vulnerabilities to other banks in the system; and (ii) the system’s most vulnerable bank to distress in other banks.
6. Using quantile regressions, we measure the increase in the default risk of a bank in the event of the default of each other bank in the system, i.e. when the EDF of the bank is in its worst quantile.
3 We use the MCM Distance-to-Default Tool to compute banks’ distance to default is defined as
VolatilityAssetsetsValueofAssMarket
poDefaultetsValueofAssMarket
*
int . This ratio represents the difference between the expected value of the
assets at the ultimate horizon and the point of default, measured in number of standard deviations of the asset return. The MCM code computes annual volatility as 365 times estimates of the volatility of assets’ daily returns. We deviate from this random walk assumption (as it generates huge volatility of assets in countries like Qatar), and estimate instead the volatility of assets on year-or-year returns. Distance to default is then converted into default frequencies.
4 Based on Adrian and Brunnermeier (2011).
17
Figure 15. Stock Prices and Default Probabilities of Qatari Banks
Sources: Bloomberg and IMF staff calculations.
0.000
0.001
0
20
40
60
80
100
120
140
160
Jan-08 Jul-08 Jan-09 Jul-09 Jan-10 Jul-10 Jan-11
Stock Price-QNB
EDF-QNB (RHS)
0.00
0.05
0.10
0.15
0.20
0
20
40
60
80
100
Jan-08 Jul-08 Jan-09 Jul-09 Jan-10 Jul-10 Jan-11
Stock Price-Doha
EDF-Doha (RHS)
0.00
0.01
0.02
0.03
0.04
0.05
0.06
0.07
0.08
0.09
0.10
0
50
100
150
200
Jan-08 Jul-08 Jan-09 Jul-09 Jan-10 Jul-10 Jan-11
Stock Price-CBQ
EDF-CBQ (RHS)
0.00
0.01
0.02
0.03
0.04
0.05
0
50
100
150
200
Jan-08 Jul-08 Jan-09 Jul-09 Jan-10 Jul-10 Jan-11
Stock Price-QIB
EDF-QIB (RHS)
0.00
0.02
0.04
0.06
0.08
0.10
0.12
0.14
0.16
0
20
40
60
80
100
120
Jan-08 Jul-08 Jan-09 Jul-09 Jan-10 Jul-10 Jan-11
Stock Price-QIIB
EDF-QIIB (RHS)
0.000
0.002
0.004
0.006
0.008
0.010
0.012
0
10
20
30
40
50
60
70
80
Jan-08 Jul-08 Jan-09 Jul-09 Jan-10 Jul-10 Jan-11
Stock Price-Ahli
EDF-Ahli (RHS)
0.00
0.05
0.10
0.15
0.20
0.25
0
5
10
15
20
25
30
35
40
Jan-08 Jul-08 Jan-09 Jul-09 Jan-10 Jul-10 Jan-11
Stock Price-Al Khaliji
EDF-Al Khaliji (RHS)
0.000
0.005
0.010
0.015
0.020
0.025
0.030
0.035
0.040
0
5
10
15
20
25
30
Jan-08 Jul-08 Jan-09 Jul-09 Jan-10 Jul-10 Jan-11
Stock Price-Rayan
EDF-Rayan (RHS)
18
7. More specifically, for each bank, we separately regress its EDFs on the EDFs of the other banks in the system, and focus on relationship at the 95th quantile level. In other words, we estimate the conditional 95th EDF quantile for each bank (conditional on the EDF of each other bank in the system).5
8. Using the estimated coefficients, the predicted EDFs from the 95th quantile regression of bank i given the EDF of bank j define the value at risk (VaR) of bank i given bank j. Then, for each pair of Qatari banks i j:
We compute particular predicted values which define the conditional VaR (Co-VaRi/j): the VaR of bank i conditional on bank j being in distress, which we take as the EDF of bank j being at its 95th percentile value.
We also compute the change in Co-VaR for bank i which we define as the difference between the VaR of bank i conditional on the distress of bank j and the VaR of bank i conditional on the median state of bank j (i.e. bank j not being in distress).
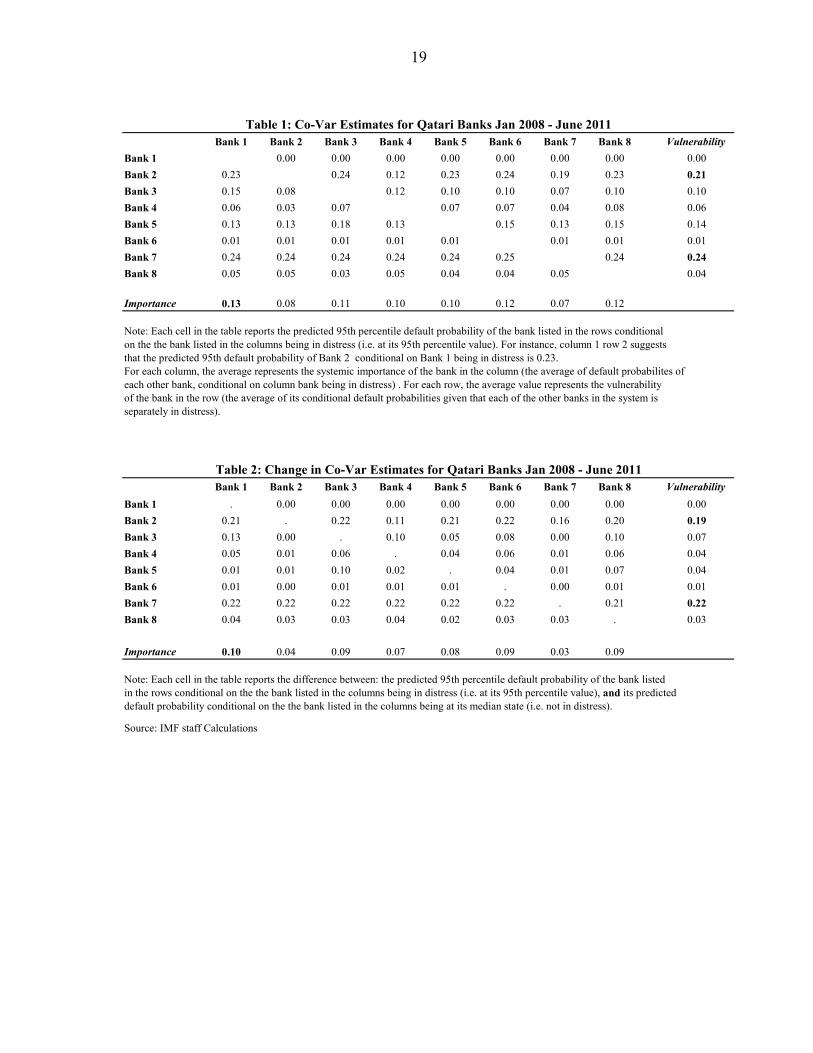
9. The two resulting 8x8 matrices of Qatari banks’s predicted conditional default probabilities allow us to determine the systemically important bank and the system’s most vulnerable bank(s). 10. Tables 1 and 2 report respectively the Co-VaR and change in Co-VaR for the Qatari banking system. Both show Bank 1 as systemically the most important bank in the system. It is also the strongest in the system in terms of its resilience to distress in other banks. Bank 7 is the most vulnerable bank in the system, followed by Bank 2, Bank 5 and Bank 3. Our results allow us to determine the extent to which banks are exposed to each other. For instance, focusing on the Bank 2 column of Table 1, the bank that is most exposed to distress in Bank 2 is Bank 7, followed by Bank 5. Focusing for instance on the Bank 5 row, Bank 5 is most exposed to Bank 3.
5 Each regression also included TED spreads as a common risk factor capturing risk aversion in global financial markets. The TED is the spread between the dollar interbank rate and the corresponding U.S. T-Bill rate.
19
Bank 1 Bank 2 Bank 3 Bank 4 Bank 5 Bank 6 Bank 7 Bank 8 Vulnerability
Bank 1 0.00 0.00 0.00 0.00 0.00 0.00 0.00 0.00
Bank 2 0.23 0.24 0.12 0.23 0.24 0.19 0.23 0.21
Bank 3 0.15 0.08 0.12 0.10 0.10 0.07 0.10 0.10
Bank 4 0.06 0.03 0.07 0.07 0.07 0.04 0.08 0.06
Bank 5 0.13 0.13 0.18 0.13 0.15 0.13 0.15 0.14
Bank 6 0.01 0.01 0.01 0.01 0.01 0.01 0.01 0.01
Bank 7 0.24 0.24 0.24 0.24 0.24 0.25 0.24 0.24
Bank 8 0.05 0.05 0.03 0.05 0.04 0.04 0.05 0.04
Importance 0.13 0.08 0.11 0.10 0.10 0.12 0.07 0.12
Note: Each cell in the table reports the predicted 95th percentile default probability of the bank listed in the rows conditionalon the the bank listed in the columns being in distress (i.e. at its 95th percentile value). For instance, column 1 row 2 suggeststhat the predicted 95th default probability of Bank 2 conditional on Bank 1 being in distress is 0.23.For each column, the average represents the systemic importance of the bank in the column (the average of default probabilites of each other bank, conditional on column bank being in distress) . For each row, the average value represents the vulnerability of the bank in the row (the average of its conditional default probabilities given that each of the other banks in the system is separately in distress).
Table 1: Co-Var Estimates for Qatari Banks Jan 2008 - June 2011
Bank 1 Bank 2 Bank 3 Bank 4 Bank 5 Bank 6 Bank 7 Bank 8 Vulnerability
Bank 1 . 0.00 0.00 0.00 0.00 0.00 0.00 0.00 0.00
Bank 2 0.21 . 0.22 0.11 0.21 0.22 0.16 0.20 0.19
Bank 3 0.13 0.00 . 0.10 0.05 0.08 0.00 0.10 0.07
Bank 4 0.05 0.01 0.06 . 0.04 0.06 0.01 0.06 0.04
Bank 5 0.01 0.01 0.10 0.02 . 0.04 0.01 0.07 0.04
Bank 6 0.01 0.00 0.01 0.01 0.01 . 0.00 0.01 0.01
Bank 7 0.22 0.22 0.22 0.22 0.22 0.22 . 0.21 0.22
Bank 8 0.04 0.03 0.03 0.04 0.02 0.03 0.03 . 0.03
Importance 0.10 0.04 0.09 0.07 0.08 0.09 0.03 0.09
Note: Each cell in the table reports the difference between: the predicted 95th percentile default probability of the bank listed in the rows conditional on the the bank listed in the columns being in distress (i.e. at its 95th percentile value), and its predicted default probability conditional on the the bank listed in the columns being at its median state (i.e. not in distress).
Source: IMF staff Calculations
Table 2: Change in Co-Var Estimates for Qatari Banks Jan 2008 - June 2011
20
D. Distress Dependence Approach6 11. This methodology conceptualizes the banking system as a portfolio of banks comprising the core systemically important banks. Banks are either directly (through interbank deposit market) or indirectly (through lending to common sectors) linked, and their distress changes with the economic cycle. Therefore, in times of distress, the banking system’s joint probability of default (i.e. the probability that all banks in the system suffer large losses simultaneously) may experience larger non-linear increases than those experienced by the probabilities of distress of individual banks. Estimating the aggregate banking system’s stability thus requires adequately capturing banks’ default dependence and measuring how it changes over time.
12. Using information on the marginal probabilities of default (which are the observed EDFs), this methodology infers the banking system portfolio multivariate density (BSMD), updating a prior multivariate distribution, from which a set of banking stability measures (BSMs) are constructed. These indicators (discussed in detail below) help assess the level of distress from a bank or group of banks on others in the system.
E. Bank Stability Index (BSI)
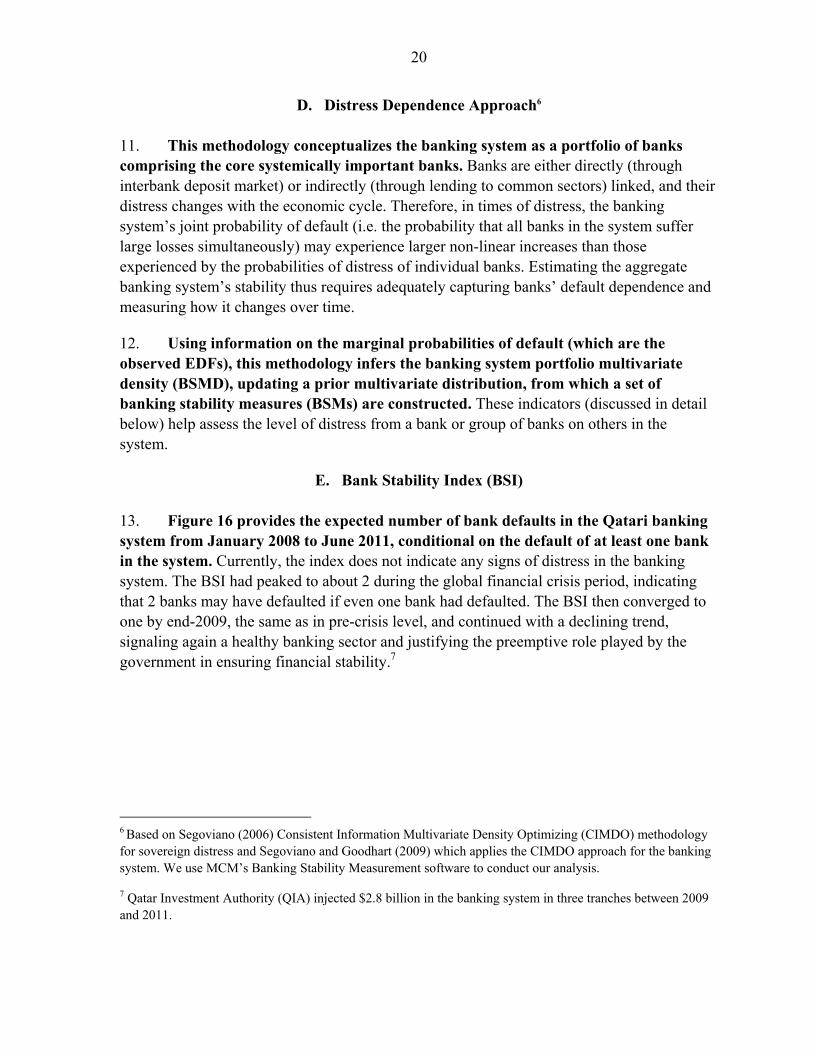
13. Figure 16 provides the expected number of bank defaults in the Qatari banking system from January 2008 to June 2011, conditional on the default of at least one bank in the system. Currently, the index does not indicate any signs of distress in the banking system. The BSI had peaked to about 2 during the global financial crisis period, indicating that 2 banks may have defaulted if even one bank had defaulted. The BSI then converged to one by end-2009, the same as in pre-crisis level, and continued with a declining trend, signaling again a healthy banking sector and justifying the preemptive role played by the government in ensuring financial stability.7
6 Based on Segoviano (2006) Consistent Information Multivariate Density Optimizing (CIMDO) methodology for sovereign distress and Segoviano and Goodhart (2009) which applies the CIMDO approach for the banking system. We use MCM’s Banking Stability Measurement software to conduct our analysis.
7 Qatar Investment Authority (QIA) injected $2.8 billion in the banking system in three tranches between 2009 and 2011.
21
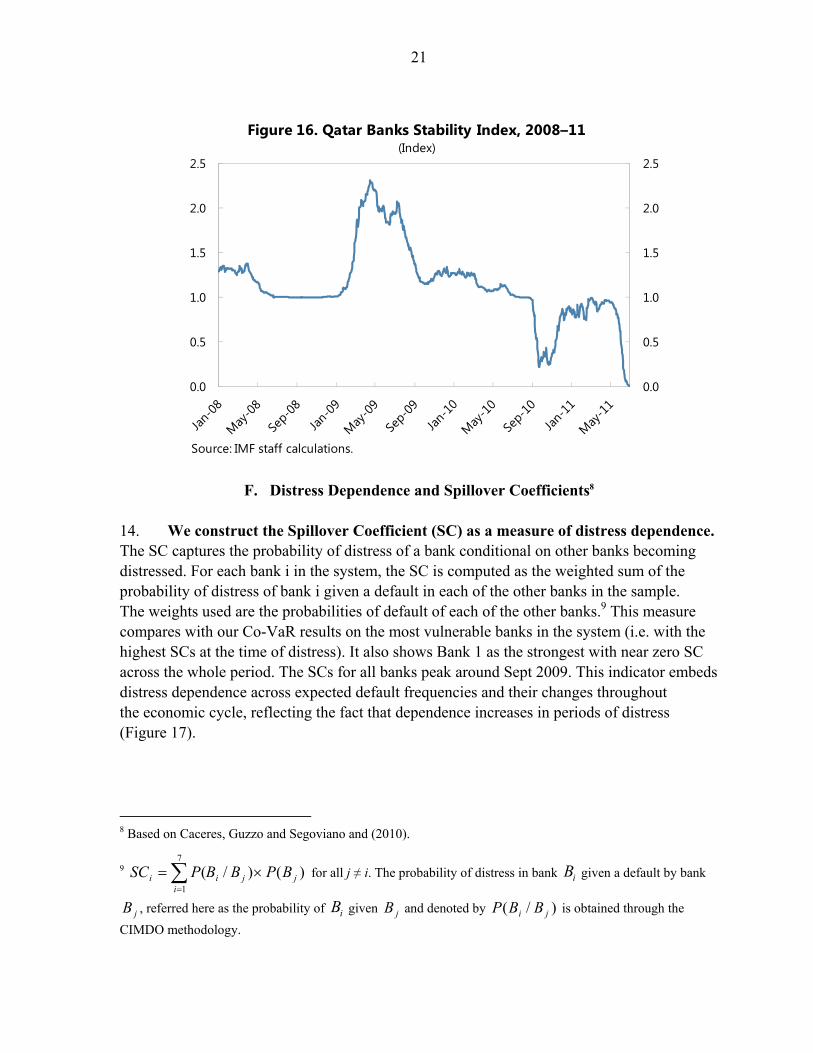
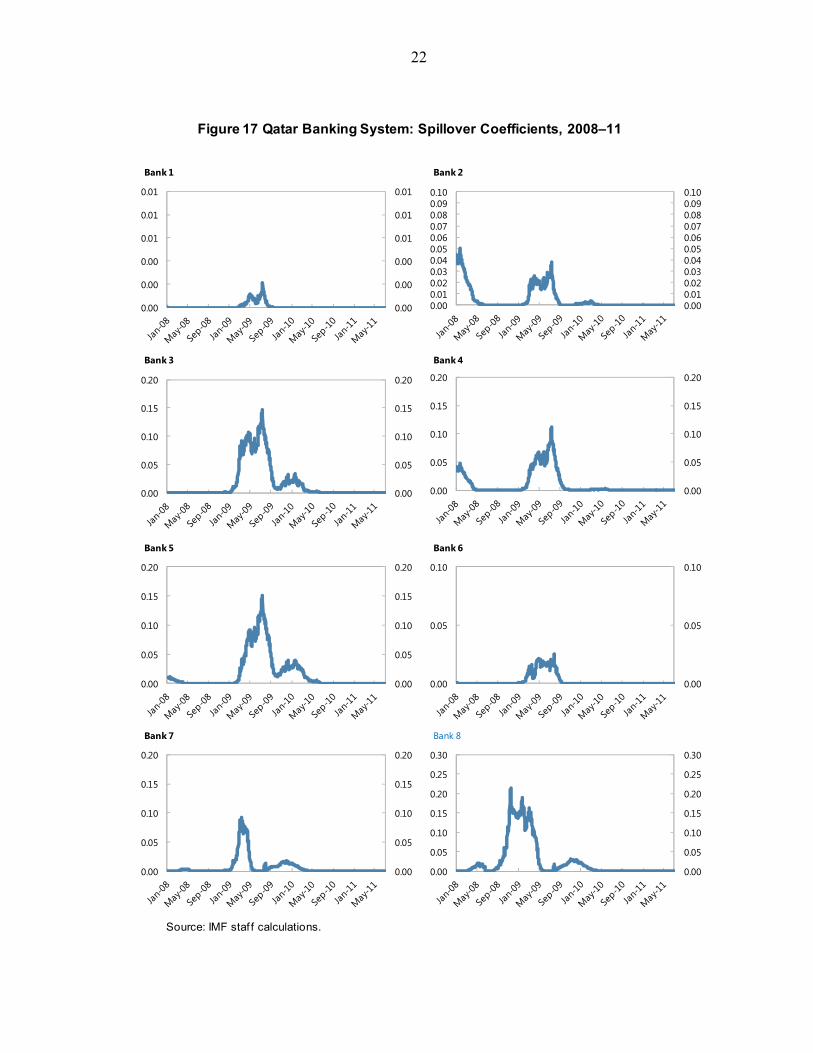
F. Distress Dependence and Spillover Coefficients8 14. We construct the Spillover Coefficient (SC) as a measure of distress dependence. The SC captures the probability of distress of a bank conditional on other banks becoming distressed. For each bank i in the system, the SC is computed as the weighted sum of the probability of distress of bank i given a default in each of the other banks in the sample. The weights used are the probabilities of default of each of the other banks.9 This measure compares with our Co-VaR results on the most vulnerable banks in the system (i.e. with the highest SCs at the time of distress). It also shows Bank 1 as the strongest with near zero SC across the whole period. The SCs for all banks peak around Sept 2009. This indicator embeds distress dependence across expected default frequencies and their changes throughout the economic cycle, reflecting the fact that dependence increases in periods of distress (Figure 17).
8 Based on Caceres, Guzzo and Segoviano and (2010).
9 )()/(7
1jji
ii BPBBPSC
for all j ≠ i. The probability of distress in bank iB given a default by bank
jB , referred here as the probability of iB given jB and denoted by )/( ji BBP is obtained through the
CIMDO methodology.
0.0
0.5
1.0
1.5
2.0
2.5
0.0
0.5
1.0
1.5
2.0
2.5
Figure 16. Qatar Banks Stability Index, 2008–11 (Index)
Source: IMF staff calculations.
22
Figure 17 Qatar Banking System: Spillover Coefficients, 2008–11
Source: IMF staf f calculations.
0.00
0.00
0.00
0.01
0.01
0.01
0.00
0.00
0.00
0.01
0.01
0.01
Bank 1
0.000.010.020.030.040.050.060.070.080.090.10
0.000.010.020.030.040.050.060.070.080.090.10
Bank 2
0.00
0.05
0.10
0.15
0.20
0.00
0.05
0.10
0.15
0.20
Bank 3
0.00
0.05
0.10
0.15
0.20
0.00
0.05
0.10
0.15
0.20
Bank 4
0.00
0.05
0.10
0.15
0.20
0.00
0.05
0.10
0.15
0.20
Bank 5
0.00
0.05
0.10
0.00
0.05
0.10
Bank 6
0.00
0.05
0.10
0.15
0.20
0.00
0.05
0.10
0.15
0.20
Bank 7
0.00
0.05
0.10
0.15
0.20
0.25
0.30
0.00
0.05
0.10
0.15
0.20
0.25
0.30
Bank 8
23
15. Our analysis indicates that risk of Qatari banks moves in line with risk aversion in international financial markets. Periods of international financial distress were the main factor moving the expected default probability of Qatari banks (Figure 15), indicating that Qatari banks are integrated with global financial markets. Both methodologies also show the same global interlinkages. For instance, if we run the Co-VaR approach for the period 2008-09 and 2010–11 separately, we find that the average Co-VaR of the Qatari banking sector (the average of all elements in the Co-VaR matrix) decreased from 0.09 in the distressed period of 2008–09 to 0.03 in 2010–11. Similar to the results found in the Co-VaR approach, distress dependence of Qatari banks follows major global financial events, and the level of dependence in the Qatari banking system has declined significantly in the aftermath of the global financial crisis (Figure 16).
G. Policy Implications 16. The results of this analysis highlight the need for a stronger regulation and supervision of the banking system, and closer monitoring of cross-border exposures of banks, and their domestic interbank exposures. Enabling a more robust risk assessment culture and conducting regular stress testing of banks, and putting in place a framework for an early warning system would help mitigate risks to the banking system and strengthen financial stability.
24
References
Adrian, T. and M. K. Brunnermeier, 2011, “CoVaR,” NBER Working Paper No. w17454. Aydin , B., Kim, M-S., and H-S. Moon, 2011, “Financial Linkages across Korean Banks,”
IMF Working Paper WP/11/201 (Washington: International Monetary Fund). Caceres, C., Guzzo, V. and M. Segoviano, 2010, “Sovereign Spreads: Global Risk Aversion,
Contagion or Fundamentals?” IMF Working Paper WP10/120 (Washington: International Monetary Fund).
Merton, R.C., 1974, “On the Pricing of Corporate Debt: The Risk Structure of Interest
Rates,” Journal of Finance, 29 (May), pp. 449–70. Segoviano, M. A., 2006, “The Consistent Information Multivariate Density Optimizing Methodology,” Financial Markets Group, London School of Economics, Discussion
Paper 557 (London: London School of Economics). Segoviano, M. A. and C. Goodhart, 2009, “Banking Stability Measures,” IMF Working
Paper WP/09/04 (Washington: International Monetary Fund).