Embed Size (px)
Citation preview
1July 09, 2014
ECONOMICS
QATAR
JULY 09, 2014
TABLE OF CONTENTS
CONTACTS
Research
Marwan S. Barakat(961-1) [email protected]
Jamil H. Naayem(961-1) [email protected]
Salma Saad Baba(961-1) [email protected]
Fadi A. Kanso(961-1) [email protected]
Sarah F. Borgi(961-1) [email protected]
Gerard H. Arabian(961-1) 964047 [email protected]
Executive Summary 1
Introduction 2
Economic Conditions 4
Real Sector 4
External Sector 8
Public Sector 10
Financial Sector 11
Conclusion 17
The Qatar Economic Report can be accessed via internet at the following web address: http://www.banqueaudi.com
QATAR ECONOMIC REPORT
A LUCRATIVE ENVIRONMENT WHERE STRENGTHS EXCEED WEAKNESSES AND
OPPORTUNITIES OUTPACE THREATS
• Sound economic growth increasingly driven by the non-hydrocarbon sector In 2013, real GDP growth exceeded preset forecasts, coming in at an annual 6.1%, the fastest pace of expansion
recorded anywhere in the oil-rich GCC, thanks to strong non-oil and gas output. Although the economy is
still dependent on hydrocarbons revenue, growth is now being driven primarily by the non-hydrocarbons
sector. The expansion in the non-oil sector was broad based but continued to be led by the construction
sector, as work progressed on the State’s vast infrastructure build-out program. Financial services, trade
and transport sectors also benefited from sharp gains in government-funded and government-sponsored
capital outlays.
• Healthy external surpluses despite slower export growth Qatar’s external sector continues to exhibit large surpluses thanks to sustained high hydrocarbon prices,
within the context of a tight LNG market and supply disruptions among other oil producers. The State’s
overall trade surplus widened by 1.9% in 2013 as compared to a 19.1% growth in 2012, on the back of
shrinking export growth. The current account surplus nudged slightly down to 30.9% of GDP in 2013,
compared with 32.1% of GDP in 2012, though remaining significantly healthy on the overall.
• Slower yet comfortable growth in fiscal surplusThe fiscal balance has remained in comfortable territories with revenues growing at a pace almost double
that of expenditures. However, the fiscal surplus has grown at a lower pace than the previous two years,
reflecting flat production of oil and LNG. According to IMF data, the surplus has grown by 23.5% in the FY
2013/2014 ending in March 2014 to reach US$ 22.8 billion, following a higher rise of 63.1% in FY 2012/2013.
The fiscal balance has emerged at the end of FY2013/2014, at around 11% of GDP, much higher than the 1%
planned by the government that was based on a conservative oil price assumption of US$ 65/barrel.
• Relatively subdued price pressures amidst a moderate expansion in Money SupplyThe first few months of 2014 were marked by relatively subdued price pressures in Qatar, sustained low
policy rates within an accommodative monetary policy and a moderate expansion in monetary aggregates.
Qatar’s Consumer Price Index grew by 2.8% on average during the first five months of 2014, after rising by
3.1% in 2013, mainly driven by steady increases in rental costs given a strong inflow of expatriate workers.
The broader Money Supply (M2) expanded by 5.1% during the first four months of 2014 to reach US$ 131.6
billion at end-April 2014, after expanding by 19.6% in 2013.
• Solid bank deposit and lending growth on the back of strong financial standingQatar’s banking sector witnessed a period of strong activity growth during 2013 and the first four months
of 2014, favoured by solid macro fundamentals in a continuously growing economy translating into healthy
private and public sector deposits inflows feeding into additional financing on behalf of banks themselves.
According to the latest statistics published by the Central Bank, total sector activity grew by 11.4% in 2013
and by a further 3.8% in the first four months of 2014 to reach the equivalent of US$ 259.5 billion at end-
April. Financial soundness indicators remain strong, with banks’ non-performing loans to total loans ratio
standing at 1.9% along with a provisioning coverage ratio at 96.8%, a Basle II capital adequacy ratio of 16.0%,
a return on average assets ratio of 2.1% and a return on average equity ratio of 16.5%, comparing favourably
to international benchmarks.
• Surge in prices across Qatari capital markets Qatar’s capital markets registered significant price increases over the first half of 2014. The equity market
managed to end on a positive note despite sharp price falls observed during the month of June on lingering
concerns about the Iraqi unrest. This was mainly supported by strong price rallies recorded before MSCI
upgraded Qatar to emerging market status. In parallel, the Qatari fixed income market saw mostly upward
price movements across the board during the first half of 2014, amidst ample liquidity at hand and tracking
US Treasuries, while the country’s five-year CDS spread saw further contractions so far this year. The Qatar
Exchange general index surged by 10.7% between December 2013 and June 2014, while Qatar’s five-year
CDS spread stood at 53 basis points at end-June 2014, down by 6 basis points since year-end 2013, following
a 23 bps contraction in 2013, which suggests an improved market perception of country risk at large.
Bank Audi sal - Group Research Department - Bank Audi Plaza - Bab Idriss - PO Box 11-2560 - Lebanon - Tel: 961 1 994 000 - email: [email protected]
2July 09, 2014
ECONOMICS
QATAR
JULY 09, 2014
In 2013, real GDP growth exceeded preset forecasts, coming in at an annual 6.1%, the fastest pace of
expansion recorded anywhere in the oil-rich GCC, thanks to strong non-oil and gas output, largely in
the construction and financial sectors. The 2013 growth rate actually surpassed widespread expectations
that Qatar’s economic expansion would slow last year, owing to the marginal drop in oil and gas prices.
But rising infrastructure spending by the government on 2022 football World Cup projects and rising
inflows of expatriates have kept the pace of expansion robust.
Still, the relative moderation of real GDP growth from its recent historical trend is obviously tied to the fact
that the latest round of investment in gas export capacity has been completed. Although the economy is
still dependent on hydrocarbons revenue, growth is now being driven primarily by the non-hydrocarbons
sector. The expansion in the non-oil sector was broad based but continued to be led by the construction
sector, as work progressed on the State’s vast infrastructure build-out program. Financial services, trade
and transport sectors also benefited from sharp gains in government-funded and government-sponsored
capital outlays. A privatization drive that began in recent years has targeted sectors such as water, power
and transportation, with the aim of boosting their efficiency.
As well as its direct impact on activity, the increases in investment drove population growth of close
to 10% in 2013 as growing levels of activity required the importation of additional foreign workers,
further boosting domestic demand through growth in private consumption. Despite this, per capita GDP
remained above US$ 100,000 in 2013, among the highest worldwide, as the value of nominal output
exceeded US$ 200 billion for the first time.
At the monetary level, inflation remained moderate at 3.1% in 2013 on rising rents offset by flat foreign
inflation. As a matter of fact, foreign inflation remained low in 2013 owing to flat international commodity
and food prices, helping to moderate overall inflation. The overall balance of payments reported a healthy
surplus in 2013. As a result, international reserves rose to US$ 41.7 billion, which is equivalent to a high of
48.3% of Money Supply in local currency. They actually represent 16 months of import cover at end-2013,
well above the IMF recommended level of 3 months of import cover for fixed exchange rates.
At the external sector level, the current account recorded a healthy surplus of 30.9% of GDP in 2013,
on robust hydrocarbon prices and rising exports of oil, gas and related products, such as fuels,
petrochemicals and fertilizers. This more than offset the import bill, which expanded on robust domestic
demand. A portion of hydrocarbon revenue is invested abroad through the Qatar Investment Authority
(QIA), leading to a capital and financial account deficit. As a result of the growing stock of foreign assets,
Sources: IMF, Bank Audi’s Group Research Department Sources: Central Bank of Qatar, Bank Audi’s Group Research Department
NOMINAL GDP AND REAL GROWTH RATES GDP BREAKDOWN BY ECONOMIC ACTIVITY*
3July 09, 2014
ECONOMICS
QATAR
JULY 09, 2014
investment income from abroad rose to around 3% of GDP in 2013, up from 1% in 2009, which is reducing
the dependence on hydrocarbon external revenue.
At the fiscal level, the fiscal surplus remained high in 2013/2014 at 11.1% of GDP, with government
revenues of 41.5% of GDP significantly outpacing the government spending to GDP ratio of 30.4%. Given
that the budget was originally based on a conservative crude oil price of US$ 65 per barrel, the turnout for
the fiscal surplus was significantly higher than originally budgeted. Revenue growth was marginally lower
in 2013 than in 2012 owing to lower hydrocarbon prices, which was partly offset by higher corporate
income tax collections. On the expenditure side, wages and subsidies lead to higher current expenditure.
Investment spending rose less than expected due to some delays in project implementation.
At the banking level, asset growth slowed in 2013 while growth in deposits outpaced lending growth.
Banking assets grew by 11.4% in 2013, slower than in 2012 (17.6%). Still, asset penetration continued to
rise, with assets to GDP reaching 124.3% in 2013, up from 118.7% in 2012. Asset growth was underpinned
by strong deposit growth of 19.7% in 2013 tied to the government surplus and the large population
growth. The banking sector loan growth of 13.1% in 2013 lagged deposit growth as the public sector
reduced its reliance on commercial banks to finance its public spending program. The Qatari banking
sector continues to enjoy strong financial soundness indicators, with a low NPL ratio of 1.9% of total loans
in 2013, a high capital adequacy ratio of 16% along with satisfactory profitability, with return on equity
averaging 16.5% in 2013.
The detailed developments in the real sector, external sector, public sector and financial sector are
outlined in the sections that follow while the concluding remarks address Qatar’s near-term economic
outlook looking forward.
Sources: Central Bank of Qatar, IMF, Bank Audi’s Group Research Department
MONEY SUPPLY AND INFLATION
4July 09, 2014
ECONOMICS
QATAR
JULY 09, 2014
1. ECONOMIC CONDITIONS
1.1. REAL SECTOR
1.1.1. Hydrocarbons
Lower hydrocarbon growth amidst a contracting share in the economy
The self-imposed moratorium on Qatar energy production continued to shape activity in the hydrocarbon
sector and contain the country’s output growth. The year 2013 was the second year of single-digit growth
in hydrocarbon industries, with real expansion of the sector decelerating from 1.7% in 2012 to 1.2% in
2013, as per IMF data. The breakdown of growth last year reflects the diversification strategy’s success,
with growth in the non-hydrocarbon sector surpassing that of hydrocarbons for the second consecutive
year. As such, the share of the hydrocarbon sector out of total GDP decreased from above 59% in 2011 to
58% in 2012 and to around 54% in 2013.
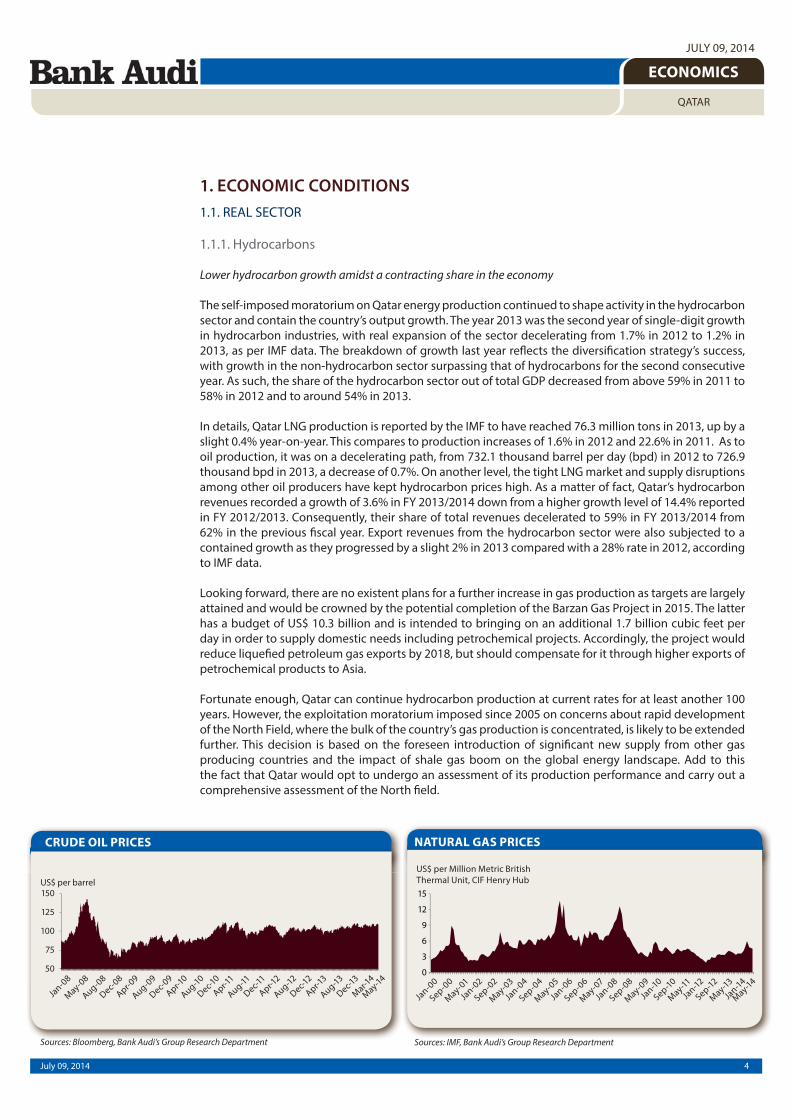
In details, Qatar LNG production is reported by the IMF to have reached 76.3 million tons in 2013, up by a
slight 0.4% year-on-year. This compares to production increases of 1.6% in 2012 and 22.6% in 2011. As to
oil production, it was on a decelerating path, from 732.1 thousand barrel per day (bpd) in 2012 to 726.9
thousand bpd in 2013, a decrease of 0.7%. On another level, the tight LNG market and supply disruptions
among other oil producers have kept hydrocarbon prices high. As a matter of fact, Qatar’s hydrocarbon
revenues recorded a growth of 3.6% in FY 2013/2014 down from a higher growth level of 14.4% reported
in FY 2012/2013. Consequently, their share of total revenues decelerated to 59% in FY 2013/2014 from
62% in the previous fiscal year. Export revenues from the hydrocarbon sector were also subjected to a
contained growth as they progressed by a slight 2% in 2013 compared with a 28% rate in 2012, according
to IMF data.
Looking forward, there are no existent plans for a further increase in gas production as targets are largely
attained and would be crowned by the potential completion of the Barzan Gas Project in 2015. The latter
has a budget of US$ 10.3 billion and is intended to bringing on an additional 1.7 billion cubic feet per
day in order to supply domestic needs including petrochemical projects. Accordingly, the project would
reduce liquefied petroleum gas exports by 2018, but should compensate for it through higher exports of
petrochemical products to Asia.
Fortunate enough, Qatar can continue hydrocarbon production at current rates for at least another 100
years. However, the exploitation moratorium imposed since 2005 on concerns about rapid development
of the North Field, where the bulk of the country’s gas production is concentrated, is likely to be extended
further. This decision is based on the foreseen introduction of significant new supply from other gas
producing countries and the impact of shale gas boom on the global energy landscape. Add to this
the fact that Qatar would opt to undergo an assessment of its production performance and carry out a
comprehensive assessment of the North field.
NATURAL GAS PRICES
Sources: IMF, Bank Audi’s Group Research Department
CRUDE OIL PRICES
Sources: Bloomberg, Bank Audi’s Group Research Department
5July 09, 2014
ECONOMICS
QATAR
JULY 09, 2014
On another level, high exports to Asia and the nature of Qatar’s long-term contracts have relieved the
country from falling gas prices. Decreasing European gas production along with a desire to reduce
dependency of the continent on Russian gas exports would mean that Qatar is likely to continue to sell
its LNG output at historically high prices. Along the same lines, Europe can be receptive of Qatar’s non-
allocated gas production through 2020, estimated at just 10%. Moreover, Qatar’s well-diversified gas
industry put it in a better position than its GCC counterparts to absorb the impact of North-American
shale oil boom. In fact, the industry has brought in US$ 22.8 billion in revenues in FY 2013/2014 compared
to US$ 27.7 billion in oil revenues. It is worth mentioning in this regard that the bulk of LNG earnings are
accounted for among the QIA’s assets.
Qatar’s growth strategy in the hydrocarbons sector is also shifting gradually towards expanding its
investment overseas in the oil and gas sector and enhancing its already growing condensate production.
For instance, the country has laid the foundation stone for a second condensate refinery in Ras Laffan,
designed for processing 146,000 bpd. As to crude oil output, it is expected to decline due to maturing
fields while oil recovery techniques may require some time before making an impact.
1.1.2. Manufacturing
Moderate growth amidst government diversification efforts
Qatar’s manufacturing sector, which accounted for 10% of the country’s aggregate output in 2013, is playing
an important role in Qatar’s economic diversification. Qatar aims to gradually reduce its dependence on
hydrocarbon industries, enhance the role of its private sector and maintain its competitiveness by further
growing its manufacturing sector. Being the third largest contributor to GDP growth in 2013, Qatar’s
manufacturing sector expanded by 5.6% year-on-year.
The manufacturing industries in the GCC region, led by the chemical and petrochemical sectors, witnessed
a major expansion over the last five years. With an annual average growth of 4%, the total value of the
industries reached US$ 369 billion in 2013, according to the Gulf Organization for Industrial Consulting
(GOIC). Qatar ranked second in the region, in terms of its share of total industrial investments, with a
22.2% market share, behind only Saudi Arabia (54.2%), as per the GOIC.
Qatar produces 10 million tons per annum of chemicals, polymers and fertilizers, and the country’s
petrochemicals output is planned to reach 23 million tons by 2020 due the continuous investments in
the sector. The government plans to invest US$ 25 billion to expand the industry and build a sustainable
and diversified economy, according to Qatar Chemical and Petrochemical Marketing and Distribution
Company.
Within this context, joint ventures will be or have already been established with international companies.
For instance, RasGas Company‘s Barzan Gas Project, valued at US$ 10.3 billion, reached 80% completion
of its offshore and onshore construction. Barzan Gas Project is scheduled to be developed in three phases,
with a total capacity of 6.2 billion cubic feet per day of natural gas. The first phase would have a capacity
of 1.7 billion cubic feet per day of natural gas, while phases two and three would have a capacity of 2
billion cubic feet per day and 2.5 billion cubic feet per day of natural gas respectively. Moreover, the Al-
Karaana project, an 80:20 joint venture between Qatar Petroleum and Shell Petrochemicals, is scheduled
for completion by 2018 and would comprise a steam cracker, a 1.5 million tons per annum mono ethylene
glycol plant, a 300 tons per annum linear alpha olefin unit and a 250 million tons per annum alcohol unit.
To be built at an investment outlay of US$ 6.5 billion, the petrochemical complex is expected to increase
Qatar’s petrochemical production capacity by 25%.
In 2014, Qatar’s manufacturing sector is forecast to grow, but slower than other sectors such as services
or construction, according to the Ministry of Development Planning. Its growth is seen moderating with
declines in fertilizer and refined products.
6July 09, 2014
ECONOMICS
QATAR
JULY 09, 2014
1.1.3. Construction
Construction boom in preparation for the World Cup 2022 and in line with Qatar’s 2030 Vision
The construction sector in Qatar, accounting for 4.9% of the country’s GDP, has been further bolstered
since the country’s winning bid to host the World Cup 2022. Ahead of the World Cup and in line with the
country’s 2030 Vision, Qatar’s infrastructure expenditure is expected to reach US$ 150 billion mainly on
infrastructure and transport development, but also on hotels and stadia.
According to the GCC Powers of Construction 2014 report by Deloitte, the value of projects planned or
underway in Qatar reached US$ 276 billion as of April 2014, an increase of 17% year-on-year. Moreover,
Qatar ranked third amongst other GCC nations in terms of total value of projects planned or underway in
the GCC, overtaken only by Saudi Arabia and the UAE.
Qatar’s construction sector is projected to expand by 14.1% in 2014, against 13.6% in 2013, and may well
accelerate faster in 2015, according to the Ministry of Development Planning and Statistics. The main
driver is the government’s significant investment in economic infrastructure, particularly local roads,
expressways, the Doha metro and rail, and drains and sanitation at a pace that is likely to pick up over
2014 and 2015, as per the same source.
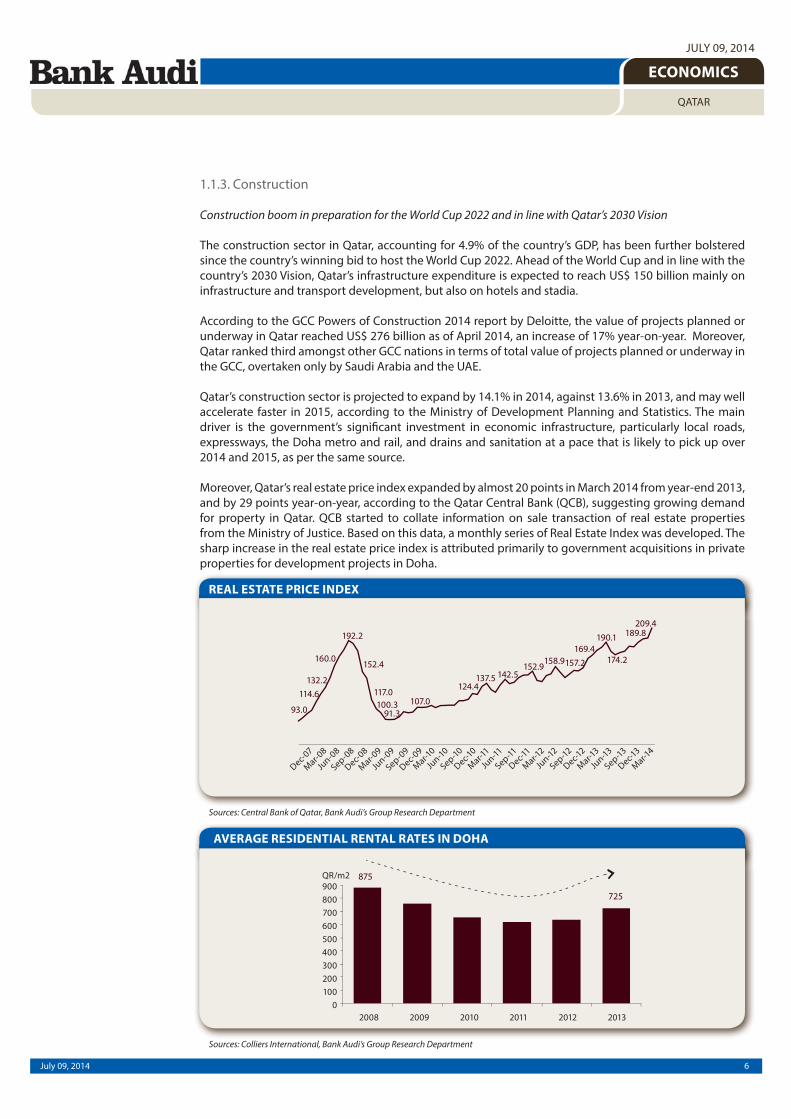
Moreover, Qatar’s real estate price index expanded by almost 20 points in March 2014 from year-end 2013,
and by 29 points year-on-year, according to the Qatar Central Bank (QCB), suggesting growing demand
for property in Qatar. QCB started to collate information on sale transaction of real estate properties
from the Ministry of Justice. Based on this data, a monthly series of Real Estate Index was developed. The
sharp increase in the real estate price index is attributed primarily to government acquisitions in private
properties for development projects in Doha.
AVERAGE RESIDENTIAL RENTAL RATES IN DOHA
Sources: Colliers International, Bank Audi’s Group Research Department
REAL ESTATE PRICE INDEX
Sources: Central Bank of Qatar, Bank Audi’s Group Research Department
7July 09, 2014
ECONOMICS
QATAR
JULY 09, 2014
It is worth noting that Qatar’s construction expenditure per segment, as at April 2014, is allocated in
a way where the top five segments consist of: mixed use projects (37%), hospitality and leisure (18%),
retail (11%), residential (10%), and commercial (9%), as per Deloitte. Furthermore, the largest projects
underway in the country consist of the Doha Metro Green Line, the Research Institute Sidra Medical &
Research Center, and the Doha Metro Red Line North, valued at US$ 2.5 billion, US$ 2.3 billion, and US$
2.2 billion respectively.
Qatar, in common with the other GCC powerhouses, continues to focus on improving its social
infrastructure. The country’s long-awaited new Hamad International Airport was opened on April 30th
2014, with the New Doha Port Project, the rail and metro projects, and the roads program still in the
pipeline. A major part of the spending would be on the Qatar Rail project, which is expected to cost
around US$ 45 billion, as per Deloitte.
However, a major cause for concern is the rising construction costs in the country, from materials to labor,
with Qatar having the 15th most expensive building costs in the world and the highest in the MENA
region, as per Deloitte. The government plans to address the issue by regulating commodities through
the creation of a single buying source such as a government subsidiary, which would eventually sell to
contractors in Qatar.
In conclusion, infrastructure investment is vast in Qatar, one of the most developed economies of the
GCC. The development of urban metro systems and rail networks are the most significant investment
activities, and would be accompanied by complementary development, further driving economic growth
at large.
1.1.4. Tourism
Expansionary mode with the implementation of the Qatar National Tourism Sector Strategy 2030
Qatar is striving to become a popular regional tourist destination in the foreseeable future, with the
implementation of the Qatar National Tourism Sector Strategy 2030. Although the country is currently
a predominantly business tourism hub, the government is working to reverse this trend and transform
Qatar into a leisure destination for tourists.
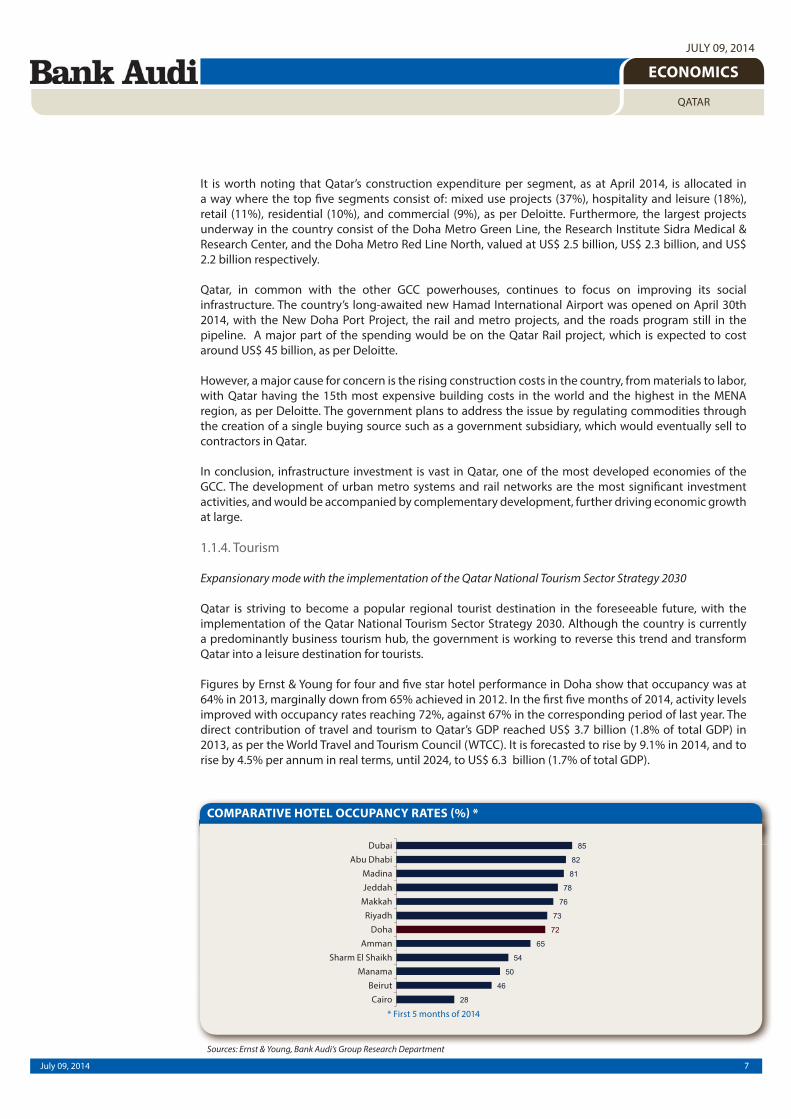
Figures by Ernst & Young for four and five star hotel performance in Doha show that occupancy was at
64% in 2013, marginally down from 65% achieved in 2012. In the first five months of 2014, activity levels
improved with occupancy rates reaching 72%, against 67% in the corresponding period of last year. The
direct contribution of travel and tourism to Qatar’s GDP reached US$ 3.7 billion (1.8% of total GDP) in
2013, as per the World Travel and Tourism Council (WTCC). It is forecasted to rise by 9.1% in 2014, and to
rise by 4.5% per annum in real terms, until 2024, to US$ 6.3 billion (1.7% of total GDP).
COMPARATIVE HOTEL OCCUPANCY RATES (%) *
Sources: Ernst & Young, Bank Audi’s Group Research Department
8July 09, 2014
ECONOMICS
QATAR
JULY 09, 2014
Qatar’s regional and international visitor arrivals reached 1.3 million in 2013, against 1.2 million visitors in
the previous year, according to the Qatar Tourism Authority (QTA). In the first quarter of 2014, regional and
international visitor arrivals totaled 387,022, representing a 9% year-on-year increase. Moreover, tourists
from the GCC region constituted the largest segment of total tourists in 2013 with 1,090,239 visitors.
The latter was followed by tourists from Asia, Europe, non-GCC Arab countries and Africa, respectively,
arriving on either business or tourist visas, as per the QTA.
With the execution of the Qatar National Tourism Sector Strategy 2030, the tourism sector is forecast to
contribute 0.9% to the country’s GDP in 2015, and expected to further grow and contribute 3.1% to Qatar’s
GDP by 2030, as per the QTA. The recently unveiled Qatar tourism strategy also targets tourist arrivals of
3.8 million by 2022 and 7 million by 2030, up from 1.3 million visitors in 2013. The latter constitutes an
annual compounded average growth rate of 11%. In addition, the strategy aims to draw proportionally
more visitors from the rest of the world than from the GCC alone by 2030.
As part of Qatar’s National Tourism Strategy, up to US$ 45 billion would be allocated to develop Qatar’s
tourism industry by 2030, according to the Qatar Tourism Authority. Moreover, Qatar plans to spend US$
20 billion on tourism infrastructure ahead of the World Cup 2022. In fact, around 45,000 further hotel
rooms would be required to meet FIFA capacity requirements, with 21 hotels planned for construction
by 2017.
Alongside the expansion of hotel capacity in the country, the new Doha International Airport, valued
at US$ 15.5 billion, was opened by the end of April 2014. The new airport has a capacity to handle 50
million passengers and 320,000 planes per year. The opening of the airport is anticipated to bring a higher
number of transit passengers to Qatar, and encourage them to visit the country’s touristic attractions.
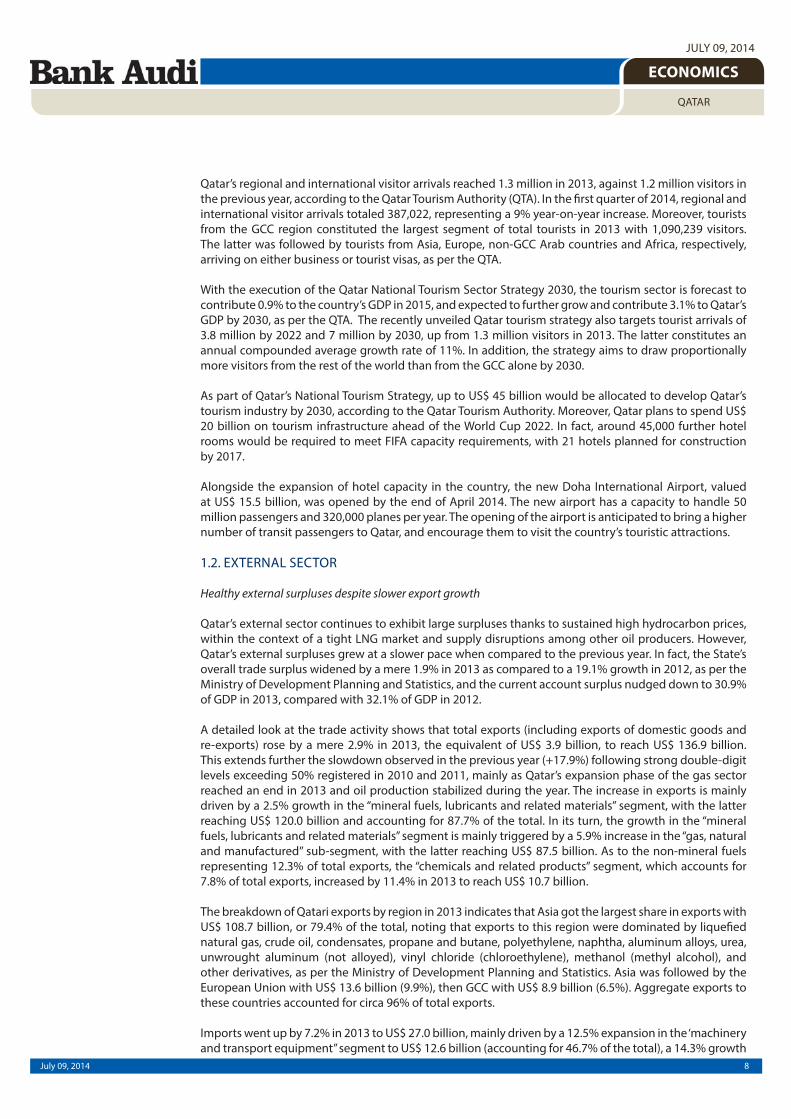
1.2. EXTERNAL SECTOR
Healthy external surpluses despite slower export growth
Qatar’s external sector continues to exhibit large surpluses thanks to sustained high hydrocarbon prices,
within the context of a tight LNG market and supply disruptions among other oil producers. However,
Qatar’s external surpluses grew at a slower pace when compared to the previous year. In fact, the State’s
overall trade surplus widened by a mere 1.9% in 2013 as compared to a 19.1% growth in 2012, as per the
Ministry of Development Planning and Statistics, and the current account surplus nudged down to 30.9%
of GDP in 2013, compared with 32.1% of GDP in 2012.
A detailed look at the trade activity shows that total exports (including exports of domestic goods and
re-exports) rose by a mere 2.9% in 2013, the equivalent of US$ 3.9 billion, to reach US$ 136.9 billion.
This extends further the slowdown observed in the previous year (+17.9%) following strong double-digit
levels exceeding 50% registered in 2010 and 2011, mainly as Qatar’s expansion phase of the gas sector
reached an end in 2013 and oil production stabilized during the year. The increase in exports is mainly
driven by a 2.5% growth in the “mineral fuels, lubricants and related materials” segment, with the latter
reaching US$ 120.0 billion and accounting for 87.7% of the total. In its turn, the growth in the “mineral
fuels, lubricants and related materials” segment is mainly triggered by a 5.9% increase in the “gas, natural
and manufactured” sub-segment, with the latter reaching US$ 87.5 billion. As to the non-mineral fuels
representing 12.3% of total exports, the “chemicals and related products” segment, which accounts for
7.8% of total exports, increased by 11.4% in 2013 to reach US$ 10.7 billion.
The breakdown of Qatari exports by region in 2013 indicates that Asia got the largest share in exports with
US$ 108.7 billion, or 79.4% of the total, noting that exports to this region were dominated by liquefied
natural gas, crude oil, condensates, propane and butane, polyethylene, naphtha, aluminum alloys, urea,
unwrought aluminum (not alloyed), vinyl chloride (chloroethylene), methanol (methyl alcohol), and
other derivatives, as per the Ministry of Development Planning and Statistics. Asia was followed by the
European Union with US$ 13.6 billion (9.9%), then GCC with US$ 8.9 billion (6.5%). Aggregate exports to
these countries accounted for circa 96% of total exports.
Imports went up by 7.2% in 2013 to US$ 27.0 billion, mainly driven by a 12.5% expansion in the ‘machinery
and transport equipment” segment to US$ 12.6 billion (accounting for 46.7% of the total), a 14.3% growth
9July 09, 2014
ECONOMICS
QATAR
JULY 09, 2014
in the “chemicals and related products” segment to US$ 2.2 billion, a 9.5% rise in the “miscellaneous
manufactured articles” segment to US$ 3.2 billion, and a 1.0% increase in the “food and live animals”
segment to US$ 2.3 billion.
The breakdown of Qatar’s imports by region reveals that Asia was the region with the greater part of
exports to Qatar with US$ 9.1 billion, or 33.7% of the total. It was followed by the European Union with
US$ 7.4 billion (27.2%) and the GCC with US$ 4.0 billion (14.8%). Aggregate imports from these countries
accounted for circa 76% of total imports in 2013.
The trade balance reached a surplus of US$ 109.8 billion in 2013, up by a tiny 1.9% relative to the previous
year, noting that the foreign merchandise trade balance with Asia accounted for circa 90.7% of the
2013 trade surplus. The rise in total exports, which fell short of that of total imports, led to declines in
the exports-to-imports coverage ratio and in the trade balance to GDP ratio from 527.0% and 56.0%
respectively in 2012 to 506.2% and 54.2% respectively in 2013.
On the other sides of the external sector, Qatar posted net deficits in its balances on services, incomes
and transfers in 2013, amounting to US$ 16.3 billion (+16.6%), US$ 11.3 billion (-6.6%) and US$ 15.3 billion
(+8.4%), respectively. With regards to services, large transportation payments related to LNG exports
offset significantly the State’s travel receipts most of which are collected through its position as a transit
hub between the West and Asia. In the incomes category, profit repatriation of foreign companies in Qatar
remains the largest contributor to the negative balance. As to the transfers category, it is dominated by
outward remittances of expatriates residing in Qatar which amounted to US$ 11.1 billion in 2013, up by
8.3% from the previous year.
Under these circumstances, Qatar exhibited a large current account surplus of 30.9% of GDP in 2013,
though slightly lower than 2012’s level (32.1% of GDP), on robust hydrocarbon prices and rising exports
of oil, gas and petrochemicals, as LNG prices in Qatar’s main export markets in Asia have so far remained
largely unaffected by the rapid growth in the U.S. unconventional gas and oil production. As to the
capital and financial balances, both recorded deficits of US$ 4.8 billion and US$ 49.7 billion respectively
in 2013, with the latter recording an expansion of 29.8% relative to the previous year. This was mainly
due to two factors. First, the direct investment category reported a negative balance of US$ 8.9 billion
in 2013, against a negative balance of US$ 1.5 billion in 2012. Second, the portfolio investment category
moved from a positive balance of US$ 2.8 billion in 2012 to a negative balance of US$ 14.3 billion in 2013.
Consequently, the balance of payments recorded a cumulative surplus of US$ 9.1 billion in 2013, against
a higher surplus of US$ 16.1 billion a year earlier.
While large external surpluses have rendered the economy resilient to potential external shocks, Qatar’s
external accounts could be threatened by a slow global growth that could undermine hydrocarbon
prices and demand for Qatar’s hydrocarbon exports, in turn reducing fiscal and external surpluses. Also,
a temporary blockage of the Strait of Hormuz would also adversely affect hydrocarbon exports, as per
the IMF.
Sources: Central Bank of Qatar, Bank Audi’s Group Research DepartmentSources: Ministry of Development Planning and Statistics, IMF, Bank Audi’s Group Research Department
CURRENT ACCOUNT AND BALANCE OF PAYMENTS FOREIGN SECTOR INDICATORS
10July 09, 2014
ECONOMICS
QATAR
JULY 09, 2014
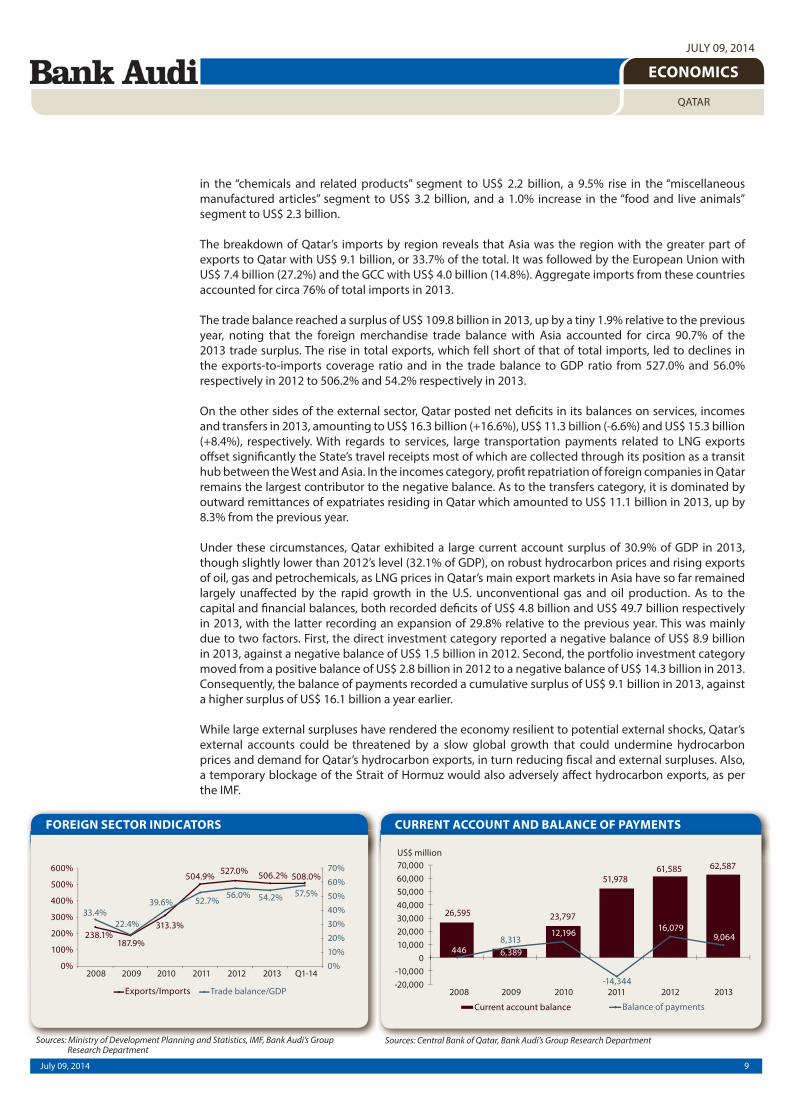
1.3. PUBLIC SECTOR
Slower yet comfortable growth in fiscal surplus
The fiscal balance has remained in comfortable territories with revenues growing at a pace almost double
that of expenditures. However, the fiscal surplus has grown at a slower pace than the previous two years,
reflecting flat production of oil and LNG. According to IMF data, the surplus has grown by 23.5% in the FY
2013/2014 to reach US$ 22.8 billion, following a higher rise of 63.1% in FY 2012/2013.
In details, following a much higher rise of 27.7% in FY 2012/2013, revenues were up by 9.0% to US$ 85.2
billion in FY 2013/2014. Revenues stemming from hydrocarbons accounted for 59.3% of the total (at US$
50.5 billion) compared to a slightly higher share of 62.3% in FY 2012/2013. In parallel, non-hydrocarbon
revenues accounted for 40.7% of FY 2013/2014 total revenues, at US$ 34.6 billion. A closer look at IMF
data shows that the dollar value of hydrocarbon revenues increased by 3.6% to account for 24.6% of
the country’s GDP in FY 2013/2014, following a higher rise of 14.4% in FY 2012/2013 during which they
accounted for 24.1% of GDP. Lower growth rate was also registered by other types of revenues, including
investment income from public enterprises, corporate tax revenues, and other non-tax revenues. In fact,
the growth level of the above mentioned revenues decelerated from a level of 58.7% in FY 2012/2013 to a
much lower one of 18.0% in FY 2013/2014. Growing at a comfortable pace, the share of non-hydrocarbon
revenues to the country’s GDP has progressed from 15.0% in FY 2012/2013 to 16.9% in FY 2013/2014
within the context of greater diversification efforts. However, it is worth noting that this growth was
mainly driven by income from public enterprises at large.
Expenditures totaled US$ 62.3 billion in FY 2013/2014, up by 4.5% from the previous FY during which
they had risen by 19.7%. Around 73% of the total was allocated to current expenditures compared with
76% in FY 2012/2013. The dollar value of the current expenditures remained almost constant whereas
that of capital expenditures progressed at a rate of circa 19%. In fact, the share of the latter out of the FY
2013/2014 GDP accounted for 8.2%, up from 7.3% in the previous fiscal year. This mirrors the large public
investment program meant to prepare for the FIFA 2022 Championship and support to the economic
diversification program as guided by the Qatar National Vision 2030 and National Development Strategy
for the years 2011–2016.
The underlying non-hydrocarbon fiscal balance as a share of non-hydrocarbon GDP has been improving,
from -30.6% of non-hydrocarbon GDP in FY 2012/2013 to around -28.9% of non-hydrocarbon GDP in
FY 2013/14. Gross government debt as of March 2014 is estimated at 34.2% of GDP, with the authorities
issuing T-bills and T-bonds for financial market development and liquidity management purposes. Net
debt remains, however, negative considering the Qatar Investment Authority’s (QIA) large assets.
The fiscal balance has emerged at the end of FY 2013/2014, at around 11% of GDP, much higher than
the 1% planned by the government. This is mainly due to spending growing at 4.5% down from a
planned growth of 18%. Moreover, oil price averaged US$ 103/barrel in FY 2013/2014 compared to a
very conservative assumption of US$ 65/barrel. The latter is an approach used across the GCC to cover
royal stipends and military expenditures. It is worth noting in this regard that the effective State-level
breakeven oil price was at circa US$ 50/barrel for the year 2013, according to IMF estimates.
Sources: IMF, Bank Audi’s Group Research Department Sources: IMF, Bank Audi’s Group Research Department
SELECTED PUBLIC FINANCE INDICATORS PUBLIC INDEBTEDNESS AND DEBT RATIO
11July 09, 2014
ECONOMICS
QATAR
JULY 09, 2014
Looking forward, the authorities are committed to fiscal efficiency and saving fiscal surpluses to strengthen
buffers against shocks and save for future generations. This is reflected in their stated long-term objective
to fully finance the budget from non-hydrocarbon revenues.
1.4. FINANCIAL SECTOR
1.4.1. Monetary Situation
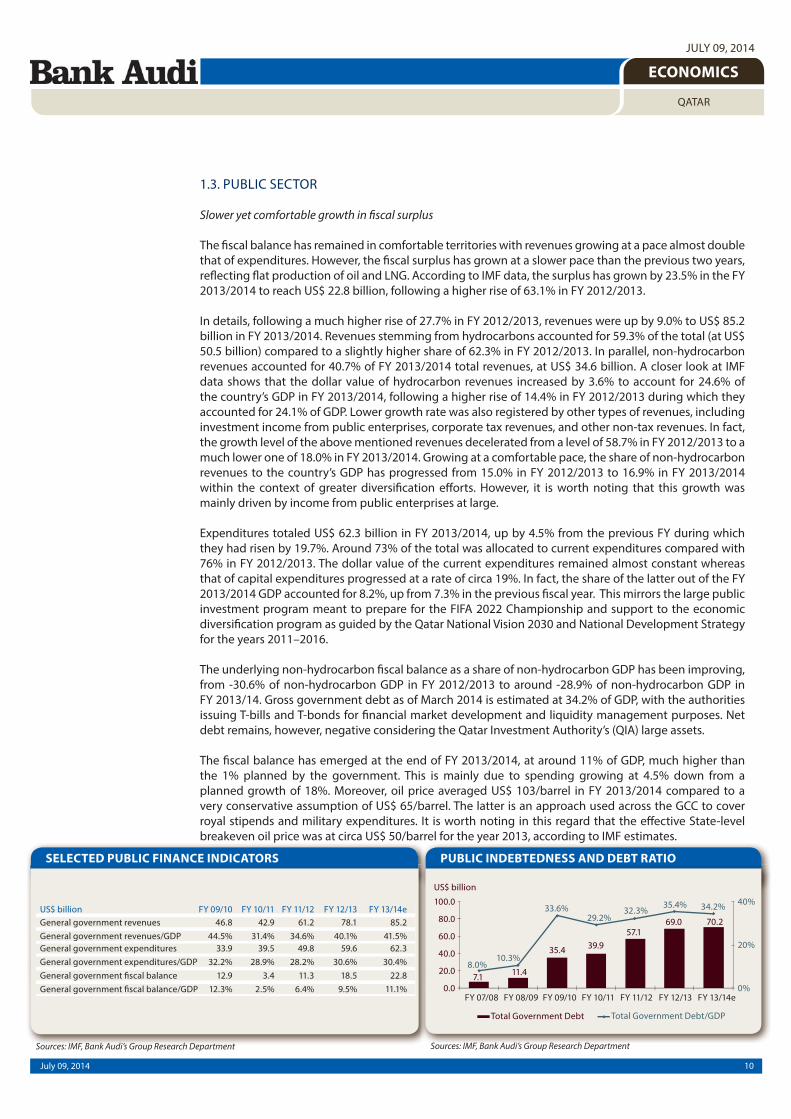
Relatively subdued price pressures coupled with a small decline in reserves
The first few months of 2014 were marked by relatively subdued price pressures in Qatar, a small decline
in international reserves, sustained low policy rates in the context of an accommodative monetary policy
and a moderate expansion in monetary aggregates.
Qatar’s Consumer Price Index grew by 2.8% on average during the first five months of 2014, after rising by
3.1% in 2013, mainly driven by steady increases in rental costs given a strong inflow of expatriate workers
in the context of diminishing housing market slack. According to the IMF, inflation is projected to stay
benign at 3% to 4% going forward—a modest increase from recent years driven by accelerating capital
expenditures. The anticipated gradual decline in global commodity prices, including food, should reduce
price pressures from strong economic activity in the context of the exchange rate peg.
The breakdown of the Consumer Price Index by segment showed during the first five months of 2014
that the rentals, fuel and energy segment rose by 5.9%, noting that rents and related components
constitute over 30% of the CPI basket. This was followed by the furniture, textiles and home appliances
segment with +4.5%, the garments and footwear segment with +3.1%, the entertainment, recreation
and culture segment with +2.8%, the transport & communication segment with +1.8%, the medical care
& medical services segment with +1.1%, the food, beverages & tobacco segment with +1.0%, while the
miscellaneous goods and services segment reported a decline of -2.5%. It is worth noting that the Qatari
authorities are finalizing the household income and expenditure survey 2012-13, which will be used to
update weights estimates for constructing the CPI.
With inflation expected at 3.6% in 2014, as per the IMF, the Qatar Central Bank didn’t cut its policy
lending and deposit rates so far this year, extending the trend that was prevailing over the past three
years. Accordingly, the overnight lending rate stands currently at 4.50%, the repo rate at 4.50%, and the
overnight deposit rate at 0.75%.
On the other hand, Qatar Central Bank’s net international reserves reversed during the first four months of
2014 the upward trend that was prevailing over the past couple of years, registering a 2.8% decline since
end-2013, the equivalent of US$ 1.2 billion, to reach US$ 40.5 billion at end-April 2014, driven by a 21.3%
fall in balances with foreign banks. The QCB net international reserves covered around 44.3% of money
supply in local currency at end-April 2014 as compared to 48.3% at end-2013.
EVOLUTION OF MONETARY SITUATION
Sources: Central Bank of Qatar, Bank Audi’s Group Research Department
EXCHANGE MARKET INDICATORS
Sources: Central Bank of Qatar, Bank Audi’s Group Research Department
12July 09, 2014
ECONOMICS
QATAR
JULY 09, 2014
The broader Money Supply (M2) expanded by 5.1% during the first four months of 2014 to reach US$
131.6 billion at end-April 2014, after expanding by 19.6% in 2013. The US$ 6.4 billion variation in money
supply during the first four months of 2014 compares to a money creation of US$ 2.2 billion, resulting
mostly from a surge in net foreign assets of US$ 4.7 billion, a rise of US$ 2.2 billion in claims on the
private sector and a drop of US$ 4.7 billion in net claims on the public sector. The difference between
the expansion in money supply on the one hand and money creation on the other hand, suggests a
monetization of financial claims of US$ 4.1 billion during the first four months of 2014.
The Qatari Riyal continues to be pegged to the US Dollar at a rate of QR 3.64/US$ 1 since July 2002.
The peg to the US Dollar has anchored prices of tradables and provided stability to income flows and
financial wealth given the dominance of US Dollar-denominated hydrocarbon exports. This outweighs
the constraints that a peg imposes on monetary policy.
Looking forward, Qatari authorities should smooth capital spending, according to the IMF, if signs of
overheating emerge, and deploy liquidity withdrawal operations and further macroprudential measures
in case of excessive credit growth or risk-taking. This strategy can be supplemented by the authorities’
efforts to identify and remove bottlenecks in the supply chain. Also, a comprehensive public investment
management framework would increase the efficiency of public spending and reduce the risk of
overinvestment, as per the Fund.
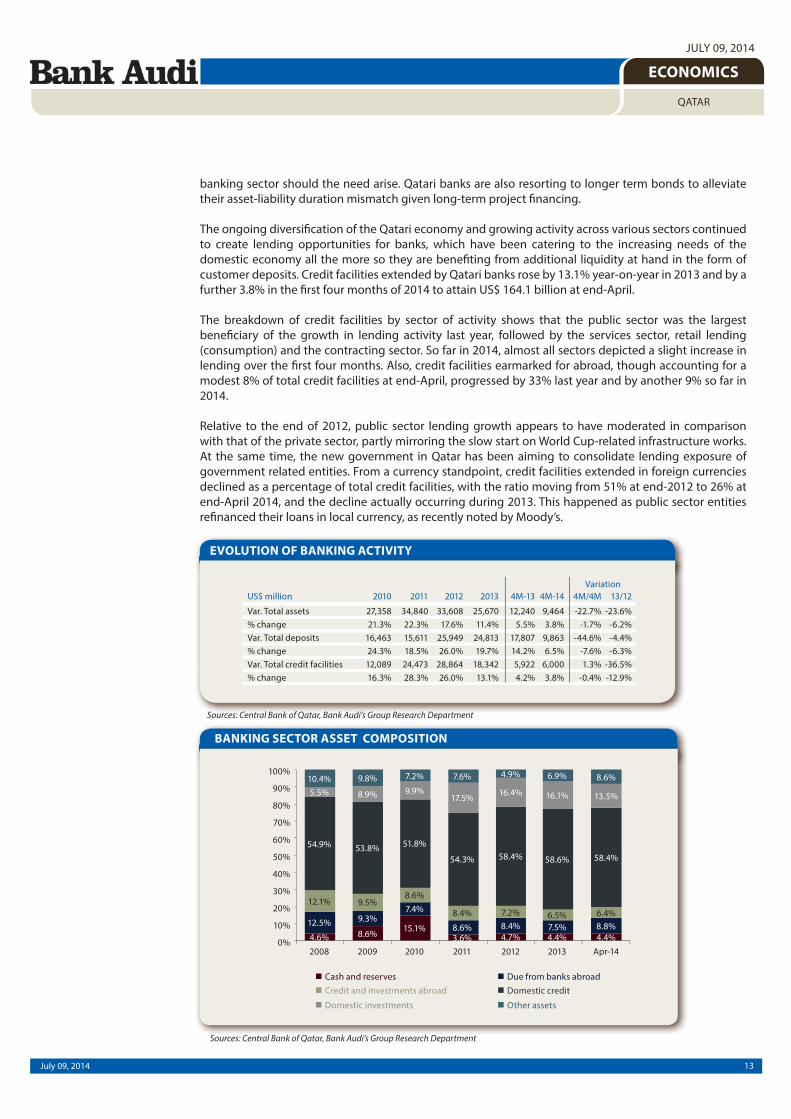
1.4.2. Banking Activity
Macro fundamentals driving solid deposit and lending growth in an expanding domestic economy
Qatar’s banking sector witnessed a period of strong activity growth during 2013 and the first four months
of 2014, favored by solid macro fundamentals in a continuously growing economy translating into
healthy private and public sector deposits inflows feeding into additional financing on behalf of banks
themselves. According to the latest statistics published by the Central Bank, total sector activity grew by
11.4% in 2013 and by a further 3.8% in the first four months of 2014 to reach the equivalent of US$ 259.5
billion at end-April.
Total deposits at banks in Qatar continued to be a major activity driver and accounted for the bulk of
banks’ funding at 62% of total balance sheets at end-April 2014. Total deposits progressed by a solid
19.7% during the year 2013 and by an additional 6.5% in this year’s first four months to reach US$ 160.5
billion at end-April. The breakdown of banks’ deposits reveals that resident private and public sector
deposits both contributed to the surge in funding over the covered periods.
During the year 2013, both the resident private and public sectors almost equally drove total sector
deposits higher while so far this year, private sector deposit growth exceeded that of the public sector.
This occurred within the context of developing sectors of activity in the domestic economy feeding into
higher income for resident individuals and companies and which are parked at banks. Private sector
deposits now account for slightly more than half of the total deposit base. At the same time, non-resident
deposits, accounting for a mere 5.5% of total deposits at banks, somewhat contracted both last year and
so far in 2014, within the context of lower interest rates on time and saving deposits in the country over
the same periods.
While the fact that the public sector remains a major depositor at Qatari banks (more than 40% of the
total deposit base) sheds light on some deposit concentration in the sector, those deposits stemming
from the financially solid government and its related entities have proven to be quite sticky and tend to
be rolled over at maturity, providing liquidity buffers for banks and supporting their funding base.
In parallel, the banks’ reliance on short-term foreign borrowing (in the form of foreign interbank loans
and debt securities) declined from around a quarter of total funding at end-2012 to just over a fifth of the
funding base at end-April 2014, though it remains relatively high. This means that banks could potentially
be vulnerable to swings in investor sentiment abroad and somehow raises refinancing risks. At the same
time, one must bear in mind that these risks are mitigated by the solid liquidity position of banks and
by the fact that government offshore assets are more than ample and could be channeled back into the
13July 09, 2014
ECONOMICS
QATAR
JULY 09, 2014
banking sector should the need arise. Qatari banks are also resorting to longer term bonds to alleviate
their asset-liability duration mismatch given long-term project financing.
The ongoing diversification of the Qatari economy and growing activity across various sectors continued
to create lending opportunities for banks, which have been catering to the increasing needs of the
domestic economy all the more so they are benefiting from additional liquidity at hand in the form of
customer deposits. Credit facilities extended by Qatari banks rose by 13.1% year-on-year in 2013 and by a
further 3.8% in the first four months of 2014 to attain US$ 164.1 billion at end-April.
The breakdown of credit facilities by sector of activity shows that the public sector was the largest
beneficiary of the growth in lending activity last year, followed by the services sector, retail lending
(consumption) and the contracting sector. So far in 2014, almost all sectors depicted a slight increase in
lending over the first four months. Also, credit facilities earmarked for abroad, though accounting for a
modest 8% of total credit facilities at end-April, progressed by 33% last year and by another 9% so far in
2014.
Relative to the end of 2012, public sector lending growth appears to have moderated in comparison
with that of the private sector, partly mirroring the slow start on World Cup-related infrastructure works.
At the same time, the new government in Qatar has been aiming to consolidate lending exposure of
government related entities. From a currency standpoint, credit facilities extended in foreign currencies
declined as a percentage of total credit facilities, with the ratio moving from 51% at end-2012 to 26% at
end-April 2014, and the decline actually occurring during 2013. This happened as public sector entities
refinanced their loans in local currency, as recently noted by Moody’s.
EVOLUTION OF BANKING ACTIVITY
Sources: Central Bank of Qatar, Bank Audi’s Group Research Department
BANKING SECTOR ASSET COMPOSITION
Sources: Central Bank of Qatar, Bank Audi’s Group Research Department
14July 09, 2014
ECONOMICS
QATAR
JULY 09, 2014
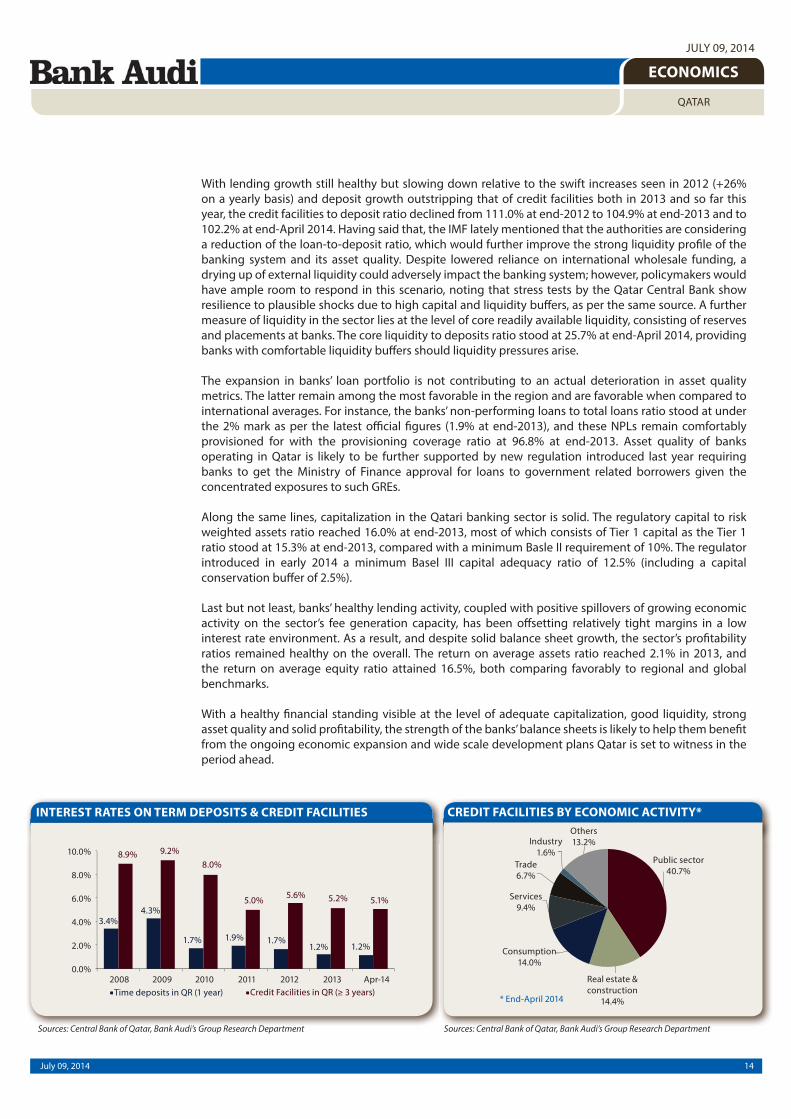
With lending growth still healthy but slowing down relative to the swift increases seen in 2012 (+26%
on a yearly basis) and deposit growth outstripping that of credit facilities both in 2013 and so far this
year, the credit facilities to deposit ratio declined from 111.0% at end-2012 to 104.9% at end-2013 and to
102.2% at end-April 2014. Having said that, the IMF lately mentioned that the authorities are considering
a reduction of the loan-to-deposit ratio, which would further improve the strong liquidity profile of the
banking system and its asset quality. Despite lowered reliance on international wholesale funding, a
drying up of external liquidity could adversely impact the banking system; however, policymakers would
have ample room to respond in this scenario, noting that stress tests by the Qatar Central Bank show
resilience to plausible shocks due to high capital and liquidity buffers, as per the same source. A further
measure of liquidity in the sector lies at the level of core readily available liquidity, consisting of reserves
and placements at banks. The core liquidity to deposits ratio stood at 25.7% at end-April 2014, providing
banks with comfortable liquidity buffers should liquidity pressures arise.
The expansion in banks’ loan portfolio is not contributing to an actual deterioration in asset quality
metrics. The latter remain among the most favorable in the region and are favorable when compared to
international averages. For instance, the banks’ non-performing loans to total loans ratio stood at under
the 2% mark as per the latest official figures (1.9% at end-2013), and these NPLs remain comfortably
provisioned for with the provisioning coverage ratio at 96.8% at end-2013. Asset quality of banks
operating in Qatar is likely to be further supported by new regulation introduced last year requiring
banks to get the Ministry of Finance approval for loans to government related borrowers given the
concentrated exposures to such GREs.
Along the same lines, capitalization in the Qatari banking sector is solid. The regulatory capital to risk
weighted assets ratio reached 16.0% at end-2013, most of which consists of Tier 1 capital as the Tier 1
ratio stood at 15.3% at end-2013, compared with a minimum Basle II requirement of 10%. The regulator
introduced in early 2014 a minimum Basel III capital adequacy ratio of 12.5% (including a capital
conservation buffer of 2.5%).
Last but not least, banks’ healthy lending activity, coupled with positive spillovers of growing economic
activity on the sector’s fee generation capacity, has been offsetting relatively tight margins in a low
interest rate environment. As a result, and despite solid balance sheet growth, the sector’s profitability
ratios remained healthy on the overall. The return on average assets ratio reached 2.1% in 2013, and
the return on average equity ratio attained 16.5%, both comparing favorably to regional and global
benchmarks.
With a healthy financial standing visible at the level of adequate capitalization, good liquidity, strong
asset quality and solid profitability, the strength of the banks’ balance sheets is likely to help them benefit
from the ongoing economic expansion and wide scale development plans Qatar is set to witness in the
period ahead.
INTEREST RATES ON TERM DEPOSITS & CREDIT FACILITIES
Sources: Central Bank of Qatar, Bank Audi’s Group Research Department
CREDIT FACILITIES BY ECONOMIC ACTIVITY*
Sources: Central Bank of Qatar, Bank Audi’s Group Research Department
15July 09, 2014
ECONOMICS
QATAR
JULY 09, 2014
1.4.3. Equity and Bond Markets
Price rises across Qatari capital markets
Qatar’s capital markets registered significant price increases over the first half of 2014. The equity market
managed to end the first half of the year on a positive note despite sharp price falls observed during the
month of June on lingering concerns about the Iraqi unrest. This was mainly supported by strong price
rallies recorded before MSCI upgraded Qatar to emerging market status, a move that promises to attract a
flow of medium-term and long-term foreign investments. In parallel, the Qatari fixed income market saw
mostly upward price movements across the board during the first half of 2014, amidst ample liquidity at
hand and tracking US Treasuries, while the country’s five-year CDS spread saw further contractions so far
this year.
In details, the Qatar Exchange general index surged by 31.9% during the first five months of 2014 to
close at 13,694.19 at end-May 2014, ahead of the official reclassification of Qatar by global markets index
compiler MSCI from “Frontier Market” to “Emerging Market” on June 2, 2014. Ten Qatari stocks were added
to the MSCI emerging markets index that manages assets worth about US$ 3.3 trillion, noting that Qatar’s
weight in the said index is quoted at 0.47%. Of the 10 stocks included in the MSCI EM index, 50% of
them were from the banking sector, namely Qatar National Bank, Masraf Al Rayan, Commercial Bank of
Qatar, Qatar Islamic Bank, Doha Bank, in addition to Ooredoo, Qatar Industries, Barwa Real Estate, Qatar
Electricity & Water, and Vodafone Qatar. The aforementioned stocks attracted strong foreign institutional
demand after MSCI announced their inclusion in its EM index mid-May 2014, registering strong price
rallies over the first five months of 2014.
Yet, the Qatar Exchange came under downward price pressures during the month of June 2014 on
concerns over the latest security developments in Iraq in addition to worries that the country may lose
its right to host the 2022 soccer World Cup amidst corruption accusations. Within this context, the Qatar
Exchange general index reversed the upward trend observed since the beginning of the year 2014, sliding
by circa 16.1% to reach 11,488.87 at end-June 2014, thus bringing the year-to-date increase to 10.7%.
As to market pricing ratios, the Qatar Exchange traded at end-June 2014 at a P/E of 15.0x as compared to
17.2x at end-May 2014 and 14.6x at end-2013. Also, it traded at a P/BV of 2.05x against 2.36x at end-May
2014 and 1.97x at end-2013. In addition, the Qatar Exchange registered at end-June 2014 a dividend yield
of 3.96%, almost equivalent to the end-2013 level of 3.92%.
The market capitalization rose by 13.8% during the first half of 2014, moving up from US$ 152.6 billion
at end-2013 to US$ 173.7 billion at end-June 2014. This came within the context of price increases and a
small rise in the number of listed companies from 42 companies at end-2013 to 43 companies at present.
The market capitalization as a percentage of GDP moved consequently up from 75.4% in 2013 to 83.4%
at end-June 2014.
The total trading value amounted to US$ 25.0 billion during the first five months of 2014, surging by a
staggering 242.5% relative to the corresponding period of the previous year, mainly driven by a buoyant
activity in April and May 2014 ahead of the MSCI official reclassification of Qatar to “Emerging Market
status”. On the backdrop of a rise in the market capitalization and a staggering increase in total trading
value, the annualized turnover ratio reached 29.6% during the first five months of 2014, up from 12.5%
during the corresponding period of 2013.
At the level of the fixed income market, sovereign papers, high grade names and papers issued by financial
institutions saw mostly upward price movements across the board during the first half-year, following
sharp drops registered during the second half of 2013 given US tapering concerns. Price increases during
the first half of 2014 tracked rises in US Treasuries, as unrest in Ukraine, geopolitical risks in Iraq, and the
US Federal Reserve’s reiteration that it expects to keep interest rates near zero for a “considerable time”
to support the US economy, spurred demand for safety. Also, Qatari investors showed a strong appetite
amidst ample liquidity at hand, especially with the redemption of a US$ 2 billion bond in April 2014, and
in the absence of new debt issuances.
16July 09, 2014
ECONOMICS
QATAR
JULY 09, 2014
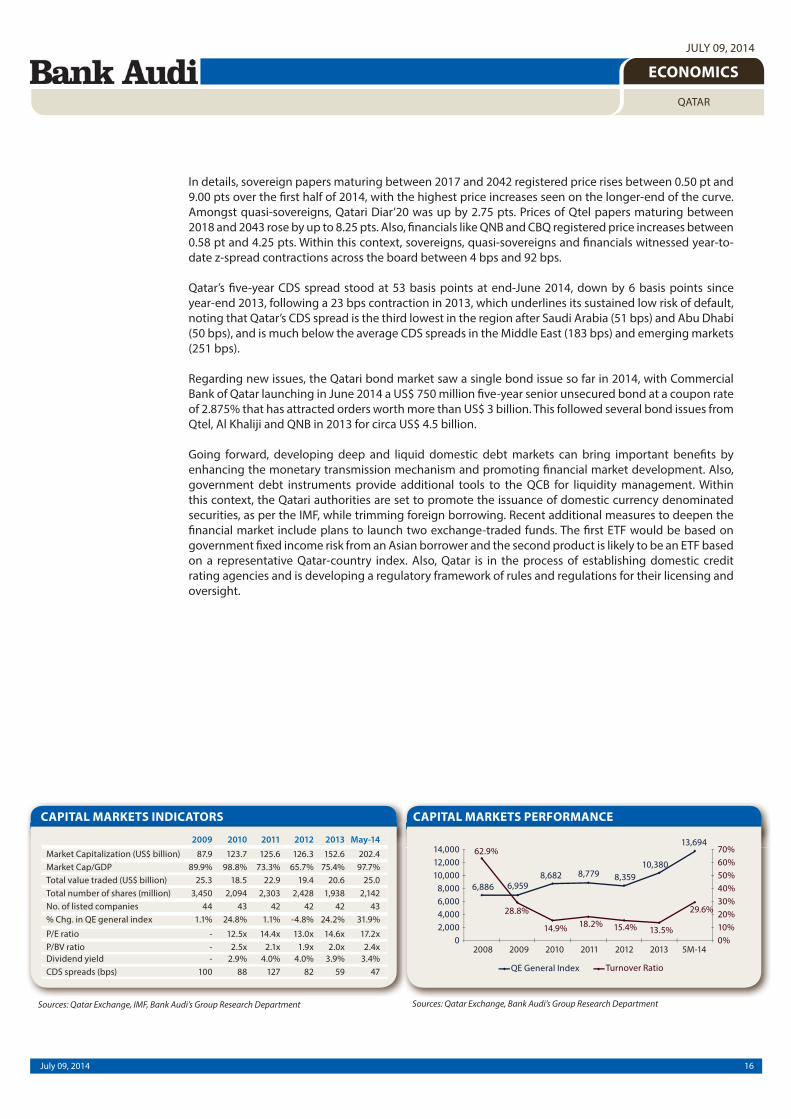
In details, sovereign papers maturing between 2017 and 2042 registered price rises between 0.50 pt and
9.00 pts over the first half of 2014, with the highest price increases seen on the longer-end of the curve.
Amongst quasi-sovereigns, Qatari Diar’20 was up by 2.75 pts. Prices of Qtel papers maturing between
2018 and 2043 rose by up to 8.25 pts. Also, financials like QNB and CBQ registered price increases between
0.58 pt and 4.25 pts. Within this context, sovereigns, quasi-sovereigns and financials witnessed year-to-
date z-spread contractions across the board between 4 bps and 92 bps.
Qatar’s five-year CDS spread stood at 53 basis points at end-June 2014, down by 6 basis points since
year-end 2013, following a 23 bps contraction in 2013, which underlines its sustained low risk of default,
noting that Qatar’s CDS spread is the third lowest in the region after Saudi Arabia (51 bps) and Abu Dhabi
(50 bps), and is much below the average CDS spreads in the Middle East (183 bps) and emerging markets
(251 bps).
Regarding new issues, the Qatari bond market saw a single bond issue so far in 2014, with Commercial
Bank of Qatar launching in June 2014 a US$ 750 million five-year senior unsecured bond at a coupon rate
of 2.875% that has attracted orders worth more than US$ 3 billion. This followed several bond issues from
Qtel, Al Khaliji and QNB in 2013 for circa US$ 4.5 billion.
Going forward, developing deep and liquid domestic debt markets can bring important benefits by
enhancing the monetary transmission mechanism and promoting financial market development. Also,
government debt instruments provide additional tools to the QCB for liquidity management. Within
this context, the Qatari authorities are set to promote the issuance of domestic currency denominated
securities, as per the IMF, while trimming foreign borrowing. Recent additional measures to deepen the
financial market include plans to launch two exchange-traded funds. The first ETF would be based on
government fixed income risk from an Asian borrower and the second product is likely to be an ETF based
on a representative Qatar-country index. Also, Qatar is in the process of establishing domestic credit
rating agencies and is developing a regulatory framework of rules and regulations for their licensing and
oversight.
CAPITAL MARKETS INDICATORS
Sources: Qatar Exchange, IMF, Bank Audi’s Group Research Department
CAPITAL MARKETS PERFORMANCE
Sources: Qatar Exchange, Bank Audi’s Group Research Department
17July 09, 2014
ECONOMICS
QATAR
JULY 09, 2014
2. CONCLUSION
Qatar, the 2nd largest natural gas exporter in the World, is performing exceptionally well. Real GDP growth
is projected at 5.9% in 2014 and 7.1% in 2015 as per IMF forecasts. With gas production targets largely
attained, slower hydrocarbon growth is being compensated by double digit growth in non-hydrocarbon
sector activity. Growth in Qatar’s non-hydrocarbon sector continues to bolster the economy as the country
prepares to host the FIFA World Cup soccer tournament in 2022. Economic policy will focus on diversifying
away from Qatar’s traditional role as a hydrocarbons exporter and on becoming a manufacturing and
financial services hub. The years ahead may witness greater efforts by the government to boost the role
of the private sector in its development plans as a means of exercising fiscal discipline and promoting
private-sector growth.
Monetary policy remains accommodative in the context of the peg to the US$ and interest rate hikes
are not expected before the second half of 2015. The authorities seem committed to maintaining the
current exchange rate regime, on the basis that Qatar’s gas and oil exports are denominated in the US
currency but also that the peg offers stability and reassurance to investors. The inflation rate is forecasted
by the IMF at an annual rate of 3.5% for 2015 and 2016, signaling no significant price pressures at the
horizon. But aggressive lending and underwriting standards and excessive exposure of banks to cyclical
sectors such as real estate and construction might fuel inflationary pressure. Persistently high liquidity will
eventually require the authorities to deploy more flexible open-market operations to manage its knock-
on-effects on inflation.
At the external sector level, the current account surplus is forecasted at 25.4% in 2014 and 20.5% in 2015,
as per IMF forecasts, down from 30.9% in 2013. The surplus as a percentage of GDP is expected to decline
gradually because of rapidly increasing imports bill, driven by rising demand for consumer goods from
a growing population, purchases of capital imports for infrastructure and projects to boost economic
diversification. Large external surpluses are supporting a continued build up in net foreign assets,
although the trend is likely to ease in coming years. Qatar’s strong net external asset position balances
the concentration risk related to the economy’s reliance on the oil and gas sector.
At the fiscal level, Qatar’s fiscal surplus as a proportion of GDP is projected at about 7.6% of GDP in 2014
and 4.8% of GDP in 2015, as per IMF forecasts, down from 11.1% in 2013. The surplus is expected to
decline due to a combination of softer hydrocarbon revenues and rising expenditures. The recently
unveiled 2014/2015 budget is not expansionary as in the past. Spending is targeted to rise just 3.7%,
compared with 22% on average per year since 2010.
The main immediate risks facing Qatar’s outlook involve managing rapid development in an abbreviated
time frame while avoiding demand-supply imbalances and therefore inflationary pressure. Fiscal policy
measures and macroprudential tools take on added importance in this scenario. Qatar also faces risk from
declining hydrocarbon prices as oil and gas supplies from alternative producers are expected to rise over
the next few years. Though Qatar’s macroeconomic fundamentals are considerably strong, in a scenario
where there is sustained drop in the oil price to US$ 80 per barrel and a decline in gas prices of a similar
magnitude, the fiscal balance could turn to a deficit as early as 2017/2018, and the deficit would widen
further over the longer term.
A summary of the main strengths and challenges for the Qatari economy suggest the following: At the
level of strengths, we mention the strong net external creditor position, the vast hydrocarbon reserves,
the low fiscal breakeven oil price and the very high level of wealth. Main challenges for Qatar include
vulnerability to regional geopolitical risk, the possible erosion over time of fiscal flexibility, the rise in
external debt and the relatively weak institutional transparency. But there is no doubt that strengths
exceed weaknesses and opportunities outpace threats at the horizon, generating a sound enticing
outlook for a wealthy economy at large.
18July 09, 2014
ECONOMICS
QATAR
JULY 09, 2014
DISCLAIMER
The content of this publication is provided as general information only and should not be taken as an
advice to invest or engage in any form of financial or commercial activity. Any action that you may take
as a result of information in this publication remains your sole responsibility. None of the materials herein
constitute offers or solicitations to purchase or sell securities, your investment decisions should not
be made based upon the information herein. Although Bank Audi Sal considers the content of this
publication reliable, it shall have no liability for its content and makes no warranty, representation or
guarantee as to its accuracy or completeness.
Bank Audi sal - Group Research Department - Bank Audi Plaza - Bab Idriss - PO Box 11-2560 - Lebanon - Tel: 961 1 994 000 - email: [email protected]