Embed Size (px)
Citation preview
Qantas Airways Limited FY15 Results
20 August 2015
ASX: QAN US OTC: QABSY
2
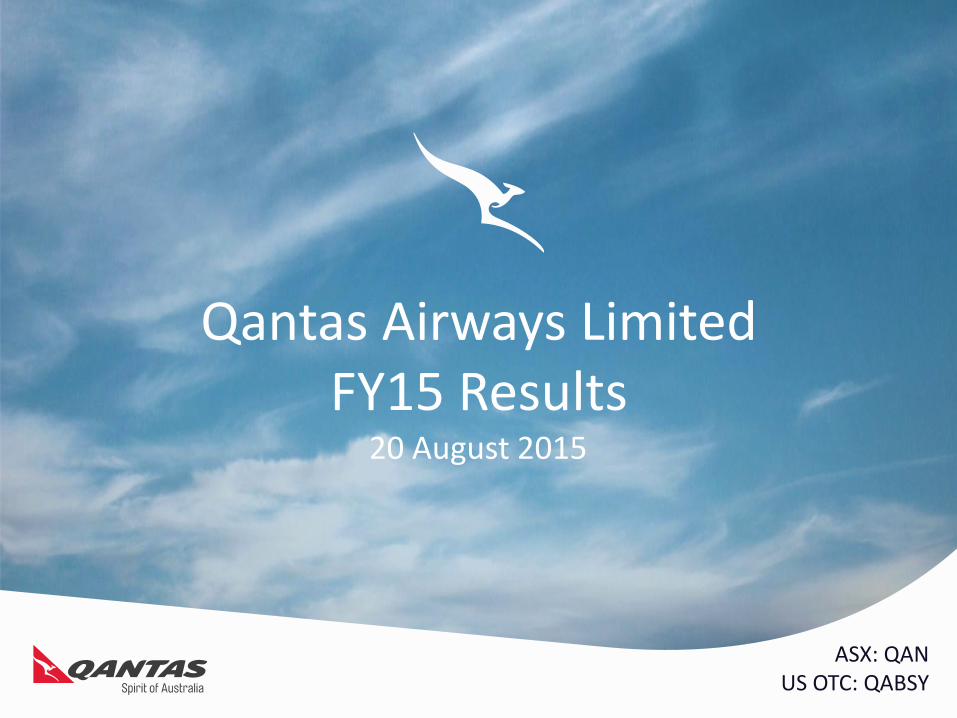
• Delivering on our commitments for $1.6b earnings1 turnaround in FY15
– Qantas Transformation driving permanent shift in cost base and competitive position
– Optimal capital structure restored, >$1b debt reduction completed
– Strengthened superior dual brand position in domestic market
– Record results for Qantas Loyalty, Jetstar Group and Qantas Freight2
– Successful turnaround of Qantas International
– All segments delivering ROIC > WACC3
• Proposal to distribute $505 million surplus capital to shareholders4
• Disciplined investment to enhance long-term shareholder value
– Investing in fuel-efficient B787-9 aircraft for Qantas International after strict reinvestment hurdles met
• Managing external volatility with robust hedging program, capacity and capex flexibility
1. Based on Underlying PBT. 2. Based on Underlying EBIT. Loyalty result compared to prior periods, normalised for changes in accounting estimates of the fair value of points and breakage expectations effective 1 January 2009. Record Freight result since separate segmentation of Freight in FY08. 3. Return on Invested Capital > Weighted average cost of capital (calculated on a pre-tax basis). 4. Subject to shareholder approval.
A Strong Platform For Sustainable Growth
DELIVERING GROUP RETURN ON INVESTED CAPITAL > WACC THROUGH THE CYCLE
3
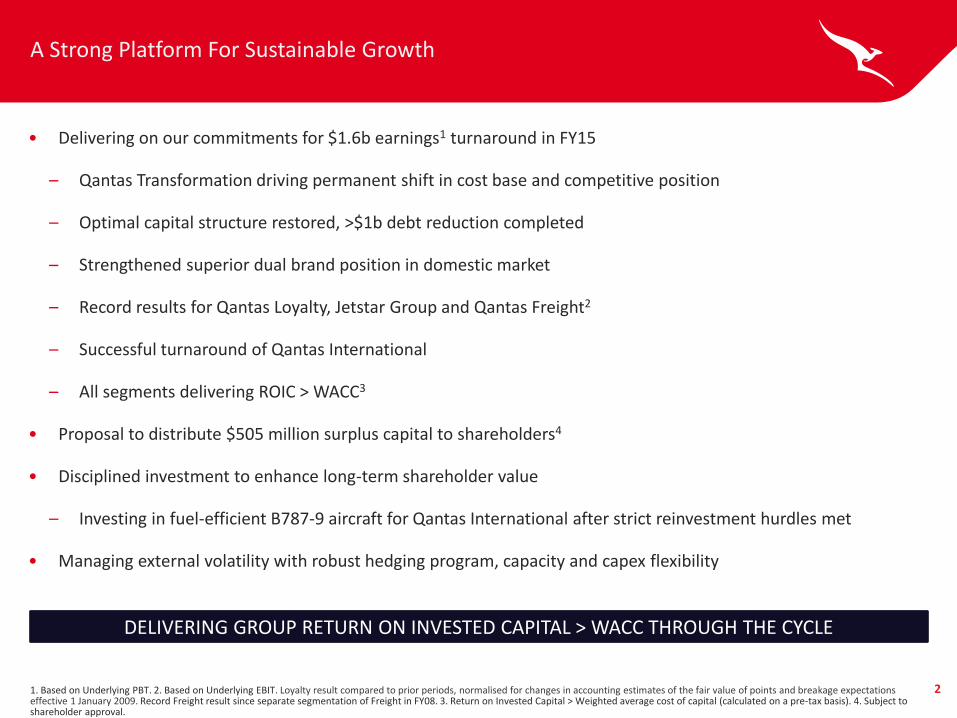
Robust Financial Results Driven by Transformation
1. Underlying Profit Before Tax (PBT) is a non-statutory measure and is the primary reporting measure used by the Qantas Group’s chief operating decision-making bodies (being the Chief Executive Officer, Group Management Committee and the Board of Directors) for the purpose of assessing the performance of the Group. All line items in the FY15 Results Presentation are reported on an Underlying basis. Refer to Supplementary Slide 5 for a reconciliation of Underlying to Statutory PBT. 2. Net free cash flow is operating cash flows less investing cash flows. Net free cash flow is a measure of the amount of operating cash flows that are available (i.e. after investing activities) to fund reductions in net debt or payments to shareholders. 3. Yield is calculated as passenger revenue per RPK. Both current and prior year is calculated using current year exchange rates. 4. Comparable unit cost is calculated as Underlying PBT less passenger revenue and fuel, adjusted for the impact of the Qantas International fleet write-down, changes in discount rates, changes in foreign exchange rates and share of net loss of investments accounted for under the equity method per ASK. Refer to Supplementary Slide 12 for further detail. 5. Variance to last year. Favourable variances are reported in green.
KEY GROUP FINANCIAL METRICS FY15 FY14 VLY%5
Underlying PBT1 ($M) 975 (646) >100
Statutory profit after tax ($M) 560 (2,843) >100
Statutory earnings per share (c) 25.4 (128.5) >100
ROIC (%) 16 (1.5) >100
Revenue ($M) 15,816 15,352 3.0
Transformation benefits realised ($M) 894 204 >100
Operating cash flow ($M) 2,048 1,069 92
Net free cash flow2 ($M) 1,104 - >100
Yield3 (c/RPK) 10.40 10.29 1.1
Comparable unit cost4 (c/ASK) 4.79 5.05 5.1
Available Seat Kilometres (ASK) (M) 142,287 141,715 0.4
Revenue Seat Kilometres (RPK) (M) 112,543 109,659 2.6
4
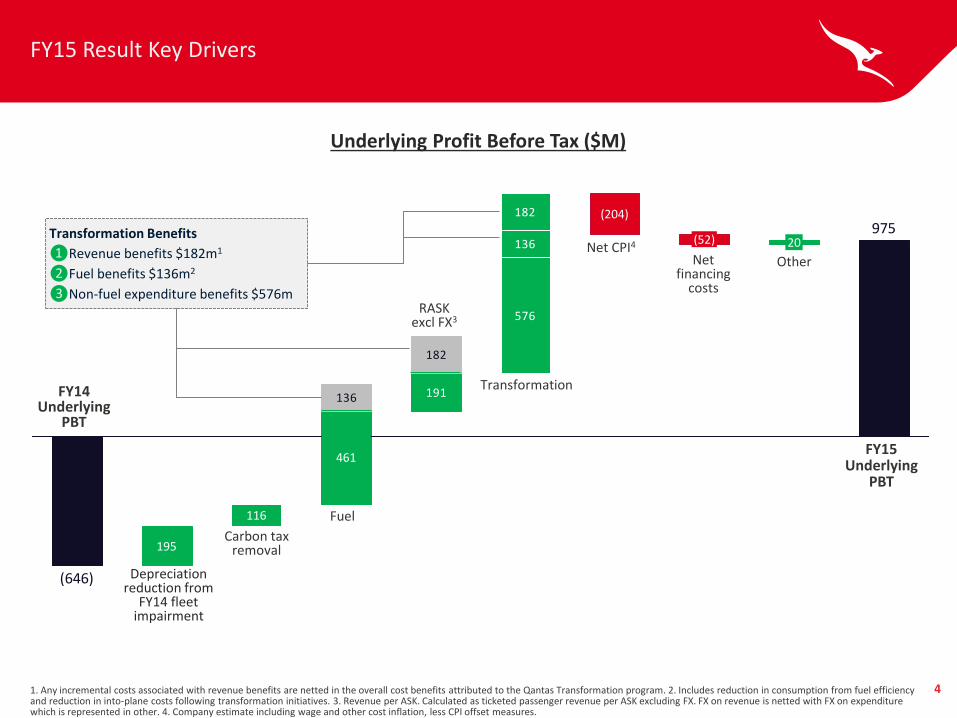
FY15 Result Key Drivers
1. Any incremental costs associated with revenue benefits are netted in the overall cost benefits attributed to the Qantas Transformation program. 2. Includes reduction in consumption from fuel efficiency and reduction in into-plane costs following transformation initiatives. 3. Revenue per ASK. Calculated as ticketed passenger revenue per ASK excluding FX. FX on revenue is netted with FX on expenditure which is represented in other. 4. Company estimate including wage and other cost inflation, less CPI offset measures.
Underlying Profit Before Tax ($M)
975
576
191
(646)
136
182
182
136
20 (52)
(204)
461
195
116
FY14 Underlying
PBT
Carbon tax removal
FY15 Underlying
PBT
Transformation
Fuel
RASK excl FX3
Net CPI4
Net financing
costs
Other
Transformation Benefits
❶Revenue benefits $182m1
❷Fuel benefits $136m2
❸Non-fuel expenditure benefits $576m
Depreciation reduction from
FY14 fleet impairment
5
Returning Surplus Capital To Shareholders
• Having returned to optimal capital structure, surplus capital is proposed to be returned to shareholders
• $505m capital return proposed
– 23c per share capital return combined with share consolidation1
– Equitable method to return cash to all shareholders
– No tax payable should arise to most shareholders on cash receipt2, subject to final ATO Class Ruling to be published after payment of the return of capital
– Pending shareholder approval1, 23c per share cash payment to be made in November 2015
– Combined with a capital return share consolidation provides similar earnings per share outcomes as on market buy-back3
– Shareholder approval for return of capital and share consolidation to be sought at Annual General Meeting in October 2015
1. Both capital return and share consolidation are subject to shareholder approval. 2. Capital return adjusts cost base of shares and defers tax payable to shareholder until they dispose their shares (unless no cost base exists, in which case the cash receipt will be assessable). 3. Assumes equivalent sized buy-back at same fixed price.
FY15 Segment Results
7
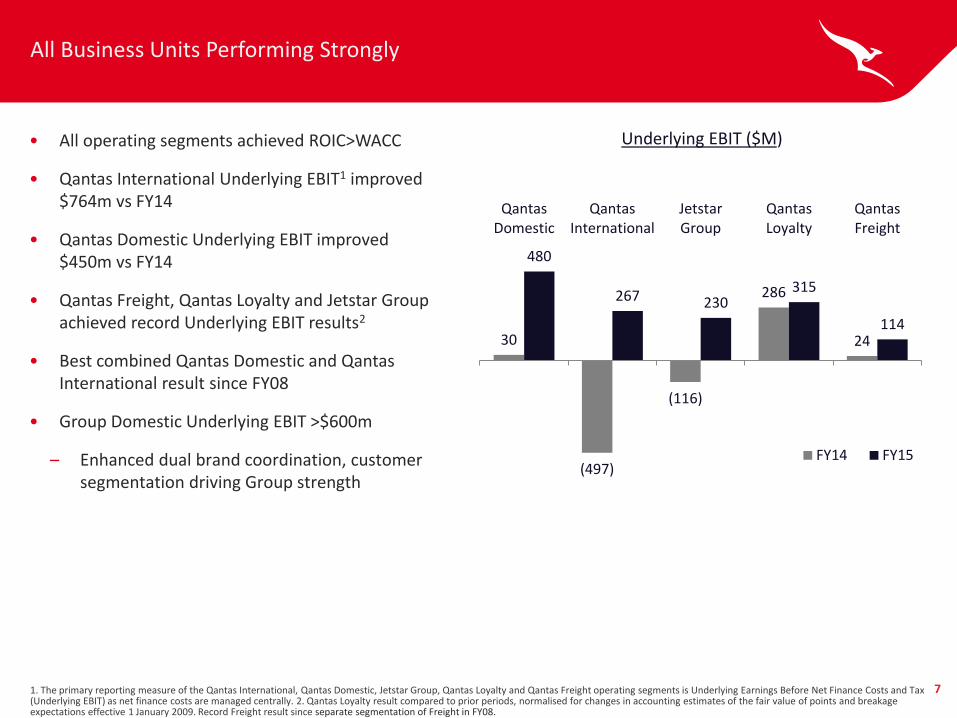
All Business Units Performing Strongly
1. The primary reporting measure of the Qantas International, Qantas Domestic, Jetstar Group, Qantas Loyalty and Qantas Freight operating segments is Underlying Earnings Before Net Finance Costs and Tax (Underlying EBIT) as net finance costs are managed centrally. 2. Qantas Loyalty result compared to prior periods, normalised for changes in accounting estimates of the fair value of points and breakage expectations effective 1 January 2009. Record Freight result since separate segmentation of Freight in FY08.
30
(497)
(116)
286
24
480
267 230 315
114
QantasDomestic
QantasInternational
JetstarGroup
QantasLoyalty
QantasFreight
FY14 FY15
• All operating segments achieved ROIC>WACC
• Qantas International Underlying EBIT1 improved $764m vs FY14
• Qantas Domestic Underlying EBIT improved $450m vs FY14
• Qantas Freight, Qantas Loyalty and Jetstar Group achieved record Underlying EBIT results2
• Best combined Qantas Domestic and Qantas International result since FY08
• Group Domestic Underlying EBIT >$600m
– Enhanced dual brand coordination, customer segmentation driving Group strength
Underlying EBIT ($M)
8
Robust Qantas Domestic Result
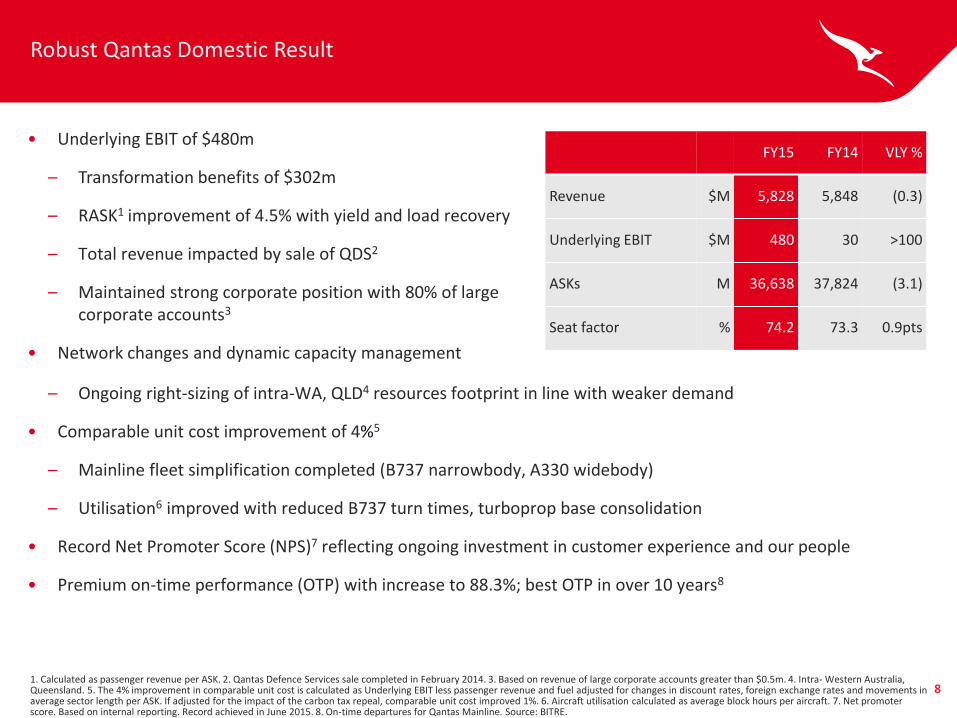
• Underlying EBIT of $480m
– Transformation benefits of $302m
– RASK1 improvement of 4.5% with yield and load recovery
– Total revenue impacted by sale of QDS2
– Maintained strong corporate position with 80% of large corporate accounts3
• Network changes and dynamic capacity management
1. Calculated as passenger revenue per ASK. 2. Qantas Defence Services sale completed in February 2014. 3. Based on revenue of large corporate accounts greater than $0.5m. 4. Intra- Western Australia, Queensland. 5. The 4% improvement in comparable unit cost is calculated as Underlying EBIT less passenger revenue and fuel adjusted for changes in discount rates, foreign exchange rates and movements in average sector length per ASK. If adjusted for the impact of the carbon tax repeal, comparable unit cost improved 1%. 6. Aircraft utilisation calculated as average block hours per aircraft. 7. Net promoter score. Based on internal reporting. Record achieved in June 2015. 8. On-time departures for Qantas Mainline. Source: BITRE.
– Ongoing right-sizing of intra-WA, QLD4 resources footprint in line with weaker demand
• Comparable unit cost improvement of 4%5
– Mainline fleet simplification completed (B737 narrowbody, A330 widebody)
– Utilisation6 improved with reduced B737 turn times, turboprop base consolidation
• Record Net Promoter Score (NPS)7 reflecting ongoing investment in customer experience and our people
• Premium on-time performance (OTP) with increase to 88.3%; best OTP in over 10 years8
FY15 FY14 VLY %
Revenue $M 5,828 5,848 (0.3)
Underlying EBIT $M 480 30 >100
ASKs M 36,638 37,824 (3.1)
Seat factor % 74.2 73.3 0.9pts
9
Qantas Domestic Areas of Focus for FY16
1 Passenger revenue per ASK. Source: BITRE, published company accounts and Qantas’ internal estimates. 2. Sydney-Maroochydore and Melbourne-Coolangatta. 3. Perth. 4. Brisbane. 5. Aircraft utilisation calculated as block hours per aircraft. 6. Unit cost calculated as Underlying EBIT less passenger revenue per ASK. Qantas Domestic unit cost includes QantasLink. Competitor refers to Virgin Australia including mainline domestic and regional operations. Virgin Australia’s assumed domestic unit cost based on company estimates and published competitor data.
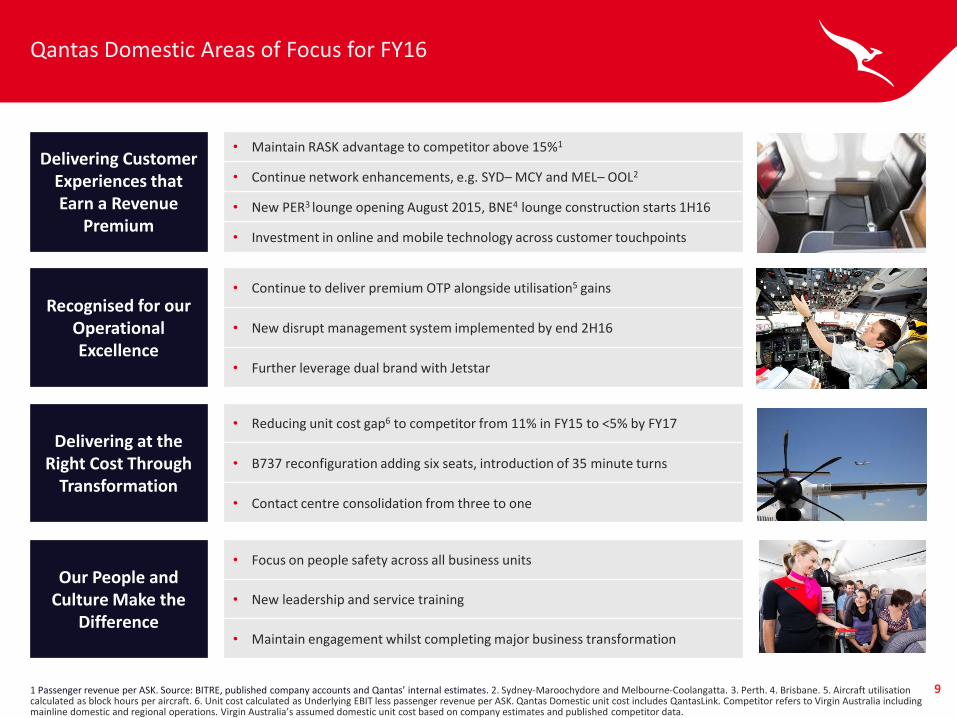
Delivering Customer Experiences that Earn a Revenue
Premium
• Maintain RASK advantage to competitor above 15%1
• Continue network enhancements, e.g. SYD– MCY and MEL– OOL2
• New PER3 lounge opening August 2015, BNE4 lounge construction starts 1H16
• Investment in online and mobile technology across customer touchpoints
Recognised for our Operational Excellence
• Continue to deliver premium OTP alongside utilisation5 gains
• New disrupt management system implemented by end 2H16
• Further leverage dual brand with Jetstar
Delivering at the Right Cost Through
Transformation
• Reducing unit cost gap6 to competitor from 11% in FY15 to <5% by FY17
• B737 reconfiguration adding six seats, introduction of 35 minute turns
• Contact centre consolidation from three to one
Our People and Culture Make the
Difference
• Focus on people safety across all business units
• New leadership and service training
• Maintain engagement whilst completing major business transformation
10
Successful Turnaround of Qantas International
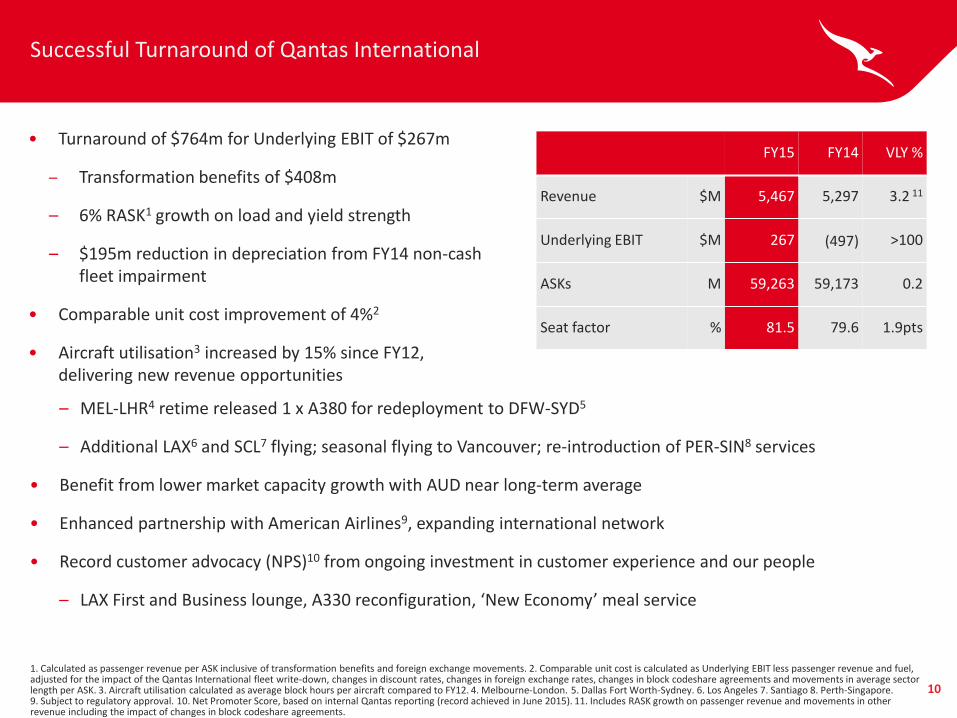
• Turnaround of $764m for Underlying EBIT of $267m
– Transformation benefits of $408m
– 6% RASK1 growth on load and yield strength
– $195m reduction in depreciation from FY14 non-cash fleet impairment
• Comparable unit cost improvement of 4%2
• Aircraft utilisation3 increased by 15% since FY12, delivering new revenue opportunities
1. Calculated as passenger revenue per ASK inclusive of transformation benefits and foreign exchange movements. 2. Comparable unit cost is calculated as Underlying EBIT less passenger revenue and fuel, adjusted for the impact of the Qantas International fleet write-down, changes in discount rates, changes in foreign exchange rates, changes in block codeshare agreements and movements in average sector length per ASK. 3. Aircraft utilisation calculated as average block hours per aircraft compared to FY12. 4. Melbourne-London. 5. Dallas Fort Worth-Sydney. 6. Los Angeles 7. Santiago 8. Perth-Singapore. 9. Subject to regulatory approval. 10. Net Promoter Score, based on internal Qantas reporting (record achieved in June 2015). 11. Includes RASK growth on passenger revenue and movements in other revenue including the impact of changes in block codeshare agreements.
– MEL-LHR4 retime released 1 x A380 for redeployment to DFW-SYD5
– Additional LAX6 and SCL7 flying; seasonal flying to Vancouver; re-introduction of PER-SIN8 services
• Benefit from lower market capacity growth with AUD near long-term average
• Enhanced partnership with American Airlines9, expanding international network
• Record customer advocacy (NPS)10 from ongoing investment in customer experience and our people
– LAX First and Business lounge, A330 reconfiguration, ‘New Economy’ meal service
FY15 FY14 VLY %
Revenue $M 5,467 5,297 3.2 11
Underlying EBIT $M 267 (497) >100
ASKs M 59,263 59,173 0.2
Seat factor % 81.5 79.6 1.9pts
11
Qantas International Areas of Focus for FY16
1. Net Promoter Score, based on internal Qantas reporting. 2. American Airlines partnership, subject to final regulatory approval. 3. San Francisco (subject to regulatory approval). 4. Brisbane-Narita. 5. Sydney-Haneda. 6. Sydney- San Francisco (subject to regulatory approval). 7. Brisbane-Wellington, Brisbane-Christchurch.
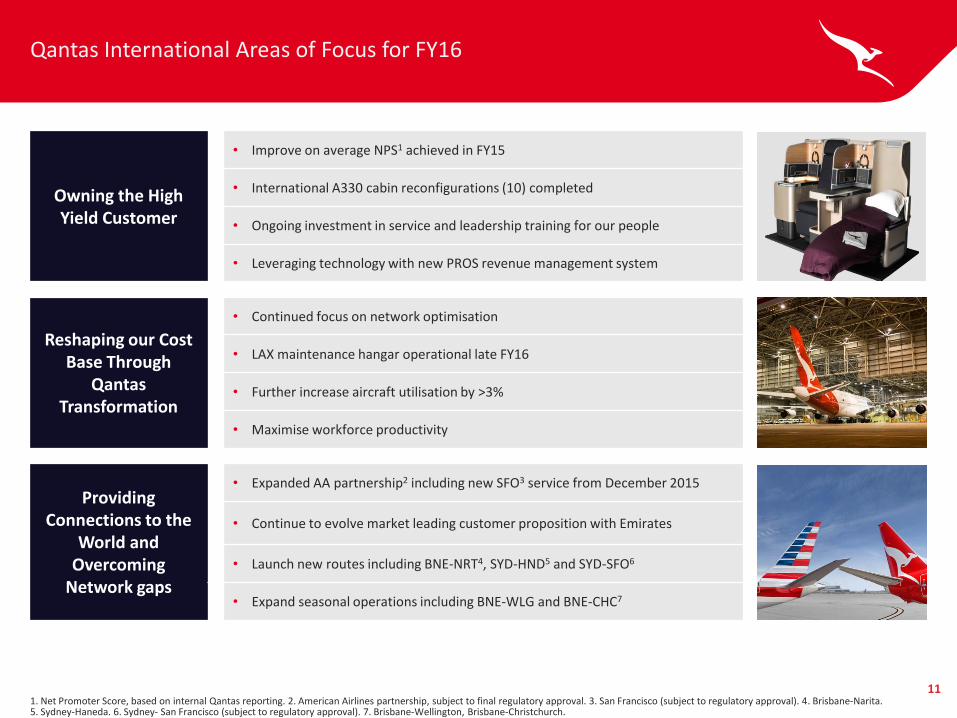
Owning the High Yield Customer
• Improve on average NPS1 achieved in FY15
• International A330 cabin reconfigurations (10) completed
• Ongoing investment in service and leadership training for our people
• Leveraging technology with new PROS revenue management system
Reshaping our Cost Base Through
Qantas Transformation
• Continued focus on network optimisation
• LAX maintenance hangar operational late FY16
• Further increase aircraft utilisation by >3%
• Maximise workforce productivity
Providing Connections to the
World and Overcoming
Network gaps
• Expanded AA partnership2 including new SFO3 service from December 2015
• Continue to evolve market leading customer proposition with Emirates
• Launch new routes including BNE-NRT4, SYD-HND5 and SYD-SFO6
• Expand seasonal operations including BNE-WLG and BNE-CHC7
12
Record Result for Jetstar Group
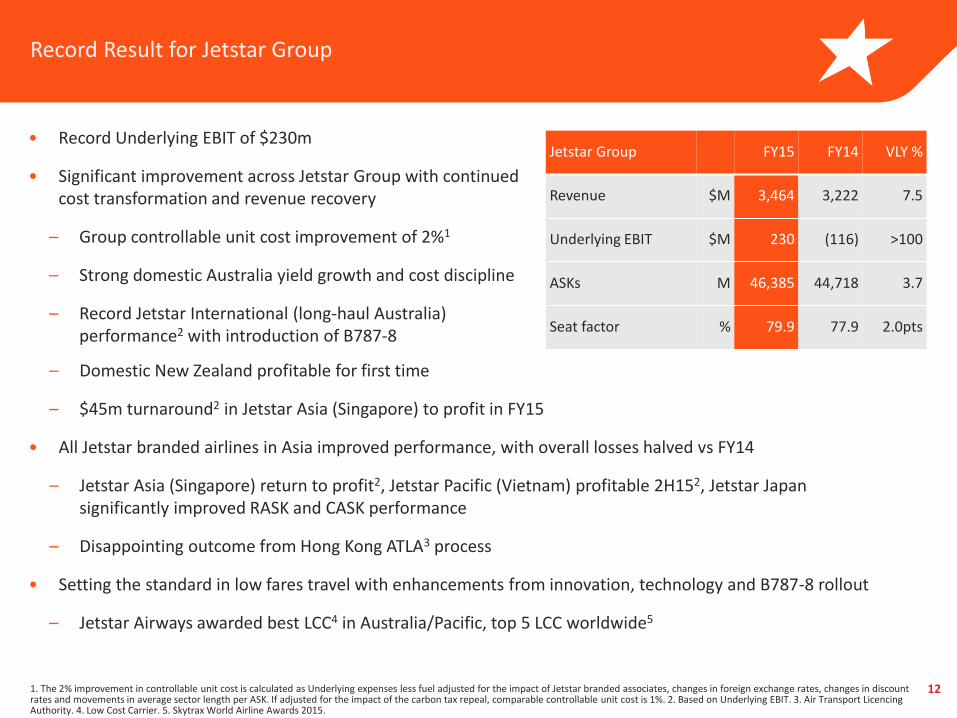
• Record Underlying EBIT of $230m
• Significant improvement across Jetstar Group with continued cost transformation and revenue recovery
– Group controllable unit cost improvement of 2%1
– Strong domestic Australia yield growth and cost discipline
– Record Jetstar International (long-haul Australia) performance2 with introduction of B787-8
1. The 2% improvement in controllable unit cost is calculated as Underlying expenses less fuel adjusted for the impact of Jetstar branded associates, changes in foreign exchange rates, changes in discount rates and movements in average sector length per ASK. If adjusted for the impact of the carbon tax repeal, comparable controllable unit cost is 1%. 2. Based on Underlying EBIT. 3. Air Transport Licencing Authority. 4. Low Cost Carrier. 5. Skytrax World Airline Awards 2015.
– Domestic New Zealand profitable for first time
– $45m turnaround2 in Jetstar Asia (Singapore) to profit in FY15
• All Jetstar branded airlines in Asia improved performance, with overall losses halved vs FY14
– Jetstar Asia (Singapore) return to profit2, Jetstar Pacific (Vietnam) profitable 2H152, Jetstar Japan significantly improved RASK and CASK performance
– Disappointing outcome from Hong Kong ATLA3 process
• Setting the standard in low fares travel with enhancements from innovation, technology and B787-8 rollout
– Jetstar Airways awarded best LCC4 in Australia/Pacific, top 5 LCC worldwide5
Jetstar Group FY15 FY14 VLY %
Revenue $M 3,464 3,222 7.5
Underlying EBIT $M 230 (116) >100
ASKs M 46,385 44,718 3.7
Seat factor % 79.9 77.9 2.0pts
13
Jetstar Group Areas of Focus for FY16
1. Subject to regulatory approval. 2. As at 19 August 2015. 3. Japan Airlines. 4. Vietnam Airlines.
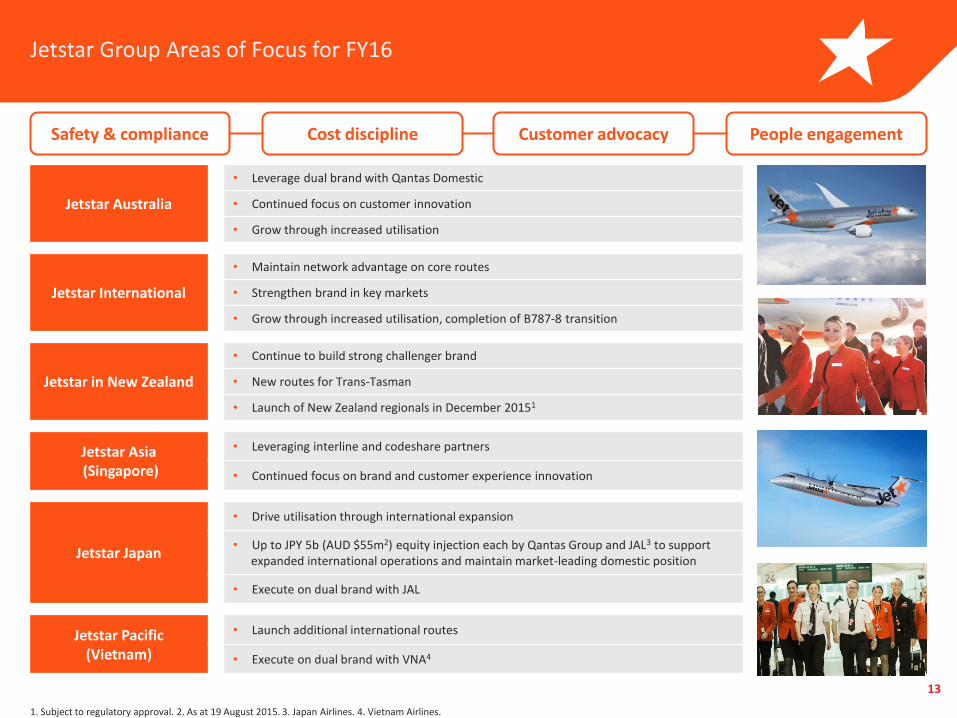
Safety & compliance Cost discipline Customer advocacy People engagement
Jetstar Australia
• Leverage dual brand with Qantas Domestic
• Continued focus on customer innovation
• Grow through increased utilisation
Jetstar International
• Maintain network advantage on core routes
• Strengthen brand in key markets
• Grow through increased utilisation, completion of B787-8 transition
Jetstar in New Zealand
• Continue to build strong challenger brand
• New routes for Trans-Tasman
• Launch of New Zealand regionals in December 20151
Jetstar Asia (Singapore)
• Leveraging interline and codeshare partners
• Continued focus on brand and customer experience innovation
Jetstar Japan
• Drive utilisation through international expansion
• Up to JPY 5b (AUD $55m2) equity injection each by Qantas Group and JAL3 to support expanded international operations and maintain market-leading domestic position
• Execute on dual brand with JAL
Jetstar Pacific (Vietnam)
• Launch additional international routes
• Execute on dual brand with VNA4
14
Record Result for Qantas Loyalty
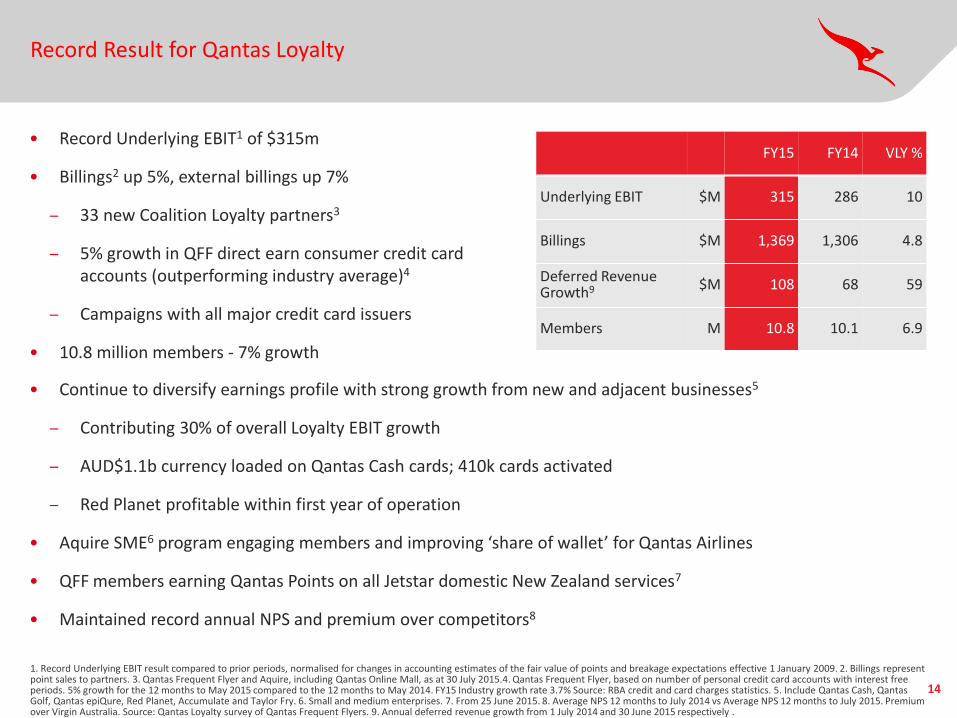
• Record Underlying EBIT1 of $315m
• Billings2 up 5%, external billings up 7%
– 33 new Coalition Loyalty partners3
– 5% growth in QFF direct earn consumer credit card accounts (outperforming industry average)4
– Campaigns with all major credit card issuers
• 10.8 million members - 7% growth
FY15 FY14 VLY %
Underlying EBIT $M 315 286 10
Billings $M 1,369 1,306 4.8
Deferred Revenue
Growth9 $M 108 68 59
Members M 10.8 10.1 6.9
• Continue to diversify earnings profile with strong growth from new and adjacent businesses5
– Contributing 30% of overall Loyalty EBIT growth
– AUD$1.1b currency loaded on Qantas Cash cards; 410k cards activated
– Red Planet profitable within first year of operation
• Aquire SME6 program engaging members and improving ‘share of wallet’ for Qantas Airlines
• QFF members earning Qantas Points on all Jetstar domestic New Zealand services7
• Maintained record annual NPS and premium over competitors8
1. Record Underlying EBIT result compared to prior periods, normalised for changes in accounting estimates of the fair value of points and breakage expectations effective 1 January 2009. 2. Billings represent point sales to partners. 3. Qantas Frequent Flyer and Aquire, including Qantas Online Mall, as at 30 July 2015.4. Qantas Frequent Flyer, based on number of personal credit card accounts with interest free periods. 5% growth for the 12 months to May 2015 compared to the 12 months to May 2014. FY15 Industry growth rate 3.7% Source: RBA credit and card charges statistics. 5. Include Qantas Cash, Qantas Golf, Qantas epiQure, Red Planet, Accumulate and Taylor Fry. 6. Small and medium enterprises. 7. From 25 June 2015. 8. Average NPS 12 months to July 2014 vs Average NPS 12 months to July 2015. Premium over Virgin Australia. Source: Qantas Loyalty survey of Qantas Frequent Flyers. 9. Annual deferred revenue growth from 1 July 2014 and 30 June 2015 respectively .
15
Qantas Loyalty Areas of Focus for FY16
1. Include Qantas Cash, Qantas Golf, Qantas epiQure, Red Planet , Accumulate and Taylor Fry
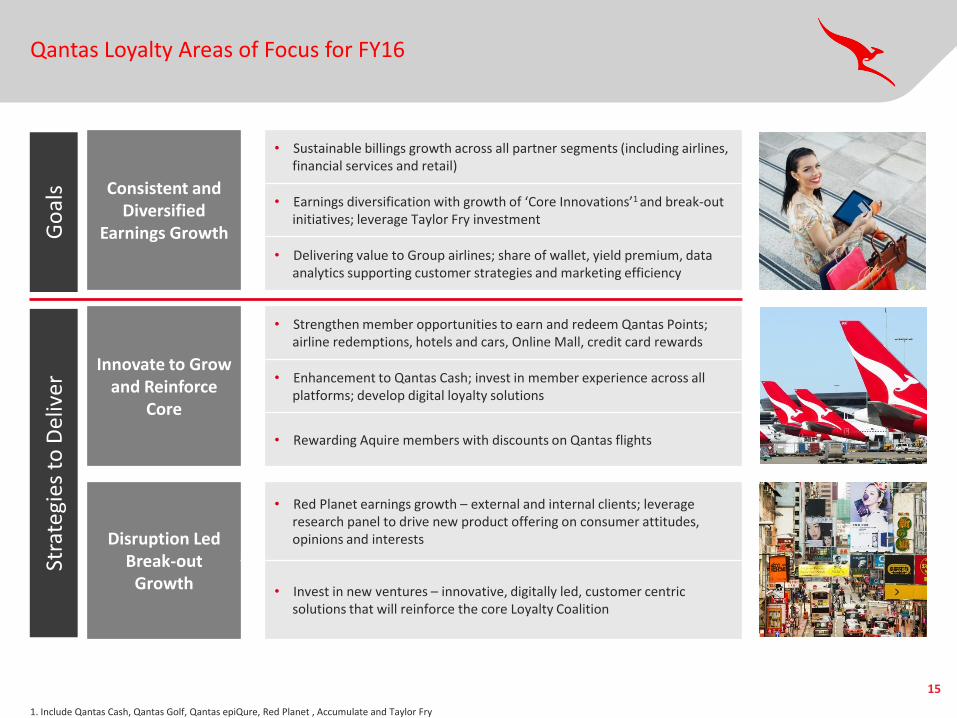
Consistent and Diversified
Earnings Growth
• Sustainable billings growth across all partner segments (including airlines, financial services and retail)
• Earnings diversification with growth of ‘Core Innovations’1 and break-out initiatives; leverage Taylor Fry investment
• Delivering value to Group airlines; share of wallet, yield premium, data analytics supporting customer strategies and marketing efficiency
Innovate to Grow and Reinforce
Core
• Strengthen member opportunities to earn and redeem Qantas Points; airline redemptions, hotels and cars, Online Mall, credit card rewards
• Enhancement to Qantas Cash; invest in member experience across all platforms; develop digital loyalty solutions
• Rewarding Aquire members with discounts on Qantas flights
Disruption Led Break-out
Growth
• Red Planet earnings growth – external and internal clients; leverage research panel to drive new product offering on consumer attitudes, opinions and interests
• Invest in new ventures – innovative, digitally led, customer centric solutions that will reinforce the core Loyalty Coalition
Go
als
Stra
tegi
es t
o D
eliv
er
16
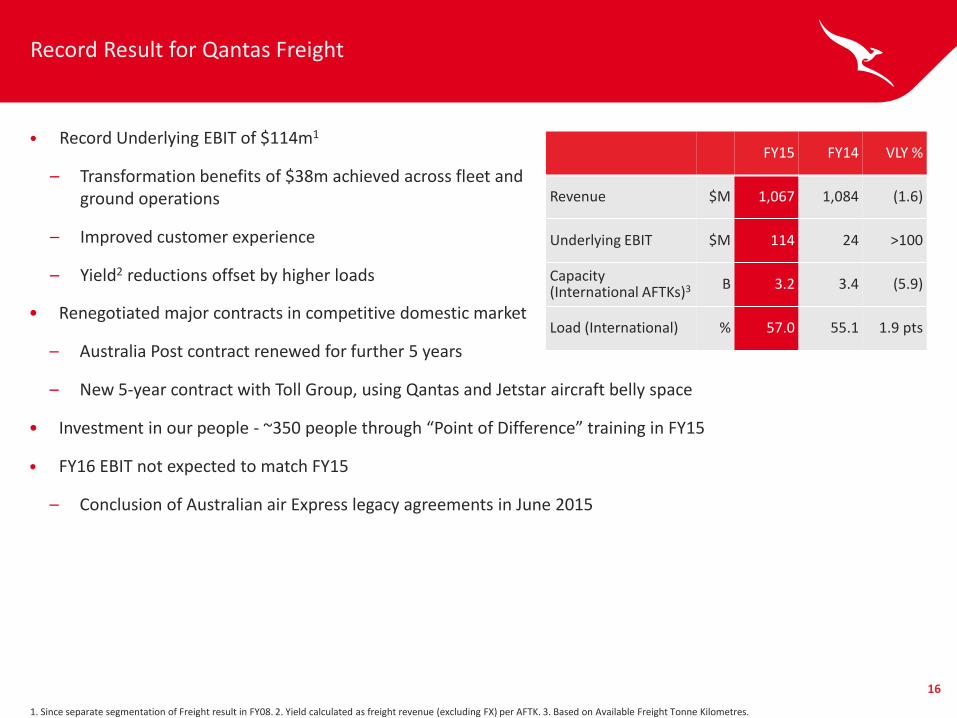
Record Result for Qantas Freight
• Record Underlying EBIT of $114m1
– Transformation benefits of $38m achieved across fleet and ground operations
– Improved customer experience
– Yield2 reductions offset by higher loads
1. Since separate segmentation of Freight result in FY08. 2. Yield calculated as freight revenue (excluding FX) per AFTK. 3. Based on Available Freight Tonne Kilometres.
FY15 FY14 VLY %
Revenue $M 1,067 1,084 (1.6)
Underlying EBIT $M 114 24 >100
Capacity (International AFTKs)3 B 3.2 3.4 (5.9)
Load (International) % 57.0 55.1 1.9 pts • Renegotiated major contracts in competitive domestic market
– Australia Post contract renewed for further 5 years
– New 5-year contract with Toll Group, using Qantas and Jetstar aircraft belly space
• Investment in our people - ~350 people through “Point of Difference” training in FY15
• FY16 EBIT not expected to match FY15
– Conclusion of Australian air Express legacy agreements in June 2015
Group Financial Framework and FY15 Result
18
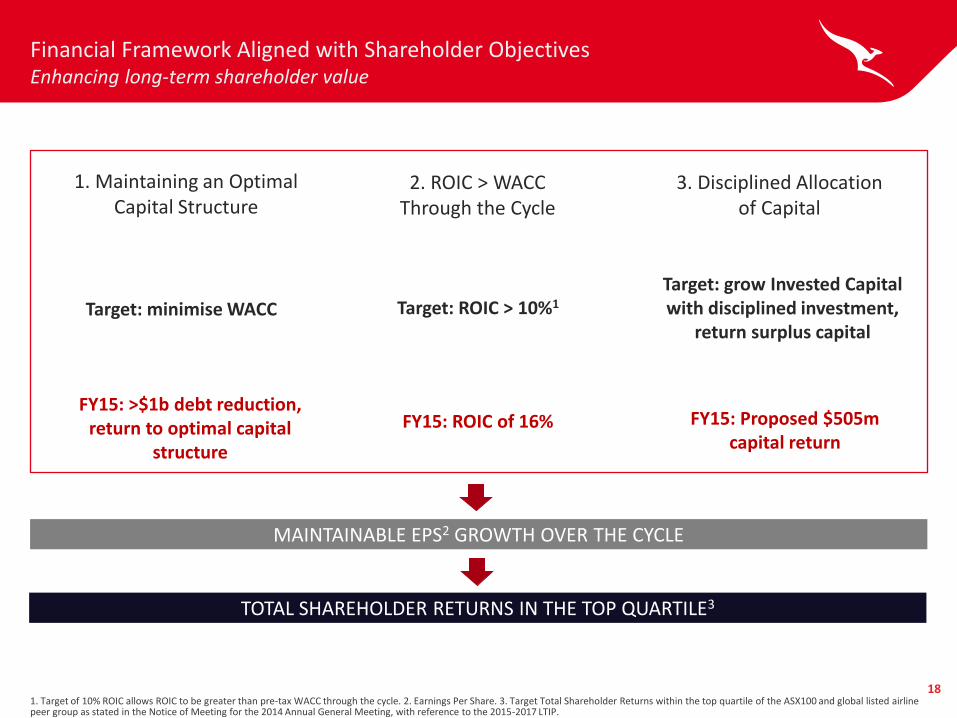
Financial Framework Aligned with Shareholder Objectives Enhancing long-term shareholder value
1. Target of 10% ROIC allows ROIC to be greater than pre-tax WACC through the cycle. 2. Earnings Per Share. 3. Target Total Shareholder Returns within the top quartile of the ASX100 and global listed airline peer group as stated in the Notice of Meeting for the 2014 Annual General Meeting, with reference to the 2015-2017 LTIP.
TOTAL SHAREHOLDER RETURNS IN THE TOP QUARTILE3
MAINTAINABLE EPS2 GROWTH OVER THE CYCLE
1. Maintaining an Optimal Capital Structure
2. ROIC > WACC Through the Cycle
3. Disciplined Allocation of Capital
Target: minimise WACC Target: ROIC > 10%1
Target: grow Invested Capital with disciplined investment,
return surplus capital
FY15: >$1b debt reduction, return to optimal capital
structure
FY15: ROIC of 16% FY15: Proposed $505m capital return
19
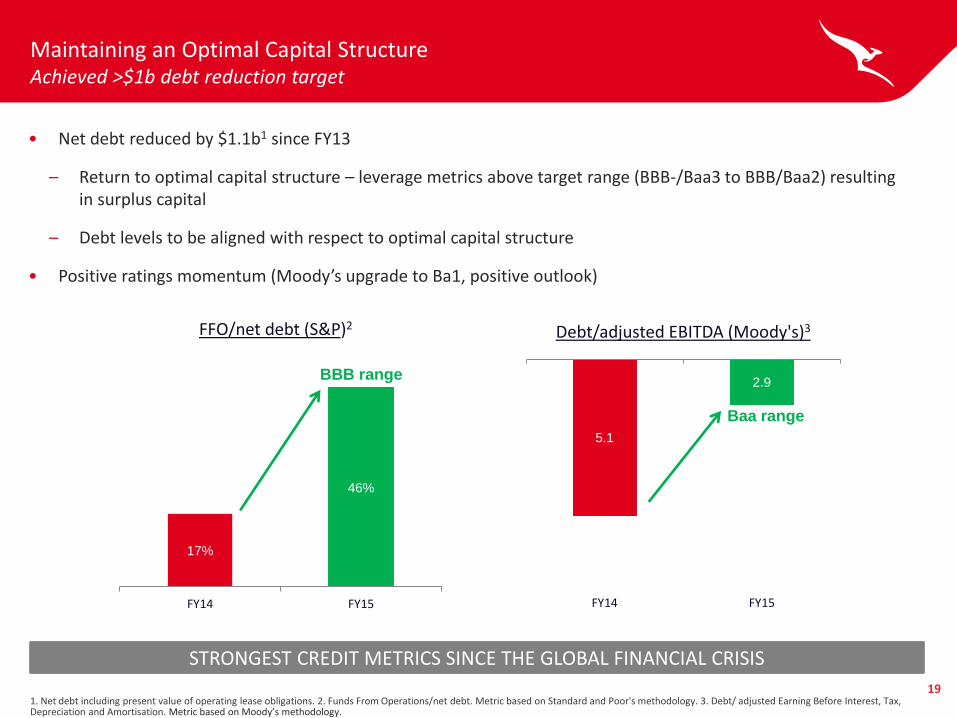
Maintaining an Optimal Capital Structure Achieved >$1b debt reduction target
1. Net debt including present value of operating lease obligations. 2. Funds From Operations/net debt. Metric based on Standard and Poor's methodology. 3. Debt/ adjusted Earning Before Interest, Tax, Depreciation and Amortisation. Metric based on Moody’s methodology.
• Net debt reduced by $1.1b1 since FY13
– Return to optimal capital structure – leverage metrics above target range (BBB-/Baa3 to BBB/Baa2) resulting in surplus capital
– Debt levels to be aligned with respect to optimal capital structure
• Positive ratings momentum (Moody’s upgrade to Ba1, positive outlook)
STRONGEST CREDIT METRICS SINCE THE GLOBAL FINANCIAL CRISIS
5.1
2.9
FY14 FY15
Debt/adjusted EBITDA (Moody's)3
17%
46%
FY14 FY15
FFO/net debt (S&P)2
BBB range
Baa range
20
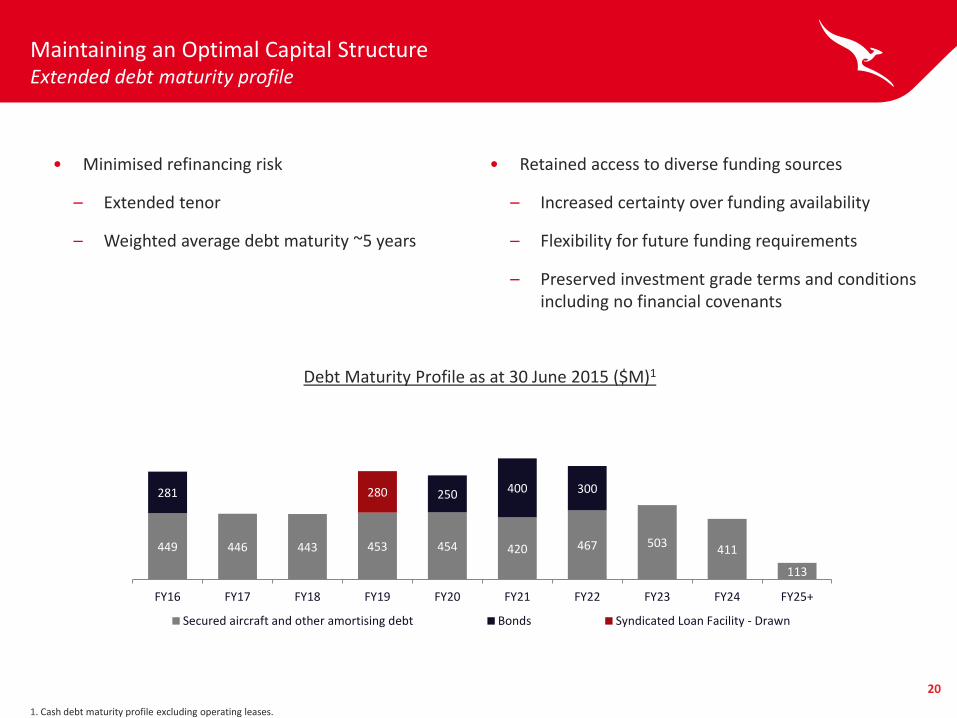
449 446 443 453 454 420 467 503 411
113
281 250 400 300 280
FY16 FY17 FY18 FY19 FY20 FY21 FY22 FY23 FY24 FY25+
Secured aircraft and other amortising debt Bonds Syndicated Loan Facility - Drawn
Maintaining an Optimal Capital Structure Extended debt maturity profile
1. Cash debt maturity profile excluding operating leases.
Debt Maturity Profile as at 30 June 2015 ($M)1
• Minimised refinancing risk
– Extended tenor
– Weighted average debt maturity ~5 years
• Retained access to diverse funding sources
– Increased certainty over funding availability
– Flexibility for future funding requirements
– Preserved investment grade terms and conditions including no financial covenants
21
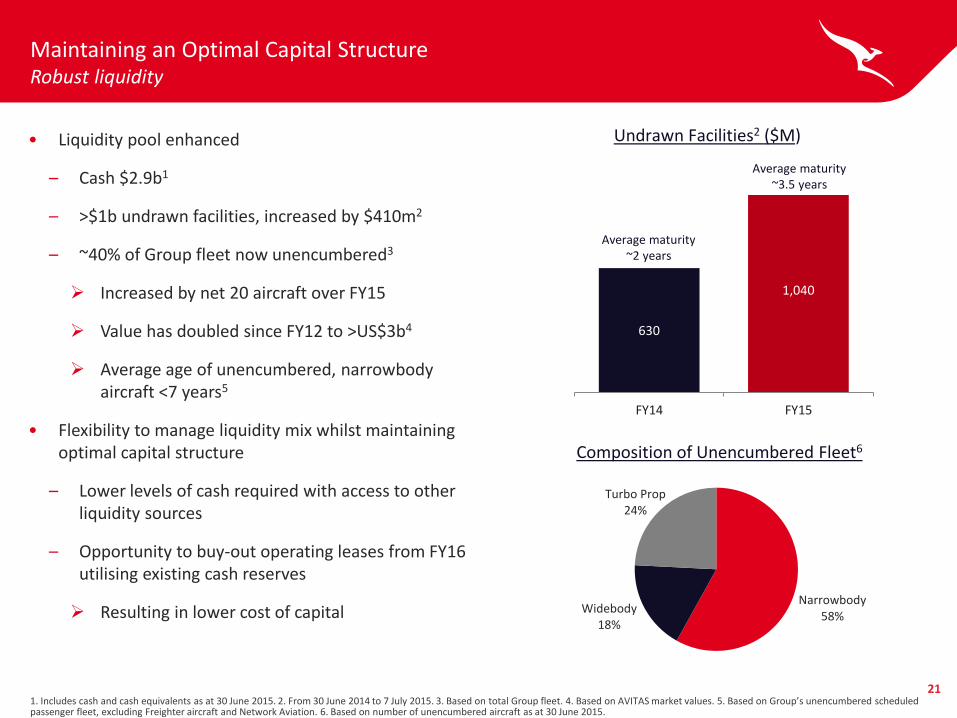
Maintaining an Optimal Capital Structure Robust liquidity
1. Includes cash and cash equivalents as at 30 June 2015. 2. From 30 June 2014 to 7 July 2015. 3. Based on total Group fleet. 4. Based on AVITAS market values. 5. Based on Group’s unencumbered scheduled passenger fleet, excluding Freighter aircraft and Network Aviation. 6. Based on number of unencumbered aircraft as at 30 June 2015.
• Liquidity pool enhanced
– Cash $2.9b1
– >$1b undrawn facilities, increased by $410m2
– ~40% of Group fleet now unencumbered3
Increased by net 20 aircraft over FY15
Value has doubled since FY12 to >US$3b4
Average age of unencumbered, narrowbody aircraft <7 years5
• Flexibility to manage liquidity mix whilst maintaining optimal capital structure
– Lower levels of cash required with access to other liquidity sources
– Opportunity to buy-out operating leases from FY16 utilising existing cash reserves
Resulting in lower cost of capital
Composition of Unencumbered Fleet6
Narrowbody 58%
Widebody 18%
Turbo Prop 24%
630
1,040
FY14 FY15
Undrawn Facilities2 ($M)
Average maturity ~3.5 years
Average maturity ~2 years
22
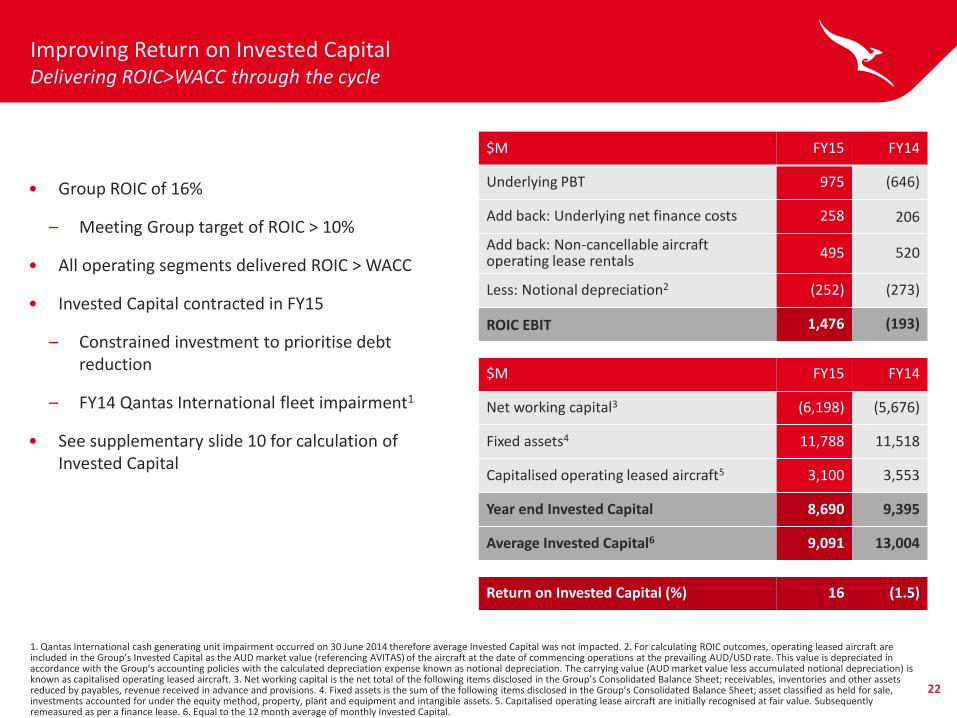
Improving Return on Invested Capital Delivering ROIC>WACC through the cycle
1. Qantas International cash generating unit impairment occurred on 30 June 2014 therefore average Invested Capital was not impacted. 2. For calculating ROIC outcomes, operating leased aircraft are included in the Group’s Invested Capital as the AUD market value (referencing AVITAS) of the aircraft at the date of commencing operations at the prevailing AUD/USD rate. This value is depreciated in accordance with the Group’s accounting policies with the calculated depreciation expense known as notional depreciation. The carrying value (AUD market value less accumulated notional depreciation) is known as capitalised operating leased aircraft. 3. Net working capital is the net total of the following items disclosed in the Group’s Consolidated Balance Sheet; receivables, inventories and other assets reduced by payables, revenue received in advance and provisions. 4. Fixed assets is the sum of the following items disclosed in the Group’s Consolidated Balance Sheet; asset classified as held for sale, investments accounted for under the equity method, property, plant and equipment and intangible assets. 5. Capitalised operating lease aircraft are initially recognised at fair value. Subsequently remeasured as per a finance lease. 6. Equal to the 12 month average of monthly Invested Capital.
$M FY15 FY14
Underlying PBT 975 (646)
Add back: Underlying net finance costs 258 206
Add back: Non-cancellable aircraft operating lease rentals
495 520
Less: Notional depreciation2 (252) (273)
ROIC EBIT 1,476 (193)
$M FY15 FY14
Net working capital3 (6,198) (5,676)
Fixed assets4 11,788 11,518
Capitalised operating leased aircraft5 3,100 3,553
Year end Invested Capital 8,690 9,395
Average Invested Capital6 9,091 13,004
Return on Invested Capital (%) 16 (1.5)
• Group ROIC of 16%
– Meeting Group target of ROIC > 10%
• All operating segments delivered ROIC > WACC
• Invested Capital contracted in FY15
– Constrained investment to prioritise debt reduction
– FY14 Qantas International fleet impairment1
• See supplementary slide 10 for calculation of Invested Capital
23
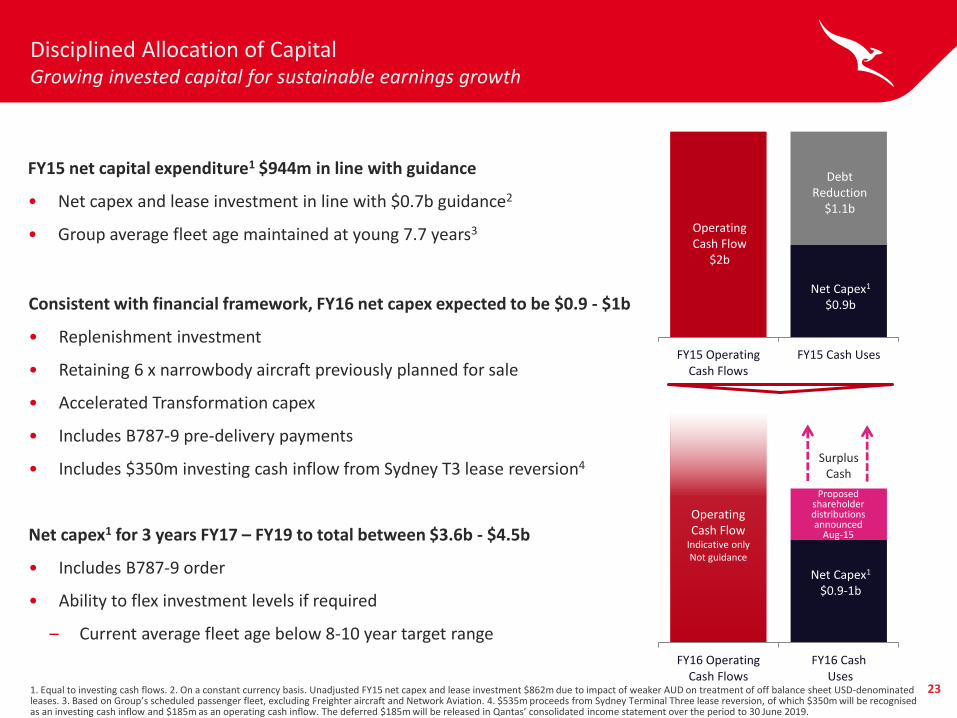
Disciplined Allocation of Capital Growing invested capital for sustainable earnings growth
1. Equal to investing cash flows. 2. On a constant currency basis. Unadjusted FY15 net capex and lease investment $862m due to impact of weaker AUD on treatment of off balance sheet USD-denominated leases. 3. Based on Group’s scheduled passenger fleet, excluding Freighter aircraft and Network Aviation. 4. $535m proceeds from Sydney Terminal Three lease reversion, of which $350m will be recognised as an investing cash inflow and $185m as an operating cash inflow. The deferred $185m will be released in Qantas’ consolidated income statement over the period to 30 June 2019.
FY15 net capital expenditure1 $944m in line with guidance
• Net capex and lease investment in line with $0.7b guidance2
• Group average fleet age maintained at young 7.7 years3
Consistent with financial framework, FY16 net capex expected to be $0.9 - $1b
• Replenishment investment
• Retaining 6 x narrowbody aircraft previously planned for sale
• Accelerated Transformation capex
• Includes B787-9 pre-delivery payments
• Includes $350m investing cash inflow from Sydney T3 lease reversion4
Net capex1 for 3 years FY17 – FY19 to total between $3.6b - $4.5b
• Includes B787-9 order
• Ability to flex investment levels if required
– Current average fleet age below 8-10 year target range
FY15 OperatingCash Flows
FY15 Cash Uses
FY16 OperatingCash Flows
FY16 Cash Uses
Debt Reduction
$1.1b
Net Capex1
$0.9b
Net Capex1
$0.9-1b
Operating Cash Flow
Indicative only Not guidance
Surplus Cash
Operating Cash Flow
$2b
Proposed shareholder distributions announced
Aug-15
24
Disciplined Allocation of Capital Returning surplus capital to shareholders
• Qantas will continue to review its optimal capital structure and, where there is surplus capital, assess how to enhance shareholder value with the appropriate mix of growth and shareholder distributions
– Base plans incorporate shareholder distributions when in optimal capital structure
– Future capital management initiatives will have regard to the Group’s Balance Sheet, business performance, growth opportunities and outlook
– Where surplus capital enables returns to be made to shareholders, the form of any distribution will have regard to a range of factors including the level of franking credits available in order to determine the most equitable and tax efficient method for all shareholders
25
Hedging Update Benefit of lower fuel prices protected
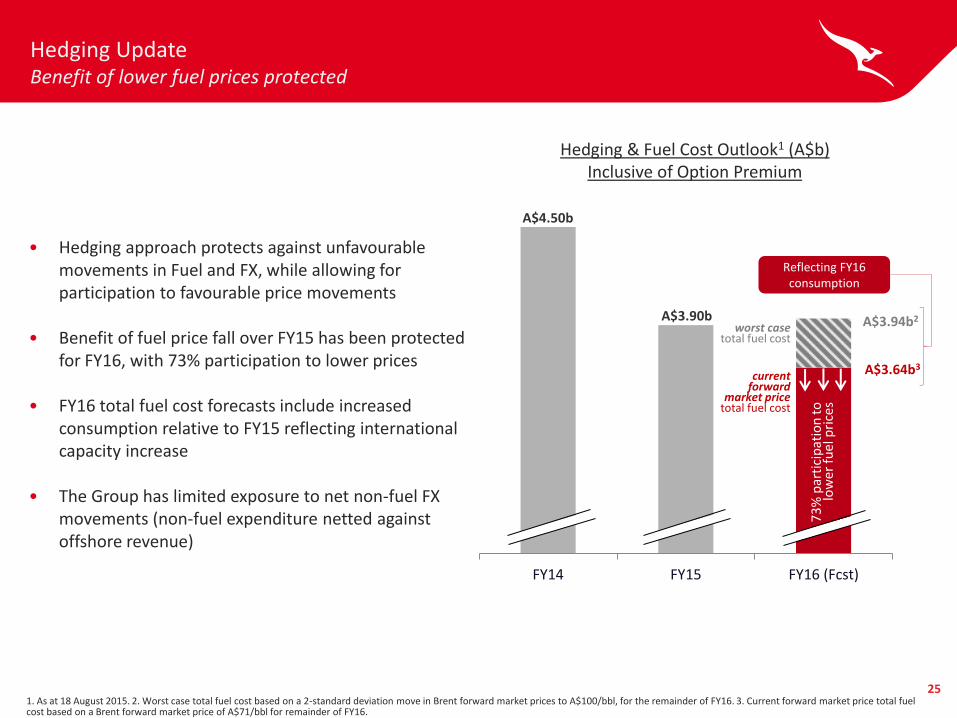
1. As at 18 August 2015. 2. Worst case total fuel cost based on a 2-standard deviation move in Brent forward market prices to A$100/bbl, for the remainder of FY16. 3. Current forward market price total fuel cost based on a Brent forward market price of A$71/bbl for remainder of FY16.
Hedging & Fuel Cost Outlook1 (A$b) Inclusive of Option Premium
• Hedging approach protects against unfavourable movements in Fuel and FX, while allowing for participation to favourable price movements
• Benefit of fuel price fall over FY15 has been protected for FY16, with 73% participation to lower prices
• FY16 total fuel cost forecasts include increased consumption relative to FY15 reflecting international capacity increase
• The Group has limited exposure to net non-fuel FX movements (non-fuel expenditure netted against offshore revenue)
FY14 FY15 FY16 (Fcst)
73
% p
arti
cip
atio
n t
o
low
er
fuel
pri
ces
worst case total fuel cost
current forward
market price
total fuel cost
A$3.94b2
A$3.64b3
A$4.50b
A$3.90b
Reflecting FY16 consumption
26
Reversion of Sydney Terminal 3 Lease Long-term certainty , positive strategic and financial outcome
• Commercial agreement reached with Sydney Airport delivers long-term certainty over future operations in Sydney domestic Terminal 3
• Reversion of T3 lease to Sydney Airport from 1 September 2015
– 30-year lease due to expire June 2019
– Introduction of per passenger charge, agreed rate to 2025
• Qantas exclusive usage of Terminal 3 to continue until June 2019
• Retaining priority usage including majority of gates, check-in and baggage from 2019 to mid-2025
• Qantas to receive total cash proceeds of $535m
– $210m gain on sale, recognised outside of FY16 Underlying PBT
– $350m to be recognised as investing cash inflow in FY16
– Deferred $185m to be released over the period to 30 June 2019
– EBIT neutral outcome through to FY19
Strategy Update and Outlook
28
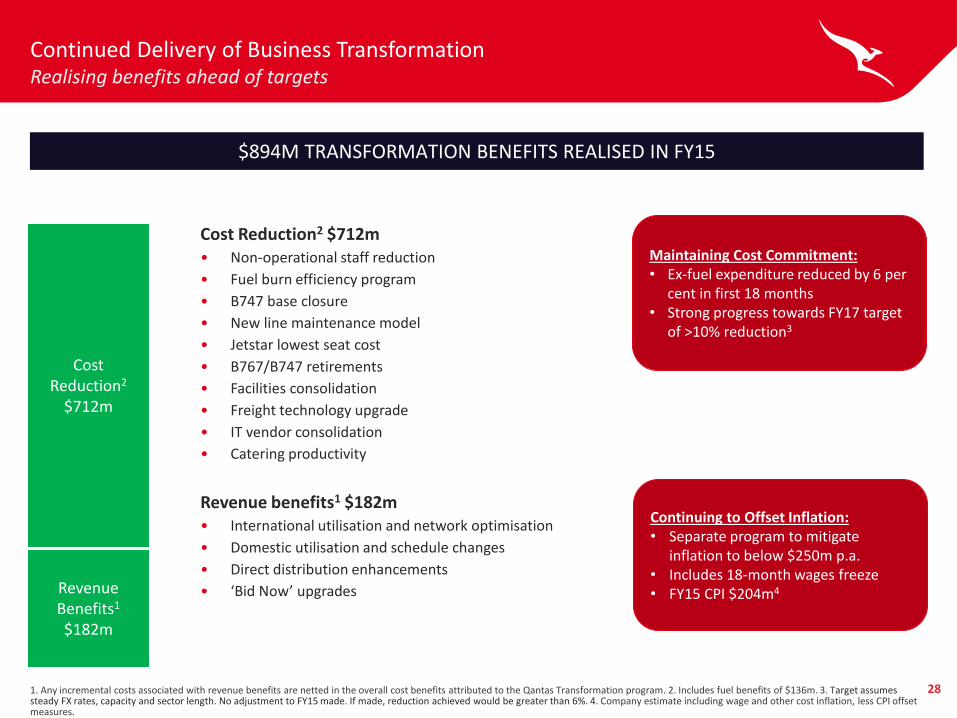
Continued Delivery of Business Transformation Realising benefits ahead of targets
Cost Reduction2 $712m • Non-operational staff reduction
• Fuel burn efficiency program
• B747 base closure
• New line maintenance model
• Jetstar lowest seat cost
• B767/B747 retirements
• Facilities consolidation
• Freight technology upgrade
• IT vendor consolidation
• Catering productivity
Revenue benefits1 $182m • International utilisation and network optimisation
• Domestic utilisation and schedule changes
• Direct distribution enhancements
• ‘Bid Now’ upgrades
$777m
1. Any incremental costs associated with revenue benefits are netted in the overall cost benefits attributed to the Qantas Transformation program. 2. Includes fuel benefits of $136m. 3. Target assumes steady FX rates, capacity and sector length. No adjustment to FY15 made. If made, reduction achieved would be greater than 6%. 4. Company estimate including wage and other cost inflation, less CPI offset measures.
$894M TRANSFORMATION BENEFITS REALISED IN FY15
Maintaining Cost Commitment: • Ex-fuel expenditure reduced by 6 per
cent in first 18 months • Strong progress towards FY17 target
of >10% reduction3
Revenue Benefits1
$182m
Cost Reduction2
$712m
Continuing to Offset Inflation: • Separate program to mitigate
inflation to below $250m p.a. • Includes 18-month wages freeze • FY15 CPI $204m4
29
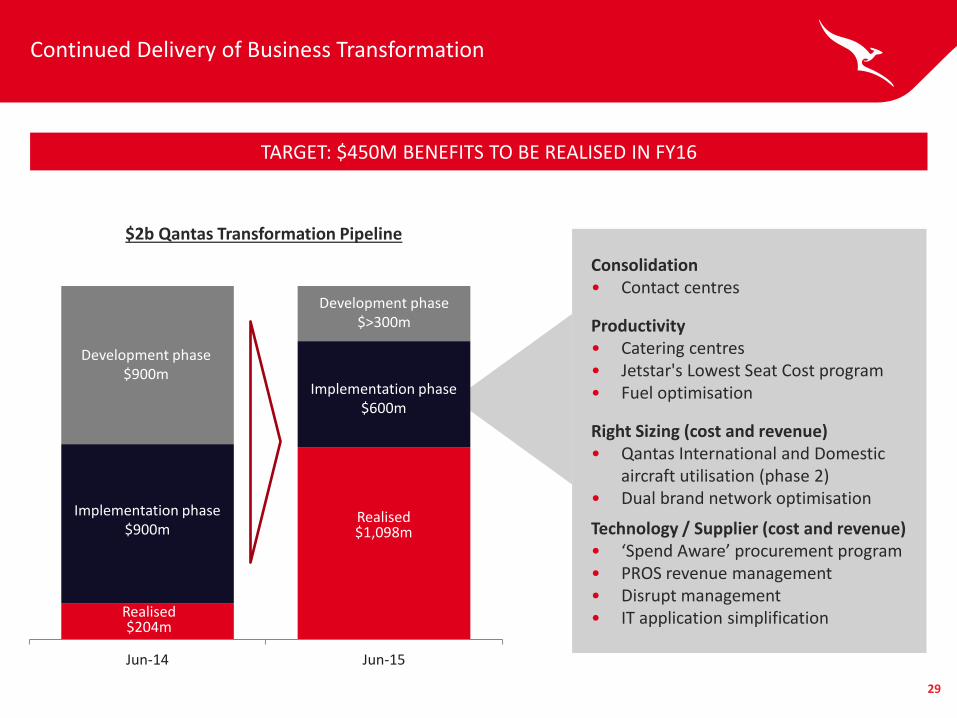
Continued Delivery of Business Transformation
TARGET: $450M BENEFITS TO BE REALISED IN FY16
$2b Qantas Transformation Pipeline
Jun-14 Jun-15
Implementation phase $600m
Development phase $>300m
Implementation phase $900m
Development phase $900m
Realised $1,098m
Realised $204m
Consolidation • Contact centres
Productivity • Catering centres • Jetstar's Lowest Seat Cost program • Fuel optimisation
Right Sizing (cost and revenue) • Qantas International and Domestic
aircraft utilisation (phase 2) • Dual brand network optimisation
Technology / Supplier (cost and revenue) • ‘Spend Aware’ procurement program • PROS revenue management • Disrupt management • IT application simplification
30
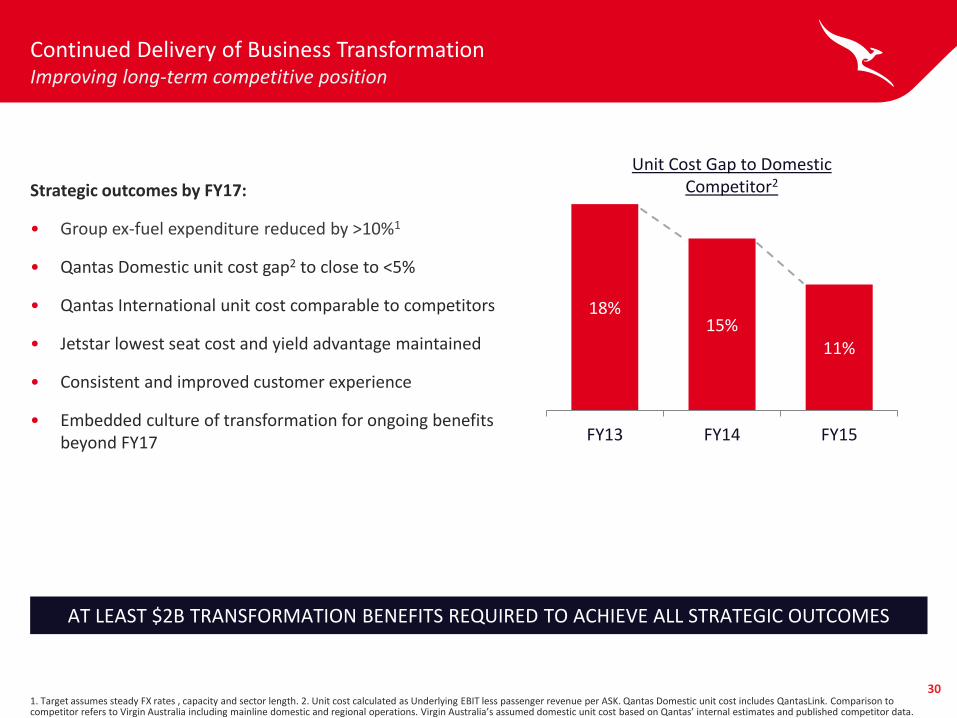
Continued Delivery of Business Transformation Improving long-term competitive position
1. Target assumes steady FX rates , capacity and sector length. 2. Unit cost calculated as Underlying EBIT less passenger revenue per ASK. Qantas Domestic unit cost includes QantasLink. Comparison to competitor refers to Virgin Australia including mainline domestic and regional operations. Virgin Australia’s assumed domestic unit cost based on Qantas’ internal estimates and published competitor data.
18% 15%
11%
FY13 FY14 FY15
Unit Cost Gap to Domestic Competitor2
AT LEAST $2B TRANSFORMATION BENEFITS REQUIRED TO ACHIEVE ALL STRATEGIC OUTCOMES
Strategic outcomes by FY17:
• Group ex-fuel expenditure reduced by >10%1
• Qantas Domestic unit cost gap2 to close to <5%
• Qantas International unit cost comparable to competitors
• Jetstar lowest seat cost and yield advantage maintained
• Consistent and improved customer experience
• Embedded culture of transformation for ongoing benefits beyond FY17
31
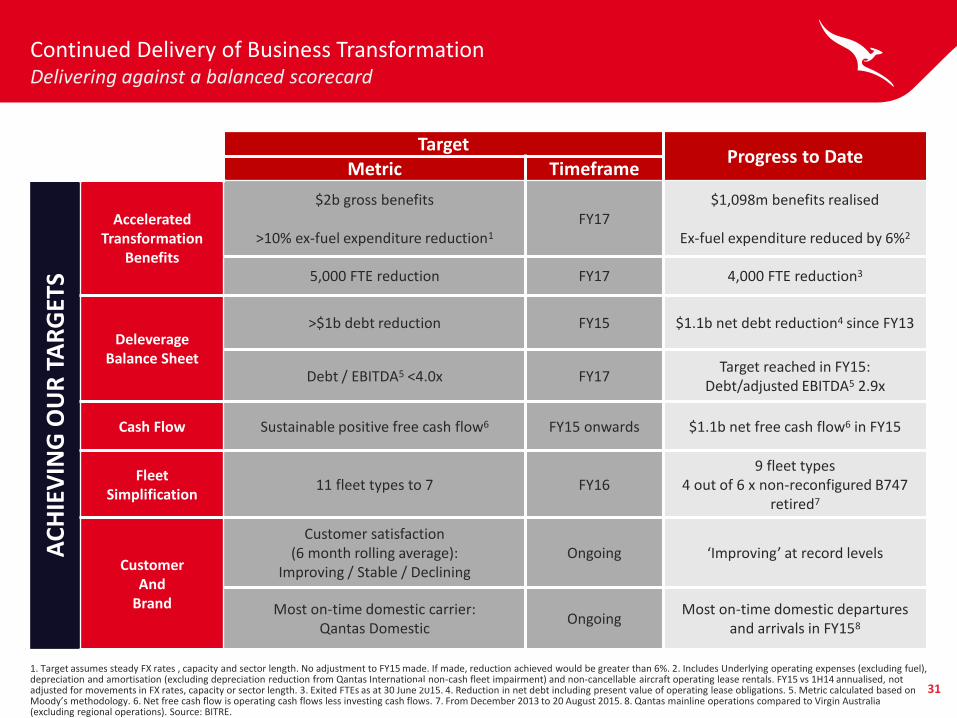
Target Progress to Date
Metric Timeframe
AC
HIE
VIN
G O
UR
TA
RG
ETS
Accelerated Transformation
Benefits
$2b gross benefits
>10% ex-fuel expenditure reduction1 FY17
$1,098m benefits realised
Ex-fuel expenditure reduced by 6%2
5,000 FTE reduction FY17 4,000 FTE reduction3
Deleverage Balance Sheet
>$1b debt reduction FY15 $1.1b net debt reduction4 since FY13
Debt / EBITDA5 <4.0x FY17 Target reached in FY15:
Debt/adjusted EBITDA5 2.9x
Cash Flow Sustainable positive free cash flow6 FY15 onwards $1.1b net free cash flow6 in FY15
Fleet Simplification
11 fleet types to 7 FY16 9 fleet types
4 out of 6 x non-reconfigured B747 retired7
Customer And
Brand
Customer satisfaction (6 month rolling average):
Improving / Stable / Declining Ongoing ‘Improving’ at record levels
Most on-time domestic carrier: Qantas Domestic
Ongoing Most on-time domestic departures
and arrivals in FY158
Continued Delivery of Business Transformation Delivering against a balanced scorecard
1. Target assumes steady FX rates , capacity and sector length. No adjustment to FY15 made. If made, reduction achieved would be greater than 6%. 2. Includes Underlying operating expenses (excluding fuel), depreciation and amortisation (excluding depreciation reduction from Qantas International non-cash fleet impairment) and non-cancellable aircraft operating lease rentals. FY15 vs 1H14 annualised, not adjusted for movements in FX rates, capacity or sector length. 3. Exited FTEs as at 30 June 2015. 4. Reduction in net debt including present value of operating lease obligations. 5. Metric calculated based on Moody’s methodology. 6. Net free cash flow is operating cash flows less investing cash flows. 7. From December 2013 to 20 August 2015. 8. Qantas mainline operations compared to Virgin Australia (excluding regional operations). Source: BITRE.
32
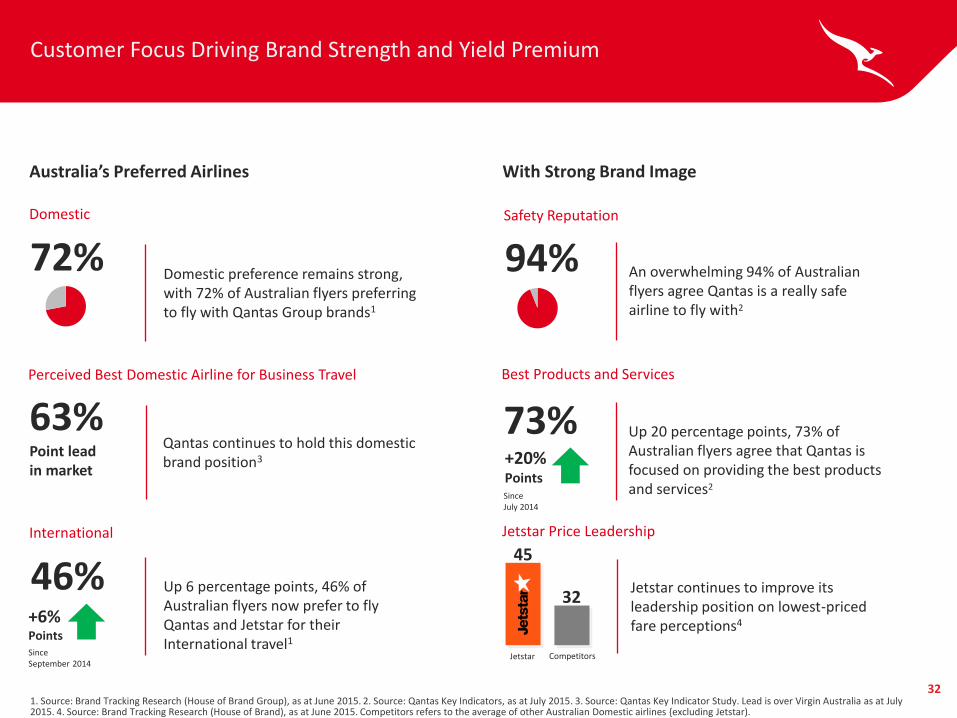
Customer Focus Driving Brand Strength and Yield Premium
1. Source: Brand Tracking Research (House of Brand Group), as at June 2015. 2. Source: Qantas Key Indicators, as at July 2015. 3. Source: Qantas Key Indicator Study. Lead is over Virgin Australia as at July 2015. 4. Source: Brand Tracking Research (House of Brand), as at June 2015. Competitors refers to the average of other Australian Domestic airlines {excluding Jetstar).
46%
Since September 2014
Up 6 percentage points, 46% of Australian flyers now prefer to fly Qantas and Jetstar for their International travel1
Australia’s Preferred Airlines
Domestic
International
72% Domestic preference remains strong, with 72% of Australian flyers preferring to fly with Qantas Group brands1
With Strong Brand Image
94% An overwhelming 94% of Australian flyers agree Qantas is a really safe airline to fly with2
Safety Reputation
73% Up 20 percentage points, 73% of Australian flyers agree that Qantas is focused on providing the best products and services2
Best Products and Services
+6% Points
Since July 2014
+20% Points
Jetstar Price Leadership
Jetstar continues to improve its leadership position on lowest-priced fare perceptions4
Qantas continues to hold this domestic brand position3
63% Point lead in market
Perceived Best Domestic Airline for Business Travel
Jetstar
45
32
Competitors
33
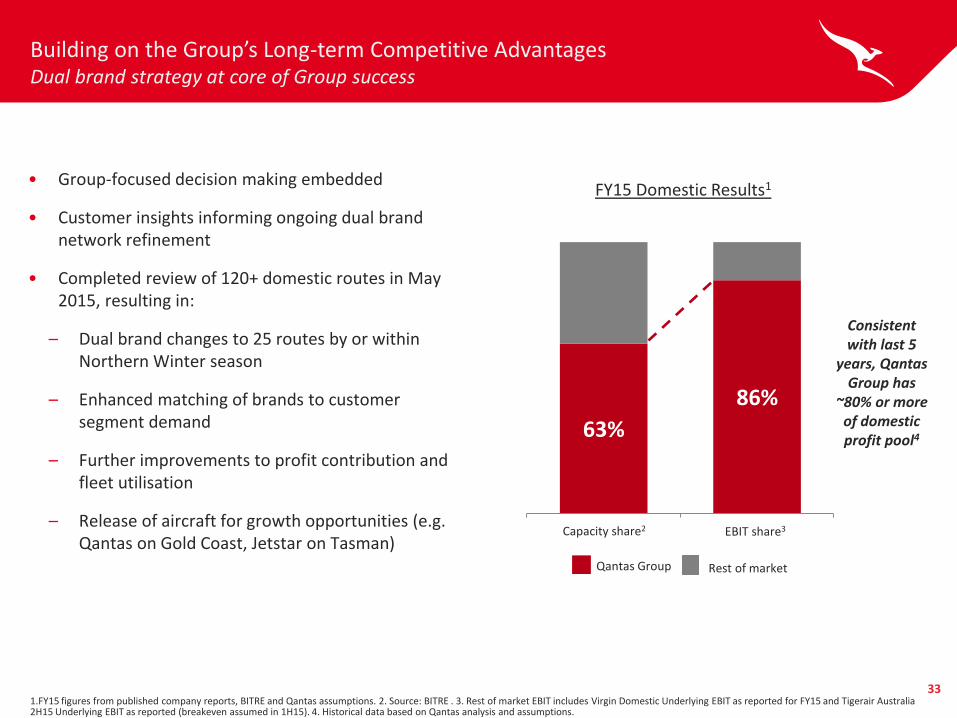
63%
86%
Building on the Group’s Long-term Competitive Advantages Dual brand strategy at core of Group success
1.FY15 figures from published company reports, BITRE and Qantas assumptions. 2. Source: BITRE . 3. Rest of market EBIT includes Virgin Domestic Underlying EBIT as reported for FY15 and Tigerair Australia 2H15 Underlying EBIT as reported (breakeven assumed in 1H15). 4. Historical data based on Qantas analysis and assumptions.
EBIT share3 Capacity share2
Qantas Group
FY15 Domestic Results1
Consistent with last 5
years, Qantas Group has
~80% or more of domestic profit pool4
Rest of market
• Group-focused decision making embedded
• Customer insights informing ongoing dual brand network refinement
• Completed review of 120+ domestic routes in May 2015, resulting in:
– Dual brand changes to 25 routes by or within Northern Winter season
– Enhanced matching of brands to customer segment demand
– Further improvements to profit contribution and fleet utilisation
– Release of aircraft for growth opportunities (e.g. Qantas on Gold Coast, Jetstar on Tasman)
34
Disciplined Investment To Enhance Long-term Shareholder Value
1. Building on the Group’s competitive advantages
Integrated portfolio of premier brands
Superior domestic market position
Global network reach
Customer experience and insights
2. Positioning the Group to succeed in growth markets
Loyalty growth initiatives
Jetstar in Asia
Qantas International to unserved city pairs
3. Strengthening long-term Group ROIC
Ongoing business transformation
4. Aligning with our brand values and vision
35
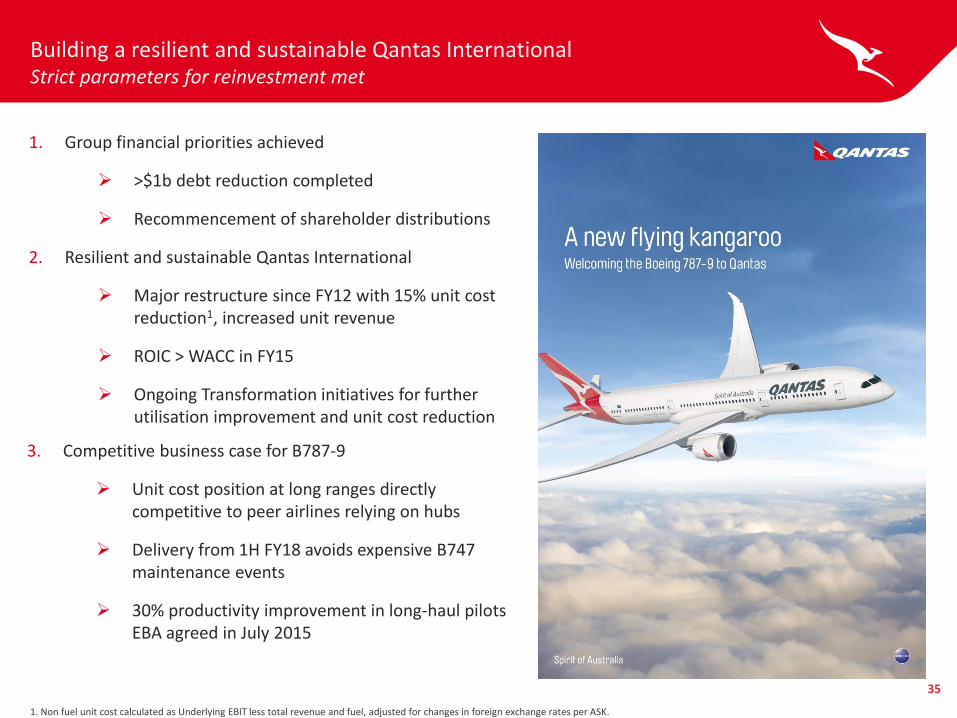
Building a resilient and sustainable Qantas International Strict parameters for reinvestment met
1. Group financial priorities achieved
>$1b debt reduction completed
Recommencement of shareholder distributions
2. Resilient and sustainable Qantas International
Major restructure since FY12 with 15% unit cost reduction1, increased unit revenue
ROIC > WACC in FY15
Ongoing Transformation initiatives for further utilisation improvement and unit cost reduction
1. Non fuel unit cost calculated as Underlying EBIT less total revenue and fuel, adjusted for changes in foreign exchange rates per ASK.
3. Competitive business case for B787-9
Unit cost position at long ranges directly competitive to peer airlines relying on hubs
Delivery from 1H FY18 avoids expensive B747 maintenance events
30% productivity improvement in long-haul pilots EBA agreed in July 2015
36
Building a resilient and sustainable Qantas International Flexibility in Group fleet planning
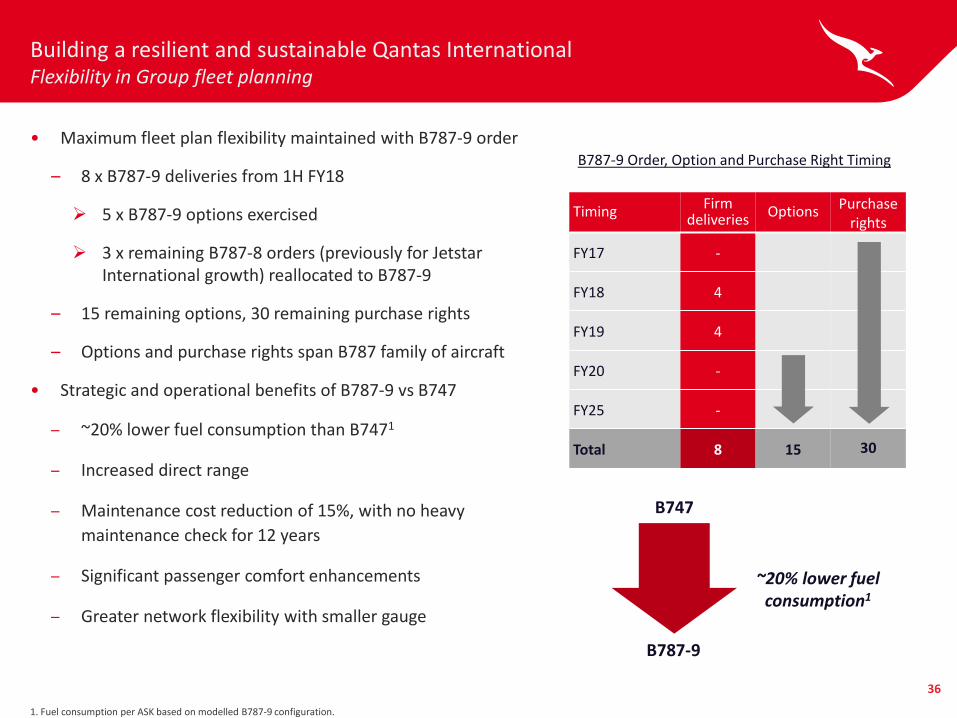
• Maximum fleet plan flexibility maintained with B787-9 order
– 8 x B787-9 deliveries from 1H FY18
5 x B787-9 options exercised
3 x remaining B787-8 orders (previously for Jetstar International growth) reallocated to B787-9
– 15 remaining options, 30 remaining purchase rights
– Options and purchase rights span B787 family of aircraft
• Strategic and operational benefits of B787-9 vs B747
– ~20% lower fuel consumption than B7471
– Increased direct range
– Maintenance cost reduction of 15%, with no heavy
maintenance check for 12 years
– Significant passenger comfort enhancements
– Greater network flexibility with smaller gauge
1. Fuel consumption per ASK based on modelled B787-9 configuration.
B787-9 Order, Option and Purchase Right Timing
Timing Firm
deliveries Options Purchase
rights
FY17 -
FY18 4
FY19 4
FY20 -
FY25 - -
Total 8 15 30
~20% lower fuel consumption1
B747
B787-9
37
Building a resilient and sustainable Qantas International B787-9 aircraft overcome the tyranny of distance
1. Based on modelled 787-9 cabin configuration.
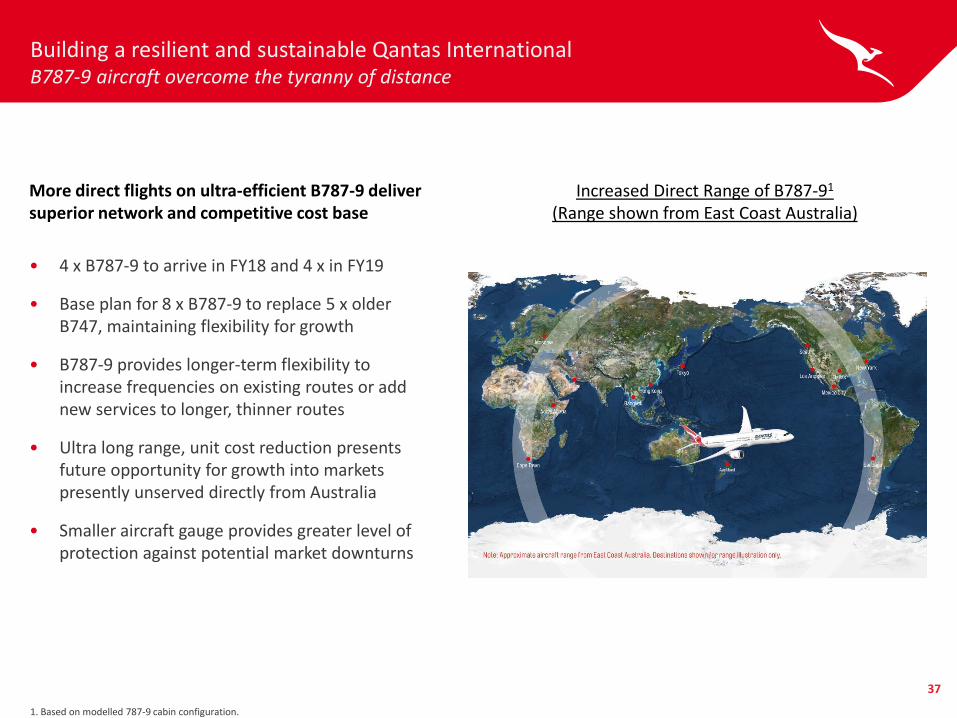
More direct flights on ultra-efficient B787-9 deliver superior network and competitive cost base
• 4 x B787-9 to arrive in FY18 and 4 x in FY19
• Base plan for 8 x B787-9 to replace 5 x older B747, maintaining flexibility for growth
• B787-9 provides longer-term flexibility to increase frequencies on existing routes or add new services to longer, thinner routes
• Ultra long range, unit cost reduction presents future opportunity for growth into markets presently unserved directly from Australia
• Smaller aircraft gauge provides greater level of protection against potential market downturns
Increased Direct Range of B787-91
(Range shown from East Coast Australia)
38
Engaging Our People Driving workplace change and improved culture
1. Tower Watson employee engagement survey 2015.
• Employee engagement maintained at 75% in 20151
─ Strong outcome amid accelerated business transformation of last two years
• Commitment to driving workplace change and improved culture
─ Three-year program focused on continuous improvement of people safety
─ 24,000 employees to participate in leadership and culture training over next 18 months
─ 8,000 people to complete third series of customer service training over next 18 months
• Building a more competitive and sustainable wages position
─ 18 agreements closed with 18-month wages freeze; Qantas long-haul pilots agreement in July 2015
─ All major unions have agreed to policy in at least one agreement
─ All employees covered by wages freeze policy to receive one-off bonus payment worth five per cent of base annual salary
39
Embedding Sustainability and Resilience Across Qantas Group
1. Emissions from Aviation fuel. Calculated using Australian Govt. methodology. Source: Qantas Internal Reporting. 2.Based on internal benchmarking of total carbon offset compared to18 other global airlines. 3. International Air Transport Association.
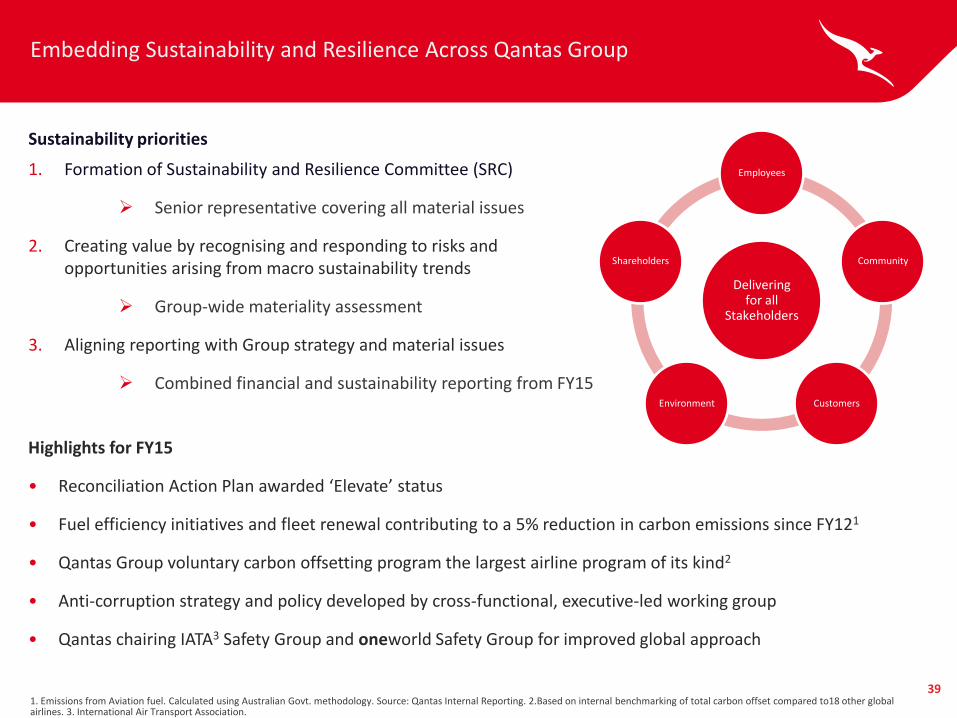
Sustainability priorities
1. Formation of Sustainability and Resilience Committee (SRC)
Senior representative covering all material issues
2. Creating value by recognising and responding to risks and opportunities arising from macro sustainability trends
Group-wide materiality assessment
3. Aligning reporting with Group strategy and material issues
Combined financial and sustainability reporting from FY15
Highlights for FY15
• Reconciliation Action Plan awarded ‘Elevate’ status
• Fuel efficiency initiatives and fleet renewal contributing to a 5% reduction in carbon emissions since FY121
• Qantas Group voluntary carbon offsetting program the largest airline program of its kind2
• Anti-corruption strategy and policy developed by cross-functional, executive-led working group
• Qantas chairing IATA3 Safety Group and oneworld Safety Group for improved global approach
Delivering for all
Stakeholders
Employees
Community
Customers Environment
Shareholders
40
-4.0%
0.0%
4.0%
8.0%
12.0%
16.0%Market GrowthAverage Market Growth
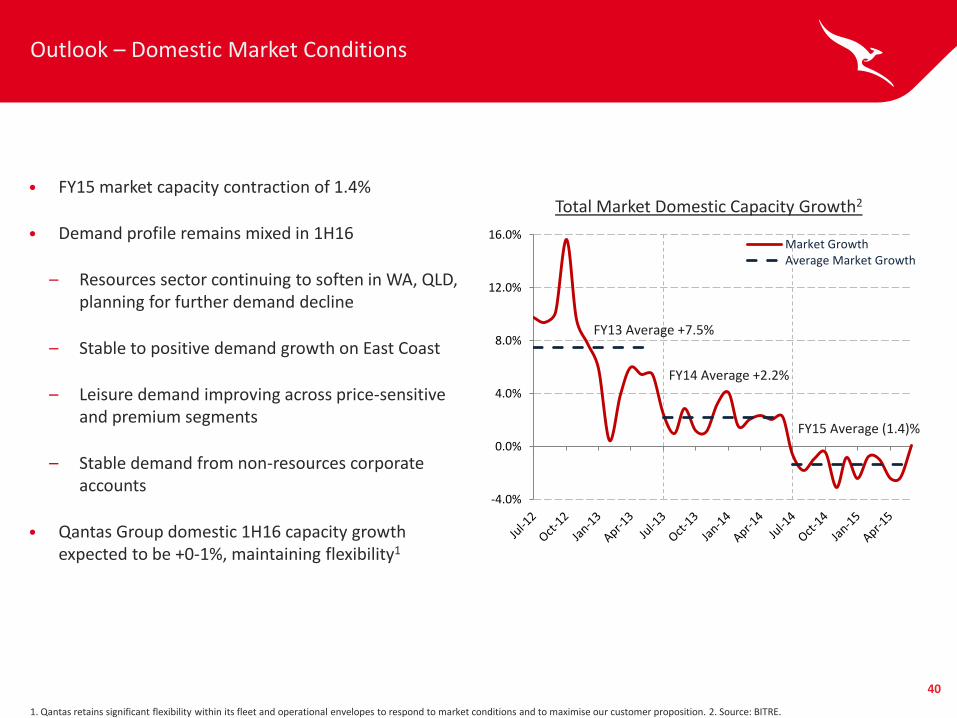
Outlook – Domestic Market Conditions
• FY15 market capacity contraction of 1.4%
• Demand profile remains mixed in 1H16
– Resources sector continuing to soften in WA, QLD, planning for further demand decline
– Stable to positive demand growth on East Coast
– Leisure demand improving across price-sensitive and premium segments
– Stable demand from non-resources corporate accounts
• Qantas Group domestic 1H16 capacity growth expected to be +0-1%, maintaining flexibility1
1. Qantas retains significant flexibility within its fleet and operational envelopes to respond to market conditions and to maximise our customer proposition. 2. Source: BITRE.
Total Market Domestic Capacity Growth2
FY14 Average +2.2%
FY13 Average +7.5%
FY15 Average (1.4)%
41
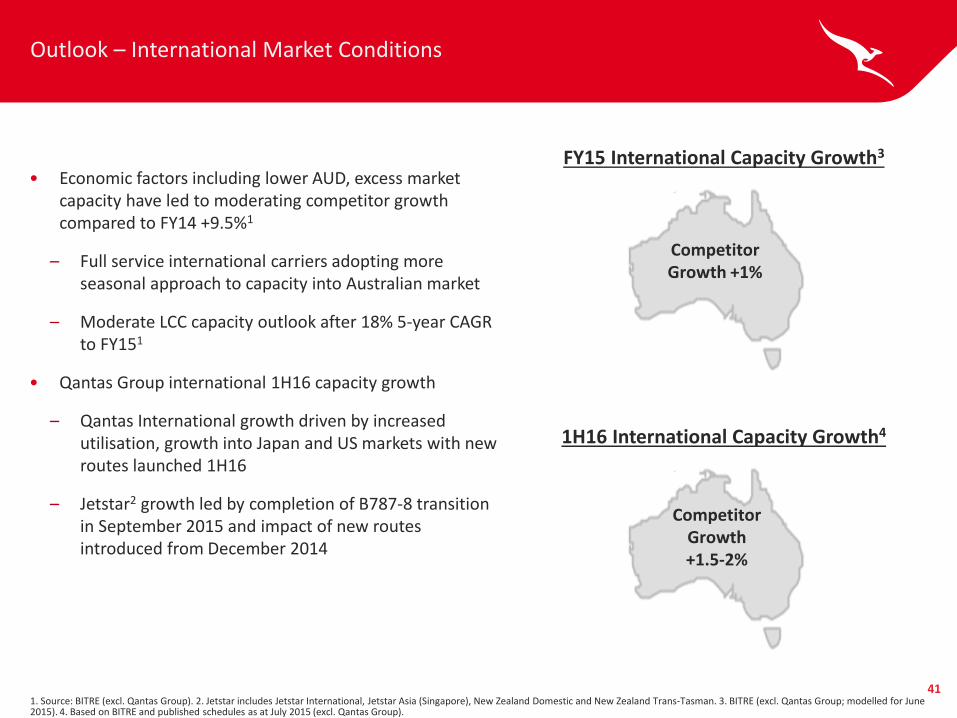
Outlook – International Market Conditions
• Economic factors including lower AUD, excess market capacity have led to moderating competitor growth compared to FY14 +9.5%1
– Full service international carriers adopting more seasonal approach to capacity into Australian market
– Moderate LCC capacity outlook after 18% 5-year CAGR to FY151
• Qantas Group international 1H16 capacity growth
– Qantas International growth driven by increased utilisation, growth into Japan and US markets with new routes launched 1H16
– Jetstar2 growth led by completion of B787-8 transition in September 2015 and impact of new routes introduced from December 2014
1. Source: BITRE (excl. Qantas Group). 2. Jetstar includes Jetstar International, Jetstar Asia (Singapore), New Zealand Domestic and New Zealand Trans-Tasman. 3. BITRE (excl. Qantas Group; modelled for June 2015). 4. Based on BITRE and published schedules as at July 2015 (excl. Qantas Group).
Competitor Growth +1.5-2%
1H16 International Capacity Growth4
FY15 International Capacity Growth3
Competitor Growth +1%
42
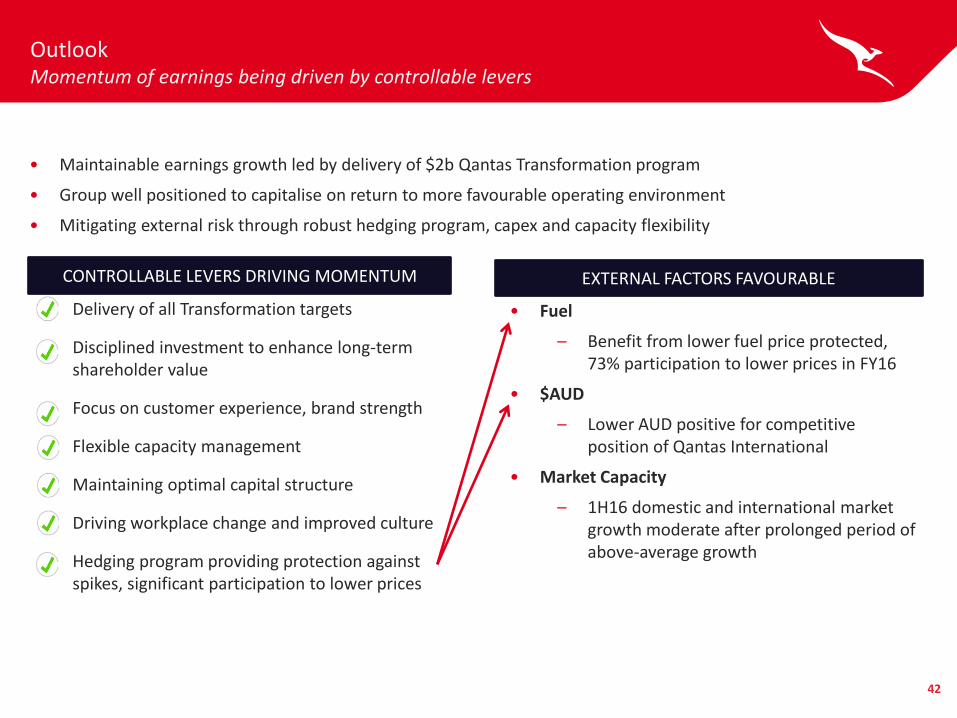
Outlook Momentum of earnings being driven by controllable levers
CONTROLLABLE LEVERS DRIVING MOMENTUM EXTERNAL FACTORS FAVOURABLE
• Delivery of all Transformation targets
• Disciplined investment to enhance long-term shareholder value
• Focus on customer experience, brand strength
• Flexible capacity management
• Maintaining optimal capital structure
• Driving workplace change and improved culture
• Hedging program providing protection against spikes, significant participation to lower prices
• Fuel
– Benefit from lower fuel price protected, 73% participation to lower prices in FY16
• $AUD
– Lower AUD positive for competitive position of Qantas International
• Market Capacity
– 1H16 domestic and international market growth moderate after prolonged period of above-average growth
• Maintainable earnings growth led by delivery of $2b Qantas Transformation program
• Group well positioned to capitalise on return to more favourable operating environment
• Mitigating external risk through robust hedging program, capex and capacity flexibility
43
Outlook
• Current Group operating expectations:
– Qantas Group capacity expected to increase by 3-4% in 1H16 compared to 1H15
– Group Domestic capacity expected to increase by 0-1% in 1H16 compared to 1H15
– International capacity increase driven by utilisation, new route launches, B787-8 transition
– FY16 Underlying fuel costs expected to be no more than $3.94b1, $3.642b at current forward AUD prices
– FY16 depreciation and amortisation expense expected to increase by ~$100m to $1.2b
– FY16 Transformation benefits (cost, fuel and revenue) expected to be $450m
– FY16 net capital expenditure to be between $0.9b and $1b
• No Group profit guidance provided at this time due to the high degree of volatility and uncertainty in global economic conditions, fuel prices and FX rates
1. Worst case total fuel cost based on a 2-standard deviation move in Brent forward market prices to A$100/bbl, for the remainder of FY16. 2. Current forward market price total fuel cost based on a Brent forward market price of A$71/bbl for remainder of FY16.
44
This Presentation has been prepared by Qantas Airways Limited (ABN 16 009 661 901) (Qantas). Summary information This Presentation contains summary information about Qantas and its subsidiaries (Qantas Group) and their activities current as at 20 August 2015. The information in this Presentation does not purport to be complete. It should be read in conjunction with the Qantas Group’s other periodic and continuous disclosure announcements lodged with the Australian Securities Exchange, which are available at www.asx.com.au. Not financial product advice This Presentation is for information purposes only and is not financial product or investment advice or a recommendation to acquire Qantas shares and has been prepared without taking into account the objectives, financial situation or needs of individuals. Before making an investment decision prospective investors should consider the appropriateness of the information having regard to their own objectives, financial situation and needs and seek legal and taxation advice appropriate to their jurisdiction. Qantas is not licensed to provide financial product advice in respect of Qantas shares. Cooling off rights do not apply to the acquisition of Qantas shares. Not tax advice Tax implications for individual shareholders will depend on the circumstances of the particular shareholder. All shareholders should therefore seek their own professional advice in relation to their tax position. Neither Qantas nor any of its officers, employees or advisers assumes any liability or responsibility for advising shareholders about the tax consequences of the return of capital and/or share consolidation Financial data All dollar values are in Australian dollars (A$) and financial data is presented within the twelve months ended 30 June 2015 unless otherwise stated. Future performance Forward looking statements, opinions and estimates provided in this Presentation are based on assumptions and contingencies which are subject to change without notice, as are statements about market and industry trends, which are based on interpretations of current market conditions. Forward looking statements including projections, guidance on future earnings and estimates are provided as a general guide only and should not be relied upon as an indication or guarantee of future performance. An investment in Qantas shares is subject to investment and other known and unknown risks, some of which are beyond the control of the Qantas Group, including possible delays in repayment and loss of income and principal invested. Qantas does not guarantee any particular rate of return or the performance of the Qantas Group nor does it guarantee the repayment of capital from Qantas or any particular tax treatment. Persons should have regard to the risks outlined in this Presentation. No representation or warranty, express or implied, is made as to the fairness, accuracy, completeness or correctness of the information, opinions and conclusions contained in this Presentation. To the maximum extent permitted by law, none of Qantas, its directors, employees or agents, nor any other person accepts any liability, including, without limitation, any liability arising out of fault or negligence, for any loss arising from the use of the information contained in this Presentation. In particular, no representation or warranty, express or implied is given as to the accuracy, completeness or correctness, likelihood of achievement or reasonableness of any forecasts, prospects or returns contained in this Presentation nor is any obligation assumed to update such information. Such forecasts, prospects or returns are by their nature subject to significant uncertainties and contingencies. Before making an investment decision, you should consider, with or without the assistance of a financial adviser, whether an investment is appropriate in light of your particular investment needs, objectives and financial circumstances. Past performance Past performance information given in this Presentation is given for illustrative purposes only and should not be relied upon as (and is not) an indication of future performance. Not an offer This Presentation is not, and should not be considered, an offer or an invitation to acquire Qantas shares or any other financial products. ASIC GUIDANCE In December 2011 ASIC issued Regulatory Guide 230. To comply with this Guide, Qantas is required to make a clear statement about whether information disclosed in documents other than the financial report has been audited or reviewed in accordance with Australian Auditing Standards. In line with previous years, this Presentation is unaudited. Notwithstanding this, the Presentation contains disclosures which are extracted or derived from the Consolidated Financial Report for the year ended 30 June 2015 which is being audited by the Group’s Independent Auditor and is expected to be made available in August 2015.
Disclaimer & ASIC Guidance


![Announces Q4 & FY15 results [Result]](https://img.pdfslide.us/doc/110x75/577cb3551a28aba7118c3d58/announces-q4-fy15-results-result.jpg)