Embed Size (px)
Citation preview
qadlk
I IAd) 7)/ J>'-v7S~I
TECHNICAL REPORT NO. 11741' I
SPERFORMANCE STANDARDS AND SPECIFICATIONS
I FOR AUTOMOTIVE BRAKES
IIORA
S~January 1973
S~Reproduced From
S~Best Available Copy
I
JOSEPH J. MIKAILA,"
Distribution of th'is document •:is unlimited.,L.'
CI -0I. iI
IVEHICULAR COMPONENTS. & MATERIALS LABORATORY
US ANaUO
Io00 w TO8
The findings In this report are not to beconstrued as an ofticial Department of theArmy position, uol.,ss so de.signated by otherauthorized documents.
The citation of commercial produotsin this reporl does riot consititutean official indorsemient or approvalof such products.
Desrcy th;I r,' .,r , • t , tM~t DO M Murm t t•,te rý,,tr
TECHNICAL REPORT NO. 11741
PERFORMANCE STANDARDS AND SPECIFICATIONS
FOR AUTOMOTIVE BRAKES
BY
JOSEPH J. MIKAILA
JANUARY 1973
AMCMS CODE: 728012.16
PROJECT NO. 4714306
US ARMY TANK-AUTOMOTIVE COMMANDRESEARCH, DEVELOPMENT AND ENGINEERING DIRECTORATE
VEHICULAR COMPONENTS AND MATERIALS DIVISIONAUTOMOTIVE COMPONENTS BRANCH
MECHANICAL FUNCTION
ACKNOWLEDGEMENT
The assistance, helpful suggestions and vast knowledgeof the state-of-the-art of dynamometer and vehiclebrake testing of Mr. R. J. Forthofer, Mr. J. D. Prestonand Mr. Radlinski of the Safety Systems Laboratory,National Highway Traffic Safety Administration, aregratefully acknowledged by Joseph Mikaila, U. S. ArmyTank-Automotive Command, Mechanical Laboratory TestEngineer. Without their assistance this program couldnot have been completed within the original designatedtime frame and funding.
ii
ABSTRACT
This is a report of an effort to develop a laboratory testprocedure for measuring the performance of a brake assemblyand individual components on a brake dynamometer. Thisreport presents a test procedure that measures brake retardingtorque vs temperature, brake retarding torque vs speed, brakelining wear rate and moisture sensitivity.
iii
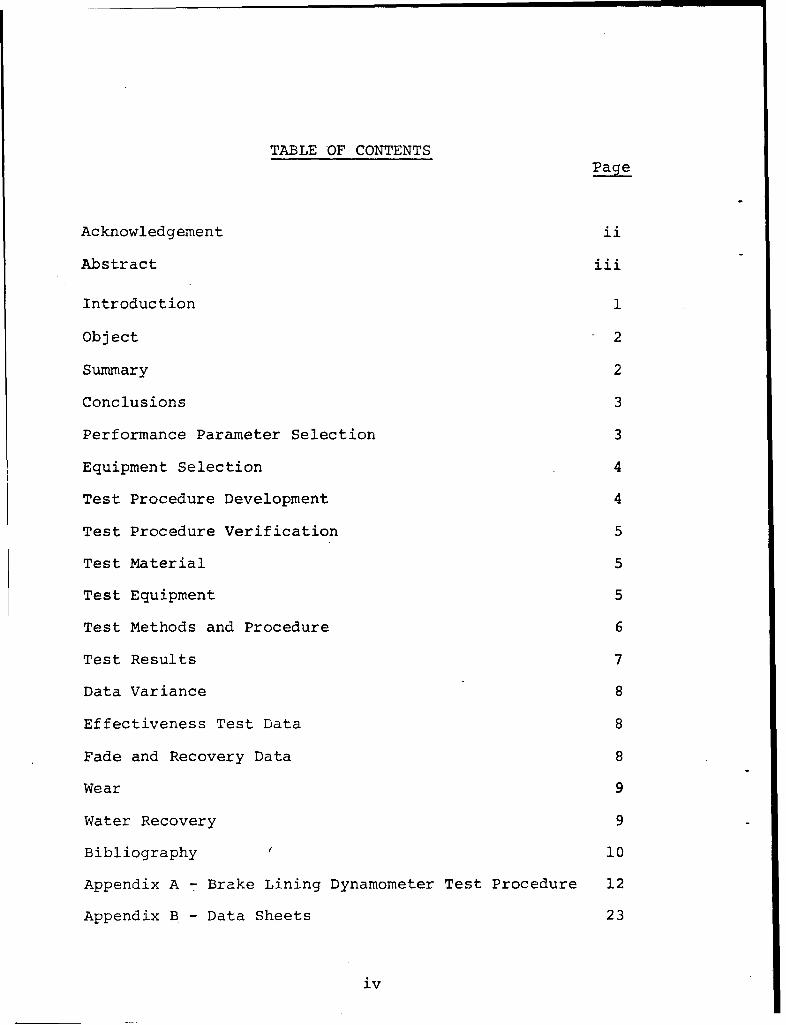
TABLE OF CONTENTS
Acknowledgement ii
Abstract iii
Introduction 1
Object 2
Summary 2
Conclusions 3
Performance Parameter Selection 3
Equipment Selection 4
Test Procedure Development 4
Test Procedure Verification 5
Test Material 5
Test Equipment 5
Test Methods and Procedure 6
Test Results 7
Data Variance 8
Effectiveness Test Data 8
Fade and Recovery Data 8
Wear 9
Water Recovery 9
Bibliography 10
Appendix A - Brake Lining Dynamometer Test Procedure 12
Appendix B - Data Sheets 23
iv
INTRODUCTION
The need for performance standards and specificationsfor automotive brakes arises from the fact thatcurrently the only method for evaluating brake liningsis through full vehicle tests in accordance withMilitary Test Procedure 2-2-608.
This is an expensive method costing from $15,000 to$25,000 per test, depending on vehicle size. PreviousFederal Specifications for replacement brake lining,such as HH-L-361b, were ineffective because theytested one-inch square samples of brake linings andthen categorized the resulting hot and cold frictioninto four or five categories. The fallacy to thismethod was the fact that a one-inch square sampledoes not perform the same as a complete piece of brakelining.
Since vehicle tests are expensive, and the policy ofthe Department of the Army is to have competitiveprocurement wherever possible, it was decided todevelop a laboratory method which would allow for quickand effective evaluation of brake linings.
1
OBJECT
Develop a quick, effective and low cost method fordefining performance standards and specifications forautomotive brakes. The primary use of this testshould be to evaluate brake linings, though it shouldbe just as effective for evaluation of brake drums,backing plates and other brake assembly components.
SUMMARY
1. A study was made of the various methods ofevaluating brake linings.
2. The inertia dynamometer was chosen as the toolfor brake performance evaluation.
3. An inertia dynamometer test procedure was written.
4. A program of both -vhicle and dynamometer testingwas undertaken. The results of this test program showthat the dynamron :er test results correlate withvehicle test results.
CONCLUSIONS
The test procedure generated by this program is avalid tool for evaluation of brake assembly components,in particular brake linings. A brake lining thatprovides "or equal" performance to original equipment(OE) lining on the inertia dynamometer will alsoperform as well as the OE lining on a vehicle withrespect to coefficient of friction, wear and watersensitivity characteristics.
PERFORMANCE PARAMETER SELECTION
To define the performance of a brake lining it wasnecessary to select performance characteristicswhich are to be measured4 After a literature andbrake industry survey, it was decided that the threecharacteristics that bracket a brake lining performanceare:
a. Coefficient of friction vs. temperature andrubbing speed.
b. Wear rate at constant work.
C. Water sensitivity.
3
EQUIPMENT SELECTION
The four main pieces of laboratory test. apparatus forevaluation of brake linings had been previouslyinvestigated by the Office of Vehicle Safety Research,National Bureau of Standards. The evaluation of theSAE J661 Friction Machine, the FAST machine, theGirling scale dynamometer and the inertia brakedynamometer showed that only the brake dynamometer testresults correlated closely with vehicle performance.The findings are presented in the Bibliographys Item #9.
TEST PROCEDURE DEVELOPMENT
Once the inertia dynamometer was selected as the testapparatus to be used to measure brake lining performancecriteria, a survey was made of industrial and governmenttest procedures. There was not too much difference inthese test procedures since they all contained thebasic requirements for burnishing, effectiveness, fade,recovery and wear. The test procedure that wasdecided on is shown in the Appendix. It is similar tocommercial test procedures with the exception that thedetails are applicable to peculiarities, such as lowtop speed, of mililary vehicles.
4
TEST PROCEDURE VERIFICATION
A program was undertaken to verify the proposeddynamometer test procedure.
Original equipment and five proposed replacement brakelining materials were tested on a M151-A2 truck andalso on a single end inertia dynamometer. The dynamometerwas used to determine braking performance of theoriginal equipment brake lining and of the replacementlinings for "or equal" evaluation. The cold effective-ness, fade and recovery, water recovery and wearproperties of the materials were used to establish therelative performance. Vehicle road tests used asimilar test procedure to generate data for comparisonto the inertia dynamometer test results for validationof the dynamometer test procedure.
This work was performed by the National Traffic HighwaySafety Administration, Department of Transportation,since USATACOM did not possess an operational brakedynamometer at that time.
The findings of this test program are presented intheir entirety in Bibliography item #10.
A digest of the test is presented below:
A. Test Material
1. Original equipment brake lining designatedCode E.
2. Five replacement brake linings designatedCodes A, B, C, D and F.
3. All brake linings were 9-7/8 X 2 inchsegments, 18-1/4 inch2 contact area per segment,riveted attachments, 14 rivets per segment.
4. Front and rear duo servo brake assembliesof the M151-A2 identical, except front assembly had1 inch diameter wheel cylinder and rear assembly had3/4 inch diameter wheel cylinder.
All tests were performed with new brake linings
and drums.
B. Test Equipment
5
1. Dynamometer. The Inertia Brake Dynamometerused was a dual-end dynamometer, having a brake stationat either end of a rotating shaft. However, all testsconducted during this investigation were single-endtests, with front and rear brakes being testedseparately. Brake performance test data was continuouslyrecorded on a 24 channel oscillographic chart recorder.Only five data channels were used for these tests;namely, shaft speed, brake torque, brake line pressure,brake drum temperature and brake lining temperature.The dynamometer brake assembly included a vehicle wheelmounted to the brake drum by the mounting lugs to moreclosely simulate cooling air flow to that of thevehicle brake.
2. Vehicle -- 1/4 ton 4X4 Truck. The M151-A2was instrumented to measure the following variablesto describe braking system performance:
a. Vehicle speed
b. Vehicle deceleration
c. Hydraulic line pressure
d. Temperature of secondary brakelinings in each of the four brakes
e. Temperature of the right front andright rear brake drums.
3. Brake Wettin2 System. In order to runwater recovery tests in the lining evaluation tests, itwas necessary to build a brake wetting system. Anozzle consisted of 1/4 inch ccrper tubing brazed to afitting which was screwed into the backing plate of allof the brake assemblies used for the test. The nozzleextended approximately 1 inch into the brake. A watertank was installed on the M151-A2 to provide waterduring the vehicle tests.
C. Test Methods and Procedu.re
1. Both vehicle and Qynamometer tests wereconducted in acco::cEnce with dynamometer test procedureof the Appendix.
6
2. Three vehicle tests were performed for theOE lining. One vehicle test was performed for each ofthe five replacement linings.
3. Three front and three rear dynamometer testswere performed for the OE lining. One front and onerear dynamometer test was performed for each of the fivereplacement linings.
D. Test Results
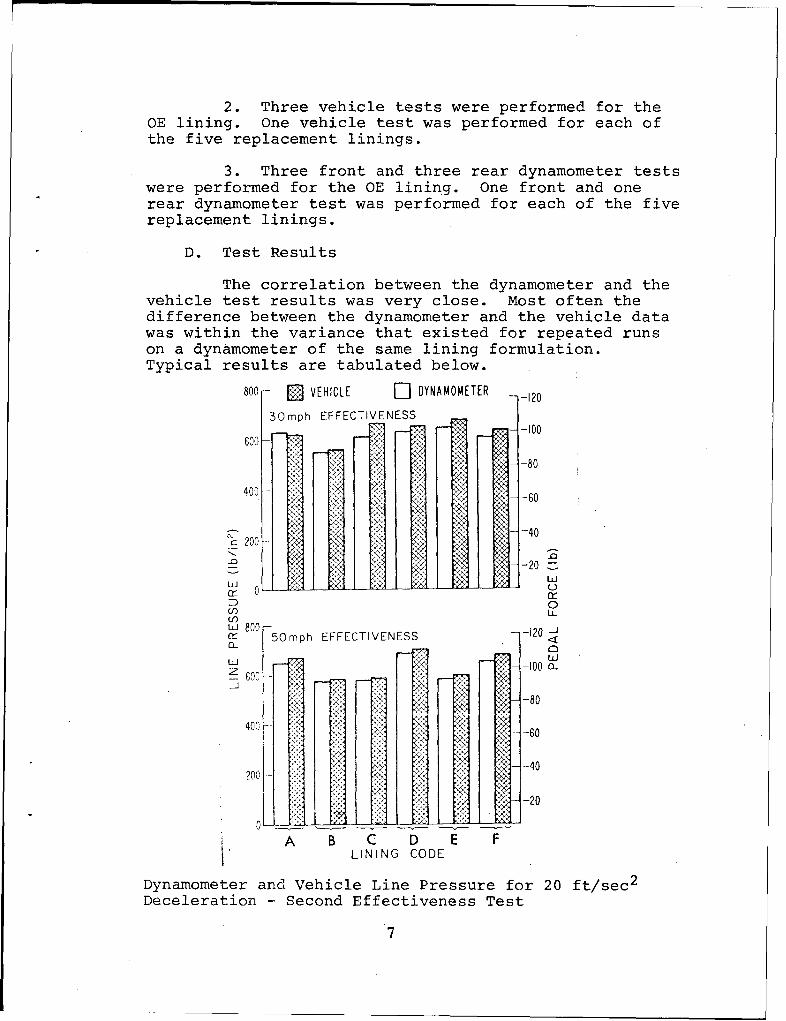
The correlation between the dynamometer and thevehicle test results was very close. Most often thedifference between the dynamometer and the vehicle datawas within the variance that existed for repeated runson a dynamometer of the same lining formulation.Typical results are tabulated below.
800- E] VEHICLE [-"] DYNAMOMETER -120
30mph EFFECTIVENESS
600-
4 00 - x.•, , .:1 IS... • :• ,•-60
4000
-200 -
ULirC 0"D 0
U9 U-
800-50mph EFFECTIVENESS -120 -J
2 600 -100 o-_
-80
400
20C, -4
0 L~.-20A B C D E F
LINING CODE
Dynamometer and Vehicle Line Pressure for 20 ft/sec2
Deceleration - Second Effectiveness Test
7
DISCUSSION
A. Data Variance
The Safety Systems Laboratory of the NationalHighway Safety Administration has found from previoustesting that the repeatability that can be expectedbetween two or more dynamometer tests, performed onthe same machine, are in the order of + 10%.
B. Effectiveness Test Data
Of the three effectiveness tests performed,Preburnish effectiveness data is the least reliable.This data is greatly influenced by the fit of the drumand lining. This data is also greatly influenced bythe variance of drum finish, lining grind, drumdiameter and lining radius. The best measure of liningeffectiveness are the second and final effectivenesstests. The test results of organic linings, as a rule,will show a sizeable reduction in brake effectivenessbetween Preburnish and final effectiveness.
C. Fade and Recovery Data
Test results have shown that the maximum disagree-.ent betwee• dynamometer and vehicle data exists for
recovery tests. This is most likely the result ofdifferences in maximum temperature reached during thefade test. Even a 30' to 500 F. variation in maximumfade temperature reached, can result in delayed fadewhich will produce a different recovery curve.Interpretation of dynamometer fade and recovery testresults with respect to total vehicle performance isnot easily perfornicd. The dynamometer test, asperformed here in a single-end mode, assumes constanttorque distribution between the front and rear axles.In actual practice this is not the case, since by the15th fade stop there usually exists a large temperaturevariation between the front and rear brakes whichresults in a change in actual torque distribution.Therefore, absolute comparison between vehicledynamometer data cannot be made in this area. Never-theless, since the purpose of this test is to rankbrake linings for "or equal" performance criteria,
8
• rls, : ffeac-`, -L' sczredibility of the test
In interpreting wear data it is important tosepatate the wear experienced during the effectivenessand fade and recovery portion of the test from thatexperienced during the wear portion. A high wear rateduring the effectiveness and fade-recovery portion maymean that that lining experiences a high wear rate athigh temperatures which are the results of fade tests.Since fade level temperatures are experiencedinfrequently in actual vehicle operation, acceptanceor rejection of brake linings should be based more onthe wear test data results. It should be noted thatthe wear data does not pretend to convert to actualvehicle wear mileage, since this is the result of thein-service use that the vehicle is subjected to.However, the wear data obtained is a valid tool for"or equal" comparison.
E. Water Recovery
In interpreting water recovery test results, itis more important to look at the number of stops tobase line rather than the brake pressure during thefirst two applications.
9
BIBLIOGRAPHY
1. A. E. Anderson, Serge Gratch and Hayden P. Hayes, A NewLaboratory Friction and Wear Test for the Characteriz-tion of Brake Linings, SAE Paper 670079.
2. Albin J. Barkman, A Laboratory Method for Testing MoistureSensitivity of Brake Lining Materials, SAE Paper 488A
3. James M Herring, Jr., Mechanism of Brake Fade in OrganicBrake Lining, SAE Paper 670146.
4. Saul Herscovici, Determining the Static and Dynamic Co-efficient of Friction and Its Causes for Variation, SEAPaper 690570.
5. D. W. Howard and J. L. Winge, An Automatic ProgrammedQuadruple Dynamometer for Vehicle Brake Testing, SAE Paper670144
6. M. G. Jacko, W. M. Spurgeon, R. M. Rusnak, and S. B.Catalano, Thermal Stability and Fade Characteristics ofFriction Materials, SAE Paper 680417
7. J. D. Preston, An Evaluation of the Friction MaterialsTest Machine (SAE J661a) and Test Procedures, NationalBureau of Standards Report 10-540.
8. J. D. Preston, Inertia Dynamometer Evaluation of BrakeLining Materials, SAE Paper 730192
9. J. D. Preston and R. J. Forthofer, Correlation of Vehicle,Dynamometer and Other Laboratory Tests for Brake FrictionMaterials, SAE Paper 710250
10. J. D. Preston, R. W. Rodlinski and R. J. Forthofer, BrakeLining Evaluation Test of Replacement Friction Materlsfor the M151-A2, 1/4 Ton Truck, Volume I and II, NationalHighway Traffic Safety Administration Memorandum ReportB-15.
R0 I, Rusnak and W. M. Spurgeon, Friction Material Test-in;, SAE Paper 700517.
12. A. R. Silencer and W. M. Spurgeon, A Review of ProgressWith Some Recently Developed Techniques for FrictionMaterial Evaluation, SAE Paper 670081.
i0
13. A. R. Spencer, W. M. Spurgeon and J. L. Winge, FourTests for Consistency of Automotive Brake Linings,SAE Paper 660412
14. A. L. Wilson and G. T. Bowsher, Machine Testing forBrake Lining Classification, SAE Paper 710249.
11
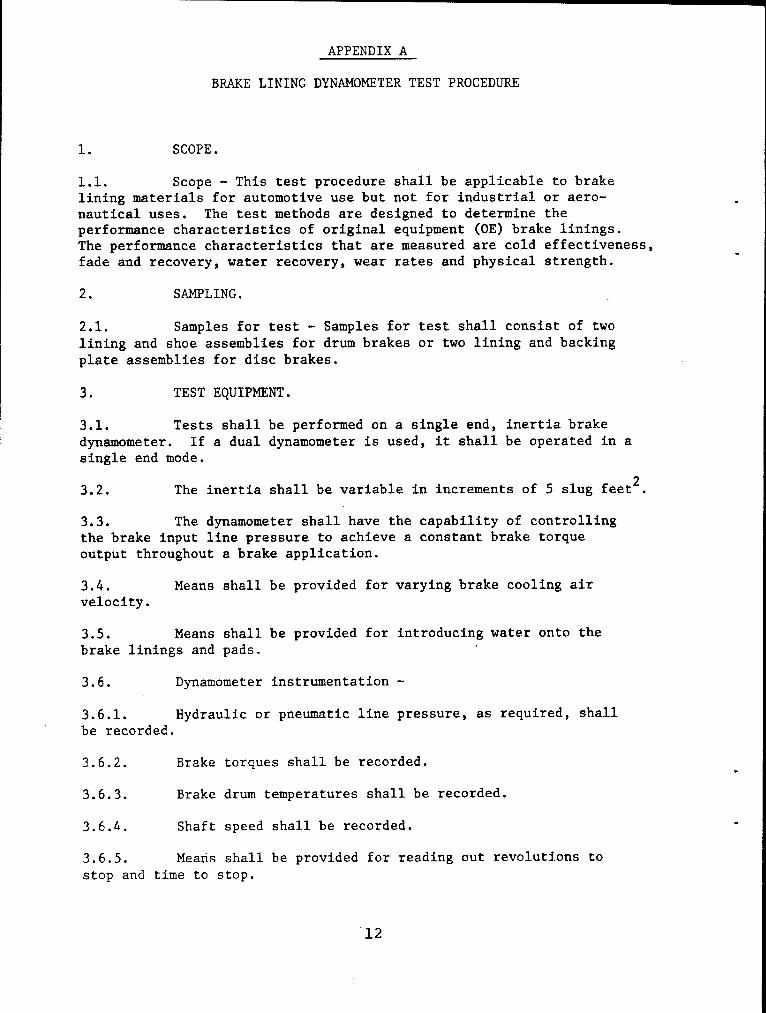
APPENDIX A
BRAKE LINING DYNAMOMETER TEST PROCEDURE
1. SCOPE.
1.1. Scope - This test procedure shall be applicable to brake
lining materials for automotive use but not for industrial or aero-
nautical uses. The test methods are designed to determine the
performance characteristics of original equipment (OE) brake linings.
The performance characteristics that are measured are cold effectiveness,
fade and recovery, water recovery, wear rates and physical strength.
2. SAMPLING.
2.1. Samples for test - Samples for test shall consist of two
lining and shoe assemblies for drum brakes or two lining and backing
plate assemblies for disc brakes.
3. TEST EQUIPMENT.
3.1. Tests shall be performed on a single end, inertia brake
dynamometer. If a dual dynamometer is used, it shall be operated in a
single end mode.
3.2. The inertia shall be variable in increments of 5 slug feet 2 .
3.3. The dynamometer shall have the capability of controlling
the brake input line pressure to achieve a constant brake torque
output throughout a brake application.
3.4. Means shall be provided for varying brake cooling air
velocity.
3.5. Means shall be provided for introducing water onto the
brake linings and pads.
3.6. Dynamometer instrumentation -
3.6.1. Hydraulic or pneumatic line pressure, as required, shall
be recorded.
3.6.2. Brake torques shall be recorded.
3.6.3. Brake drum temperatures shall be recorded.
3.6.4. Shaft speed shall be recorded.
3.6.5. Means shall be provided for reading out revolutions to
stop and time to stop.
12
3.6.6. Fluid displacement shall be recorded for hydraulic brakes.
3.6.7. The overall system accuracy for all recording and indicatinginstrumentation shall be + 2% or better.
4. TEST PREPARATION.
4.1. Brake drums or discs - New drums or discs shall be used foreach test. Surface finish, dimensional characteristics (wall thicknessvariation and runout) shall be within the tolerances specified byordnance drawings. Material composition and properties shall be inaccordance with ordnance drawings.
4.2. Friction material - The linings shall be visually inspectedfor workmanship and defects. Dimensions and placement of the frictionmaterial on the brake shoes and brake pads shall be in accordance withordnance drawings.
4.3. Thermocouple installation - Either of the methods describedin paragraphs 4.3.1. and 4.3.2. may be used for installation thermocouples.
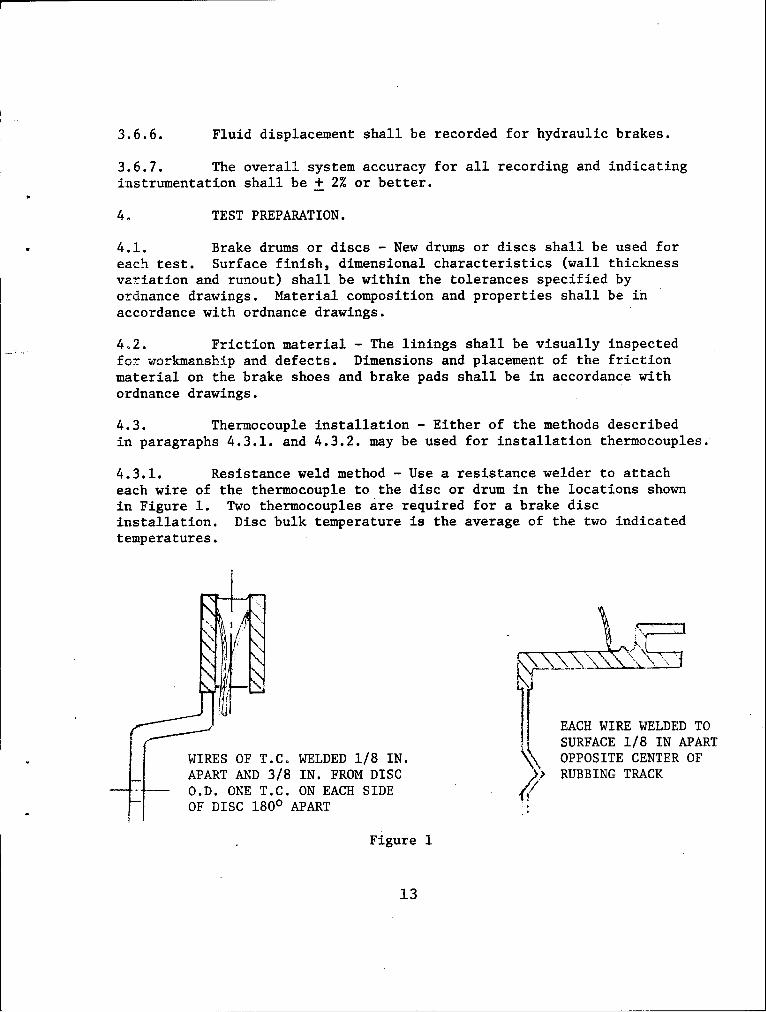
4.3.1. Resistance weld method - Use a resistance welder to attacheach wire of the thermocouple to the disc or drum in the locations shownin Figure 1. Two thermocouples are required for a brake discinstallation. Disc bulk temperature is the average of the two indicatedtemperatures.
EACH WIRE WELDED TOSURFACE 1/8 IN APART
WIRES OF T.C. WELDED 1/8 IN. OPPOSITE CENTER OFAPART AND 3/8 IN. FROM DISC % RUBBING TRACK
-- O.D. ONE T.C. ON EACH SIDEOF DISC 1800 APART
Figure 1
13
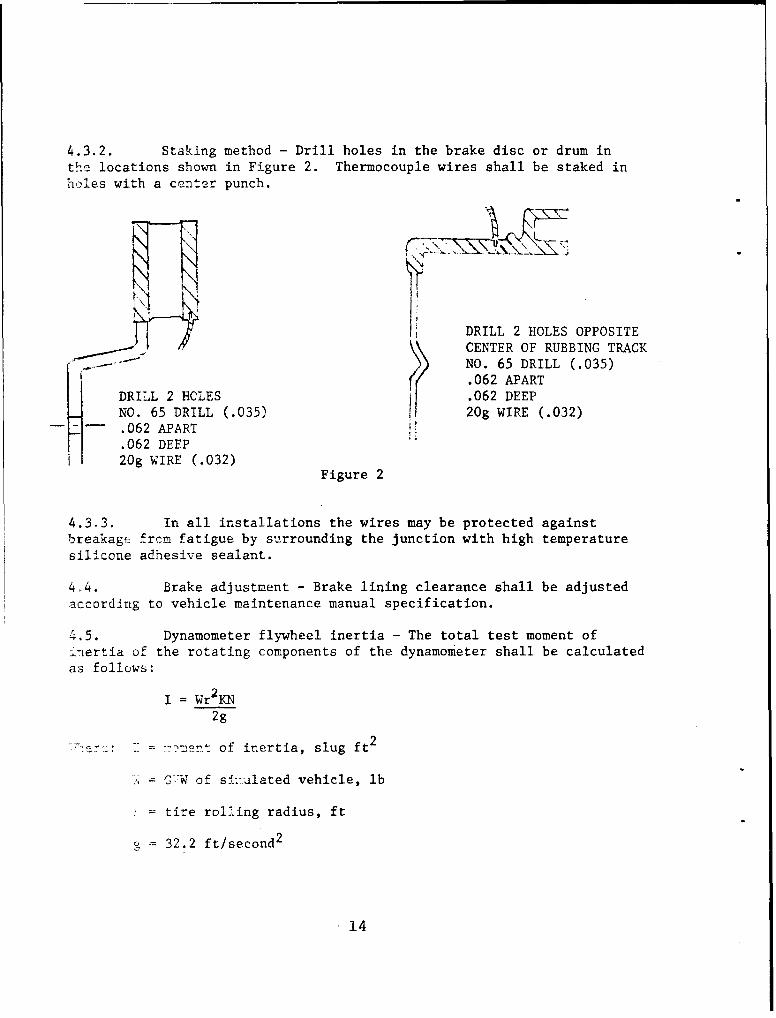
4.3.2. Staking method - Drill holes in the brake disc or drum inth-e locations shown in Figure 2. Thermocouple wires shall be staked inholes with a center punch.
DRILL 2 HOLES OPPOSITECENTER OF RUBBING TRACKNO. 65 DRILL (.035).062 APART
DRILL 2 HOLES .062 DEEPNO. 65 DRILL (.035) 20g WIRE (.032).062 APART.062 DEEP20g WIRE (.032)
Figure 2
4.3.3. In all installations the wires may be protected againstbreakage from fatigue by surrounding the junction with high temperature
silicone adhesive sealant.
4,4. Brake adjustment - Brake lining clearance shall be adjustedaccording to vehicle maintenance manual specification.
4.5. Dynamometer flywheel inertia - The total test moment ofinertia of the rotating components of the dynamometer shall be calculatedas follows:
I = Wr2 KN
2g
-r i ent of inertia, slug ft 2
IGW of s±::ulated vehicle, lb
tire rolling radius, ft
32.2 ft/second2
14
N = correction factor for parasitic losses
K = fraction of total braking torque contributed by the brakes
on the axle from which the test brake was taken.
NOTE: Test inertia shall be rounded off to the nearest increment of 5.
4.5.1. Calculation of n - The parasitic drag acting on a movingvehicle varies approximately as the square of the vehicle velocity. Nshall be calculated by determining the coasting deceleration of thevehicle through vehicle tests.
N=a - n
a
Where: a = deceleration used for fade test
n = parasitic deceleration due to drag at average test speed
4.5.1.1. Test shall consist of accelerating the vehicle to maximumspeed, placing the transmission in neutral and measuring decelerationversus speed until the vehicle reaches a stop. Several repeat runsshall be made in opposite directions and results averaged to cancel theeffects of head wind and test site slope. A curve showing the vehiclecoasting deceleration with respect to vehicle velocity shall be plotted.
4.5.1.2. Where it is impractical to measure N, a value of 0.9 maybe substituted.
4.5.2. Calculation of K - Brake torque distribution must be in theratio of the wheel cylinder areas.
A1
AT
Where: A = wheel cylinder or caliper piston area of brakes on axlefrom whicQ test brake has been removed.
AT = wheel cylinder or caliper piston area for all brakes onvehicle.
4.6. Pedal force line pressure relationship - A static calibrationshall be made to relate brake line pressure to pedal force. A pedal forcetransducer shall be attached to the vehicle brake pedal and line pressuresshall be recorded for various constant pedal force applications. A
15
calibration curve shall be plotted on the dynamometer test data sheets.
4.7. Test rpm required to simulate the specified vehicle speedsshall be calculated as follows:
14.02 X mphrpm -r
Where: r = tire rolling radius
4.7.1. Tire rolling radius shall be determined by counting thenumber of revolutions of a vehicle tire required to travel a measureddistance and then calculated as follows:
D2wN
Where: D - distance traveled
N = number of revolutions
4.8. Test deceleration - All brake stops during the procedure shallmaintain a constant brake torque output which results in a constantdeceleration. All specified decelerations shall be the rate of change invelocity (slope of velocity/time curve) measured from the time brakereaches the preset torque to the time where the rpm is equivalent to5 mph. The relationship between deceleration and torque is as follows:
T = W arg
Where: T = total brake torque (lb ft)
W = vehicle test w;eight (lb)
g = 32.2 ft/second-
a = deceleration produced by brakes (ft/second2 )
r - tire rolling radius (ft)
".9. Brake cooling air velocity determination - To correctly6.rm-Iate vehicle brake duty cycles on an inertia dynamometer it isnel.essary to adjust the cooling airflow over the dynamometer brake to a
16
value which will match the cooling airflow of the vehicle.
4.9.1. Instrumentation -
4.9.1.1. Temperature - Drum or disc temperature shall be measuredon the vehicle by means of thermocouples installed on all brake drumsor discs as specified in paragraph 4.3.
4.9.1.2. Deceleration - Vehicle deceleration shall be measured bymeans of U-tube decelerometer which shall be mounted on the vehiclewindshield in front of the driver. Deceleration value shall be cor-rected for vehicle tip.
4.9.1.2.1. Vehicle "tip measurement - Pictures shall be taken ofvehicle at fade test deceleration to determine tip angle, 9, graphi-cally. True deceleration shall be determined as follows:
aT = aa - g SIN 0
Where: aT = true deceleration
a a = apparent deceleration
g - 32.2 ft/sec2
0 - tip angle
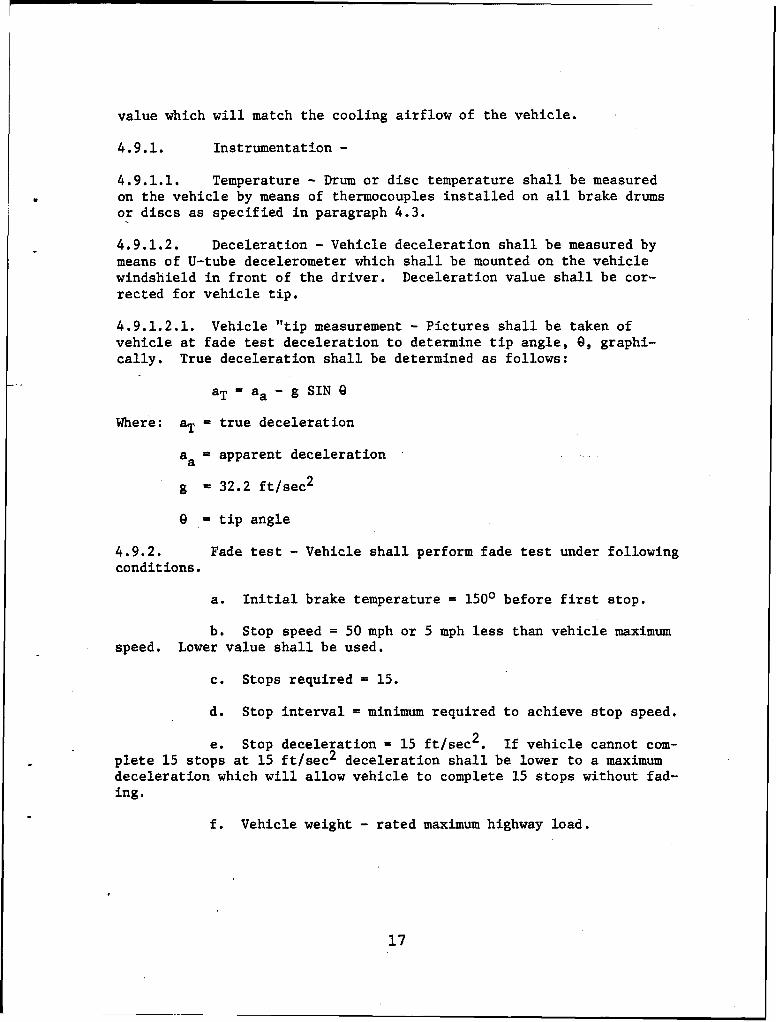
4.9.2. Fade test - Vehicle shall perform fade test under followingconditions.
a. Initial brake temperature = 1500 before first stop.
b. Stop speed = 50 mph or 5 mph less than vehicle maximumspeed. Lower value shall be used.
c. Stops required = 15.
d. Stop interval = minimum required to achieve stop speed.
e. Stop deceleration = 15 ft/sec2 . If vehicle cannot com-plete 15 stops at 15 ft/sec2 deceleration shall be lower to a maximumdeceleration which will allow vehicle to complete 15 stops without fad-ing.
f. Vehicle weight - rated maximum highway load.
17
Record maximum temperature reached on all brake drums or brake discsat completion of 15th stop.
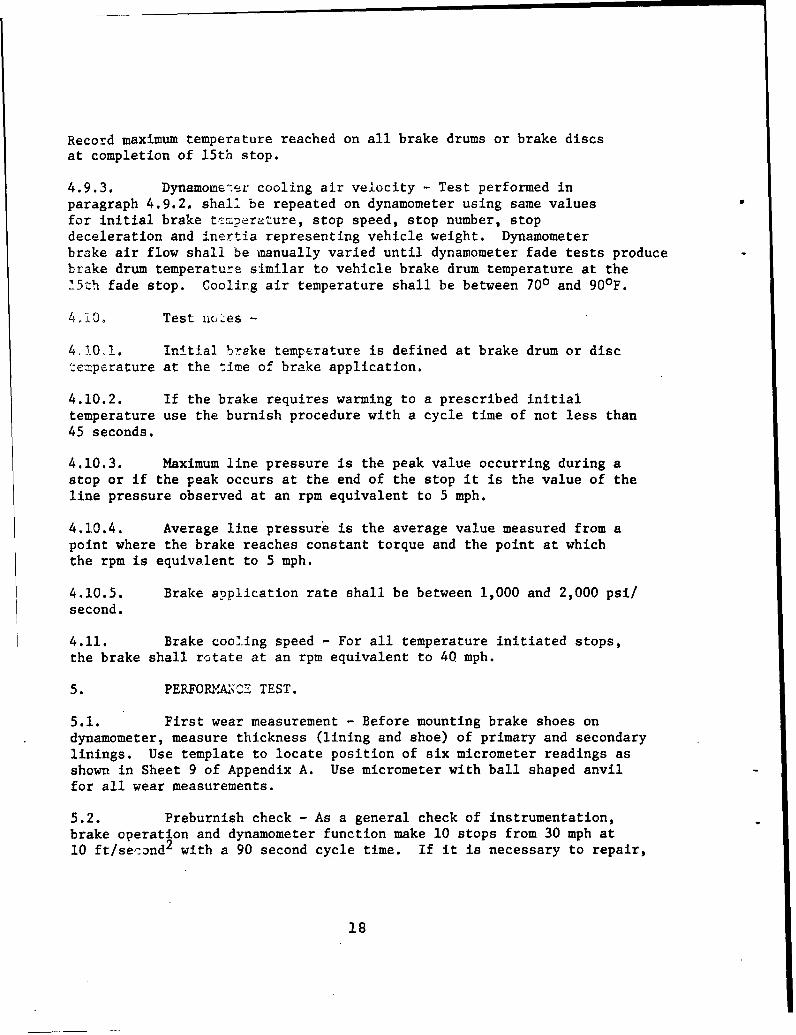
4.9.3. Dynamome'er cooling air velocity - Test performed inparagraph 4.9.2, shall be repeated on dynamometer using same valuesfor initial brake te.mperature, stop speed, stop number, stopdeceleration and inertia representing vehicle weight. Dynamometerbrake air flow shall be manually varied until dynamometer fade tests producebrake drum temperature similar to vehicle brake drum temperature at the25th fade stop. Cooling air temperature shall be between 700 and 90 0 F.
4.10. Test ntes -
4,10,1. Initial brake temperature is defined at brake drum or disctemperature at the time of brake application.
4.10.2. If the brake requires warming to a prescribed initialtemperature use the burnish procedure with a cycle time of not less than45 seconds.
4.10.3. Maximum line pressure is the peak value occurring during astop or if the peak occurs at the end of the stop it is the value of theline pressure observed at an rpm equivalent to 5 mph.
4.10.4. Average line pressure is the average value measured from apoint where the brake reaches constant torque and the point at whichthe rpm is equivalent to 5 mph.
4.10.5. Brake application rate shall be between 1,000 and 2,000 psi/second.
4.11. Brake cooling speed - For all temperature initiated stops,
the brake shall rotate at an rpm equivalent to 40 mph.
5. PERFOR•vAOCE TEST.
5.1. First wear measurement - Before mounting brake shoes ondynamometer, measure thickness (lining and shoe) of primary and secondarylinings. Use template to locate position of six micrometer readings asshown in Sheet 9 of Appendix A. Use micrometer with ball shaped anvilfor all wear measurements.
5.2. Preburnish check - As a general check of instrumentation,brake operation and dynamometer function make 10 stops from 30 mph at10 ft/se,-ond2 with a 90 second cycle time. If it is necessary to repair,
18
replace or adjust any brake or dynamometer system component make notmore than 10 additional stops. If more than a total of 20 stops arerequired for instrumentation, brake and dynamometer function check, thebrake linings or pads and drums or discs must be replaced.
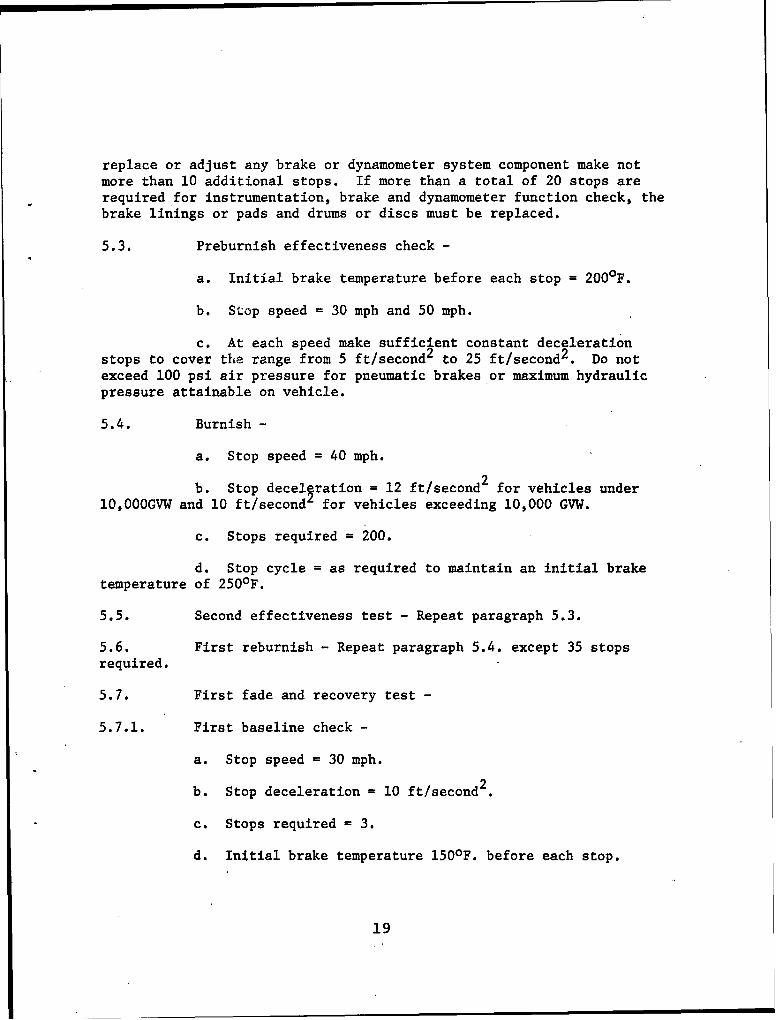
5.3. Preburnish effectiveness check -
a. Initial brake temperature before each stop = 2000 F.
b. Stop speed = 30 mph and 50 mph.
c. At each speed make sufficient constant decelerationstops to cover the range from 5 ft/second2 to 25 ft/second2 . Do notexceed 100 psi air pressure for pneumatic brakes or maximum hydraulicpressure attainable on vehicle.
5.4. Burnish -
a. Stop speed = 40 mph.
b. Stop decelIration = 12 ft/second2 for vehicles under10,OOOGVW and 10 ft/second for vehicles exceeding 10,000 GVW.
c. Stops required = 200.
d. Stop cycle = as required to maintain an initial braketemperature of 250 0 F.
5.5. Second effectiveness test - Repeat paragraph 5.3.
5.6. First reburnish - Repeat paragraph 5.4. except 35 stopsrequired.
5.7. First fade and recovery test -
5.7.1. First baseline check -
a. Stop speed = 30 mph.
2b. Stop deceleration = 10 ft/second
c. Stops required = 3.
d. Initial brake temperature 150 0 F. before each stop.
19
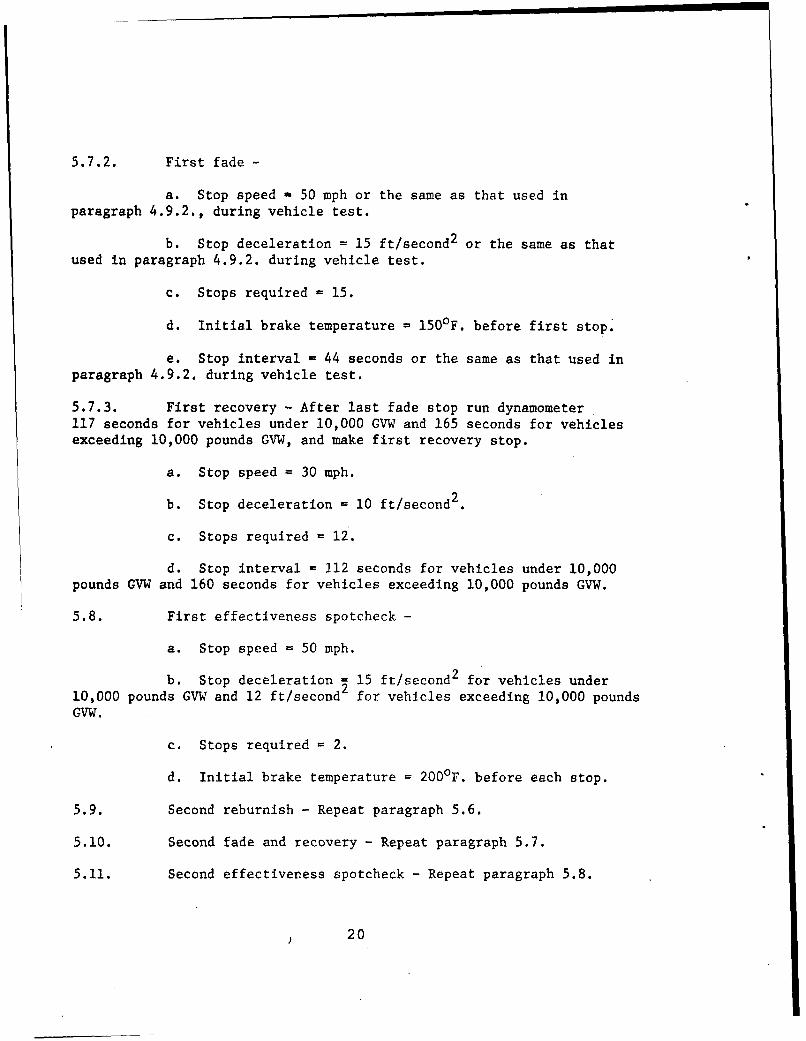
5.7.2. First fade -
a. Stop speed - 50 mph or the same as that used inparagraph 4.9.2., during vehicle test.
b. Stop deceleration = 15 ft/second2 or the same as thatused in paragraph 4.9.2. during vehicle test.
c. Stops required = 15.
d. Initial brake temperature = 150 0 F. before first stop.
e. Stop interval - 44 seconds or the same as that used inparagraph 4.9.2. during vehicle test.
5.7.3. First recovery - After last fade stop run dynamometer117 seconds for vehicles under 10,000 GVW and 165 seconds for vehiclesexceeding 10,000 pounds GVW, and make first recovery stop.
a. Stop speed - 30 mph.
b. Stop deceleration 10 ft/second2 .
c. Stops required 12.
d. Stop interval 112 seconds for vehicles under 10,000pounds GVW and 160 seconds for vehicles exceeding 10,000 pounds GVW.
5.8. First effectiveness spotcheck -
a. Stop speed = 50 mph.
b. Stop deceleration = 15 ft/second2 for vehicles under10,000 pounds GVW and 12 ft/second2 for vehicles exceeding 10,000 poundsGVW.
c. Stops required = 2.
d. Initial brake temperature = 2000 F. before each stop.
5.9. Second reburnish - Repeat paragraph 5.6.
5.10. Second fade and recovery - Repeat paragraph 5.7.
5.11. Second effectiveness spotcheck - Repeat paragraph 5.8.
20
5.12 Third reburnish -
Repeat paragraph 5.6.
5.13 Final Effectiveness
Repeat paragraph 5.3
5.14 Fourth reburnish -
Repeat paragraph 5.6
5.15 Wet brake test -
5.15.1 Baseline -
(a) Stop speed 30 mph.
(b) Stop deceleration = 10 ft/second2
(c) Stops required = 3
(d) Initial brake temperature = 1500 F. before each stop.
5.15.2 Wetting of brakes - with a shaft speed of 72 rpm, open wateringvalve to brake. Allow water to flow for 5 minutes at a flow rate ofapproximately 1/2 to 1 gallon per minute. Close valve and stop dynamom-eter shaft. Detach brake watering tube at the backing plate connection.Fifty (50) seconds after closing water valve, accelerate to test speed.
5.15.3 Water recover - First stop to be performed within 1 minute ofclosing brake watering valve.
(a) Stop speed - 30 mph
(b) Stop deceleration = 10 ft/second
(c) Stops required 15
(d) Stop interval 20 seconds for vehicles under 10,000 lbs.GVW and 30 seconds for vehicles over 10,000 lbs. GVW.
5.15.4 Second wear measurement -
Repeat paragraph 5.1
6.1 Wear test -
6.2 Wear run -
(a) Stop spceed 40 mph
21.
(b) Stop deceleration = 8 ft/second2 and 12 ft/second2 inalternate multiples of 25 stops.
(c) Stops required = 1,000 total.
(d) Initial brake drum temperature - 3000 F. before each stop
6.3 Final wear measurement - Repeat paragraph 5.1
6.4 Wear data shall be presented as three values:
(a) Wear during performance test, paragraph 5 to 5.15.4
(b) Wear during Wear test, paragraph 6 to 6.2
(c) Total wear, paragraphs 5.1 to 6.2.
22
APPENDIX B
DATA SHEETS
23
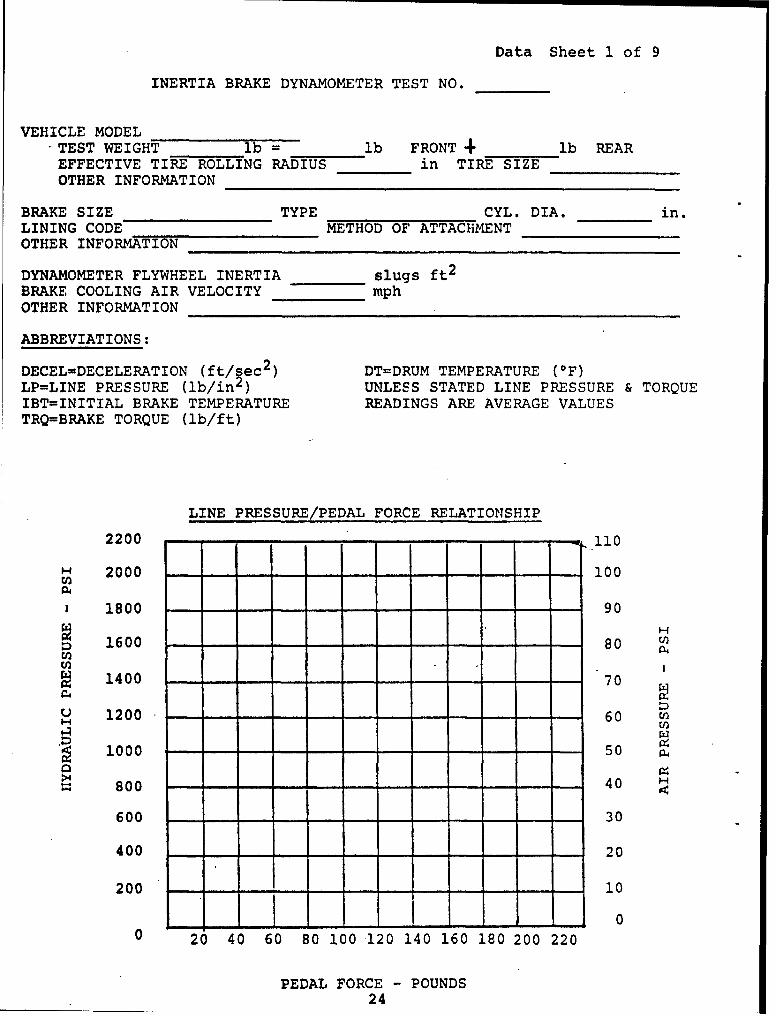
Data Sheet 1 of 9
INERTIA BRAKE DYNAMOMETER TEST NO.
VEHICLE MODEL-TEST WEIGHT lb lb FRONT lb REAREFFECTIVE TIRE ROLLING RADIUS in TIRE SIZEOTHER INFORMATION
BRAKE SIZE TYPE CYL. DIA. in.LINING CODE METHOD OF ATTACHMENTOTHER INFORMATION
DYNAMOMETER FLYWHEEL INERTIA slugs ft2
BRAKE COOLING AIR VELOCITY mphOTHER INFORMATION
ABBREVIATIONS:
DECEL=DECELERATION (ft/sec2 DT=DRUM TEMPERATURE (OF)LP=LINE PRESSURE (lb/in2) UNLESS STATED LINE PRESSURE TORQUEIBT=INITIAL BRAKE TEMPERATURE READINGS ARE AVERAGE VALUESTRQ=BRAKE TORQUE (lb/ft)
LINE PRESSURE/PEDAL FORCE RELATIONSHIP
2200 110
2000 100
1800 90
1600 80 04En
1400 70
1200 60 EnU)
1000 50 a4
Soo 40
600 30
400 20
200 0
00 20 40 60 80 100 -120 140 160 180 200 220
PEDAL FORCE POUNDS24
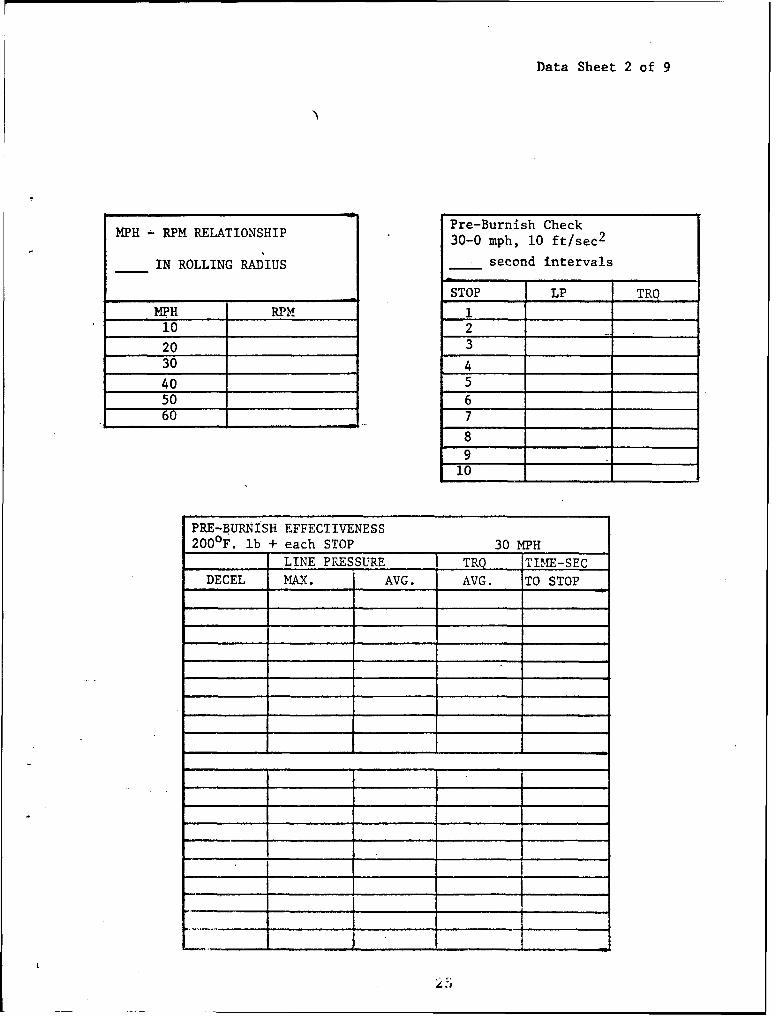
Data Sheet 2 of 9
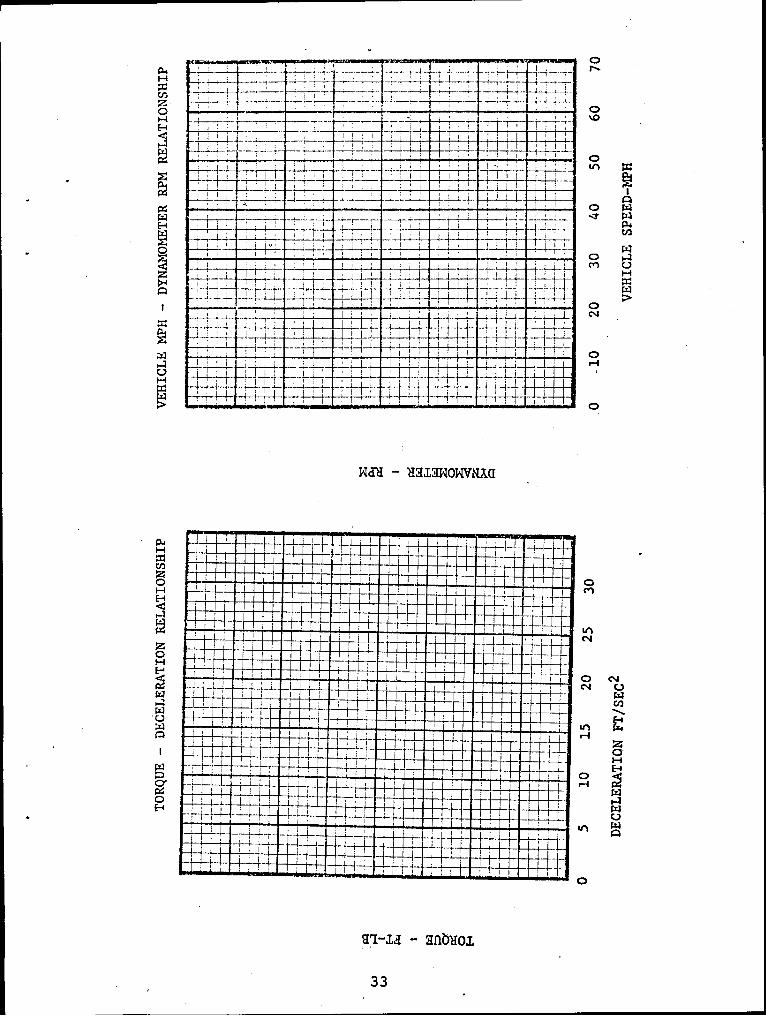
MPH - RPM RELATIONSHIP Pre-Burnish Check30-0 mph, 10 ft/sec2
IN ROLLING RAýIUS second intervals
STOP LP TRQ
MPH RPM 110 2
20 3
30 4
40 5
50 660 7
8910
PRE-BURNiSH EFFECTIVENESS2000F. lb + each STOP 30 MPH
LINE PRESSURE TRQ TIME-SECDECEL MAX. AVG. AVG. TO STOP
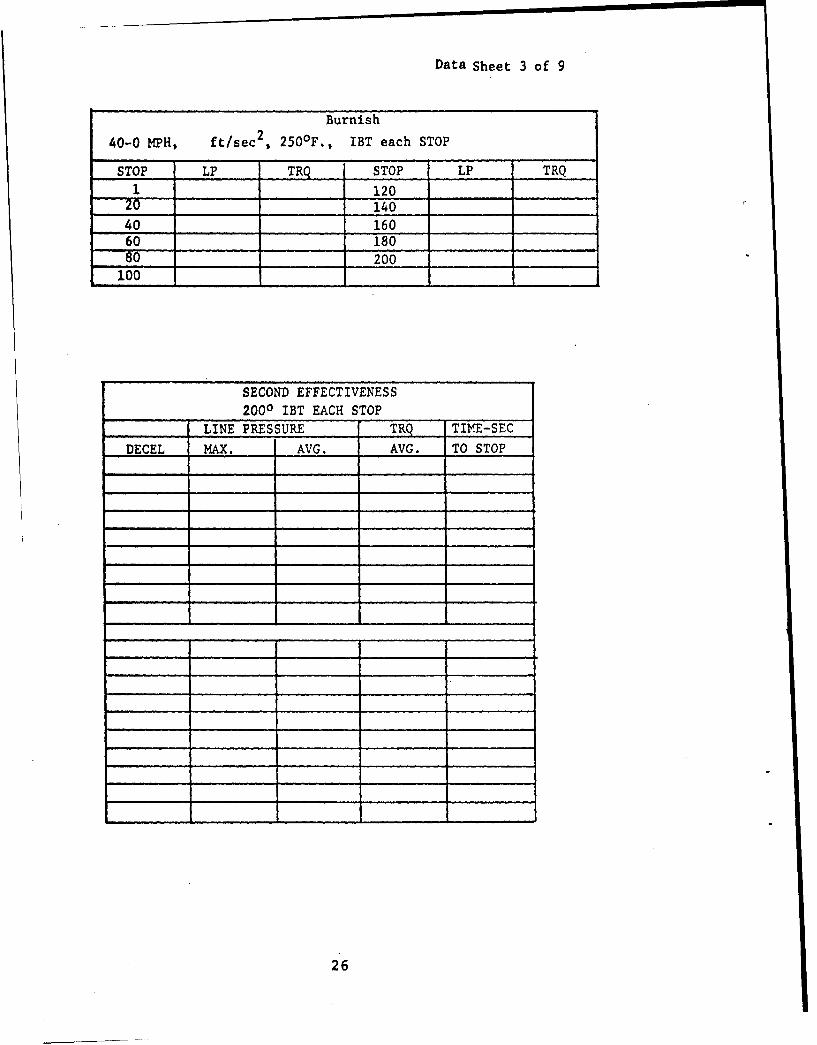
Data Sheet 3 of 9
Burnish
40-0 MPH, ft/sec2 , 250 0 F., IBT each STOP
STOP LP TRQ STOP LP TRQ1 .... 120
20 140
40 16060 ... .. 18080 ,, 200
100 . . .....
SECOND EFFECTIVENESS2000 IBT EACH STOP
LINE PRESSURE TRQ TIME-SEC
DECEL MAX. AVG. AVG. TO STOP
26
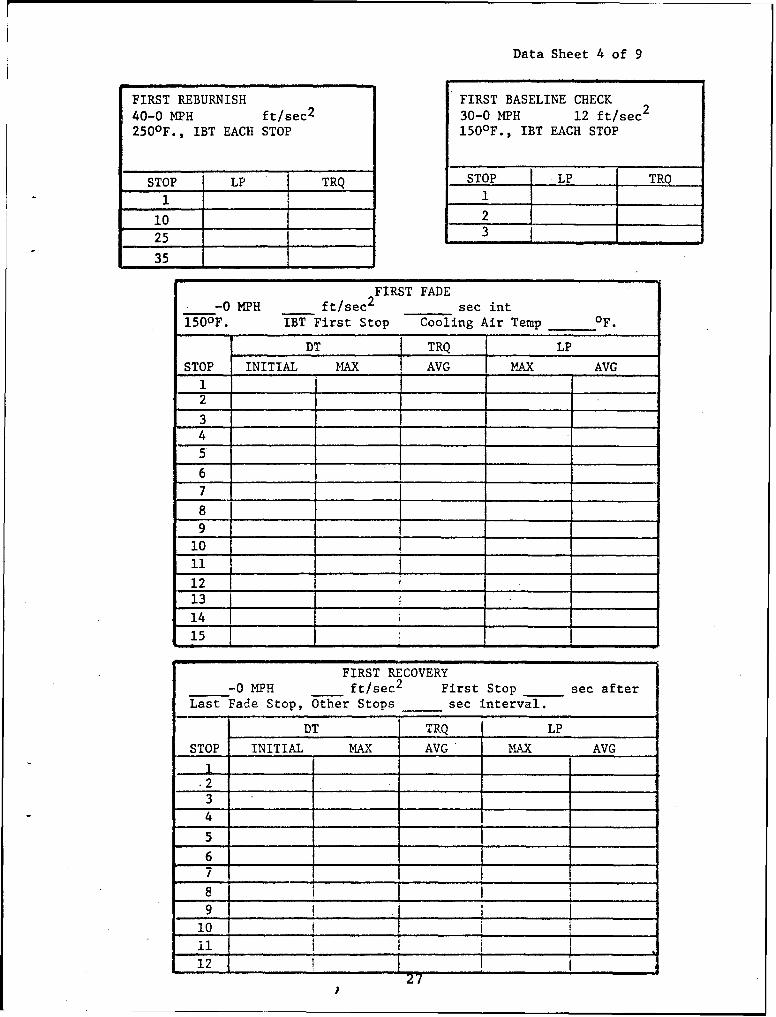
Data Sheet 4 of 9
FIRST REBURNISH FIRST BASELINE CHECK40-0 MPH ft/sec2 30-0 MPH 12 ft/sec2
250 0 F., IBT EACH STOP 150 0 F., IBT EACH STOP
STOP LP 1 TRQ STOP LP TRQ
1 _ _ 1
10 225 ....
35
FIRST FADE-0 MPH ft/sec 2 sec int
1500F. IBT First Stop Cooling Air Temp °_OF.
DT TRQ LP
STOP INITIAL MAX AVG MAX AVG12
34
5
67
8
9
12 i13 ]14 !
15
FIRST RECOVERY-0 MPH ft/sec2 First So e fe
Last Fade Stop, Other Stops sec interval.
S,, DT TRQ LP
STOP INITIAL MAX AVG' MAX AVG
.234
6
r-o72715 _______ 27
6 I _______ ...._____ !______ ______
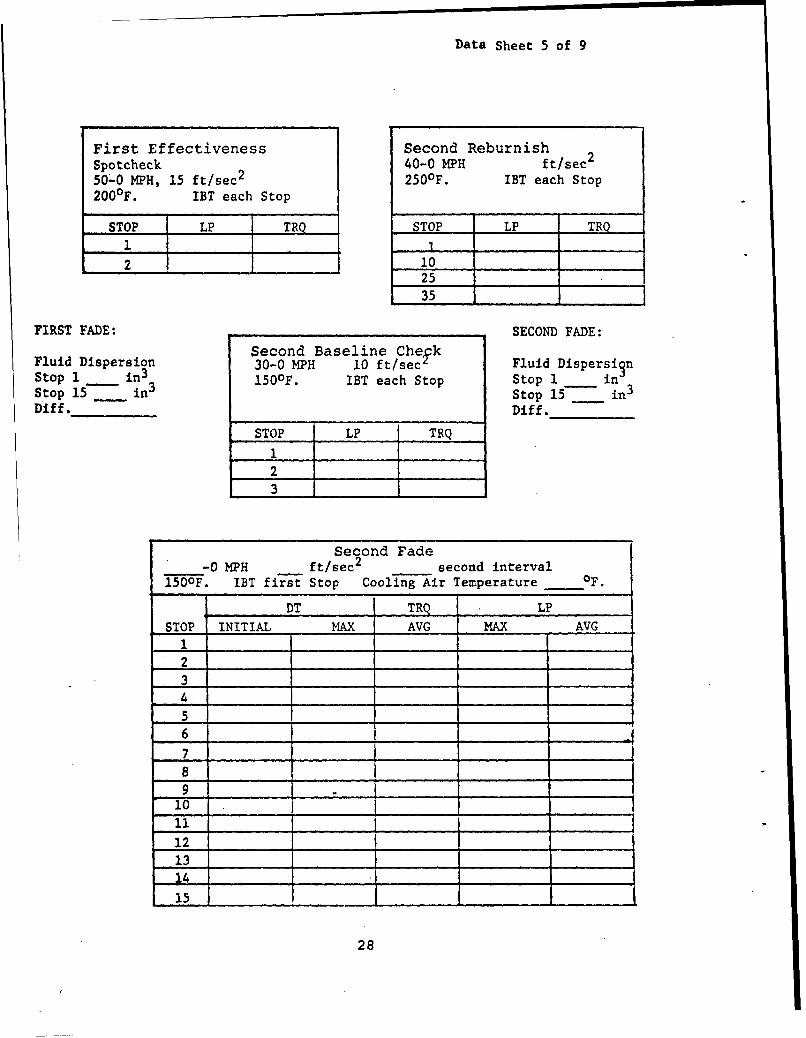
Data Sheet 5 of 9
First Effectiveness Second ReburnishSpotcheck 40-0 MPH ft/sec2
5040 MPH, 15 ft/sec2 250 0 F. IBT each Stop2000 F. IBT each Stop
STOP LP TRQ STOP LP TRQ
2 10" 25
35
FIRST FADE: ........ _ SECOND FADE:FsSecond Baseline CheykFluid Dispersion 30-0 MPH 10 ft/sec Fluid DispersinStop 1 in3 1500F. IBT each Stop Stop l i nStop 15 in3 Stop 15 in
Diff._ _ _ Diff._ --
STOP LP TRQ
123
Second Fade-0 MPH ft/sec2 second interval
150 0F. IBT first Stop Cooling Air Temperature OF.
DT TRQ LPSTOP INITIAL MAX AVG MAX AVG
1S2
3
5S 67
1213
15
28
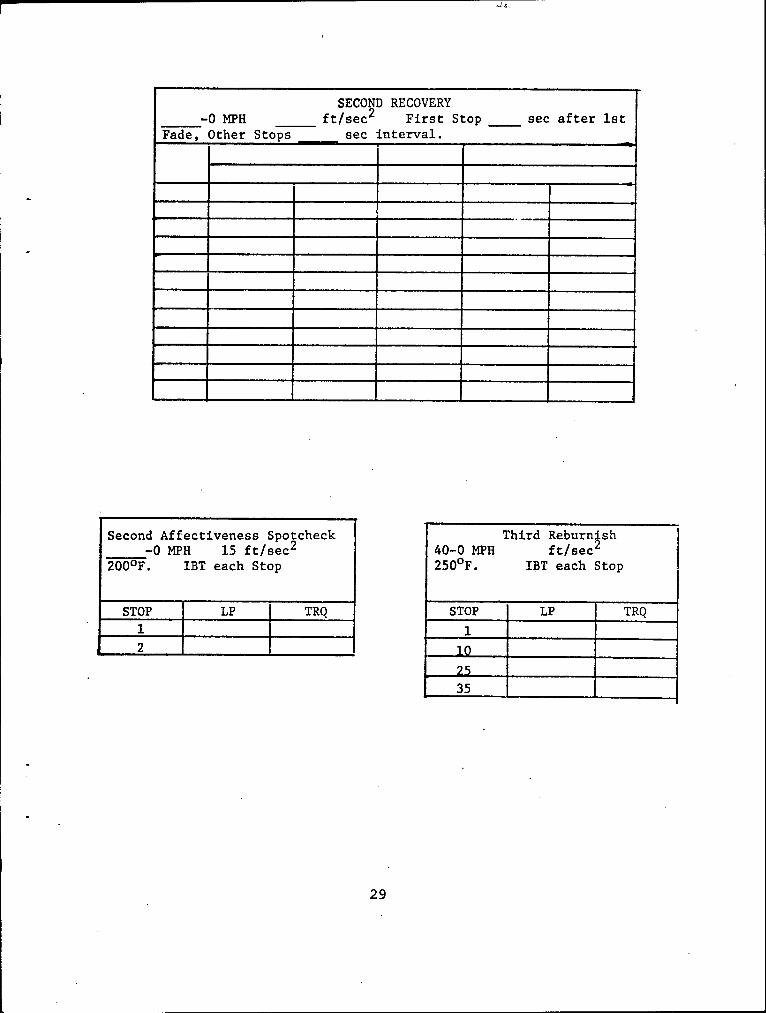
SECOND RECOVERY-0 MPH ft/sec 2 First Stop sec after 1st
Fade, Other Stops sec interval.
Second Affectiveness Spotcheck Third Reburn~sh-0 MPH 15 ft/sec 2 40-0 MPH ft/sec
200 0 F. IBT each Stop 250 0 F. IBT each Stop
STOP LP TRQ STOP LP TRQ
1 1
2 _0
25
35
29
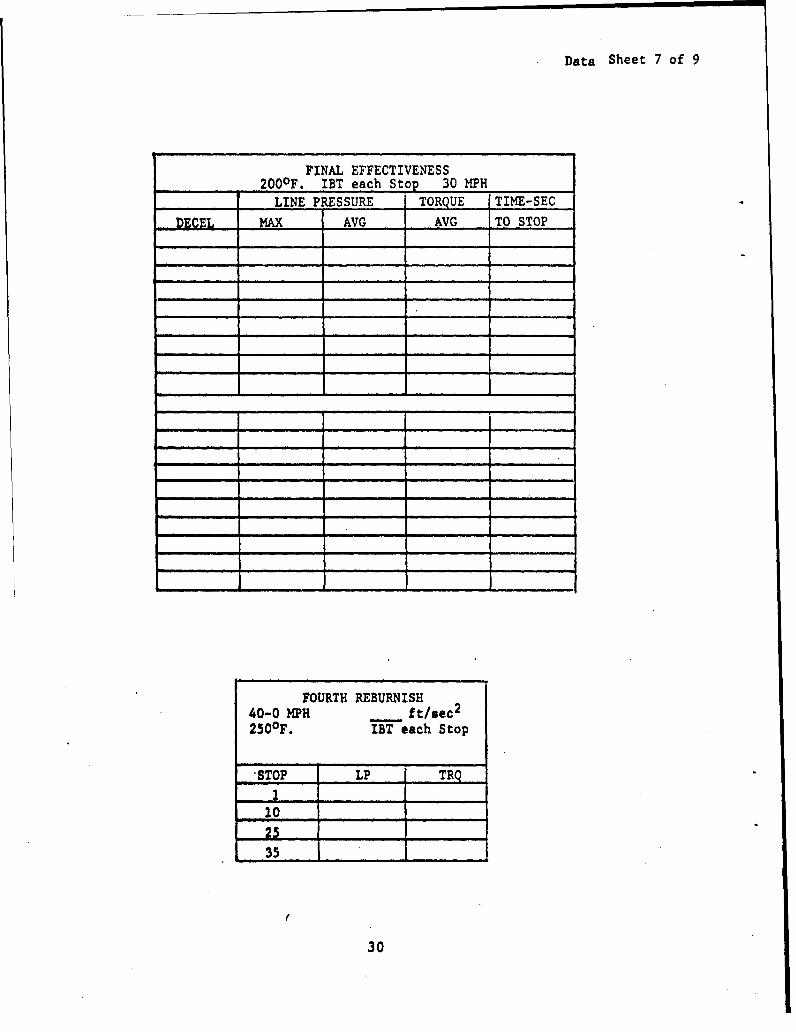
Data Sheet 7 of 9
FINAL EFFECTIVENESS,, _ 2000 F. IBT each Stop 30MPH
_ LINE PRESSURE TORQUE TIME-SEC
DECEL MAX AVG AVG TO STOP
FOURTH REBURNISH40-0 MPH Wt/ecd2500F. ,,T each Stop
LTOP LP
10
aL_
250°.''"ahSo
35
I3
30
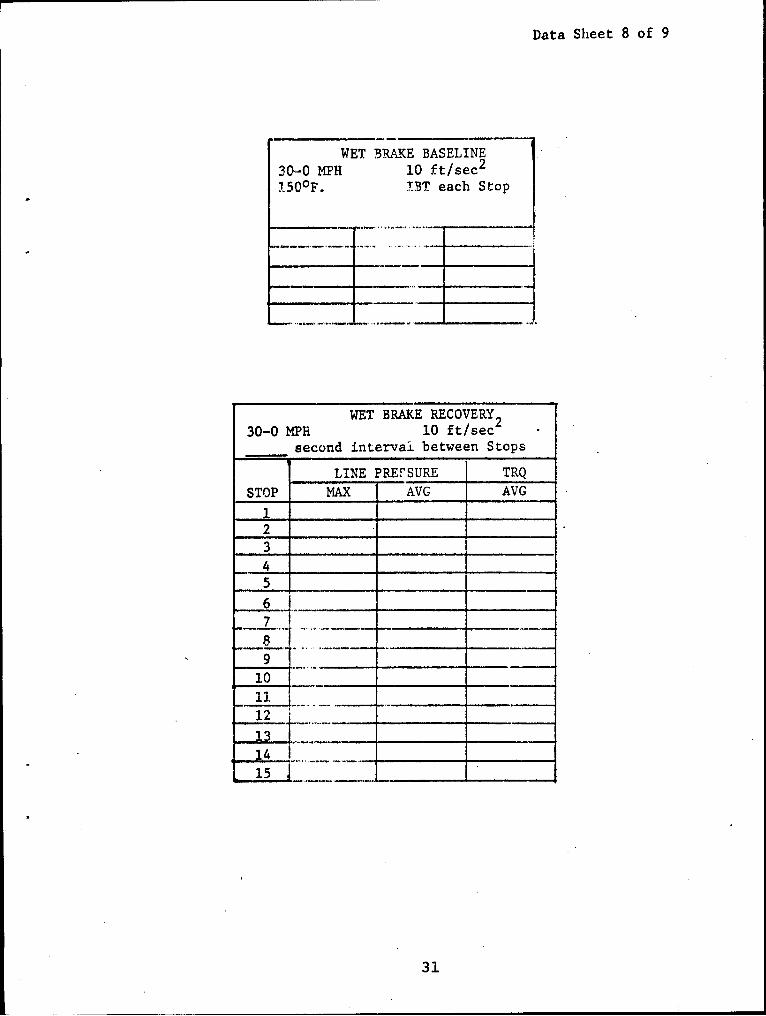
Data Sheet 8 of 9
WET BRAKE BASELINE30-0 MPH 10 ft/sec2
1500 F. !BT each Stop
WET BRAKE RECOVERY230-0 MPH 10 ft/sec2
second intervai between Stops
LINE PREFSURE TRQ
STOP MAX AVG AVG1234567
12 _ _ _ _ _ _ _Ii14
153
31
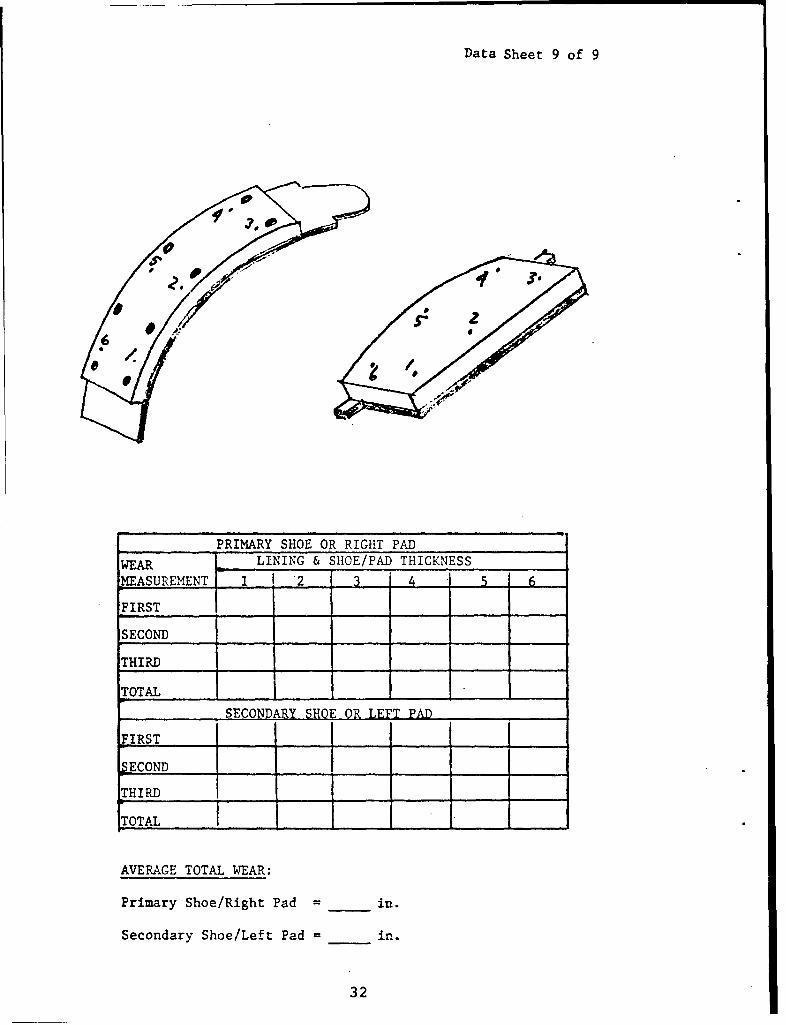
Data Sheet 9 of 9
P_ RIMARY SHOE OR RIGHT PADWEAR. LINING & SHOE/PAD THICKNESS _
MEASUREMENT 1 i 2 ,3 1 4 5 6
FIRST
SECOND
THIRD
TOTAL
_..... _SECONDARY SHOE OR LEFT PAD
FIRST
SECONDTHIRD
TOTAL
AVERAGE TOTAL WEAR:
Primary Shoe/Right Pad = in.
Secondary Shoe/Left Pad = in.
32
I - -,----. -- 4--
E-4 T 7 -p
C14
L'Tt
o
01+
H 4I
0n
9~~~' 1 111,i
_ _ - - . lic i~z:I=__ -
+4fl- 7LLFT +.
WI ia -
4- c33
PREBURNISH EFFWIIVENESS TEST
77 ILI
-T -A-
-77 -I'-t 4 "
-!-T
____ TT -T- t
Ln L4
I- I I ,
444-
SECOND EFI-ETX-.-IVFTiSS TEST
- --- --- -----
I-: ji 7l __ T~z 11--4
ILI,
4 -__ _
LI~L
TI7V~-4- 4-- v
LINEPRESURE SI LNINGCOD
TEST N. _ FT
35T
LINE PRESSURE -PSI
9;: .L LI
T2~~~~~- 7 L. ~ --
LL ~ . LL
0
E - '2 1 C >J L f 1 2 L I4. L
L;. L. L : 2 2 - - ..
- . - --. 4 __I L '.
A t~i hi i . ~E-4~0 --.- ~ ~ LLt it J4-1- 4 V- -
- ___ __ -~--v4-_tA~~LL 4Z4 ~c-
414C1
C)
- -d- - -L -ill f LA-
J-. t ~ id -A - -
.4. .41.. J.IL V L44 C3
_ ~ 44.112 41' ,~ L _D
LINE PRESSURE -PSI
4 '-
-4-4-4
±E-
>44
t4 a
f-zH
-4 41 . f- -4 -14
I I-E- §jTq j
E-1 TFt
>40
374
FINAL EFFECIVENESS TEST
4444
LINEPRESURE SI LNINGCOD
TEST NO
I38
LINE PRESSURE l~b/in 2
H1L'hZT ±-t
H -T
--- V ~-i A L 4J, >L-4'-L 4 -4- -4,
jr -t__ -4
-A J_ ~~
4VJ j± 1
4 L1c T",V TT1K74-VI -t4} .L ~ j . * ¾ V . _ _ _ _ t K. i 4 _
-f -I
39
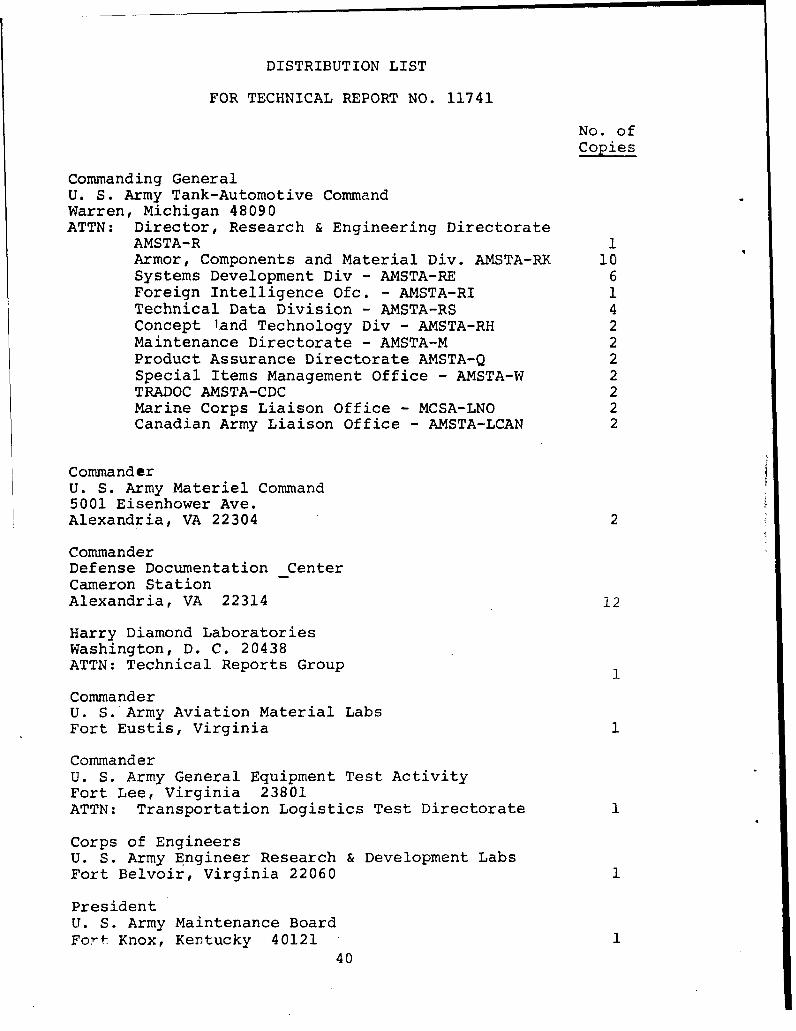
DISTRIBUTION LIST
FOR TECHNICAL REPORT NO. 11741
No. ofCopies
Commanding GeneralU. S. Army Tank-Automotive CommandWarren, Michigan 48090ATTN: Director, Research & Engineering Directorate
AMSTA-R 1Armor, Components and Material Div. AMSTA-RK 10Systems Development Div - AMSTA-RE 6Foreign Intelligence Ofc. - AMSTA-RI 1Technical Data Division - AMSTA-RS 4Concept land Technology Div - AMSTA-RH 2Maintenance Directorate - AMSTA-M 2Product Assurance Directorate AMSTA-Q 2Special Items Management Office - AMSTA-W 2TRADOC AMSTA-CDC 2Marine Corps Liaison Office - MCSA-LNO 2Canadian Army Liaison Office - AMSTA-LCAN 2
CommanderU. S. Army Materiel Command5001 Eisenhower Ave.Alexandria, VA 22304 2
CommanderDefense Documentation CenterCameron StationAlexandria, VA 22314 12
Harry Diamond LaboratoriesWashington, D. C. 20438ATTN: Technical Reports Group 1
CommanderU. S. Army Aviation Material LabsFort Eustis, Virginia 1
CommanderU. S. Army General Equipment Test ActivityFort Lee, Virginia 23801ATTN: Transportation Logistics Test Directorate 1
Corps of EngineersU. S. Army Engineer Research & Development LabsFort Belvoir, Virginia 22060 1
PresidentU. S. Army Maintenance BoardFort Knox, Kentucky 40121 1
40
Presid" -U. S. LrFort Kno;:. Kentucky 40121
Commander
Washington, D. C. 20310
Off ice, Chief of Rtesearch & DevelopmentDepartment of the ArmyWashington, D. C. 20310
41
UNCLASSIFIEDSecurity Classification
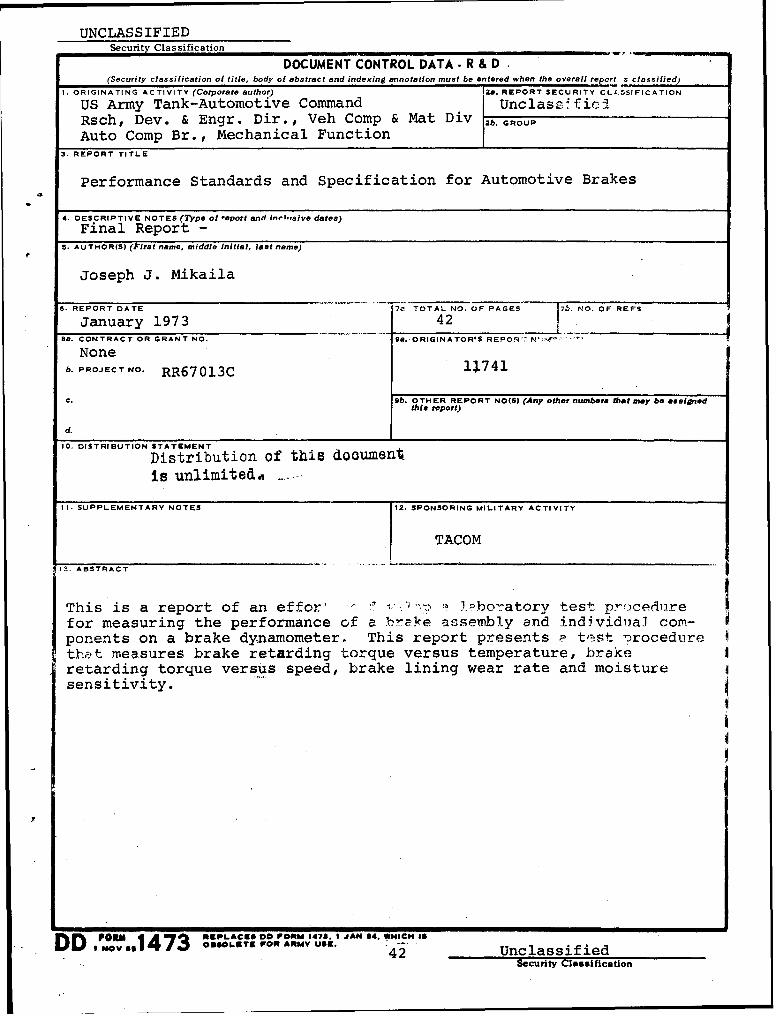
DOCUMENT CONTROL DATA- R & D(Security classification of title, body of abstract and indexing annotation must be entered when the overall report s classilied)
I. ORIGINATING ACTIVITY (Corporate author) 2a. REPORT SECURITY CL;.SSIFICATION
US Army Tank-Automotive Command Unclass.fiiedRsch, Dev. & Engr. Dir., Veh Comp & Mat Div ib GROUP
Auto Comp Br., Mechanical Function3. REPORT TITLE
Performance Standards and Specification for Automotive Brakes
4. DESCRIPTIVE NOTES (Type of -eport and In",,sive dates)
Final Report -5. AUTHOR(S) (First name, middle initial, last name)
Joseph J. Mikaila
6. REPORT DATE 7e7 TOTAL NO. OF PAGES Z7ý. NO. OF REFS
January 1973 428a. CONTRACT OR GRANT NO. 9a. ORIGINATOR'S REPORt" N'."•.'
Noneb. PROJECT NO. RR67013C 11741
C. 9b. OTHER REPORT NO(St (Any other numbere that may be eassignedthis report)
d.
10. DISTRIBUTION STATEMENT
Distribution of this documentis unlimited,, -...
II. SUPPLEMENTARY NOTES 12. SPONSORING MILITARY ACTIVITY
13. ABSTRACT
This is a report of an effor' - 'I- Tpbo atorv test procedurefor measuring the performance of a bre.ke assembly and individua7 com-ponents on a brake dynamometer. This report presents P test )rocedurethpit measures brake retarding torque versus temperature, brakeretarding torque versus speed, brake lining wear rate and moisturesensitivity.
PORM 4Al RELAC98 00 FORM 147S. 1 JAN 64, WHICH Is
DD I Nov 473 OSSOL9IE FOR ARMY U8E.42 Unclassified
Security Classification
UNCLASSIFIEDSecurity Classification
14. LINK A LINK B LINK CKEY WORDS-- -
ROLE WT ROLE WT ROLE WT
Brake Dynamometer Test
43 UNCLASSIFIEDSecurity Classification