Embed Size (px)
Citation preview

sharekhan special Q4FY2016 earnings review
Sharekhan Special June 10, 20161
Visit us at www.sharekhan.com June 10, 2016
Sensex earnings growth perks up: Post several quarters of tepid performance, the aggregate profits of Sensex companies (excluding banks) have grown at a healthy rate of 17.5% for Q4FY2016, albeit on a lower base of Q4FY2015. The growth was largely driven by improvement in margins (due to benefits of low input costs) while the revenue growth still remained muted in the mid single-digit range. Revenue growth was largely driven by volume growth while realisations remained under pressure, as companies across various sectors passed on the benefit of lower raw material costs (at least partially) to customers.
Stress persists in certain pockets: Banks continued to struggle, with asset quality issues and high provisioning requirements resulting in 25% dip in earnings of banking stocks in Sensex (still contributed ~16.4% of adjusted aggregate net profit of Sensex companies). Along with banking, weakness also persisted in metals and capital goods sectors. However, on an overall basis, only eight out of 30 Sensex companies reported decline profits in Q4FY2016. In terms of stocks, weak performance was reported by Cipla, BHEL and Wipro, along with Axis bank and ICICI Bank.
Outlook
Some green-shoots emerging on corporate earnings: The management commentary still remains cautious even from the companies whose fortunes are tied to the domestic demand. However, most companies expect strong revival in H2FY2014 if the south-west monsoon turns out to be normal (and is evenly distributed). Also, the positive fallout from the implementation of the Seventh Pay Commission hikes is likely to kick in from the
Q4FY2016 earnings reviewEarly signs of revival in earnings visible
upcoming festive season. The asset quality strains in the banking sector is also expected to peak out in H1FY2017 with expectations of the trend improving thereafter. The outlook for global commodity and exports driven sectors has improved on the back of the recent rebound in commodity prices from the extremely pessimistic levels, although the overall global macro-economic environment remains uncertain.
Valuation
Post the sharp pullback in the past three months, the valuation of the Indian market can not be said to be cheap, with Sensex trading at around 16.5-17x its one-year forward consensus earnings. On the positive side, the outlook for corporate earnings has improved somewhat amid growing expectations of a normal monsoon and stable commodity prices. The intensity of earnings downgrades is also coming down considerably. While the benchmark indices could consolidate in a trading range, we can expect increased activity and interest in the midcap space (broader markets).
Sensex’ one-year forward P/E band
Source: Bloomberg, Sharekhan Research
7.0
10.0
13.0
16.0
19.0
22.0
25.0
Jun-
10
Jun-
12
Jun-
14
Jun-
16
+1 sd PER Avg PER -1 sd

sharekhan special Q4FY2016 earnings review
Sharekhan Special June 10, 20162
Sector-wise contribution to Sensex’ earnings growth (%)
Revenue growth by sector for Q4FY2016 (%)
Sensex’ consensus EPS estimate for FY2017 and FY2018
Source: Company data, Sharekhan Research
Source: Company data, Sharekhan Research
Source: Bloomberg, Sharekhan Research
Leaders Laggards
Ashok Leyland, Hero Motocorp Maruti Suzuki and Apollo Tyres
Aurobindo Pharma, Divis Labs, Glenmark Pharma, Lupin, Sun Pharma and Torrent Pharma
Cipla and Cadila Pharma
Infosys, TCS, Persistent Systems and ZEEL Wipro
Yes Bank, Capital First, LIC Housing Finance and IndusInd Bank Bank of India, PNB, ICICI Bank and IDBI Bank
The Ramco Cement, BEL, PI Industries and Grasim
Raymond, Bharti Airtel and TTK Prestige Relaxo, Orbit Exports and KDDL
ITC, Emami and Jyothy Laboratories Britannia, GSK Consumers and Cox & Kings
V-Guard, Finolex Cables, KPTL, L&T and PTC India BHEL, Thermax and CESC
IL&FS Transportation Gateway Distriparks
Earnings growth by sector (%)
Source: Company data, Sharekhan Research
1400
1600
1800
2000
2200
2400
Jun-
15
Jul-1
5
Aug-
15
Sep-
15
Oct
-15
Nov
-15
Dec
-15
Jan-
16
Feb-
16
Mar
-16
Apr-
16
May
-16
Jun-
16
FY17E EPS FY18E EPS
5.1
7.4
0.0 0.2 0.4
5.9
2.3
1.7
1.61.3
0.9 0.7
0.0
2.0
4.0
6.0
8.0
10.0
12.0
14.0
16.0
IT
Div
ersi
fied
Auto
Phar
ma
Ener
gy
Met
al
FMC
G
Tele
com
Cap
. goo
ds
Pow
er
BFSI
Sens
ex
42.731.9
19.314.1
12.18.6
7.1-3.5
-7.7-25.3
-58.8
-80.0 -60.0 -40.0 -20.0 0.0 20.0 40.0 60.0
PharmaIT
DiversifiedAuto
FMCGEnergy
TelecomCap. goods
PowerBFSIMetal
17.8 17.013.5
10.1 8.4 8.2 6.3
-6.2-10.2 -12.4
6.7
-20.0
-10.0
0.0
10.0
20.0
30.0
40.0
IT
Auto
Phar
ma
BFSI
Tele
com
FMC
G
Cap
. goo
ds
Pow
er
Div
ersi
fied
Met
al
Sens
ex e
x-En
ergy

sharekhan special Q4FY2016 earnings review
Sharekhan Special June 10, 20163
AutoVolume uptick coupled with soft commodity prices boost earnings
Q4FY2016 results review
Healthy double-digit revenue growth driven by upsurge in volume: After a gap of several quarters, the Sharekhan Auto universe (ex-TAMO) has reported double-digit topline growth (12.6% in Q4FY2016). The growth was mainly backed by surge in volumes across the automotive segments (ex-Passenger Vehicles). Domestic Medium & Heavy Commercial Vehicle (MHCV) segment clocked healthy double-digit growth rate for the sixth consecutive quarter (30% growth in Q4FY2016), with Light Commercial Vehicles (LCV) also witnessing a pick-up in volumes after a gap of 11 quarters. Two-wheeler segment reported volume growth of 9% due to improvement in rural sentiment and a low base of the year-ago quarter. Passenger Vehicle (PV) segment has been the only laggard, with its volume growth rate slowing to a mere 2%, hurt by higher taxes announced in the Union Budget and ban on large diesel cars in the National Capital Region (NCR) region.
Soft commodity prices drive 22% EBIDTA growth for auto universe (ex-TAMO): The benefits of soft commodity prices continued to accrue to the auto companies in Q4FY2016, as they had already entered into long-term supply contracts with the vendors. Thus, the recent surge in the commodity prices did not have any major impact on the margins of the automotive players. The Sharekhan Automotive universe’s (ex-TAMO) gross profit margins improved by 170BPS yoy in Q4FY2016, leading to a robust 22% EBIDTA growth. However, higher taxation charges for some companies (viz Maruti Suzuki, Hero MotoCorp and Apollo Tyres) did offset majority of the benefits of lower commodity prices, resulting in relatively lower growth rate of 14% in aggregate net profit.
Outlook
Growth momentum to sustain in CV segment; Two-wheeler and tractor volumes to pick up: The double-digit volume growth posted by the CV companies in the past three quarters is likely to sustain going ahead. The LCV segment (accounting for 56% of CV industry volumes) is also likely to clock double-digit growth going forward, spurred by the sustained double-digit growth in MHCVs over the last six quarters and low base of the last two to three years. Further, the expected improvement in rural demand (driven by a better monsoon forecast after two consecutive years of drought) will boost demand in rural centric segments viz two wheelers and tractors.
Valuation
Despite the outperformance of the BSE Auto Index in the past two years, we continue to remain positive on auto sector due to healthy growth outlook. Within the auto space, we continue to prefer Ashok Leyland in CV (pure domestic play on CV segment) and Maruti Suzuki in the PV segment. Maruti Suzuki would gain from shift in the consumer demand towards petrol where it has relatively a large product portfolio, and market share gains on sustained strong demand for larger vehicles viz Baleno and Vitara Brezza).We also like M&M as it is a play on the impending rural demand recovery. It would benefit from improved demand for tractors and LCVs, besides market share gains in utility vehicles (UV) following the launch of petrol variants. In the auto ancillary space, we are positive on Rico Auto and Gabriel India.
Preferred picks: Ashok Leyland, Maruti, M&M and Gabriel
sharekhan special Q4FY2016 earnings review
Sharekhan Special June 10, 20164
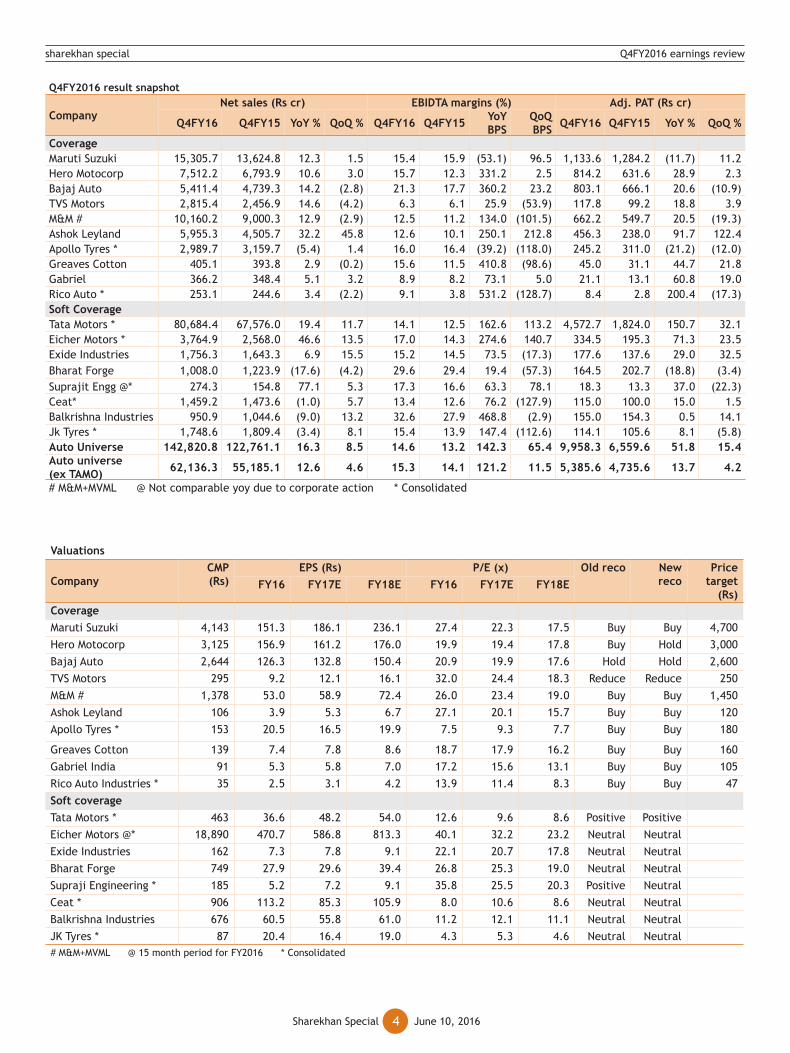
Valuations
CompanyCMP (Rs)
EPS (Rs) P/E (x) Old reco
New reco
Price target
(Rs)FY16 FY17E FY18E FY16 FY17E FY18E
CoverageMaruti Suzuki 4,143 151.3 186.1 236.1 27.4 22.3 17.5 Buy Buy 4,700 Hero Motocorp 3,125 156.9 161.2 176.0 19.9 19.4 17.8 Buy Hold 3,000 Bajaj Auto 2,644 126.3 132.8 150.4 20.9 19.9 17.6 Hold Hold 2,600 TVS Motors 295 9.2 12.1 16.1 32.0 24.4 18.3 Reduce Reduce 250 M&M # 1,378 53.0 58.9 72.4 26.0 23.4 19.0 Buy Buy 1,450 Ashok Leyland 106 3.9 5.3 6.7 27.1 20.1 15.7 Buy Buy 120Apollo Tyres * 153 20.5 16.5 19.9 7.5 9.3 7.7 Buy Buy 180
Greaves Cotton 139 7.4 7.8 8.6 18.7 17.9 16.2 Buy Buy 160Gabriel India 91 5.3 5.8 7.0 17.2 15.6 13.1 Buy Buy 105Rico Auto Industries * 35 2.5 3.1 4.2 13.9 11.4 8.3 Buy Buy 47Soft coverage Tata Motors * 463 36.6 48.2 54.0 12.6 9.6 8.6 Positive Positive Eicher Motors @* 18,890 470.7 586.8 813.3 40.1 32.2 23.2 Neutral Neutral Exide Industries 162 7.3 7.8 9.1 22.1 20.7 17.8 Neutral Neutral Bharat Forge 749 27.9 29.6 39.4 26.8 25.3 19.0 Neutral Neutral Supraji Engineering * 185 5.2 7.2 9.1 35.8 25.5 20.3 Positive Neutral Ceat * 906 113.2 85.3 105.9 8.0 10.6 8.6 Neutral Neutral Balkrishna Industries 676 60.5 55.8 61.0 11.2 12.1 11.1 Neutral Neutral JK Tyres * 87 20.4 16.4 19.0 4.3 5.3 4.6 Neutral Neutral # M&M+MVML @ 15 month period for FY2016 * Consolidated
Q4FY2016 result snapshot
CompanyNet sales (Rs cr) EBIDTA margins (%) Adj. PAT (Rs cr)
Q4FY16 Q4FY15 YoY % QoQ % Q4FY16 Q4FY15 YoY BPS
QoQ BPS Q4FY16 Q4FY15 YoY % QoQ %
CoverageMaruti Suzuki 15,305.7 13,624.8 12.3 1.5 15.4 15.9 (53.1) 96.5 1,133.6 1,284.2 (11.7) 11.2 Hero Motocorp 7,512.2 6,793.9 10.6 3.0 15.7 12.3 331.2 2.5 814.2 631.6 28.9 2.3 Bajaj Auto 5,411.4 4,739.3 14.2 (2.8) 21.3 17.7 360.2 23.2 803.1 666.1 20.6 (10.9)TVS Motors 2,815.4 2,456.9 14.6 (4.2) 6.3 6.1 25.9 (53.9) 117.8 99.2 18.8 3.9 M&M # 10,160.2 9,000.3 12.9 (2.9) 12.5 11.2 134.0 (101.5) 662.2 549.7 20.5 (19.3)Ashok Leyland 5,955.3 4,505.7 32.2 45.8 12.6 10.1 250.1 212.8 456.3 238.0 91.7 122.4 Apollo Tyres * 2,989.7 3,159.7 (5.4) 1.4 16.0 16.4 (39.2) (118.0) 245.2 311.0 (21.2) (12.0)Greaves Cotton 405.1 393.8 2.9 (0.2) 15.6 11.5 410.8 (98.6) 45.0 31.1 44.7 21.8 Gabriel 366.2 348.4 5.1 3.2 8.9 8.2 73.1 5.0 21.1 13.1 60.8 19.0 Rico Auto * 253.1 244.6 3.4 (2.2) 9.1 3.8 531.2 (128.7) 8.4 2.8 200.4 (17.3)Soft CoverageTata Motors * 80,684.4 67,576.0 19.4 11.7 14.1 12.5 162.6 113.2 4,572.7 1,824.0 150.7 32.1 Eicher Motors * 3,764.9 2,568.0 46.6 13.5 17.0 14.3 274.6 140.7 334.5 195.3 71.3 23.5 Exide Industries 1,756.3 1,643.3 6.9 15.5 15.2 14.5 73.5 (17.3) 177.6 137.6 29.0 32.5 Bharat Forge 1,008.0 1,223.9 (17.6) (4.2) 29.6 29.4 19.4 (57.3) 164.5 202.7 (18.8) (3.4)Suprajit Engg @* 274.3 154.8 77.1 5.3 17.3 16.6 63.3 78.1 18.3 13.3 37.0 (22.3)Ceat* 1,459.2 1,473.6 (1.0) 5.7 13.4 12.6 76.2 (127.9) 115.0 100.0 15.0 1.5 Balkrishna Industries 950.9 1,044.6 (9.0) 13.2 32.6 27.9 468.8 (2.9) 155.0 154.3 0.5 14.1 Jk Tyres * 1,748.6 1,809.4 (3.4) 8.1 15.4 13.9 147.4 (112.6) 114.1 105.6 8.1 (5.8)Auto Universe 142,820.8 122,761.1 16.3 8.5 14.6 13.2 142.3 65.4 9,958.3 6,559.6 51.8 15.4 Auto universe (ex TAMO) 62,136.3 55,185.1 12.6 4.6 15.3 14.1 121.2 11.5 5,385.6 4,735.6 13.7 4.2
# M&M+MVML @ Not comparable yoy due to corporate action * Consolidated

sharekhan special Q4FY2016 earnings review
Sharekhan Special June 10, 20165
Banking and NBFCWeakness galore
Q4FY2016 result review
Another quarter of asset quality stress with spike in provisions: Q4FY2016 was one of the weakest quarters for the banking sector in recent times, as earnings continued to be depressed due to persistent rise in asset quality stress (for both, our coverage universe as well as the banking sector). For the overall banking sector, the gross non-performing assets (GNPAs) have risen by 92.9% while the net non- performing assets (NNPAs; GNPA – Provisions) surged by 102.4% as compared to Q4FY2015. The total stressed loans (GNPA + Restructured Assets) as a percentage of advances for our coverage universe surged to 11.2% of the total assets (against 9.7% in Q4FY2015 and 10.4% in Q3FY2016). Consequently, the provision requirement for stressed assets as per the RBI norms and additional provisions (in certain cases) for our coverage stocks jumped by 155.7% (compared to Q4FY2015) and 62.8% (compared to Q3FY2016), resulting in most public sector banks (PSBs) reporting losses at the net level for the quarter.
Credit growth sluggish; Although private banks outperform PSBs cracks are visible: Along with the surge in stressed assets, subdued credit growth of 8% (industry average) in Q4FY2016 optically magnified the non-performing loan (NPL) stress as a percentage of advances (or loan book). Private sector banks like HDFC Bank, IndusInd Bank, Yes Bank, and NBFCs like Bajaj Finance and Capital First posted healthy credit growth. On the other hand, banks with relatively high exposure to corporate loans continued to struggle, as corporates remained focused on de-leveraging their balance sheets. Within the private sector banks also, some cracks are visible on the asset quality side, with sub-par performance from ICICI Bank and Axis Bank (reporting deterioration in asset quality). But, their situation on asset quality is still much better than the PSBs.
Outlook
Banks have recognized and made provisions for troubled accounts as guided by the RBI’s asset quality review (AQR) in H2FY2016. They have also pro-actively taken steps to clean up their balance sheets. However, banks (including private banks) have indicated that there would be further requirement for the clean-up of books in H1FY2017.In the case of the PSBs, growth would be constrained by weakness in credit off-take and pressure on margins in the near term. Also, the capital adequacy ratios are weak and the PSBs would require regular doses of capital infusion, resulting in equity dilution and poor return ratios.
Valuation
In line with the weak set of numbers in Q4FY2016 and uncertainty on peaking of asset quality challenges, the valuations of banks (especially the PSBs) have drifted toward the lower end of a multi-year valuations range. Though some of the imminent challenges are being factored in the valuations, we continue to remain cautious and very selective in the PSB space. Despite rich valuations, we continue to prefer retail-focused private banks and NBFCs due to relatively better structural growth story.
Leaders in Q4FY2016: Yes Bank, IndusInd Bank and Bajaj Finance
Laggards in Q4FY2016: Bank of India, Punjab National Bank and IDBI Bank
Preferred picks:
Private sector: HDFC Bank, IndusInd Bank and Axis Bank
Public Sector: SBI and Bank of Baroda
NBFCs: Bajaj Finance, LIC Housing Finance and Capital First

sharekhan special Q4FY2016 earnings review
Sharekhan Special June 10, 20166
Banks Net interest income Pre-provisioning profit Profit after tax
Q4FY16 Q4FY15 YoY %
QoQ %
Q4FY16 Q4FY15 YoY %
QoQ %
Q4FY16 Q4FY15 YoY % QoQ %
PublicSBI 15,290.8 14,711.8 3.9 12.4 14,191.9 12,409.4 14.4 47.9 1,263.8 3,742.0 -66.2 13.3PNB 2,767.7 3,791.6 -27.0 -32.8 3,227.9 3,202.7 0.8 10.6 -5,367.1 306.6 NA NABank of Baroda 3,330.4 3,171.7 5.0 23.1 2,572.5 2,693.5 -4.5 51.0 -3,230.1 598.3 NA NABank of India 3,187.2 2,846.3 12.0 17.7 1,464.2 1,426.6 2.6 3.9 -3,587.1 (56.1) NA NAUnion Bank 2,084.7 2,121.1 -1.7 4.4 1,409.6 1,652.3 -14.7 5.7 96.1 443.8 -78.3 22.4Corporation Bank 990.6 1,114.0 -11.1 -1.6 724.9 965.4 -24.9 3.7 -511.0 45.1 NA NAAndhra Bank 1,500.1 1,371.2 9.4 10.2 1,173.4 1,003.0 17.0 13.9 51.6 185.2 -72.1 49.7Allahabad Bank 1,273.7 1,456.9 -12.6 -10.1 873.3 1,008.8 -13.4 1.5 -581.1 202.6 NA NA
IDBI Bank 1,427.6 1,660.3 -14.0 -8.2 1,595.4 2,489.2 -35.9 42.7 -1,735.8 545.9 NA NAPSBs total 31,852.7 32,244.7 -1.2 4.5 27,232.9 26,850.7 1.4 31.7 -13,600.8 6,013.4 NA NAPrivateICICI Bank 5,404.5 5,079.4 6.4 -0.9 7,107.5 5,468.3 30.0 8.3 701.9 2,922.0 -76.0 -76.7HDFC Bank 7,453.3 6,013.2 24.0 5.4 5,734.9 4,722.0 21.5 0.0 3,374.2 2,806.9 20.2 0.5Axis Bank 4,552.6 3,799.2 19.8 9.4 4,398.5 4,012.9 9.6 10.4 2,154.3 2,180.6 -1.2 -1.0Federal Bank 685.9 623.2 10.1 13.3 394.5 469.2 -15.9 21.2 10.3 280.5 -96.3 -93.7Yes Bank 1,241.4 977.1 27.1 7.3 1,225.5 937.5 30.7 6.6 702.1 551.0 27.4 3.9Private banks total 19,337.8 16,492.1 17.3 4.8 18,860.9 15,609.8 20.8 6.2 6,942.8 8,741.0 -20.6 -26.1Grand total 51,190.5 48,736.8 5.0 4.6 46,093.9 42,460.5 8.6 20.0 -6,658.0 14,754.5 NA NASoft CoverageIndusInd Bank 1,268.2 925.1 37.1 8.1 1,151.2 850.2 35.4 8.5 620.3 495.3 25.2 6.8NBFCsHDFC 2,469.3 2,355.3 4.8 13.2 4,187.1 2,703.4 54.9 85.4 2,607.1 1,862.4 40.0 71.5LIC Housing Finance
821.4 649.8 26.4 10.0 731.9 585.6 25.0 7.6 448.0 378.2 18.5 7.0
Capital First 255.1 148.1 72.2 17.3 148.0 78.6 88.3 14.2 47.5 36.5 30.1 6.7Bajaj Finance 1,015.3 741.4 37.0 -16.9 645.5 458.3 40.9 -16.3 315.0 231.0 36.4 -22.9PTC India Fin. Ser. 114.8 89.8 27.9 6.5 114.1 95.2 19.8 4.6 49.0 15.8 210.2 -29.4NBFC total 4,675.88 3,984.37 17.4 4.4 5,826.57 3,921.18 48.6 47.5 3,466.64 2,523.89 37.4 40.8
Valuation summary
Banks Reco. Price Target
CMP (Rs)
RoA (%) RoE (%) P/BV (x)FY16 FY17E FY18E FY16 FY17E FY18E FY16 FY17E FY18E
PublicSBI Buy 251 210.7 0.5 0.5 0.6 7.3 8.4 9.4 1.2 1.1 1.0PNB Hold 92 80.7 -0.6 0.2 0.4 -10.3 4.2 8.0 0.4 0.4 0.4Bank of Baroda Buy 180 147.9 -0.8 0.3 0.5 -13.5 5.5 8.4 0.9 0.8 0.8Bank of India Reduce 75 88.4 -1.0 0.2 0.2 -19.1 2.9 3.7 0.3 0.2 0.2Union Bank Hold 132 120.7 0.3 0.5 0.5 6.3 8.3 9.3 0.4 0.4 0.4Corporation Bank Reduce 30 35.7 -0.2 0.1 - -4.6 1.9 - 0.3 0.3 -Andhra Bank Book Out NA 50.3 0.3 0.3 0.3 5.1 5.6 6.7 0.3 0.3 0.3Allahabad Bank Reduce 44 53.4 -0.3 0.3 - -5.4 4.4 - 0.2 0.2 -IDBI Bank Reduce 58 67.4 -1.0 0.3 0.4 -14.1 3.5 5.2 0.5 0.5 0.5PSBs total / avg. -0.3 0.3 0.3 -5.4 5.0 5.6 0.5 0.5 0.5PrivateICICI Bank Hold UR 257.6 1.4 1.4 1.6 11.4 12.3 14.2 1.8 1.7 1.5HDFC Bank Buy 1,300 1,162.4 1.9 1.9 1.9 18.3 19.2 20.4 4.0 3.5 3.0Axis Bank Buy 590 539.1 1.7 1.7 1.7 16.8 16.5 17.2 2.4 2.1 1.8Federal Bank Buy UR 57.9 0.5 0.7 0.8 6.0 8.8 11.1 1.3 1.2 1.1Yes Bank Buy UR 1,053.1 1.7 1.8 1.9 19.9 20.8 22.3 3.2 2.7 2.3Private banks total/avg. 1.4 1.5 1.6 14.5 15.5 17.0 2.5 2.3 2.0Grand total / avg. 0.6 0.9 0.9 4.6 10.2 11.3 1.5 1.4 2.0Soft CoverageIndusInd Bank Positive NA 1,119.9 1.9 1.8 1.8 16.1 15.8 16.4 3.9 3.4 2.9NBFCs
HDFC Buy 1,380 1,262.5 2.6 2.5 2.4 21.7 21.2 21.1 5.8 5.2 4.6LIC Housing Finance Buy 558 480.2 1.5 1.5 - 19.6 20.1 - 2.7 2.3 -Capital First Buy UR 564.5 1.3 1.4 1.6 10.1 12.7 15.8 3.0 2.7 2.4Bajaj Finance Hold 8,000 7,780.5 3.2 3.0 3.0 20.9 19.3 20.5 5.6 4.8 4.0PTC India Fin. Ser. Buy 55 36.4 5.0 3.2 3.2 24.6 18.0 20.3 1.2 1.0 0.9NBFC Total / Avg 2.7 2.3 2.6 19.4 18.3 19.5 3.7 3.2 3.0UR-Under review

sharekhan special Q4FY2016 earnings review
Sharekhan Special June 10, 20167
Capital goods and engineeringBroad-based margin expansion amidst pockets of positive surprises
Q4FY2016 result review
L&T steals the show; select midcaps shine too: During Q4FY2016, the overall revenue of our coverage universe grew by 6% YoY despite a continued revenue decline for BHEL, as L&T compensated with a strong growth (up 18% YoY). Ex-BHEL, revenue growth was very healthy at 16% YoY. Among the smaller companies, Kalpataru Power (KPTL) and V-Guard delivered strong growth, much ahead of our estimate. Even Crompton Greaves showed top-line growth (on continued operations) after some time. On the negative side, Thermax and VA- Tech Wabag witnessed weak top-line performance due to lower order backlog and revenue slippage. In case of Finolex Cables (FCL), and V-guard, lower commodity prices reflected in revenue but volume improvement was also visible. The cumulative order book of our coverage universe is 7% higher YoY and the book-to-bill ratio stands at around 2.6x.
Broadly, margin expanded with operating leverage but BHEL continues to disappoint: The broad-based healthy top-line growth (better volume and softer commodity prices) reflected in margin expansion in this quarter. However, with meagre 1.5% OPM, BHEL’s margin contracted sharply and disappointed. On an ex-BHEL basis, OPM of our coverage universe expanded by 127BPS, which led to 27% growth in operating profit (ex-BHEL). The operating profit of FCL and V-guard almost doubled over the last year. Also L&T, KPTL and Triveni Turbine (TTL) witnessed substantial growth at the operating level. The performance of the above-mentioned companies continued to be strong at the bottom-line level and PAT (ex-BHEL) grew by 14% YoY in Q4FY2016.
Outlook
Some positive signs but broad-based capex cycle yet to start: During this quarter, we witnessed some positive signs like the more-than-expected volume growth in electrical cables and consumer products. Also, a strong ordering activity was witnessed (especially in March) in power transmission & distribution projects, roadways and railways. After a long time, we saw large projects ordering in the pipeline too in this quarter. We believe, while some of these pockets continue to drive a large part of the ordering activities, we are yet to witness broad-based capex cycle revival, as the private sector does not seem to be confident enough, with the capacity utilisation subdued in many sectors. We expect improvement in the public sector spending but it could take a while before private players join the party.
Preferred picks
Our preferred pick is L&T in the large-cap space, while we like V-guard, FCL and KPTL in the mid-cap space.
Leaders in Q4FY2016: L&T, V-Guard, KPTL and Finolex Cables
Laggards in Q4FY2016: BHEL and Thermax
Q4FY2016 results snapshotCompany Sales OMP PAT
Q4 FY16
Q4 FY15
YoY Growth
(%)
QoQ Growth
(%)
Q4 FY16
Q4 FY15
YoY (BPS)
QoQ (BPS)
Q4 FY16
Q4 FY15
YoY Growth
(%)
QoQ Growth
(%)BHEL 9,792 12,368 -20.8 87.2 1.5 11.0 -948.6 3,471.6 365 898 -59 -133.1Crompton Greaves 1,670 1,575 6.0 36.3 9.3 19.0 -970.3 144.5 102 276 -63 142.9L&T 33,157 28,023 18.3 28.4 14.7 12.9 177.6 439.5 2,405 1,971 22 132.4KPTL # 1,381 1,071 28.9 59.1 10.4 9.8 62.3 -40.2 72 40 80 89.5Thermax # 1,293 1,521 -15.0 24.4 9.1 10.3 -119.6 -40.2 111 132 -16 63.2Finolex Cables 681 658 3.5 16.0 16.4 9.3 717.6 315.8 83 23 261 56.6V-guard 513 442 16.1 23.3 12.3 7.9 436.2 386.7 42 20 110 100.0Va Tech 859 908 -5.4 40.1 13.9 12.8 107.8 634.9 66 75 -12 230.0Skipper 523 500 4.6 44.6 12.7 13.6 -87.0 183.5 36 30 22 93.0Triveni Turbines 209 196 7.1 5.9 25.3 17.4 787.1 457.5 34 29 17 24.7# stand-alone

sharekhan special Q4FY2016 earnings review
Sharekhan Special June 10, 20168
Valuation
Company CMP (Rs)
Reco Price target (Rs)
EPS PE (x)
FY2016 FY2017E FY2018E FY2016 FY2017E FY2018EBHEL 118 Reduce 115 (3.7) (0.4) 3.9 NA NA 30.3Crompton Greaves (Restated) 71 Reduce 65 2.0 3.4 3.7 35.5 20.9 19.2 L&T 1,471 Buy 1,550 50.8 57.4 65.1 29.0 25.6 22.6 KPTL # 254 Buy 290 13.0 16.3 18.1 19.5 15.6 14.0 Thermax # 764 Hold 800 25.6 24.4 26.8 29.8 31.3 28.5 Finolex Cables 339 Buy 360 16.3 17.7 19.7 20.8 19.2 17.2 V-Guard Industries 1,368 Buy 1,350 37.1 43.1 49.9 36.9 31.7 27.4 VA Tech Wabag 606 Buy 650 15.8 23.7 30.2 38.4 25.6 20.1 Skipper 144 Buy 190 8.1 9.3 11.3 17.8 15.5 12.7 Triveni Turbines 110 Buy 130 3.3 4.5 5.2 33.3 24.4 21.2
# Stand-alone
Consumer goods and servicesBetter monsoon expected to improve growth prospects
Q4FY2016 result review
Realisations flat; volume growth sustains at mid-to-high single digit: Most of the FMCG companies under our coverage have posted mid-to-high single digit volume growth in the domestic business due to sluggish rural demand. The volume growth of our coverage companies has not seen any meaningful improvement for the past two quarters. Further, in the absence of growth in realisations, the revenue growth has largely been in line with the growth in volume (barring Jyothy Laboratories and ITC), with aggregate growth rate of 7.0% for our coverage universe.
Lower input prices boost margins and growth in earnings: Q4FY2016 marked yet another quarter of sustained improvement in operating margins for our coverage companies, driven by weakness in input costs and positive impact of cost saving initiatives undertaken by the companies. However, we believe that Q4FY2016 was the last quarter for reaping the benefits of lower commodity prices. Going forward, margin improvement will depend on better operating efficiencies. The strong improvement in the OPM helped the FMCG companies (barring companies such as GSK Consumers and Zydus Wellness) to post double-digit growth in profits. The PAT growth for Sharekhan’s FMCG universe stood at ~12% YoY, which is ahead of revenue growth.
Outlook
Demand environment to improve with expectations of better monsoon and uptick in urban consumption; earnings will no longer get support from margin expansion: Expectations of a better monsoon and enhanced spending by the government on the rural sector would ease rural distress. Also, the urban demand (partially driven by the 7th Pay Commission hikes and implementation of OROP) is expected to improve from FY2017. However, the impact would be more visible in the second half of FY2017. On the other hand, the raw material prices have started showing an upward trend and the FMCG companies might not be able to fully pass it on to consumers immediately. The FMCG companies would have to enhance operating efficiencies to sustain (or improve) margins from the current levels.
Valuation
If monsoon turns out to be as per current expectations, the FMCG companies having a diversified portfolio of brands (catering to mass and premium segments) and a sizeable presence in rural India will be the key beneficiaries over the next one to two years. We prefer FMCG companies with a good rural distribution reach, along with stable cash flows and decent valuations. In the large-cap space, we continue to like HUL (likely improvement in rural economy to drive growth) and ITC (pressure on cigarette sales volume easing off), while in the mid-cap space, we continue to like Britannia (on the back of long-term growth prospects in the domestic packaged food space), Emami (diversified product portfolio catering to niche categories) and Jyothy Laboratories (Henkel’s acquisition might improve the prospects in long run). In the consumer services space, we continue to like Wonderla Holidays and Thomas Cook India.
Leaders in Q4FY2016: ITC, Emami and Jyothy Laboratories
Laggards in Q4FY2016: Britannia, GSK Consumers and Cox & Kings
Preferred picks: Britannia, Emami, ITC, Jyothy Laboratories, Wonderla Holidays and Thomas Cook India

sharekhan special Q4FY2016 earnings review
Sharekhan Special June 10, 20169
Q4FY2016 result snapshot
CompaniesNet sales
YoY % QoQ %OPM (%) BPS
YoY %BPS
QoQ %Adjusted PAT
YoY % QoQ %Q4FY16 Q4FY15 Q4FY16 Q4FY15 Q4FY16 Q4FY15
FMCG Companies
HUL 7,809.4 7,555.0 3.4 -0.2 17.0 15.9 119 77 1,030.9 911.0 13.2 0.7
ITC 10,168.7 9,188.3 10.7 10.8 36.3 34.2 210 -303 2,495.2 2256.7 10.6 -5.9
Britannia Industries 2,189.8 2,031.8 7.8 -1.5 13.2 12.3 91 -120 190.4 167.3 13.8 -11.2
GSK Consumers 1,052.8 1,165.1 -9.6 6.5 22.2 22.6 -40 609 180.7 196.8 -8.2 37.0
GCPL 2,269.1 2,092.0 8.5 -3.7 19.5 18.5 106 21 310.1 265.4 16.8 -4.0
Marico 1,307.0 1,226.3 6.6 -16.0 16.6 14.0 260 -232 130.7 110.0 18.8 -34.0
Emami 574.6 489.6 17.4 -2.6 26.5 23.1 338 - 110.6 92.8 19.3 12.5
Zydus Wellness 109.8 104.2 5.4 -0.4 21.4 19.6 188 -26 26.4 25.9 1.7 -5.1
Jyothy Laboratories 445.4 400.9 11.1 15.6 14.1 10.3 378 86 35.6 29.1 22.4 -8.7
Other FMCG companies
Dabur India 2,161.3 1,949.7 10.9 1.6 19.2 17.7 149 144 333.4 284.9 17.0 4.6
Total 28,088.0 26,202.9 7.2 24.2 22.4 177 4,843.9 4,339.8 11.6
Consumer discretionary services
Cox & Kings 471.0 489.6 -3.8 -8.0 11.8 9.4 243 -984 -127.6 -77.4 64.9 -549
Thomas Cook India 1,274.3 846.3 50.6 22.7 4.7 4.0 63 9 -9.9 2.3 -540.1 371
Speciality Restaurants
77.0 73.6 4.5 -9.0 -1.4 10.3 -1170 -992 -4.0 1.9 -307.2 -502
Wonderla Holidays 44.8 35.3 26.9 -34.6 37.7 33.3 439 -1138 12.0 7.3 62.7 -38
Valuations
Company CMP (Rs)
EPS (Rs) PE (x) Old Reco.
New Reco.
Price Target (Rs)FY16 FY17E FY18E FY16 FY17E FY18E
FMCG
HUL 893 19.1 22.4 26.9 46.8 39.9 33.2 Buy Buy 980
ITC 363 12.3 13.9 16.3 29.5 26.1 22.3 Buy Buy 375
Britannia Industries 2,791 67.8 83.9 102.0 41.2 33.3 27.4 Buy Buy 3,550
GSK Consumer 5,786 162.6 187.7 207.5 35.6 30.8 27.9 Buy Buy 6,650
Emami 1,024 23.2 27.2 35.6 44.1 37.6 28.8 Buy Buy 1,250
GCPL 1,542 33.5 38.9 47.8 46.0 39.6 32.2 Buy Hold 1,575
Marico 256 5.5 6.6 7.9 46.5 38.8 32.4 Buy Hold 270
Zydus Wellness 773 26.5 30.2 35.3 29.2 25.6 21.9 Buy Buy 915
Jyothy Laboratories 290 8.7 10.0 12.0 33.3 29.0 24.2 Buy Buy 360
Under Soft coverage
Dabur India 307 7.19 8.2 9.4 42.7 37.4 32.5 NA NA -
Consumer discretionary services
Cox & Kings 152 16.8 17.9 25.2 9.1 8.5 6.0 Buy Buy 250
Thomas Cook India 177 0.8 3.0 6.5 221.3 59.0 27.2 Buy Buy 255
Speciality Restaurants 85 0.0 3.1 5.6 - 27.5 15.2 Hold Hold 115
Wonderla Holidays 391 10.6 13.1 17.9 36.9 29.9 21.9 Buy Buy 450

sharekhan special Q4FY2016 earnings review
Sharekhan Special June 10, 201610
Consumer discretionaryConsumer demand remains muted but long-term structural story intact
Q4FY2016 result review
Soft revenue performance amid weak demand, high competition: Sluggish consumer demand, coupled with heightened competition resulted in consumer discretionary companies posting high single to low double-digit revenue growth for the quarter. Further, Titan’s results (2% decline in revenue) were impacted by a month-long jewellers’ strike and new regulation on PAN disclosure for purchases above Rs2 lakh. KDDL (its subsidiary Ethos retails high-end watches) was also adversely affected by the new PAN rule.
Weak global show hurts consolidated performance: Across the board, companies having a global exposure (largely in Europe, Latin American, Middle-East and oil producing countries) in terms of exports (Apparel & Denim for Raymond, Orbit Exports etc) suffered on account of currency volatility and subdued demand. Weakness in Orbit Exports’ and Raymond’s denim and apparel exports negatively impacted their consolidated revenues. While Raymond’s topline witnessed single-digit growth, Orbit Exports posted a sharp 21.6% YoY decline in revenues for the quarter.
Margins a mixed bag: Subdued revenue growth, coupled with higher employee & other costs led to a weak operating performance. Employee costs across the board witnessed a sharp jump (+20-30% YoY) on account of an increase in the minimum wages and introduction of new bonus rule. KDDL, Orbit Exports and Relaxo Footwear saw a substantial contraction in their margins (down 923BPS, 697BPS and 238BPS YoY). On the other hand, Raymond posted a sterling expansion in consolidated margins (+377BPS YoY), led by a sharp margin improvement in its textiles business.
Outlook
We believe that urban discretionary spend is in the early stages of revival, which will witness further improvement as the economy gathers pace and consumer confidence returns to normal levels. Further, the implementation of the Seventh Pay Commission’s recommendations (average 23% hike for all government employees, resulting in benefits for 48 lakh Central Staff and 55 lakh Pensioners) would benefit the passenger vehicle industry. It will also help to boost demand for premium consumer products such as branded apparels, home improvement products, jewellery, consumer durables and kitchen appliances. Therefore, we believe that retail players with strong consumer connect & brand equity, wide distribution reach (employing a judicious mix of online and store presence) and robust balance sheet are likely to emerge as winners in the medium to long term. Volume for these consumer discretionary companies would improve and operating leverage would also kick in, resulting in disproportionate growth in earnings. Further, implementation of Goods & Services Tax (GST) would benefit organized players like Century Plyboard.
Valuation
Consumer discretionary companies have reported a weak financial in Q4FY2016 due to muted consumer demand and growing expenses. As a result, their stock prices have suffered some damage in recent times. Excluding the premium valuations of Page Industries and Jubilant Foodworks (trading at 43x and 32x FY2018 earnings), the other consumer discretionary companies within our coverage universe are trading at an average range of 18-22x FY2018 earnings.
Leaders in Q4FY2016: Raymond and TTK prestige
Laggards in Q4FY2016: Orbit Exports, KDDL and Relaxo Footwear
Preferred picks: Relaxo Footwear, Welspun India and KDDL

sharekhan special Q4FY2016 earnings review
Sharekhan Special June 10, 201611
Q4FY2016 results snapshot
CompanySales OPM (%) Adjusted PAT
Q4 FY16
Q4 FY15
YoY %
Q4 FY16
Q4 FY15
YoY (bps)
Q4 FY16
Q4 FY15
YoY %
Raymond 1,511.4 1,400.3 7.9 10.4 6.6 377 56.2 19.7 184.9
Relaxo Footwear 485.4 440.5 10.2 13.8 16.20 (238) 35.2 42.7 (17.5)
Kewal Kiran Clothing 126.7 104.7 20.9 26.9 26.9 1 21.8 21.4 1.8
Century Plyboards 454.7 409.2 11.1 17.0 19.4 (238) 39.4 41.2 (4.4)
Orbit Exports 33.3 42.5 (21.6) 21.2 28.1 (697) 2.9 6.7 (56.1)
KDDL 108.1 107.5 0.6 9.3 6.8 (923) (3.1) 2.2 NA
Soft coverage
Arvind 2,319.6 2,040.5 13.7 13.0 12.5 48 110.4 96.5 14.4
Titan Company 2,456 2,496 (2) 8.6 10.8 (227) 184.1 215.1 (14.4)
Page Industries 435.6 379.7 14.7 21.1 20.4 69 57.3 47.1 21.5
Jubilant FoodWorks 618 542 14.0 12.1 12.9 (79) 29.5 31.5 (6.6)
TTK Prestige 307.7 286.2 7.5 11.0 9.3 162 21.6 17.6 23.2
IFB Industries 363.4 321.1 13.2 4.4 5.7 (132) 5.0 1.2 325.4
Welspun India 1,628.4 1,365.8 19.2 423 345 23 193.3 161.4 19.8
Valuations (Consolidated)
Company CMP (Rs)
Price target
(Rs)
Reco/view
EPS (Rs) CAGR FY16-
18E
PER (x)
FY16 FY17E FY18E FY16 FY17E FY18E
Raymond 480 520 Hold 20.3 23.1 32.3 26.1 23.6 20.8 14.9
Relaxo Footwear 465 575 Buy 10.0 13.0 17.0 30.4 46.5 35.8 27.4
Kewal Kiran Clothing 1,770 2360 Buy 55.1 68.9 78.9 19.7 32.1 25.7 22.4
Century Plyboard 182 215 Buy 7.5 8.9 10.3 17.2 24.3 20.4 17.7
KDDL 214 230 Buy 5.2 8.6 16.4 77.6 41.2 24.9 13.0
Orbit Exports 222 375 Buy 16.0 17.6 20.8 14.0 13.9 12.6 10.7
Soft coverage
Arvind 311.6 NR Positive 14.1 17.2 21.9 24.6 22.1 18.1 14.2
Titan Company 364 NR Neutral 7.8 9.9 11.8 23.0 46.7 36.8 30.8
Page Industries 14,050 NR Neutral 208.6 260.2 323.8 24.6 67.4 54.0 43.4
Jubilant FoodWorks 1,056 NR Neutral 15.9 23.5 32.9 43.8 66.4 44.9 32.1
TTK Prestige 4,575 NR Neutral 98.6 133.2 168.8 30.8 46.4 34.3 27.1
IFB Industries 336 NR Positive 7.6 12.8 18.4 55.6 44.2 26.3 18.3
Welspun India 107 NR Positive 7 8.3 9.9 18.9 15.3 12.9 10.8
sharekhan special Q4FY2016 earnings review
Sharekhan Special June 10, 201612
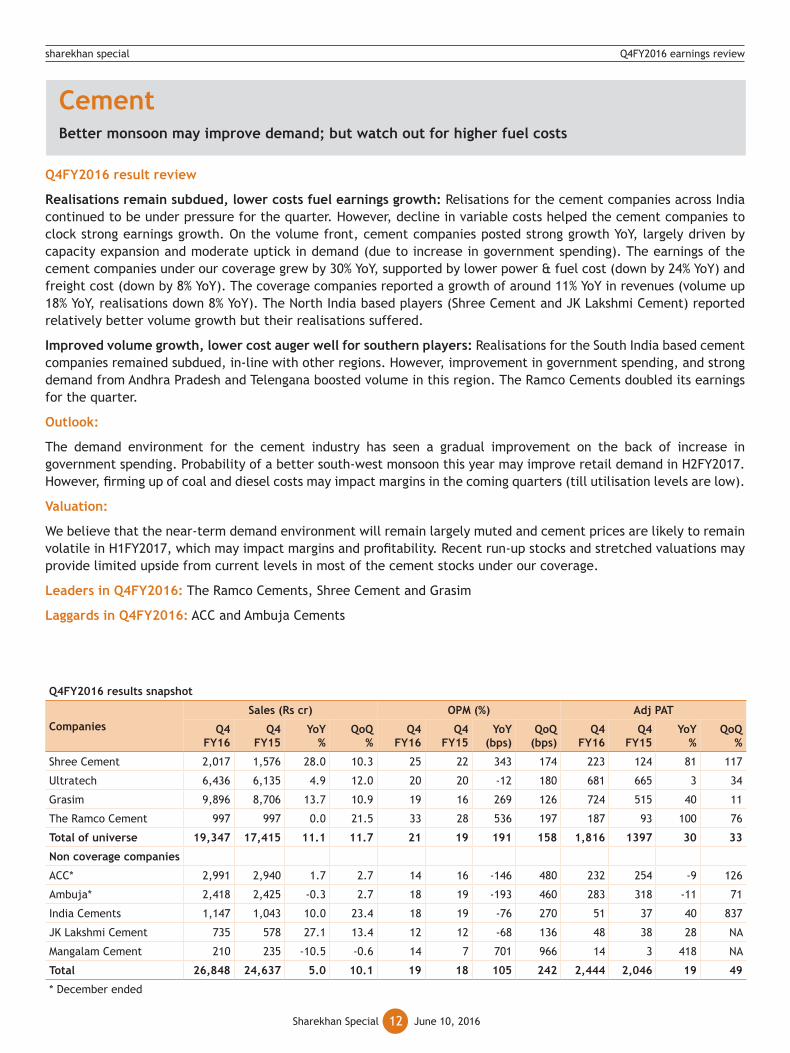
Cement Better monsoon may improve demand; but watch out for higher fuel costs
Q4FY2016 result review
Realisations remain subdued, lower costs fuel earnings growth: Relisations for the cement companies across India continued to be under pressure for the quarter. However, decline in variable costs helped the cement companies to clock strong earnings growth. On the volume front, cement companies posted strong growth YoY, largely driven by capacity expansion and moderate uptick in demand (due to increase in government spending). The earnings of the cement companies under our coverage grew by 30% YoY, supported by lower power & fuel cost (down by 24% YoY) and freight cost (down by 8% YoY). The coverage companies reported a growth of around 11% YoY in revenues (volume up 18% YoY, realisations down 8% YoY). The North India based players (Shree Cement and JK Lakshmi Cement) reported relatively better volume growth but their realisations suffered.
Improved volume growth, lower cost auger well for southern players: Realisations for the South India based cement companies remained subdued, in-line with other regions. However, improvement in government spending, and strong demand from Andhra Pradesh and Telengana boosted volume in this region. The Ramco Cements doubled its earnings for the quarter.
Outlook:
The demand environment for the cement industry has seen a gradual improvement on the back of increase in government spending. Probability of a better south-west monsoon this year may improve retail demand in H2FY2017. However, firming up of coal and diesel costs may impact margins in the coming quarters (till utilisation levels are low).
Valuation:
We believe that the near-term demand environment will remain largely muted and cement prices are likely to remain volatile in H1FY2017, which may impact margins and profitability. Recent run-up stocks and stretched valuations may provide limited upside from current levels in most of the cement stocks under our coverage.
Leaders in Q4FY2016: The Ramco Cements, Shree Cement and Grasim
Laggards in Q4FY2016: ACC and Ambuja Cements
Q4FY2016 results snapshot
CompaniesSales (Rs cr) OPM (%) Adj PAT
Q4 FY16
Q4 FY15
YoY %
QoQ %
Q4 FY16
Q4 FY15
YoY (bps)
QoQ (bps)
Q4 FY16
Q4 FY15
YoY %
QoQ %
Shree Cement 2,017 1,576 28.0 10.3 25 22 343 174 223 124 81 117
Ultratech 6,436 6,135 4.9 12.0 20 20 -12 180 681 665 3 34
Grasim 9,896 8,706 13.7 10.9 19 16 269 126 724 515 40 11
The Ramco Cement 997 997 0.0 21.5 33 28 536 197 187 93 100 76
Total of universe 19,347 17,415 11.1 11.7 21 19 191 158 1,816 1397 30 33
Non coverage companies
ACC* 2,991 2,940 1.7 2.7 14 16 -146 480 232 254 -9 126
Ambuja* 2,418 2,425 -0.3 2.7 18 19 -193 460 283 318 -11 71
India Cements 1,147 1,043 10.0 23.4 18 19 -76 270 51 37 40 837
JK Lakshmi Cement 735 578 27.1 13.4 12 12 -68 136 48 38 28 NA
Mangalam Cement 210 235 -10.5 -0.6 14 7 701 966 14 3 418 NA
Total 26,848 24,637 5.0 10.1 19 18 105 242 2,444 2,046 19 49
* December ended

sharekhan special Q4FY2016 earnings review
Sharekhan Special June 10, 201613
Valuations
Company Reco Price target CMP (Rs)
Adj. EPS (Rs) PE (x)
FY16 FY17E FY18E FY16 FY17E FY18E
Shree Cement * Hold 13,900 13,585 136 318 411 100 43 33
Ultratech Hold 3,580 3,356 80 101 130 42 33 26
Grasim Buy 4,705 4,333 251 325 400 17 13 11
The Ramco Cement Hold UR 534 22 26 31 25 21 17
India cements # UR NA 97 5 9 13 21 11 7
JK Lakshmi # UR NA 355 1 7 18 710 51 20
Mangalam Cement # UR NA 295 -8 13 32 -38 23 9
UR – Under Review # soft coverage * Shree cement 9MFY2016, change in accounting year to march
ITIn-line quarter, valuation in comfort zone
Q4FY2016 result review
Broadly an in-line quarter: The top five Indian IT service companies delivered an overall in-line revenue performance, although HCL Technologies (HCL Tech) missed the estimates. During Q4FY2016, the top five companies reported a growth of 2.0% QoQ on a constant-currency (CC) basis and 1.6% (versus our estimate of 1.8%) on a reported basis. Once again, Infosys deliver a strong performance for four back-to-back quarters now, though, on an organic basis, Tata Consultancy Service (TCS) led the pack with 2.1% QoQ growth. Tech Mahindra reported an overall in-line operating performance, while HCL Tech and Wipro lagged behind the estimates. Importantly, Cognizant registered a negative growth of 0.9% on a sequential basis, in line with the company’s guidance. On the operating profit margin front, TCS, Wipro and HCL Tech fell short of expectations despite the absence of Chennai flood cost and rupee tailwinds, while Infosys and Tech Mahindra delivered an in-line performance.
Demand commentary remains decent, cautious on margins: The managements of most of the companies foresee challenges in margin expansion in the coming quarters, owing to ongoing higher spending in digital technologies, integration issues (HCL Tech, Wipro and Tech M), pricing pressures and wage hikes. Though Infosys provided an industry-leading revenue growth guidance of 11.5-13.5% (on CC basis) for FY2017 (ahead of NASSCOM’s growth guidance of 10-12%), the management expects operating margins to remain in the range of 24-26% for FY2017 (25% in FY2016). TCS acknowledged challenges in maintaining the margin band of 26-28% in FY2017, owing to continued investments in digital technology. The managements of Wipro and Tech Mahindra noted that the consolidation of the acquired entities will have an adverse impact on their operating margins in FY2017, HCL Tech stopped providing margins guidance, owing to integration headwinds from Volvo and Geometric Ltd in FY2017.
Outlook
Industry transition continues; betting on digital technology: Given the intense competitive environment for the Indian IT companies, along with continued investments in digital technology and consolidation of relatively low-margin acquisitions, the operating margins will expectedly remain under pressure in FY2017. However, we believe the continuous ramp-ups in digital spending and the high-level automation will help the companies to enhance profitability gradually in next 2-3 years. We continue to maintain our stance that the IT sector is going through a transition phase, with an increasing digital adoption and commoditisation of legacy services. This will continue to result in earnings volatility in the near term.
Valuation
Comfort on valuation; remain selective: Growth concerns for near to medium term has resulted in the de-rating of the IT sector valuation in the last one year. Currently, the stocks are attractively trading at 12-17x FY2018 estimates. We remain positive on the IT sector, given the reasonable valuation and expected growth pick-up in FY2017/2018E. The industry’s digital transformation (spending is moving away from the legacy services) could continue to result in earnings volatility in the near to medium term. We believe the current valuation largely reflects the new normal growth expectation for the industry for FY2017/2018E. We remain selective in our stock preference. In order of preference, we remain positive on Infosys, TCS and HCL Tech, and, in the mid-cap space, we remain positive on Persistent Systems.
Leaders: Infosys, TCS
Laggards: Wipro
Preferred picks: TCS, Infosys and HCL Tech (in the large-cap space), and Persistent Systems (in the mid-cap space).

sharekhan special Q4FY2016 earnings review
Sharekhan Special June 10, 201614
Oil & gasCrude weighs on oil explorers; refiners enjoy high margins
Q4FY2016 results snapshot
CompanyRevenues
(Rs Cr)QoQ (%)
YoY (%)
EBITDA (Rs Cr)
EBITDA Margin
(%)
QoQ (BPS)
YoY (BPS)
Net profit
(Rs cr)
QoQ (%) YoY (%)
TCS 28,448.6 4.0 17.5 7,906.8 27.8 -52 -138 6,341.2 3.8 7.4
Infosys 16,550.0 4.1 23.4 4,639.0 28.0 81 20 3,597.0 3.8 16.1
Wipro 13,632.4 6.0 12.3 2,804.7 20.6 -21 -210 2,235.0 0.0 -1.6
HCL Technologies* 10,698.0 3.5 15.4 2,379.0 22.2 72 -33 1,926.0 0.3 14.4
Tech Mahindra 6,883.7 2.7 12.5 1,161.3 16.9 -8 169 897.0 18.2 90.0
Persistent Systems 677.1 14.4 36.1 107.4 15.9 -289 -434 80.8 4.3 6.2
Firstsource Solutions 873.0 6.8 15.8 116.2 13.3 102 14 79.7 18.9 27.9
*Changed its financial year ending from June-end to March-end during March 2016-ending quarterly results; hence, FY2016 consists of only 9-month period
Source: Company, Sharekhan Research
Valuations
Company Reco Price target (Rs) CMP (Rs)
EPS (Rs) P/E (x)FY16E FY17E FY18E FY16E FY17E FY18E
Infosys Buy 1,430.0 1,266.5 59.0 67.5 75.3 21.5 18.8 16.8
TCS Buy 2,750.0 2,630.9 123.6 135.9 151.6 21.3 19.4 17.4Wipro Hold 650.0 541.1 36.2 40.5 45.1 14.9 13.4 12.0HCL Technologies Buy 950.0 721.1 40.3 56.9 65.4 17.9 12.7 11.0Tech Mahindra* Neutral NA 549.7 36.3 36.4 43.1 15.1 15.1 12.8Persistent Systems Buy 820.0 726.5 37.2 42.2 49.9 19.5 17.2 14.6
Firstsource Solutions Hold 44.0 41.5 3.9 4.9 5.7 10.5 8.5 7.3
*EPS of Tech Mahindra excludes treasury shares Source: Company, Sharekhan Research
Q4FY2016 result review
Upstream companies fetch low realisations but profits unaffected: The global crude oil price in Q4FY2016 averaged around $33 per barrel, lower by more than 39% YoY and down by around 22% QoQ. Mirroring the same, the realisations of upstream companies were substantially lower in this quarter. Oil India (OIL) reported a 14% QoQ drop in revenue but managed to arrest the fall at the operating level by controlling costs. Thus, the operating profit of the company was flat QoQ. Supported by substantially higher other income and a lower tax rate, OIL’s adjusted profit after tax (PAT) grew by 66% QoQ to Rs684 crore. ONGC’s revenue declined by 11% QoQ to Rs16,385 crore and operating margin contracted. However, a Rs1550 crore write-back linked to KGD-DWN98/2 and lower taxes helped ONGC report a better PAT. Subdued crude oil prices also hit Selan Exploration during the quarter, but one has to understand that a large part of this pressure is due to higher depreciation and amortisation costs.
Refiners reap higher margins; few hit by inventory losses: The benchmark Singapore gross refining margin (GRM) remained steady in Q4FY2016 at $7.7 per barrel. Reliance Industries (RIL) continued its strong performance with a GRM of $10.8 per barrel, a premium of $3.1 per barrel over the Singapore GRM due to a better product mix and opportunistic crude sourcing. RIL’s refining segment EBIT margin expanded by 200BPS QoQ and the petrochemicals segment continued its strong performance. The public sector refiners (OMCs) reported higher GRM, but to some extent that was negated by inventory losses. Owing to inventory losses, Indian Oil (IOCL) and Bharat Petroleum (BPCL) reported soft GRM, while Hindustan Petroleum’s (HPCL) GRM was steady at $7.5/bbl. GAIL’s PAT improved by 15% QoQ, as losses in its loss-making petrochemicals business declined.

sharekhan special Q4FY2016 earnings review
Sharekhan Special June 10, 201615
Outlook
Global crude oil prices hovered around $33 per barrel in Q4FY2016 and reflected in the revenues of upstream companies. However, crude oil has rebounded in early part of Q1FY2017 and is currently trading around $50 per barrel. This is likely to lift the average realizations of the upstream oil companies in Q1FY2017. Oil prices are showing signs of bottoming and are likely to find equilibrium at a higher level. Hence, we expect the net realizations of upstream oil companies to be better in the near future. Further, the upstream oil companies have received some relief in the form of change in the cess structure from the prevailing fixed to 20% ad-velorem rates. On the other hand, we expect softer GRM for refineries, as the Singapore GRM is showing weakness in the Q1FY2017 year-till-date (YTD).
Preferred picks:
Our preferred pick among the private oil players is RIL given the potential earnings improvement with its new downstream capacities turning operational in FY2017. This would help improve RIL’s overall margins.
Leaders in Q4FY2016: RIL and Oil India
Q4FY2016 results snapshot
CompanySales (Rs cr) OPM (%) PAT (Rs cr)
Q4FY16 Q4FY15 YoY % QoQ % Q4FY16 Q4FY15 YoY % QoQ % Q4FY16 Q4FY15 YoY % QoQ %
Coverage
RIL 49,957 56,043 -10.9 -11.7 21.5 15.4 608 331 7,320 6,243 17 1.4
Oil India 2,009 2,713 -25.9 -14.2 36.9 30.3 660 481 684 552 24 67
Selan Exploration 12.4 17.9 -30.4 -19.2 -1.2 31.7 -3,286 -1,362 1.1 4.0 -73 -57
Non-coverage
GAIL 11,732 14,271 -17.8 -12.8 10.4 4.5 592 -7 770 511 51 16
ONGC 16,385 21,647 -24.3 -11.4 27.4 35.7 -828 84 4,416 3,935 12 243
Valuations
ParticularsCMP (Rs)
EPS CAGR over FY15-17E (%)
PE (x) New/Reco
Price targetFY16 FY17E FY18E FY16 FY17E FY18E
Coverage
RIL 970 92 95 110 9.3 11 10 9 Buy 1,250
Oil India 359 42 34 40 -3.1 8 11 9 Hold 400
Selan Exploration 224 7.9 12.7 14.9 37.7 28 18 15 Hold 345
Non-coverage
GAIL 375 18 28 32 33.9 21 13 12 NA NA
ONGC 220 19 19 26 17.2 12 12 9 NA NA

sharekhan special Q4FY2016 earnings review
Sharekhan Special June 10, 201616
PharmaPerformance in line with expectation; stay selective
Q4FY2016 result review
Q4FY2016 performance in line with expectation: In Q4FY2016, the performance of pharmaceutical companies in our coverage universe was largely in line with our expectations. On an aggregate basis, our coverage universe reported a 20.4% YoY growth in revenues while the Operating Profit Margin (OPM) improved by 417.8BPS to 24.4%. During the quarter, the US business of majority pharma companies recorded double-digit growth on account of big launches and low competition in existing products, whereas the emerging markets’ (EM) revenues were affected due to currency headwinds. Domestic growth was in line with industry growth during the quarter.
Improvement in profitability: The OPM of our coverage universe improved by 417.8BPS YoY (mainly on account of big-ticket launches and low base in Q4FY2015). The net profit of the coverage universe improved by 45.2% YoY. Approval for key products, big launches, better product mix and cost control measures helped boost profitability of the pharma companies, thereby lifting growth in aggregate profits. Within our coverage universe, Cadila and Cipla disappointed with weaker–than-expected performance.
Outlook
USFDA concerns, rich valuations near-term pain points; But outlook remains healthy over medium term: In the recent past, the regulatory activism (USFDA’s stringent inspections and actions) has created some uncertainties surrounding Indian pharma companies and could mar their financial performance in the near term. Given the rich valuations and regulatory issues, the pharma sector has seen some de-rating over the past few months. However, we believe this is a passing phase and an opportunity to accumulate with a 2-3 year view. Going forward, we expect a large chunk of the pending ANDAs (product approvals to launch generic formulations in USA) to unravel, helping to revive growth. The domestic market is also likely to aid growth, driven by a robust volume growth and the introduction of new drugs. Overall, while we are positive on the long-term prospects of the pharma sector, a few of the frontline players (Lupin, Sun, Cadila and Dr Reddy’s) may see some headwinds in the short term on account of USFDA warning letters.
Valuation
We believe that the reset (de-rating) of valuation multiples in the past few months is likely to act as an overhang in the near term (6-9 months). However, the long-term outlook remains healthy. Therefore, we remain constructive but selective in this space.
Leaders in Q4FY2016: Aurobindo Pharma, Divis Labs, Glenmark Pharma, Lupin, Sun Pharma and Torrent Pharma
Laggards in Q4FY2016: Cipla and Cadila
Preferred picks: Aurobindo Pharma, Glenmark Pharma and Sun Pharma

sharekhan special Q4FY2016 earnings review
Sharekhan Special June 10, 201617
Q4FY2016 results snapshot Rs cr
Companies
Net sales OPM (%) Adjusted PATQ4
FY16Q4
FY15YoY
% QoQ
%Q4
FY16Q4
FY15BPS
(YoY)BPS
(QoQ)Q4
FY16Q4
FY15 YoY
% QoQ
%
Coverage
Aurobindo 3,675.0 3,166.0 16.1 10.3 24.0 20.7 330.0 74.0 558.3 404.6 38.0 9.5
Cadila 2,449.0 2,289.0 7.0 0.9 23.7 23.2 50.0 -11.0 388.0 387.0 0.3 -0.5
Cipla 3,267.0 3,093.0 5.6 5.1 6.7 16.4 -970.0 -791.0 80.9 260.0 -68.9 -76.4
Divis 1,095.4 817.0 34.1 28.4 36.3 40.8 -450.0 -142.0 322.2 263.0 22.5 30.4
IPCA Lab 624.6 623.0 0.3 -8.7 10.2 4.6 560.0 -287.0 37.6 16.5 127.9 62.1
Lupin 4,181.0 3,078.0 35.8 17.6 32.7 25.6 710.0 804.0 807.1 547.0 47.6 530.0
Sun Pharma 7,634.0 6,145.0 24.2 7.8 33.0 14.3 1,870.0 239.0 1,714.0 888.1 93.0 21.0
Torrent Pharma 1,499.0 1,154.0 29.9 -2.6 32.3 14.0 1,830.0 -754.0 357.0 130.0 174.6 -26.1
Total - A 26,649.8 22,141.0 20.4 24.4 20.2 417.8 4,592.1 3,163.2 45.2
Under soft coverage
Granules India 373.3 355.0 5.2 8.2 21.2 13.8 740.0 154.0 33.2 23.0 44.3 22.9
Dr Reddy's Lab 3,756.0 3,870.0 -2.9 -5.3 24.3 20.8 350.0 -122.0 551.5 515.0 7.1 -3.8
Biocon 969.9 830.0 16.9 17.0 21.1 21.4 -30.0 -114.0 105.0 121.5 -13.6 -1.9
Total - B 5,099.2 5,055.0 0.9 22.2 18.7 353.3 689.7 659.5 4.6
Grand Total (A+B) 31,749.0 27,196.0 16.7 23.3 19.4 385.6 5,281.8 3,822.7 38.2
Valuations
Companies
CMP (Rs)EPS (Rs) P/E (x) Old
RecoNew Reco
Price target (Rs)FY16 FY17E FY18E FY16 FY17E FY18E
Aurobindo 773 35.0 44.9 59.0 22.1 17.2 13.1 Buy Buy 885
Cadila 320 14.9 18.3 22.1 21.4 17.5 14.5 Hold Hold 352
Cipla 473 19.5 24.6 33.5 24.3 19.2 14.1 Hold Hold 581
Divis 1,135 39.2 46.3 54.6 29.0 24.5 20.8 Buy Buy 1,150
Glenmark 764 37.8 51.5 54.8 20.2 14.8 13.9 Hold Buy 1,096
Lupin 1,431 50.4 67.4 84.1 28.4 21.2 17.0 Hold Hold 1,850
Sun Pharma 739 22.4 30.4 33.8 33.0 24.3 21.9 Buy Buy 945
Torrent Pharma 1,397 110.0 68.9 76.3 12.7 20.3 18.3 Buy Hold 1,525

sharekhan special Q4FY2016 earnings review
Sharekhan Special June 10, 201618
PowerBroad outlook unchanged; PTC India springs a pleasant surprise
Q4FY2016 result review
A mixed quarter: During Q4FY2016, the power sector reported mixed results. While PTC India (PTC) and Power Grid Corporation of India (PGCIL) registered earnings growth on a YoY basis, power generating companies like NTPC and CESC reported muted numbers. PTC recorded a very strong 44% YoY earnings growth in Q4FY2016, which was mainly supported by stellar 55% YoY growth in volume. PGCIL’s earnings growth of 13% YoY was lower than the 23% growth in revenues due to higher interest and depreciation costs. On the other hand, NTPC reported a decline in earnings and earnings of CESC were flat YoY, although the same was in line with our estimates. The overall power unit volume of CESC increased by 10% YoY and it continued to source substantially higher power from its subsidiary plant at Haldia.
Weak demand; power deficit drops further: There was no improvement in the overall plant load factor of the thermal power generation companies; it stood at around 64% (63% in Q3FY2016; 64.6% in Q4FY2015). The power deficit continued to fall (down from 2.5% in Q4FY2015 to 1.7% in Q4FY2016). While the demand remained weak amid lack of meaningful improvement in industrial activity, incremental capacity addition remained strong, with an increasing share of renewable energy (gestation period of renewable energy is very low compared to thermal plants). To some extent, the lower demand can be attributed to weak purchasing power of the State Electricity Boards (SEBs). We believe that revival in the power sector demand will take some more time.
Outlook
Although the power sector is facing multiple challenges for the long term, the government’s latest reform to resurrect SEBs (UDAY Scheme) could usher in some positive changes. Another healthy development is that after a long time, we are witnessing efforts from Coal India to improve coal availability. A gradual revival in power sector demand hinges on two things: recovery in industrial activity and meaningful improvement in SEBs’ balance sheets. In the interim, we expect subdued incremental capacity addition (except steady capacity addition by public sector players like NTPC). However, the M&A activities may continue for some time to come.
Preferred picks
We continue to be positive on PTC and retain our Buy rating on the stock. However, we have downgraded CESC from Buy to Hold, given the limited scope for upside (stock had appreciated by more than 20% after we upgraded to Buy in recent past). Also, the company’s unrelated diversification by way of an investment in the IPL franchisee is likely to be another dampener following the cash-burning investment in Spencer’s. PTC has also appreciated after delivering a consensus-beating performance and positive growth guidance. But, we remain positive on the stock due to its attractive valuation (balance sheet approach). For more than a year, we have been reiterating our Buy on PTC, considering its debt-free balance sheet and a substantial value of investments on its books. Further, the management has hinted at better volume growth in the future, while the street has factored in a muted outlook. Hence, we remain positive on PTC despite the recent run-up. Among the non-coverage stocks, we believe PGCIL is having a very clear earnings growth visibility, which would be the key positive going ahead.
Leaders in Q4FY2016: PTC India and PGCIL
Laggards in Q4FY2016: CESC and NTPC

sharekhan special Q4FY2016 earnings review
Sharekhan Special June 10, 201619
Q4FY2016 results snapshot Rs cr
CompanySales OPM (%) PAT
Q4 FY16
Q4 FY15
YoY %
QoQ %
Q4 FY16
Q4 FY15
YoY (bps)
QoQ (bps)
Q4 FY16
Q4 FY15
YoY %
QoQ %
CoverageCESC 1,465 1,416 3.5 -3.8 32.5 31.7 79 1292 248 244 1.6 121PTC India 3,043 2,357 29.1 3.6 2.0 2.0 1 10 46 32 43.8 2.2
Non-coverage
NTPC 18,113 19,315 -6.2 4.0 30.1 24.4 571 240 2,716 2,944 -7.7 8.9Power Grid 5,760 4,703 22.5 6.5 88.4 86.3 214 -209 1,599 1,412 13.2 -0.9
Valuations
Company CMP (Rs)
BVPS CAGR over
FY15-17E (%)
PB (x)
Reco Price targetFY16 FY17E FY18E FY16 FY17E FY18E
Coverage
CESC 557 651 691 702 4% 0.9 0.8 0.8 Hold 580
PTC India 72 94 99 104 5% 0.8 0.7 0.7 Buy 90
Non-coverage
NTPC 151 108 113 121 6% 1.4 1.3 1.2 NA NA
Power Grid 153 82 95 107 14% 1.8 1.6 1.4 NA NA
TelecomGood operating performance but contrasting metrics
Q4FY2016 result review
Good revenue performance; divergent drivers: Both Bharti Airtel (Bharti) and Idea Cellular (Idea) posted strong revenue performance. Bharti’s India mobile growth stood at 4.8% QoQ while Idea’s revenue growth came in at 5.3% QoQ. Interestingly, the growth posted by both the players was driven by different factors. Bharti’s growth was led by higher volume while Idea posted realization-led growth. Bharti’s volume grew by 6% QoQ, but it continued to face weak pricing trend (voice realisation down 1.5% QoQ while data realisation was down 3.9% QoQ). On the other hand, Idea reduced the freebies and the discounted tariffs, which resulted in voice pricing surge of 4.7% QoQ. Idea reported subdued volume growth of +1.2% QoQ.
Margin expansion continues: Both Bharti as well as Idea posted margin expansion during the quarter. Bharti’s consolidated margins expanded by 150BPS QoQ, from 35.1% in Q3FY2016 to 36.6% in Q4FY2016 on the back of strong margin expansion in the India mobile business (+130BPS QoQ). Also, Bharti’s mobile margin at 39.9% was one of the highest margin performance recorded by the company in the last 18 quarters. Idea also witnessed robust margin expansion (+340BPS QoQ), led by optimization in the subscriber acquisition cost (-9% QoQ) and reduction in the roaming and access charges (-2.6% QoQ).
Net earnings impacted by spectrum amortization & interest charge: A strong operating performance failed to percolate down to the net earnings for Idea, as interest and depreciation costs increased sharply. The interest cost surged by 164% QoQ from Rs306 crore in Q3FY2016 to Rs808 crore in Q4FY2016, while the depreciation cost increased by 32% YoY. The increase in these charges was mainly on account of 2014 and 2015 spectrum wins, which are now being built into the financials. For Bharti, the deprecation cost rose by 28.3% QoQ. Idea’s consolidated earnings declined by 24.7% QoQ, while Bharti posted a marginal 4% QoQ growth in earnings on account of lower forex losses.

sharekhan special Q4FY2016 earnings review
Sharekhan Special June 10, 201620
Bharti Infratel posts in-line performance: Bharti Infratel posted in-line performance for the quarter. Its consolidated revenue growth came in at 2.2% QoQ, aided by improving tenancy (at 2.2x for Q4FY2016), while margins expanded by 164BPS QoQ. Better asset sweating (in the form of leverage from depreciation and interest) resulted in a robust 17% QoQ growth in net earnings.
Outlook
The management of both Bharti as well as Idea echoed concerns about high competitive dynamics restricting voice pricing growth, which is the key driver for revenue and margin. However, the key players remained confident on the strong data growth opportunity going forward. They have devised their respective strategy to capitalise on the data growth opportunity with the launch of 4G services and increasing penetration of 3G services in various parts of the country. On the upcoming spectrum auction, both Bharti and Idea pointed out that the high reserve price in the 700 mhz band remains a key constraint for bidding in the auction.
Valuation
We believe that the Indian mobile business is at the cusp of exponential data growth and the incumbents like Bharti (with its rich spectrum portfolio and aggression) are well placed to capitalise on the same in the medium to long term period. But, the impending launch of 4G by Reliance Jio (its strategy towards pricing and growth) remains a key risk, and therefore we continue with our Hold rating on Bharti with a price target of Rs425 (valued at 6.2x its FY2018 EV/EBITDA). While for Idea, the sheer requirement of capital expenditure to drive data growth momentum would put its balance sheet under strain. Hence, we have a cautious view on Idea. We hold a positive view on Bharti Infratel as it is well placed to cash in on the upcoming data growth opportunity. We also like the buyback arbitrage in Bharti Infratel (Company has announced Rs2,000 crore buyback at a maximum price of Rs450).
Leaders in Q4FY2016: Bharti Airtel
Laggards in Q4FY2016: Idea Cellular
Preferred picks: Bharti Airtel and Bharti Infratel
Q4FY2016 results snapshot (consolidated)
CompanySales (Rs cr) OPM (%) Adj. PAT (Rs cr)
Q4FY16 Q4FY15 YoY % QoQ % Q4FY16 Q4FY15 YoY % QoQ % Q4FY16 Q4FY15 YoY % QoQ %
Bharti Airtel 24,983 23,040 8.4 3.6 36.6 35.2 135.8 150.4 1,515 1,415 7.1 4.0
Idea Cellular 9,484 8,423 12.6 5.3 38.1 36.4 174.4 340.4 576 942 (38.9) (24.7)
Bharti Infratel 3,162 2,947 7.3 2.2 45.1 45.4 (31.1) 163.8 662 558 18.7 17.0
Valuations (consolidated)
ParticularsCMP (Rs)
Price target
Reco/view EPS EPS CAGR
EV/EBITDA
FY16 FY17 FY18 FY16 FY17 FY18
Bharti Airtel 353 425.0 Hold 11.9 16.1 20.3 30.6 6.0 5.6 5.1
Idea Cellular 105 NR Cautious 8.60 4.9 5.7 (18.6) 5.7 5.1 4.7
Bharti Infratel 377 NR Positive 12.6 15.6 16.8 27.9 12.6 11.2 10.1

sharekhan special Q4FY2016 earnings review
Sharekhan Special June 10, 201621
Miscellaneous
Q4FY2016 results snapshot
CompanyNet sales (Rs cr) OPM (%) Net profit (Rs cr)
Q4FY16 Q4FY15 YoY (%)
QoQ (%)
Q4FY16 Q4FY15 YoY (BPS)
QoQ (BPS)
Q4FY16 Q4FY15 YoY (%)
QoQ (%)
UPL 4,340.0 3,624.0 19.8 40.2 22.6 21.7 90 240 610.0 459.0 32.9 106.8
PI Industries 584.8 537.0 8.9 14.4 18.3 17.7 60 -220 93.4 55.5 68.3 34.0
BEL 3,214.8 2,928.2 9.8 111.9 31.1 27.1 400 1,180 801.7 722.9 10.9 171.1
Ratnamani Metal 507.0 374.9 35.2 39.2 16.4 14.9 150 120 46.1 32.3 42.7 34.4
Gateway Distriparks 257 264 -3 -4 19 29 -1,041 -409 26 49 -46 -14
IRB 1,537 990 55 15 48 58 -948 -344 151 138 9 -11
Gayatri Projects# 668 560 19 58 14 13 36 -56 29 16 79 134
ITNL 2,548 1,445 76 16 30 27 329 -564 80 39 105 -49
Info Edge 204 173 18 18 31 31 -90 833 57 53 8 72
Zee Ent 1,532 1,347 14 -4 27 20 690 3 261 231 13 -5
INOX Leisure 287 218 32 -16 5 5 42 -1022 16 -4 -497 -22
Supreme Industries* 1,268 1,152 10 27 17 17 13 184 126 102 24 54
#Adjustment in accounting of Snowman Logistics from Subsidiary to Associate company * 9MFY2016 change in account year to March
DisclaimerThis document has been prepared by Sharekhan Ltd. (SHAREKHAN) and is intended for use only by the person or entity to which it is addressed to. This document may contain confidential and/or privileged material and is not for any type of circulation and any review, retransmission, or any other use is strictly prohibited. This document is subject to changes without prior notice. This document does not constitute an offer to sell or solicitation for the purchase or sale of any financial instrument or as an official confirmation of any transaction. Though disseminated to all customers who are due to receive the same, not all customers may receive this report at the same time. SHAREKHAN will not treat recipients as customers by virtue of their receiving this report. The information contained herein is obtained from publicly available data or other sources believed to be reliable and SHAREKHAN has not independently verified the accuracy and completeness of the said data and hence it should not be relied upon as such. While we would endeavour to update the information herein on a reasonable basis, SHAREKHAN, its subsidiaries and associated companies, their directors and employees (“SHAREKHAN and affiliates”) are under no obligation to update or keep the information current. Also, there may be regulatory, compliance, or other reasons that may prevent SHAREKHAN and affiliates from doing so. This document is prepared for assistance only and is not intended to be and must not alone be taken as the basis for an investment decision. Recipients of this report should also be aware that past performance is not necessarily a guide to future performance and value of investments can go down as well. The user assumes the entire risk of any use made of this information. Each recipient of this document should make such investigations as he deems necessary to arrive at an independent evaluation of an investment in the securities of companies referred to in this document (including the merits and risks involved), and should consult his own advisors to determine the merits and risks of such an investment. The investment discussed or views expressed may not be suitable for all investors. We do not undertake to advise you as to any change of our views. Affiliates of SHAREKHAN may have issued other reports that are inconsistent with and reach different conclusion from the information presented in this report. This report is not directed or intended for distribution to, or use by, any person or entity who is a citizen or resident of or located in any locality, state, country or other jurisdiction, where such distribution, publication, availability or use would be contrary to law, regulation or which would subject SHAREKHAN and affiliates to any registration or licencing requirement within such jurisdiction. The securities described herein may or may not be eligible for sale in all jurisdictions or to certain category of investors. Persons in whose possession this document may come are required to inform themselves of and to observe such restriction. Either SHAREKHAN or its affiliates or its directors or employees/representatives/clients or their relatives may have position(s), make market, act as principal or engage in transactions of purchase or sell of securities, from time to time or may be materially interested in any of the securities or related securities referred to in this report and they may have used the information set forth herein before publication. SHAREKHAN may from time to time solicit from, or perform investment banking, or other services for, any company mentioned herein. Without limiting any of the foregoing, in no event shall SHAREKHAN, any of its affiliates or any third party involved in, or related to, computing or compiling the information have any liability for any damages of any kind. The analyst certifies that all of the views expressed in this document accurately reflect his or her personal views about the subject company or companies and its or their securities and do not necessarily reflect those of SHAREKHAN. Further, no part of the analyst’s compensation was, is or will be, directly or indirectly related to specific recommendations or views expressed in this document.
Please refer the Risk Disclosure Document issued by SEBI and go through the Rights and Obligations and Do’s and Dont’s issued by Stock Exchanges and Depositories before trading on the Stock Exchanges. Please refer disclaimer for Terms of Use.
Compliance Officer: Ms. Namita Amod Godbole; Tel: 022-6115000; e-mail: [email protected] • Contact: [email protected]
Registered Office: Sharekhan Limited, 10th Floor, Beta Building, Lodha iThink Techno Campus, Off. JVLR, Opp. Kanjurmarg Railway Station, Kanjurmarg (East), Mumbai – 400042, Maharashtra. Tel: 022 - 61150000. Sharekhan Ltd.: SEBI Regn. Nos.: BSE: INB/INF011073351 / BSE-CD ; NSE: INB/INF/INE231073330 ; MSEI: INB/INF261073333 / INE261073330 ; DP: NSDL-IN-DP-NSDL-233-2003 ; CDSL-IN-DP-CDSL-271-2004 ; PMS-INP000000662; Mutual Fund-ARN 20669 ; Commodity trading through Sharekhan Commodities Pvt. Ltd.: MCX-10080 ; (MCX/TCM/CORP/0425) ; NCDEX-00132 ; (NCDEX/TCM/CORP/0142) ; NCDEX SPOT-NCDEXSPOT/116/CO/11/20626 ; For any complaints email at [email protected] ; Disclaimer: Client should read the Risk Disclosure Document issued by SEBI & relevant exchanges and Do’s & Don’ts by MCX & NCDEX and the T & C on www.sharekhan.com before investing.
For Private Circulation only
Sharekhan Limited, its analyst or dependant(s) of the analyst might be holding or having a position in the companies mentioned in the article.