Embed Size (px)
Citation preview

Q4’17EARNINGS Presentation

This presentation contains non-GAAP financial measures relating to our performance. You can find the reconciliation of these measures to the most directly comparable GAAP financial measure in the Appendix at the end of this presentation. The non-GAAP financial measures disclosed by Intel should not be considered a substitute for, or superior to, the financial measures prepared in accordance with GAAP. Please refer to “Explanation of Non-GAAP Measures” in Intel's quarterly earnings release for a detailed explanation of the adjustments made to the comparable GAAP measures, the ways management uses the non-GAAP measures, and the reasons why management believes the non-GAAP measures provide investors with useful supplemental information.
Statements in this presentation that refer to Business Outlook, future plans and expectations are forward-looking statements that involve a number of risks and uncertainties. Words such as "anticipates," "expects," "intends," "goals," "plans," "believes," "seeks," "estimates," "continues," "may," "will," “would,” "should," “could,” and variations of such words and similar expressions are intended to identify such forward-looking statements. Statements that refer to or are based on projections, uncertain events or assumptions also identify forward-looking statements. Such statements are based on management's expectations as of January 25, 2018 and involve many risks and uncertainties that could cause actual results to differ materially from those expressed or implied in these forward-looking statements. Important factors that could cause actual results to differ materially from the company's expectations are set in Intel's earnings release dated January 25, 2018, which is included as an exhibit to Intel’s Form 8-K furnished to the SEC on such date. Additional information regarding these and other factors that could affect Intel's results is included in Intel's SEC filings, including the company's most recent reports on Forms 10-K and 10-Q. Copies of Intel's Form 10-K, 10-Q and 8-K reports may be obtained by visiting our Investor Relations website at www.intc.com or the SEC's website at www.sec.gov.
All information in this presentation reflects management’s views as of January 25, 2018. Intel does not undertake, and expressly disclaims any duty, to update any statement made in this presentation, whether as a result of new information, new developments or otherwise, except to the extent that disclosure may be required by law.
Disclosures

CEO Key messages• Security is a top priority. We will restore confidence in data security with
customer-first urgency, transparency, and timely communication.
• Q4 marked an all-time record quarter in an all-time record year. Met or exceeded all 2017 corporate and business unit revenue, spending, and profitability goals.
• Our Data-centric growth accelerated to 21% YoY in Q4 (excl. McAfee) and accounted for 47% of revenue. Our PC-centric business drove performance mix, profitability, and cash flow in a declining market.
• Execution on our big bets in Autonomous Driving, Artificial Intelligence, Memory, and 5G position Intel for leadership and growth in the newData Economy.
• We expect 2018 to be another record year…. Raising dividend by 10%.
1

CFO Key MessagesOutstanding quarter… Record year… Building momentum into 2018
• Revenue of $17.1B up 8% (excl. McAfee) with record DCG, PSG, and IOTG revenue.
• Non-GAAP EPS up 37% driven by strong data-centric growth,Op Margin expansion, and ICAP portfolio gains.
• Capital Allocation: Monetized ASML… redeemed $1.6B Convertible debenture (reducing diluted share count by 59M shares)…tendered higher coupon debt for cash/ lower coupon.
• Tax reform levels playing field… improving competitiveness… $5.4B Q4 charge… 14% effective tax rate in 2018.
On Track to Exceed 3-Year-Plan Targets in Year Two2

Q4'16 Q4'17PC-Centric Data-Centric
$17.1B$16.4B
1. Q4’16 revenue includes McAfee.2. Data-centric businesses include DCG, IOTG, NSG, PSG and All Other.
2
Revenue up 8% excluding McAfee
1
Strong growth… transformation continueswith all-time high data-centric mix
From PC-Centric to Data-Centric
Data-centric (excludingMcAfee) up 21%…records across DCG, IOTG, PSG
PC-centric down 2%, significant source of profitability and cash flows
…Data-Centric represents 47% of Total Revenue3
$0.79
$1.08
$0.09 $0.00 $0.03
$0.06
($0.00)
$0.14
($0.04)
Q4'16
Non-GAAP
Platform
Volume
Platform
ASP
Platform
Cost
Adjacent
Business
Growth
Spending ICAP/ Treasury MFE Q4'17
Non-GAAP
Non-GAAP EPS up ~37%… Op Margin Up 5 PPTS1
Op Margin
30%
Op Margin
35%
Non-GAAP EPS up $0.29, up 37%
1. EPS and operating margin are presented on a non-GAAP basis. Refer to the Appendix for a reconciliation of these non-GAAP measures.2. Platform includes CCG, DCG, and IOTG microprocessors and chipsets.3. Adjacent Business Growth includes gross margin impact from non-platform products.
Op Margin drives EPS $0.19, up 24%
2
EPS Drivers Year-Over-Year
Platform Execution
• Server: Excellent momentum in cloud, networking & product transitions
• Client: Record core mix, lower 14nm costs, offset by 10nm transition costs
Expanded TAM…Adjacent Business Growth
• Increasing contributor to EPS growth… at lower margins
• NSG +9%, Modem +26%, plus Mobileye
Spending
• Significant leverage, investing in growth
Treasury/Other
• ASML gains $1.5B… offset by $0.5B charge from treasury transactions
4
3

Total spending as a % of revenue Down from 33.2% to 30.0%
20.0% 19.2%
Q4'16 Q4'17
R&D… Down ~1ppt
13.2%10.8%
Q4'16 Q4'17
SG&A… Down >2ppt
…now expecting to meet 30% commitment by 2019, one year early
• Continued engineering efficiency efforts
• Driving Moore’s Law forward
• Investments in AI and Autonomous Driving
• Disciplined controls on spending
• Reductions in marketing, program changes
• Increased productivity with investments in growth businesses
5

$8.4 $8.1
$0.8 $0.9
Q4'16 Q4'17
Revenue ($B) down 2%
Platform
Modem/Adjacencies
$3.5 $3.3
Q4'16 Q4'17
Q4’16 to Q4’17 YoY Revenue ($)
Platform (4%)
Modem/Adjacencies 15%
Market Segments YoY Revenue ($)
Notebook Flat
Desktop (8%)
$9.0$9.1
Operating Income ($B) down 7%
Op Margin 39%
Op Margin 36%
CCG Platform YoY Growth
PC Volumes +1%
Desktop ASP (2%)/+1%
Notebook ASP (5%)/(3%)
1. CCG adjacencies include modem, home gateway products and set-top box components.2. The first number in the series reflects the impact of changes to the Intel Inside Program, whereas the second number does not.
Client Computing Group… good execution
2
2
1
Adjacent TAM growth… Modem & Adjacencies up 15%
Operating Margin lower on 10nm transition costs
Record Core i7 and Core i9 Volume with continued ramp of 8th Gen6

$1.9
$3.0
Q4'16 Q4'17
$4.3$5.1
$0.4$0.5
Q4'16 Q4'17
Revenue ($B) up 20%
PlatformAdjacencies
DATA CENTER group… strength in cloud & adjacenciesQ4’16 to Q4’17 YoY Revenue ($)
Platform 18%
Adjacencies 35%
$5.6$4.7
Op Margin54%
DCG Platform YoY Growth
Unit Volumes 10%
Average Selling Prices 8%
Op Margin40%
Operating Income ($B) up 59%
All-time Revenue Record… Accelerating Cloud, Adjacencies growth and Enterprise strength
Xeon Scalable ramping per expectations
Operating Margin growth from revenue scale, ASP strength and exclusion of ’16 one-time charges
Market Segments YoY Revenue ($)
Cloud SP 35%
Enterprise & Gov. 11%
Comms SP 16%
7

IOTG, NSG & PSG business Segments… Revenue UP 19%Expanded TAM… BUs increasingly relevant in size
$816
$889
($91)
$31
Q4'16 Q4'17
NSG ($M)
Rev Op Income
$420
$568
$80$156
Q4'16 Q4'17
PSG ($M)
Rev Op Income
• All time record PSG revenue up 35%... strength in Data Center, Auto, Embedded, last-time-buys
• Op income up 95%, Op margin up 9 ppt to 27%
• 14nm Stratix10 in full production
• NSG revenue, up 9%, growing SSD TAM & MSS
• Ramping 64T 3D NAND
• Op margin positive with ramping yields and cost/GB declines
• Expect FY 2018 profitability
$726
$879
$182$260
Q4'16 Q4'17
IOTG + Mobileye ($M)
Rev Op Income $128
($12 )
Mobileye
1
1
1. Mobileye operating income is presented on a non-GAAP basis and excludes $28M negative impact from acquisition-related inventory valuation adjustments. Mobileye is not part of IOTG segment.
• All time record IOTG revenue; up 21% on Retail, Video & Transportation
• Op income up 43% with revenue scale
• Mobileye on track to deal thesis… Op Income lower from transfer of IOTG resources
8

Sources & Uses of CashFY 2017 ($B)
$22.1 ($11.8 )
($5.1 )($3.6 )
($14.5 )
($0.4 )
$3.9
$6.3
2017 Beg total
cash investment
Cash from
Operations
CapEx Dividends Buybacks Mobileye
acquisition
Net debt McAfee proceeds
+ dividend
ASML/Other 2017 Ending total
cash investment
$17.1 $14.0
$5.6 GAAP Cash and Cash Equivalents $3.4
$17.1 Total Cash Investments $14.0
$25.3 Total Debt $26.8
3
1
4
1. Cash from operations includes cash prepayments received under LT strategic supply agreements.2. Mobileye consideration included approximately $185 million for short-term investments.3. Total cash investments include cash and cash equivalents, short-term investments, and trading assets.4. Total debt includes short-term and long-term debt.
2
1. 2.
Non-US $13.6
US $3.5
Non-US $8.4
US $5.6
1. Strong free cash flow $10.3B… funds buyback and dividend2. Repositioning portfolio... ICAP monetization and McAfee divestiture to fund majority of Mobileye transaction
3. Redeemed $1.6B convertible debt, reducing 59M shares… tendered higher coupon debt for cash/lower coupon
9
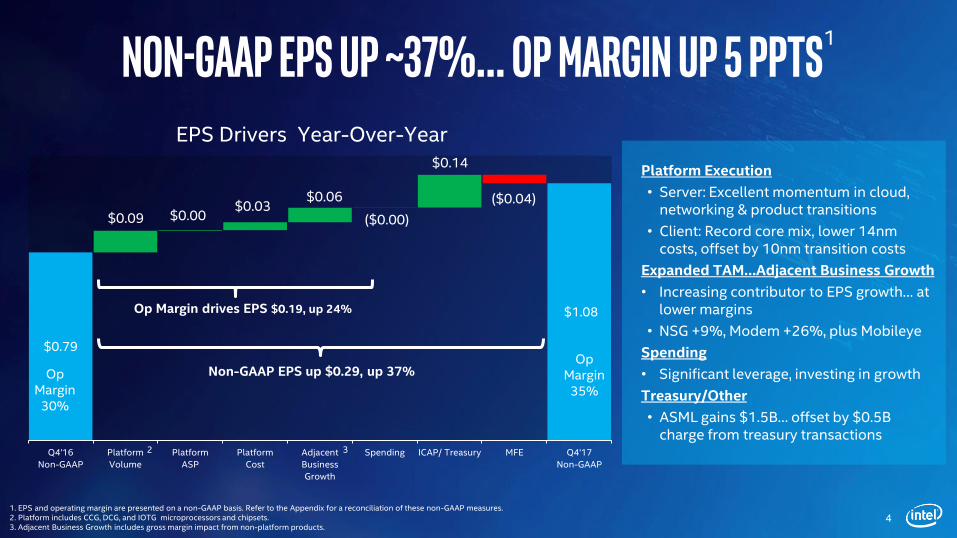
ICAP/Treasury Items… disciplined Capital allocation
• Sold 11.4M ASML shares in Q4
• Cash proceeds of $2.0B, gain of $1.5B
• Mark-to-market adjustments of $2.7B unrealized gains booked to retained earnings on 1st day of fiscal 2018
ICAP PORTFOLIO 2035 Convertible DEBT Restructuring• Redeemed 2035
convertible debenture
• $2.8B cash outflow
• Non-cash Q4 loss of $385M
• Reduces diluted share count by 59M
• Successfully tendered $2.3B of higher-coupon debt
• Exchanged $1.9B of old debt into $2B 30-year new debt, reducing coupon rate by ~1%
• Redeemed $425M of old debt for cash
Reduces diluted shares 59M
Tax efficient… Reduces leverage and annual interest expense
10

Full year 2017… Another record year
2016 2017PC-Centric
Data-Centric
$62.8B$59.5B
Revenue1 up 9% excluding McAfee
Up 3%
Up 16%(Excl McAfee)
2016 2017
$3.46
$2.72
Expanding EPS2… up 27%
Accelerating transformation… Data-Centric approaching 50% of revenue
Growing Earnings faster than Revenue… Excellent execution, disciplined spending
Outstanding year!1. 2016 revenue includes McAfee.2. Numbers presented on a non-GAAP basis. 3. ICAP Net Gains = Net gains (losses) on equity investments and Interest & Other, excluding McAfee divestiture impact
ICAP Net Gains3 = $0.35
11

Outlook

TAX REFORM IMPACT & Capital allocationCAPITAL ALLOCATIONTax impacts
• Tax Cuts & Jobs Act significantly improves Intel competitiveness
• Intel among the top 5 exporters and R&D investors in the U.S.
• Fab 42 fit-up committed last year, creating thousands of jobs at completion
• Overall investment profile and priorities remain unchanged
• Reduced tax rate driving EPS and FCF, supporting 10% dividend increase
• One-time Tax Impact is Q4’17 net charge of $5.4B for U.S. tax reform:
$6.1B charge for the accrual of tax on un-repatriated foreign earnings, payable over 8 years
Deferred Tax Re-measurement: $0.7B benefit to re-measure net deferred tax liability to the reduced statutory tax rate of 21%
• Post-2017 effective tax rate expected to be ~14%
• EPS impact in 2018 ~$0.28
13

2018 Accounting changes• New accounting rules require revenue
recognition upon transfer of control on shipment for direct customers and sales-in for channel customers
• Impact: $0.7B adjustment to retained earnings, primarily from deferred income, on 1st day of fiscal 2018, no material impact to revenue
Revenue Recognition
14
• New accounting rules for financial instruments require recognition of unrealized price changes each quarter
• Mark-to-market adjustments will flow through earnings
• Expect greater volatility from MTM adjustments
• Gains from sales (e.g. ASML) will not repeat going forward
• Impact: $2.7B of net unrealized gains booked to retained earnings on 1st day of fiscal 2018
• Gains and losses will be adjusted from non GAAP results
EQUITY GAINS/Losses

Full Year 2018 Outlook… investments paying off
$65.0BRevenue Operating Margin*
$3.55EPS*
*Presented on a non-GAAP basis. Refer to the Appendix for a reconciliation of these non-GAAP measures.
Data-centric up mid-teens
PC-centric declineslow single-digits
Gross margins down 2-2.5ppt on growth of adjacent businesses & 10nm ramp
Spending down 1-1.5ppt
Tax reform drives ~$0.28
Free cash flow at ~$13B… Dividend raise of 10%...Transformation continues
Gross Capex ~$14B… Net Capital deployed ~$12B…~$2B customer pre-payments
15
Up 4% excl. McAfee 30% Down
~1ptUp 3%
Up 14% excl. ’17 ICAP Net Gains

Q1’ 2018 Outlook… strong start to the year
$15.0BRevenue Operating Margin*
$0.70EPS*
*Presented on a non-GAAP basis. Refer to the Appendix for a reconciliation of these non-GAAP measures.
Data-centric upmid-teens, led by strong
memory growth
PC-centric declineslow single-digits
Gross margin down ~3 ppt on ramp of adjacent businesses
and 10nm ramp
Spending down ~3 pts
Adjacent business growth, spending reductions & lower
effective tax rate
16
Up 5% excl. McAfeefrom Q1’17
Up 6% Up 11%
excl. ’17 ICAP Net Gains
27% ~Flatfrom Q1’17

appendix

Three Months Ended
(In Millions, Except Per Share Amounts) Dec 30, 2017 Dec 31, 2016
GAAP NET REVENUE $17,053 $16,374
ISecG (McAfee) net revenue — 550
NON-GAAP NET REVENUE EXCLUDING ISecG (McAfee) $17,053 $15,824
GAAP OPERATING INCOME $5,395 $4,526
Inventory valuation 28 —
Amortization of acquisition-related intangibles 315 273
Restructuring and other charges 195 100
NON-GAAP OPERATING INCOME $5,933 $4,899
ISecG (McAfee) operating income — 103
NON-GAAP OPERATING INCOME EXCLUDING ISecG (McAfee) $5,933 $4,796
GAAP DILUTED EARNINGS (LOSS) PER COMMON SHARE ($0.15) $0.73
Inventory valuation 0.01 —
Amortization of acquisition-related intangibles 0.06 0.06
Restructuring and other charges 0.04 0.02
Income tax reform 1.14 —
Income tax effect (0.02) (0.02)
NON-GAAP DILUTED EARNINGS PER COMMON ITEMS1 $1.08 $0.79
Reconciliation of Non-GAAP Actuals
FREE CASH FLOW Dec 30, 2017
(In Millions)
GAAP CASH FROM OPERATIONS $22,110
Additions to property, plant and equipment (11,778)
FREE CASH FLOW $10,332
1 Non-GAAP EPS has been calculated based on common shares of 4,790 for the three months ended December 30, 2017, which is the number of weighted average common shares outstanding on a diluted basis determined as if the Company had net income for such period.

Q1 2018 Outlook Full-year 2018 Outlook
GAAP OPERATING MARGIN 25% 28% approximately
Amortization of acquisition-related intangibles 2% 2 %
NON-GAAP OPERATING MARGIN 27% approximately 30% approximately
GAAP EARNINGS PER SHARE $0.65 +/- 5 cents $3.30 +/- 5 %
Amortization of acquisition-related intangibles 0.06 0.28
Income tax effect (0.01) (0.03)
NON-GAAP EARNINGS PER SHARE $0.70 +/- 5 cents $3.55 +/- 5 %
Reconciliation of Non-GAAP Outlook
FREE CASH FLOW Full-year 2018 Outlook
(In Billions)
GAAP CASH FROM OPERATIONS $27.0
Additions to property, plant and equipment (14.0)
FREE CASH FLOW $13.0