Embed Size (px)
Citation preview

Q4 Results most likely to remain subdued
Sell at rise with stop loss of 8800
In the month of March, profit booking was seen in the market. Sensex and Nifty both indices closed in red in this
month. Senxex closed at 27957.49 down by 1404.01 points or 4.78% from 29361.50 while nifty closed at 8491.85
down by 410.85 points or 4.61% from 8901.85 in February.
Events to be watched The Reserve Bank of India (RBI) announces the first bi-monthly Monetary Policy for 2015-16 on Tuesday, 7 April
2015. The government will unveil industrial production data for February 2015 on 10 April 2015. The next major trigger for the Indian markets is Q4 results of India Inc. The Q4 results season starts during
second week of April 2015.
Macro Factors
The headline HSBC India Purchasing Managers' Index (PMI), compiled by Markit, improved to 52.1 in March from 51.2 in February. After two consecutive months of decline, the manufacturing sector output rose in March amid stronger increase in new orders that led firms to boost production levels.
The growth in eight core sectors dipped to a 17-month low in February at 1.4%. India's infrastructure output growth has been showing a continuous decline since December, reflecting stagnation in the space. Its cumulative growth during April to February, 2014-15 was 3.8%.
After 19 days of fierce bidding, the government raked in a record bounty of nearly Rs 1.1 lakh crore in the country's biggest auction of telecom spectrum. This is highest ever in history of India. The spectrum auction conducted in 2010 brought about Rs 106,000 crore.
The annual rate of inflation, based on monthly wholesale price index (WPI) continued to show disinflationary trend by ebbing to -all time low level of -2.06% in February as compared to -0.39% witnessed in January and 5.03% during the corresponding month of the previous year.
In an encouraging development, the index for industrial output (IIP) for the month of January came in at 2.6%, way higher than street expectation of 0.50% and also higher compared to 1.7% in December.
Conclusion The US Fed left interest rates unchanged recently. Overall concerns in the US economy do not
indicate that the FED is in a hurry to raise interest rates. In a surprise move, the country’s apex bank, the Reserve
Bank of India cut key policy rate by 25 basis points. The repo rate now stands at 7.5%. However, it kept the cash
reserve ratio (CRR) at 4%. In the coming time, as far as the stock market is concerned, the Nifty has upper side
resistance around the 8800 level. Market participants are advised to sell at rise. In the coming weeks, India Inc is
likely to announce Q4 earnings results, which are most likely to remain subdued.
.

Overview
The real estate sector is one of the key drivers of economic growth, contributing about 5-6% to India's GDP. Although real estate sector has been on top of the priority of the government but it still lacks clear laws to be guided, apart
from various other challenges like lack of clear land titles, absence of industry status and rising manpower and material
costs that have been restricting its growth. India has huge potential to attract large foreign investments into real estate and
the global real estate players are looking at emerging economies such as India for tapping opportunities in real estate. The
Indian real estate sector is one of the most globally recognised sectors. In the country, it is the second largest
employer after agriculture and is slated to grow at 30 per cent over the next decade. According to a study by ICRA,
the construction industry ranks third among the 14 major sectors in terms of direct, indirect and induced effects in all
sectors of the economy.
Market Size
The Indian real estate market size is expected to touch US$ 180 billion by 2020. The housing sector alone contributes
5-6 per cent to the country's gross domestic product (GDP). Also, in the period FY08-20, the market size of this sector is
expected to increase at a compound annual growth rate (CAGR) of 11.2 per cent. Retail, hospitality and commercial real
estate are also growing significantly, providing the much-needed infrastructure for India's growing needs. Real estate has
emerged as the second most active sector, raising US$ 1.2 billion from private equity (PE) investors in the last 10 months.
Foreign investors have bought tenanted office space worth over US$ 2 billion in India in 2014, a four-fold rise compared
to the previous year, in order to increase their rent-yielding commercial assets in Asia's third largest economy.
Geographical Growth
According to a study by Knight Frank, Mumbai is the best city in India for commercial real estate investment, with returns
of 12-19 per cent likely in the next five years, followed by Bengaluru and Delhi-National Capital Region (NCR). Also,
Delhi-NCR was the biggest office market in India with 110 million sq ft, out of which 88 million sq ft were occupied.
Sectors such as IT and ITeS, retail, consulting and e-commerce have registered high demand for office space in recent
times. Delhi’s Central Business District (CBD) of Connaught Place has been ranked as the sixth most expensive prime
office market in the world with occupancy costs at US$ 160 per sq ft per annum, according to a survey by CBRE.
Investments
The Indian real estate sector has witnessed high growth in recent times with the rise in demand for office as well as
residential spaces. Blackstone Group Lp is all set to become the largest owner of commercial office real estate in India
after a three-year acquisition drive in which it spent US$ 900 million to buy prime assets.
Government Initiatives
Under the Sardar Patel Urban Housing Mission, 30 million houses will be built by 2022, mostly for the economically
weaker sections and low-income groups, through public-private-partnership (PPP), interest subsidy and increased flow of
resources to housing sector', according to Mr M Venkaiah Naidu, Union Minister of Urban Development, Housing and
Urban Poverty Alleviation and Parliamentary Affairs, Government of India. The Government of India along with the
governments of the respective states have taken several initiatives to encourage the development in the sector. Some of
them are as follows:
The Government of India has relaxed the norms to allow foreign direct investment (FDI) in the construction
development sector. This move should boost affordable housing projects and smart cities across the country.
Although 100 per cent foreign direct investment was allowed in townships, housing and built-up infrastructure
and construction developments since 2005, as a result between April 2000 and August 2014, the construction
sector received FDI worth $ 23.75 billion or 10 per cent of the total FDI attracted by India during the period.
The Telangana Real Estate Developers' Association (Treda) plans to host the Fifth Treda Property Show 2014 at Hitex Centre, Hyderabad. The show will be open to a mix of the populace, including prospective property purchasers, investors, architects and others.
The State Government of Kerala has decided to make the process of securing permits from local bodies for construction of houses smoother.
CONSTRUCTION & REAL ESTATE SECTOR
Key Drivers of the Economy : some Midcap stocks may outperform
the sector

Major Players of the Sector Prestige Estate CMP: Rs.281
The firm was registered as a private limited company under Part-IX of the Companies Act, 1956, on June 4,
1997 with the name as Prestige Estates Projects Private Limited. All the business and property of the erstwhile
partnership firm therefore became vested in the company. The company was converted to a public limited
company on November 10, 2009 with the name Prestige Estates Projects Limited The company is promoted by
Irfan Razack, Rezwan Razack and Noaman Razack. The company has over 23 years of experience in real estate
development, and is one of the leading real estate development companies in south India. It has completed 142
real estate projects of approximately 27.09 million sq. ft.
Oberoy Realty CMP: Rs.283 Oberoi Realty was incorporated as Kingston Properties Private Limited on May 8. The company was converted
into a public limited company on December 14, 2009 and consequently, the name was changed to Oberoi Realty
Limited. The company is a real estate development company operating in Mumbai, focused on premium
developments. The company has established a strong brand and a successful track record in the real estate
industry by developing innovative projects through its emphasis on contemporary architecture, strong project
execution and quality construction. The company believes that this outsourcing model provides us with the
scalability required to undertake large developments. Oberoi Realty currently follows a sale model for its
residential projects and a lease model for a portion of its office space and retail projects as it believes this
provides the company with stable cash flows. In hospitality projects, it currently follows an operating agreement
model, whereby the hotel is owned by the company and operated by a hotel chain. The company currently has
eight ongoing and 19 planned projects, which it expects to provide a total saleable area of approximately
21,316,528 square feet.
Sobha Ltd CMP: Rs.399 Sobha developers was founded in the year 1995 by P N C Menon, he was acclaimed for quality interiors and
construction since 1977. Today Sobha developers is a Rs 10 billion plus company is one of the largest and only
backward integrated company in the construction arena. Since its inception Sobha's reputation is built on rock
solid values, benchmark quality standards, uncompromising business ethos, focused customer centric approach,
robust engineering, in-house Research and development and transparency in all spheres of conducting business,
which have contributed in making Sobha a preferred real estate brand in both residential and commercial
segments. The company has gone from strength to strength beginning with the first residential project in
Bangalore in 1997. An industry leader in Bangalore, Karnataka, contractual projects have also been constructed
in Kerala, Andhra Pradesh, Orissa, Tamil Nadu, Punjab, Harayana and Maharashtra.
Housing Development and Infrastructure (HDIL) CMP:107 Housing Development and Infrastructure (HDIL), a real estate development company, was established in
1996. Its business activity comprises of construction and development of residential projects, commercial, retail
and slum rehabilitation projects. It is also engaged in construction of special economic zone (SEZ). HDIL has
established itself as one of India's premier real estate development companies, with significant operations in the
Mumbai Metropolitan Region. HDIL group has completed more than 100 million sq.ft of construction in all
verticals of real estate and has rehabilitated around 30,000 families in last one decade. With operations spanning
every aspect of the real estate business, from residential, commercial and retail projects, to slum rehabilitation to
land development, the company was ranked as India's fastest growing real estate company by Construction
World-NICMAR in October 2007. Its residential projects range from apartment complexes to towers to
townships. Its commercial projects comprise premium office spaces as well as multiplex cinemas. In retail, it
focus on building world-class shopping malls.
The latest government data shows that U.S. output continued to grow during the fourth quarter, but at a slower rate than prior quarters and at a lower rate than what analysts were expecting to see. the Bureau of Economic Analysis released its third and final estimate of real GDP for the fourth quarter of 2014 — a period covering October, November and December of last year. The release showed that output increased 2.2% during the quarter, down from the 2.6% estimate released in January but consistent with the 2.2% revision released in February. Analysts were expecting to see growth for the quarter come in at 2.4%; growth during the third quarter was a whopping 5%.
The yearlong streak of robust monthly job creation was broken on Friday with the Labor
Department’s report that employers added just 126,000 workers in March, a marked slowdown in
hiring that echoed earlier signs that sluggish business investment and punishing weather were exacting a
toll on the economy. The economy added 295,000 new jobs in February, The big automakers are releasing their March US sales Analysts expect the annualized pace of sales to have
increased to 16.9 million units, up from 16.16 million in March.
The eurozone economy expanded by 0.3 per cent in final quarter of last year, data have confirmed.
The quarter-on-quarter reading has been left unchanged from an initial estimate published last month. On
an annualised basis, the eurozone's gross domestic product was 0.9 per cent higher than a year ago, again
unchanged from the initial reading. The ECB raised its growth projections for the eurozone over the next
three years, The ECB is now anticipating 1.5 per cent GDP growth this year, 1.9 per cent in 2016 and 2.1
per cent in 2017.
The EU's statistics office figures found consumer prices fell by 0.1% in March from a year earlier, as
against a 0.3% fall last month. The unemployment rate in the eurozone fell from 11.4% to 11.3% in
February. The total decline of 329,000 in the number of eurozone jobless in the three months to February
is the largest three-month fall since the three months to April 2007.
Consumer inflation has not been at the ECB's target level of close to, but below 2% since the start of 2013
and has been falling since a 3% peak in late 2011.
A Bank of China Ltd report has predicted China's economy to stabilize in these cond quarter of this year,
and GDP growth to rise from around 7 percent in the first quarter to 7.2 percent in the second.
Japan vehicle sales totaled 482,103 units for February, down 14.7% vs. February 2014. February
2015 sales increased 20.1% compared with January 2015. 2015 sales through February totaled 883,469,
down 16.8% over the same period in 2014. Toyota was the leader in year-to-date vehicle sales, with total
of 239,107, resulting in a 27.1% market share.
Japan's economy grew less than previously thought in the fourth quarter of 2014 but still crawled out
of recession, revised figures showed. Gross domestic product grew an annualized 1.5 percent in the
October-December period, down from an initial reading of 2.2 percent in February and below
expectations of 2.2 percent. Quarter on quarter, growth was revised to 0.4 percent, down from a
preliminary reading of 0.6 percent and below expectations for the same.
USA
EUROZONE
ASIA
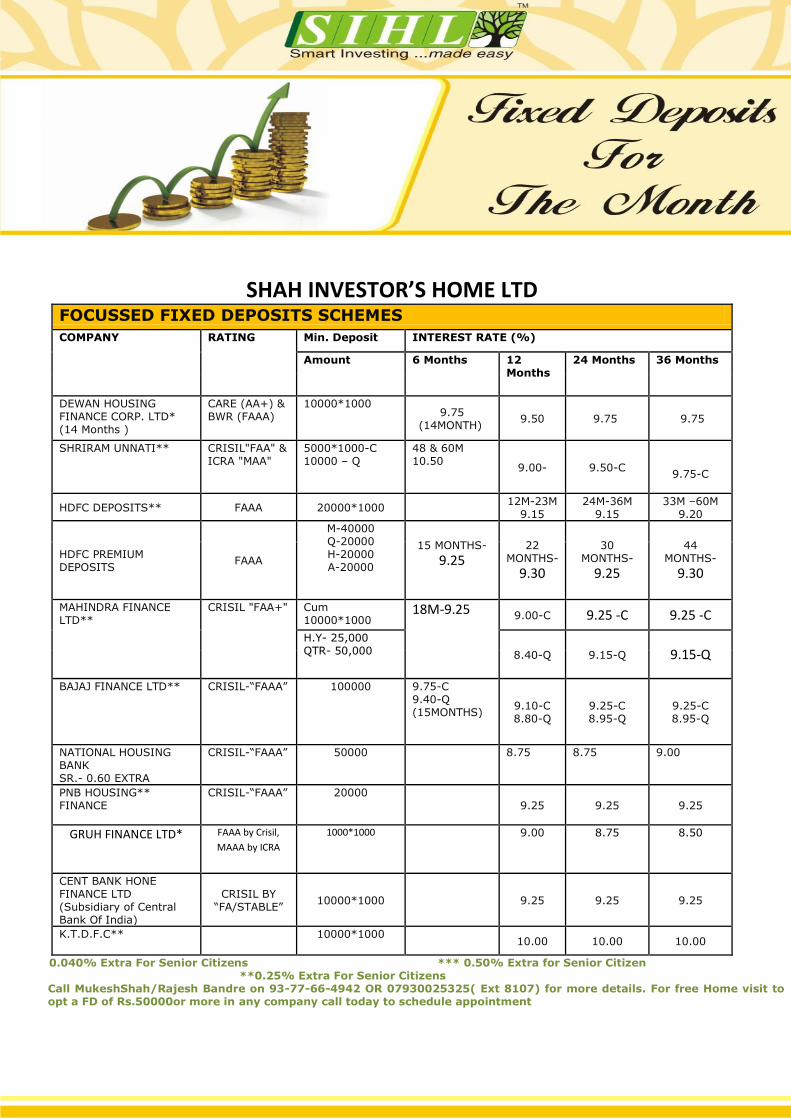
SHAH INVESTOR’S HOME LTD FOCUSSED FIXED DEPOSITS SCHEMES
COMPANY RATING Min. Deposit INTEREST RATE (%)
Amount 6 Months 12 Months
24 Months 36 Months
DEWAN HOUSING FINANCE CORP. LTD* (14 Months )
CARE (AA+) & BWR (FAAA)
10000*1000 9.75
(14MONTH) 9.50 9.75 9.75
SHRIRAM UNNATI** CRISIL"FAA" & ICRA "MAA"
5000*1000-C 10000 – Q
48 & 60M 10.50
9.00- 9.50-C
9.75-C
HDFC DEPOSITS** FAAA 20000*1000 12M-23M
9.15 24M-36M
9.15 33M –60M
9.20
HDFC PREMIUM DEPOSITS
FAAA
M-40000 Q-20000 H-20000 A-20000
15 MONTHS- 9.25
22 MONTHS-
9.30
30 MONTHS-
9.25
44 MONTHS-
9.30
MAHINDRA FINANCE LTD**
CRISIL "FAA+" Cum 10000*1000
18M-9.25 9.00-C 9.25 -C 9.25 -C
H.Y- 25,000 QTR- 50,000 8.40-Q 9.15-Q 9.15-Q
BAJAJ FINANCE LTD** CRISIL-“FAAA” 100000
9.75-C 9.40-Q (15MONTHS)
9.10-C 8.80-Q
9.25-C 8.95-Q
9.25-C 8.95-Q
NATIONAL HOUSING BANK SR.- 0.60 EXTRA
CRISIL-“FAAA” 50000
8.75 8.75 9.00
PNB HOUSING** FINANCE
CRISIL-“FAAA” 20000 9.25
9.25 9.25
GRUH FINANCE LTD* FAAA by Crisil,
MAAA by ICRA
1000*1000 9.00 8.75 8.50
CENT BANK HONE FINANCE LTD (Subsidiary of Central Bank Of India)
CRISIL BY “FA/STABLE”
10000*1000 9.25 9.25 9.25
K.T.D.F.C** 10000*1000 10.00 10.00 10.00
0.040% Extra For Senior Citizens *** 0.50% Extra for Senior Citizen **0.25% Extra For Senior Citizens
Call MukeshShah/Rajesh Bandre on 93-77-66-4942 OR 07930025325( Ext 8107) for more details. For free Home visit to opt a FD of Rs.50000or more in any company call today to schedule appointment
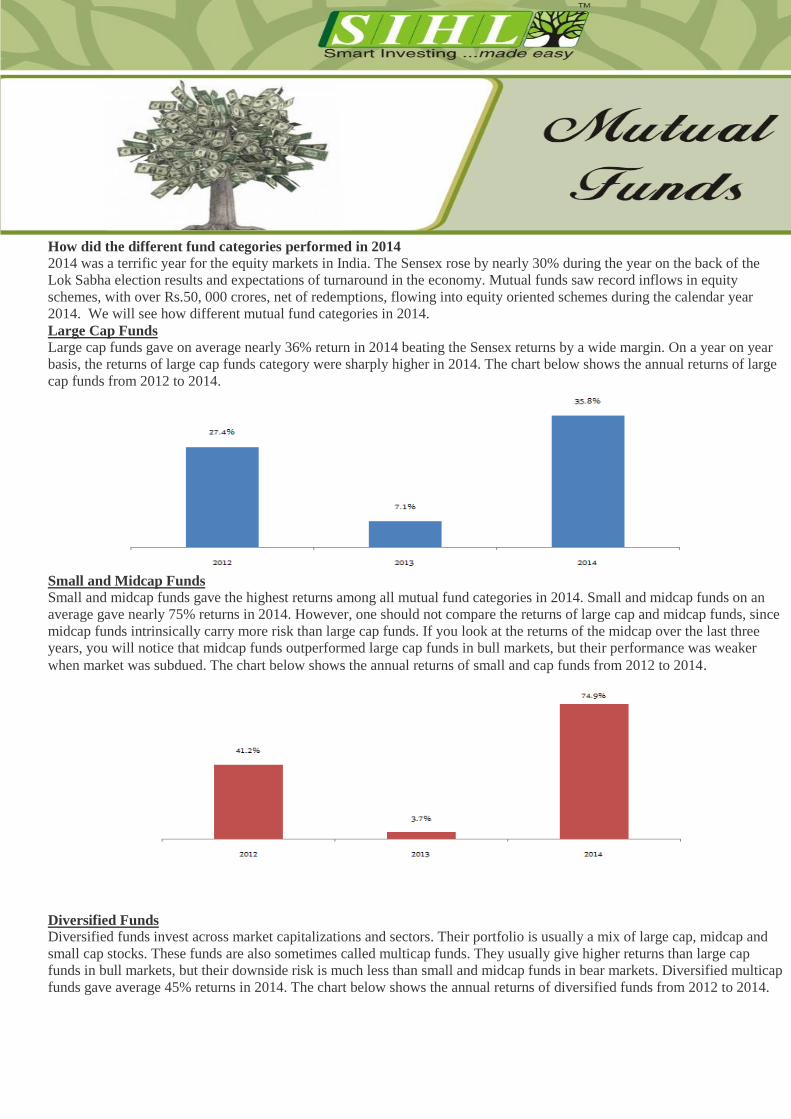
How did the different fund categories performed in 2014
2014 was a terrific year for the equity markets in India. The Sensex rose by nearly 30% during the year on the back of the
Lok Sabha election results and expectations of turnaround in the economy. Mutual funds saw record inflows in equity
schemes, with over Rs.50, 000 crores, net of redemptions, flowing into equity oriented schemes during the calendar year
2014. We will see how different mutual fund categories in 2014.
Large Cap Funds
Large cap funds gave on average nearly 36% return in 2014 beating the Sensex returns by a wide margin. On a year on year
basis, the returns of large cap funds category were sharply higher in 2014. The chart below shows the annual returns of large
cap funds from 2012 to 2014.
Small and Midcap Funds
Small and midcap funds gave the highest returns among all mutual fund categories in 2014. Small and midcap funds on an
average gave nearly 75% returns in 2014. However, one should not compare the returns of large cap and midcap funds, since
midcap funds intrinsically carry more risk than large cap funds. If you look at the returns of the midcap over the last three
years, you will notice that midcap funds outperformed large cap funds in bull markets, but their performance was weaker
when market was subdued. The chart below shows the annual returns of small and cap funds from 2012 to 2014.
Diversified Funds Diversified funds invest across market capitalizations and sectors. Their portfolio is usually a mix of large cap, midcap and
small cap stocks. These funds are also sometimes called multicap funds. They usually give higher returns than large cap
funds in bull markets, but their downside risk is much less than small and midcap funds in bear markets. Diversified multicap
funds gave average 45% returns in 2014. The chart below shows the annual returns of diversified funds from 2012 to 2014.
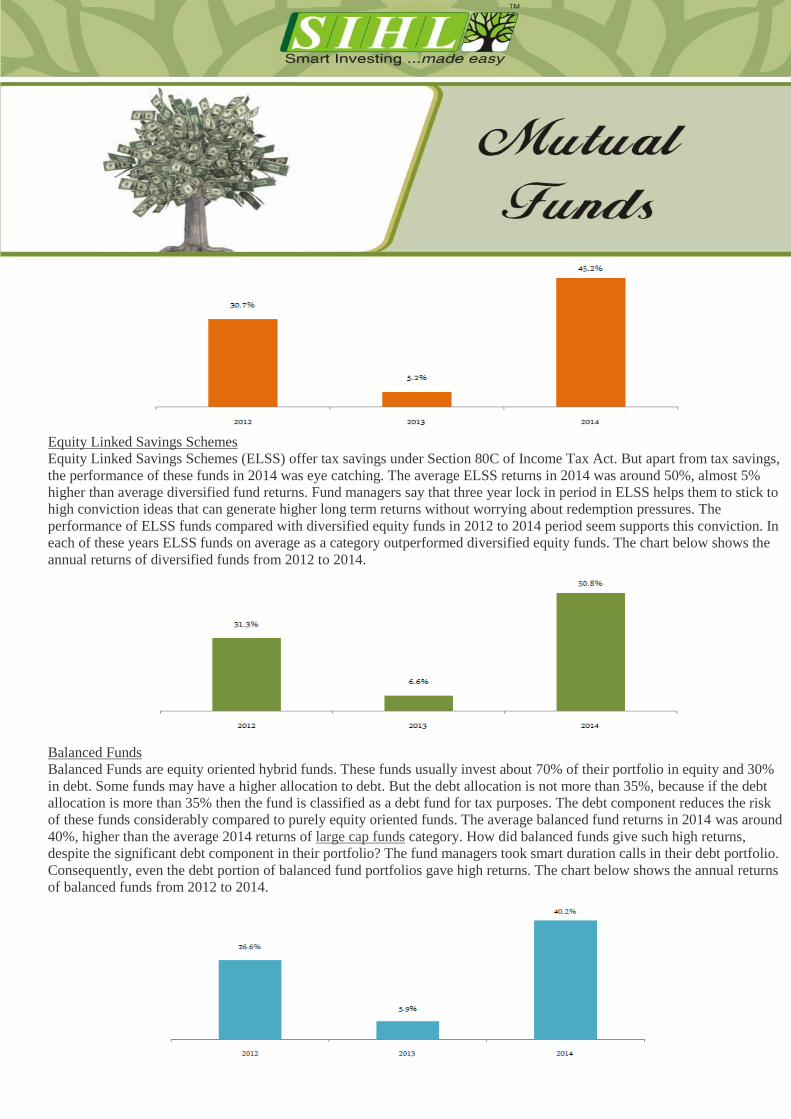
Equity Linked Savings Schemes
Equity Linked Savings Schemes (ELSS) offer tax savings under Section 80C of Income Tax Act. But apart from tax savings,
the performance of these funds in 2014 was eye catching. The average ELSS returns in 2014 was around 50%, almost 5%
higher than average diversified fund returns. Fund managers say that three year lock in period in ELSS helps them to stick to
high conviction ideas that can generate higher long term returns without worrying about redemption pressures. The
performance of ELSS funds compared with diversified equity funds in 2012 to 2014 period seem supports this conviction. In
each of these years ELSS funds on average as a category outperformed diversified equity funds. The chart below shows the
annual returns of diversified funds from 2012 to 2014.
Balanced Funds
Balanced Funds are equity oriented hybrid funds. These funds usually invest about 70% of their portfolio in equity and 30%
in debt. Some funds may have a higher allocation to debt. But the debt allocation is not more than 35%, because if the debt
allocation is more than 35% then the fund is classified as a debt fund for tax purposes. The debt component reduces the risk
of these funds considerably compared to purely equity oriented funds. The average balanced fund returns in 2014 was around
40%, higher than the average 2014 returns of large cap funds category. How did balanced funds give such high returns,
despite the significant debt component in their portfolio? The fund managers took smart duration calls in their debt portfolio.
Consequently, even the debt portion of balanced fund portfolios gave high returns. The chart below shows the annual returns
of balanced funds from 2012 to 2014.
d give good risk-adjusted returns over the long term should opt for dividend yield funds.
Meaning
Monetary policy is the process by which monetary authority of a country, generally a central bank controls the supply of money in the economy by exercising its control over interest rates in order to maintain price stability and achieve high economic growth. The goals of monetary policy are to promote maximum employment, stable prices and moderate long-term interest rates. By implementing effective monetary policy, the Fed can maintain stable prices, thereby supporting conditions for long-term economic growth and maximum employment.
INSTRUMENTS OF MONETARY POLICY IN INDIA
Cash Reserve Ratio
Cash reserve ratio as the ratio which banks maintain between their holdings of cash and their deposit liabilities, and sometimes referred to as the Cash Ratio.
Banks have to keep a certain proportion of their total assets in the form of cash, partly to meet the statutory reserve requirement and partly to meet their own day-to-day needs for making cash payments. Cash is held partly in the form of “cash on hand” and partly in the form of “balances with the RBI”. Higher the CRR with the RBI lower will be the liquidity in the system and vice-versa.
Statutory Liquidity Ratio
Every bank is required to maintain a minimum percentage of their net demand and time liabilities as liquid assets in the form of cash, gold and unencumbered approved securities. This ratio of liquid assets to demand and time liabilities is known as statutory Liquidity Ratio (SLR).
Th
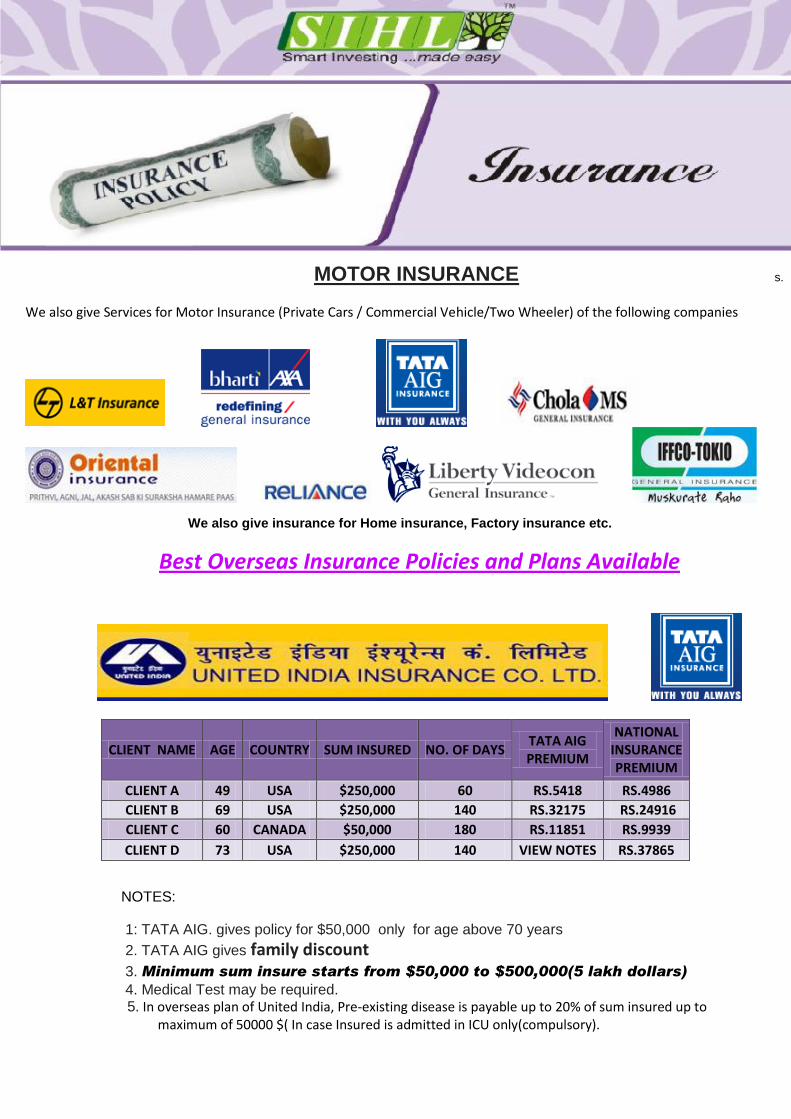
MOTOR INSURANCE
We also give Services for Motor Insurance (Private Cars / Commercial Vehicle/Two Wheeler) of the following companies
We also give insurance for Home insurance, Factory insurance etc.
Best Overseas Insurance Policies and Plans Available
CLIENT NAME AGE COUNTRY SUM INSURED NO. OF DAYS TATA AIG PREMIUM
NATIONAL INSURANCE PREMIUM
CLIENT A 49 USA $250,000 60 RS.5418 RS.4986
CLIENT B 69 USA $250,000 140 RS.32175 RS.24916
CLIENT C 60 CANADA $50,000 180 RS.11851 RS.9939
CLIENT D 73 USA $250,000 140 VIEW NOTES RS.37865
NOTES:
1: TATA AIG. gives policy for $50,000 only for age above 70 years
2. TATA AIG gives family discount
3. Minimum sum insure starts from $50,000 to $500,000(5 lakh dollars) 4. Medical Test may be required.
5. In overseas plan of United India, Pre-existing disease is payable up to 20% of sum insured up to maximum of 50000 $( In case Insured is admitted in ICU only(compulsory).

IFFCO TOKIO GENERAL INSURANCE’S
FAMILY HEALTH PROTECTOR
One of the Unique Plan of Iffco Tokio General Insurance Co. Ltd
1. No. Medical Test Require upto age of 60 years.
2. Entry age is 18 to 65 years
3. There is waiver of Sublimit of Room rent.
4. Any No. of members of Family can take Floater plan.
5. There is 10% discount on premium of family health protector.
6. Additional optional cover of critical illness is provided.
7. Lifelong renewal.
8. Pre and Post Hospitalisation will be covered upto 45 and 60 days.
9. Pre-existing disease will be covered after 48 month.
RED CARPET FOR SENIOR CITIZEN
A unique plan for senior citizen (60 yrs to 74 yrs) without medical /lifelong renewal
From star health & allied insurance co. Ltd
SUM INSURED Rs.100000 Rs.200000 Rs.300000 Rs.400000 Rs.500000
60-74 YEARS Rs.5000 Rs.9500 Rs.14495 Rs.17416 Rs.20225
KOTAK LIFE INSURANCE
Kotak is a well-known reputed brand in the market; Kotak has the highest claim settlement ratio
in insurance industries. It has a reasonable premium rates.
Compulsory free medical test for better and effective claim settlement.
100% tax benefits.
Rs.15 per day or Rs.450 per month or Rs.5400 per year gives you a huge financial protection to your family against uncertain events.
Contact: Mr. Pranav K. Trivedi , Mobile: 98240-08780/9327355010, Email: [email protected]
Email : [email protected]