Embed Size (px)
Citation preview

Global Turnover
Rs 4,909 Crs
(USD 1,022 Mn)
Value Added Products
Rs 2,306 Crs
(USD 480 Mn)
Manufacturing
Steel
Rs 2,485 Crs
(USD 517 Mn)
Others
Rs 118 Crs
(USD 25 Mn)
VA - DistbOthers VA - Services
Business Profile FY’12
Rs 1,790 Crs
(USD 373 Mn)
Distribution
Rs 365 Crs
(USD 76 Mn)
Services
Rs 151 Crs
(USD 31 Mn)
Steel
51%VA - Mfg
37%
VA - Distb
7%
Others
3%
VA - Services
2%
Net Turnover
Stand Alone
Rs 2,837 Crs
(USD 591 Mn)
Consolidated
Rs 3,361 Crs
(USD 700 Mn)
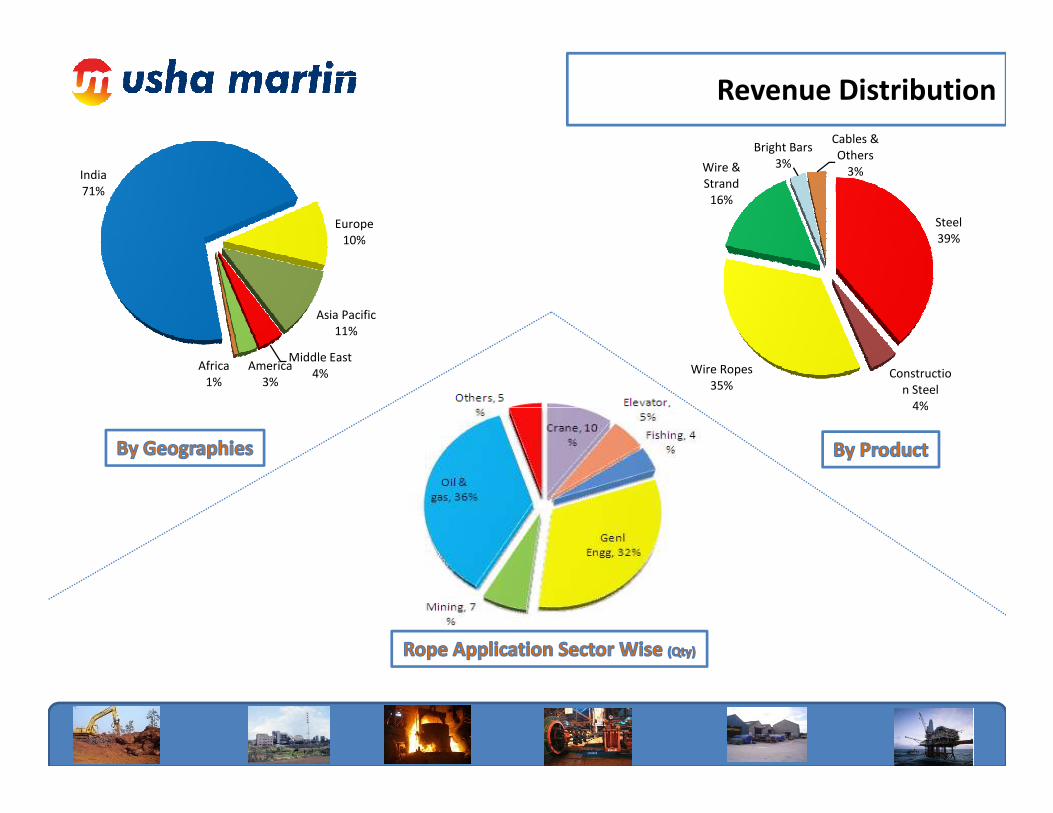
Revenue Distribution
Steel
39%
Constructio
n Steel
4%
Wire Ropes
35%
Wire &
Strand
16%
Bright Bars
3%
Cables &
Others
3%India
71%
Europe
10%
Asia Pacific
11%
Middle East
4%America
3%
Africa
1%
4%
Pellet Plant
1200 KT
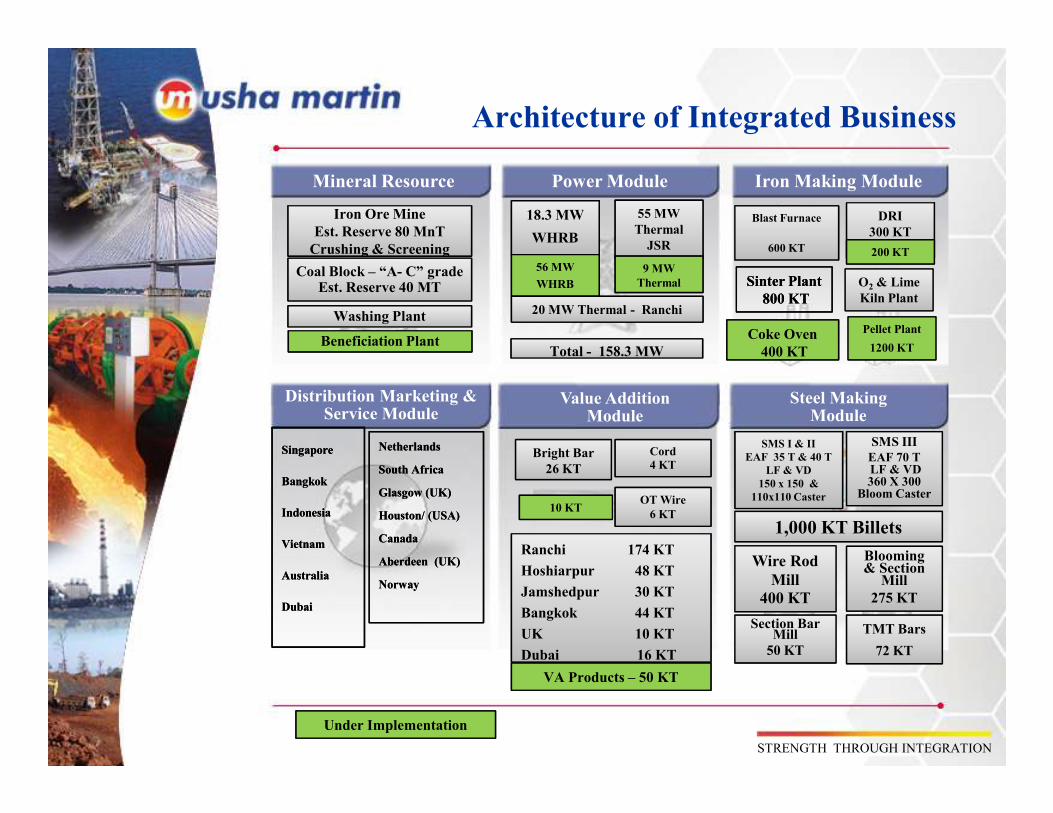
Architecture of Integrated Business
Mineral Resource Power Module Iron Making Module
Distribution Marketing & Service Module
Value Addition Module
Steel MakingModule
Iron Ore Mine
Crushing & Screening
Iron Ore Mine
Est. Reserve 80 MnT
Crushing & Screening
55 MW
Thermal
JSR
18.3 MW
WHRB
20 MW Thermal - Ranchi
Total - 158.3 MWTotal - 158.3 MW
Blast Furnace
600 KT
DRI
300 KT
Sinter Plant
800 KT
Sinter Plant
800 KT
Washing Plant
Coal Block – “A- C” gradeEst. Reserve 40 MT O2& Lime
Kiln Plant
Beneficiation PlantCoke Oven
400 KT
200 KT
56 MW
WHRB
9 MW
Thermal
Service Module Module Module
SMS I & II
EAF 35 T & 40 T
LF & VD
150 x 150 &
110x110 Caster
SMS III
EAF 70 T LF & VD 360 X 300 Bloom Caster
Blooming & Section Mill
275 KT
Cord
4 KTBright Bar
26 KT
OT Wire
6 KT
Singapore
Bangkok
Indonesia
Vietnam
Australia
Dubai
Singapore
Bangkok
Indonesia
Vietnam
Australia
Dubai
Netherlands
South Africa
Glasgow (UK)
Houston/ (USA)
Canada
Aberdeen (UK)
Norway
Netherlands
South Africa
Glasgow (UK)
Houston/ (USA)
Canada
Aberdeen (UK)
Norway
1,000 KT Billets
Wire Rod
Mill
400 KT
Section Bar Mill
50 KT
TMT Bars
72 KTDubai 16 KT
Ranchi 174 KT
Hoshiarpur 48 KT
Jamshedpur 30 KT
Bangkok 44 KT
UK 10 KT
Dubai 16 KT
Under Implementation
VA Products – 50 KT
10 KT
STRENGTH THROUGH INTEGRATION
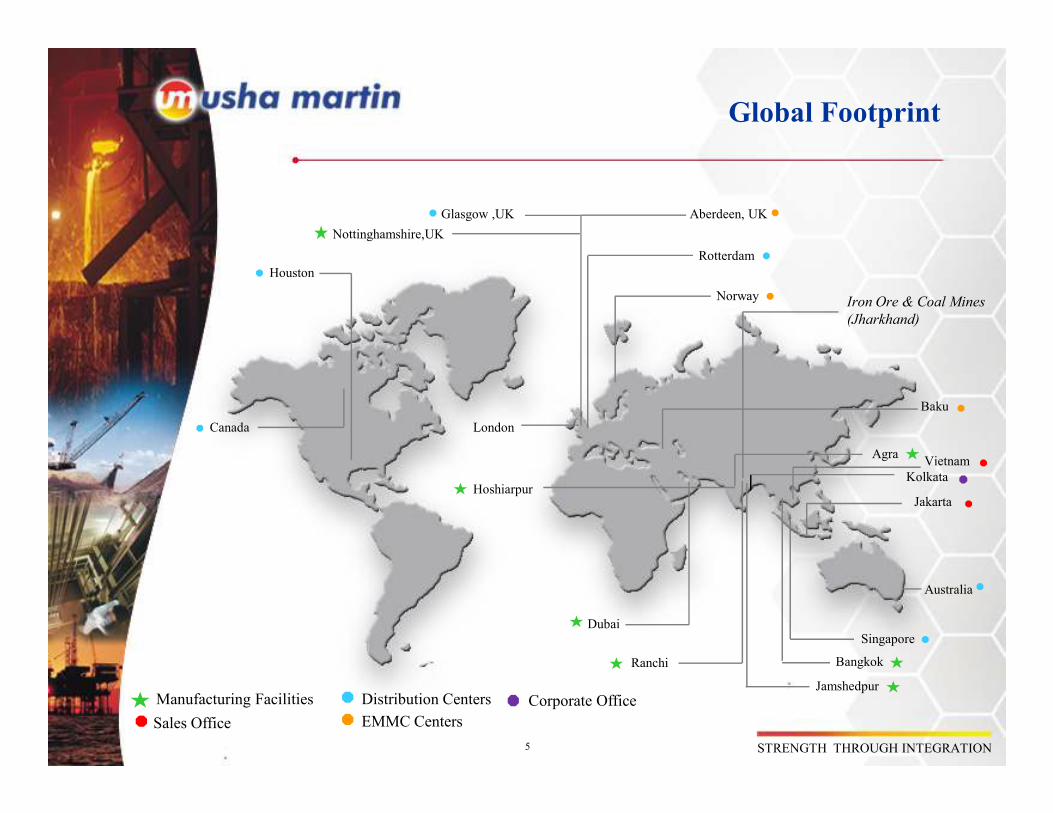
Global Footprint
Aberdeen, UKGlasgow ,UK
Norway
Baku
Houston
Nottinghamshire,UK
Rotterdam
Iron Ore & Coal Mines
(Jharkhand)
Baku
Dubai
Jamshedpur
Bangkok
Singapore
Sales Office EMMC Centers
Manufacturing Facilities Distribution Centers
Vietnam
Ranchi
Australia
STRENGTH THROUGH INTEGRATION
Canada
HoshiarpurJakarta
Agra
Kolkata
Corporate Office
London
5
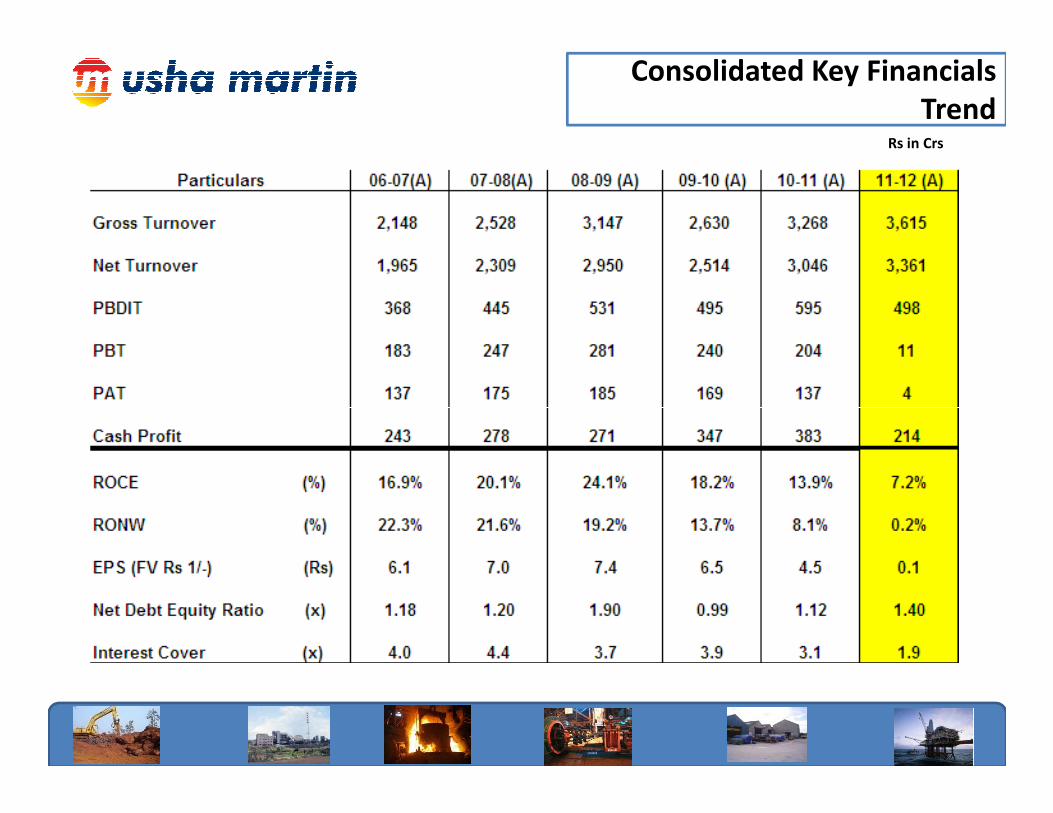
Consolidated Key Financials
TrendRs in Crs
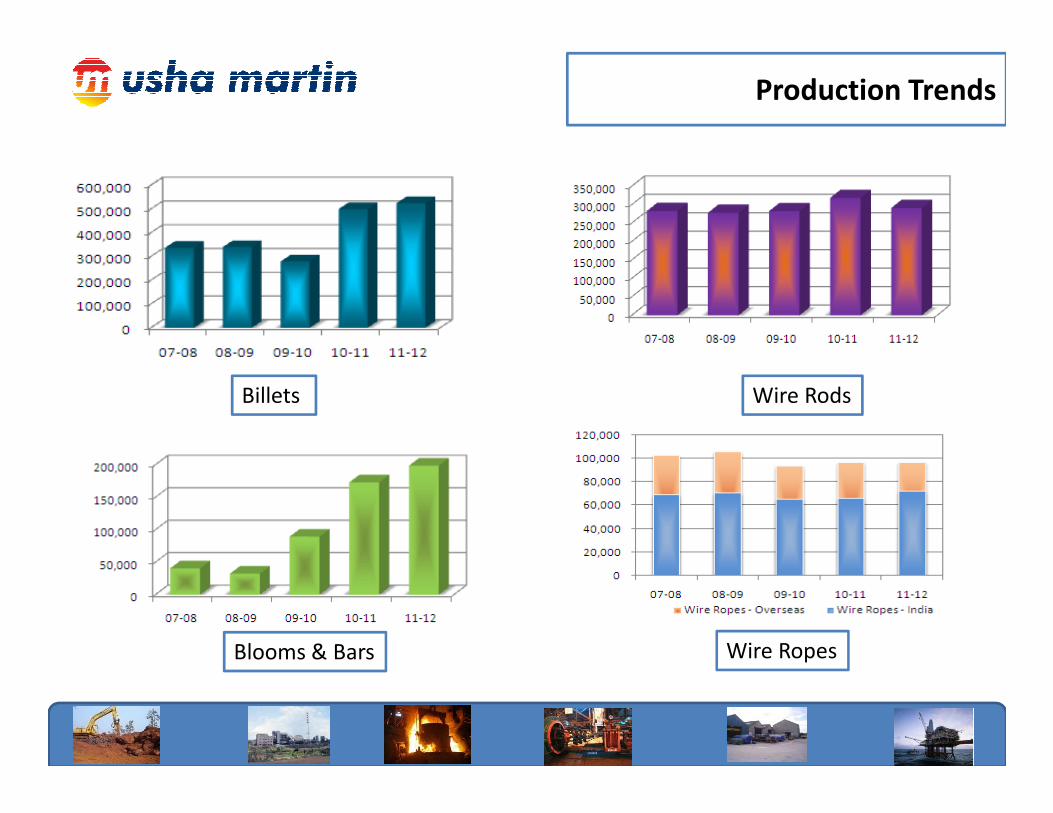
Production Trends
Billets Wire Rods
Blooms & Bars Wire Ropes
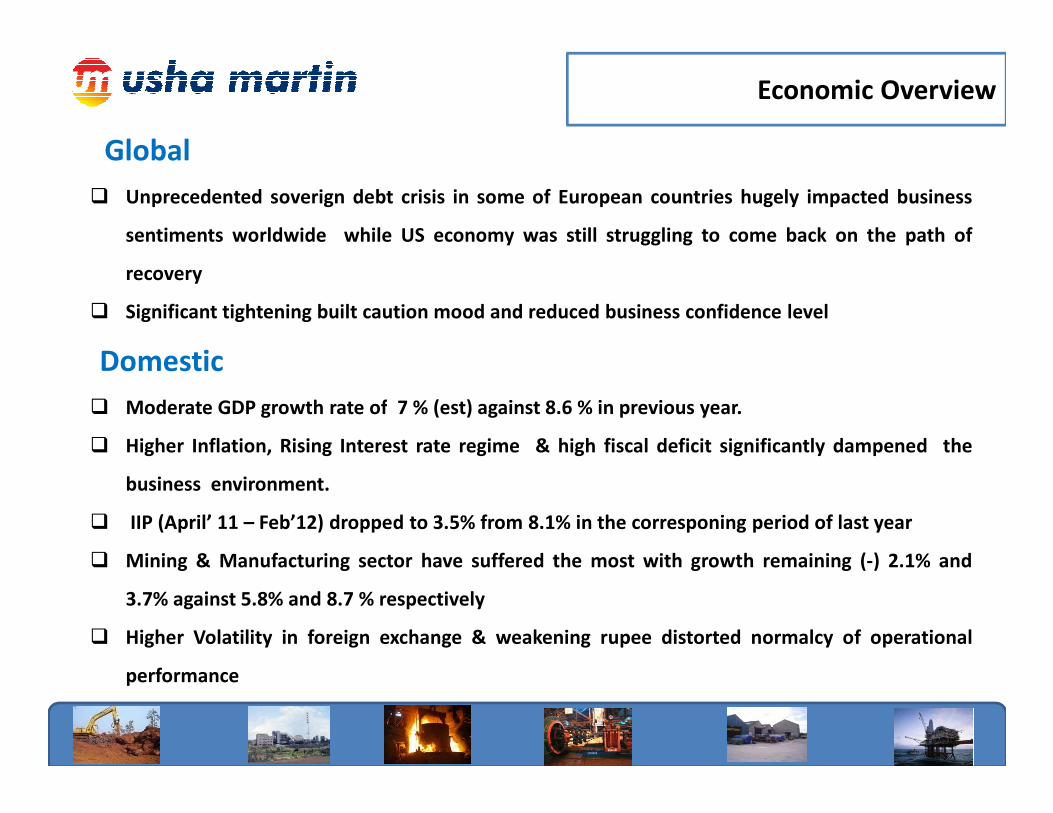
Economic Overview
Global
� Unprecedented soverign debt crisis in some of European countries hugely impacted business
sentiments worldwide while US economy was still struggling to come back on the path of
recovery
� Significant tightening built caution mood and reduced business confidence level
Domestic
� Moderate GDP growth rate of 7 % (est) against 8.6 % in previous year.� Moderate GDP growth rate of 7 % (est) against 8.6 % in previous year.
� Higher Inflation, Rising Interest rate regime & high fiscal deficit significantly dampened the
business environment.
� IIP (April’ 11 – Feb’12) dropped to 3.5% from 8.1% in the corresponing period of last year
� Mining & Manufacturing sector have suffered the most with growth remaining (-) 2.1% and
3.7% against 5.8% and 8.7 % respectively
� Higher Volatility in foreign exchange & weakening rupee distorted normalcy of operational
performance
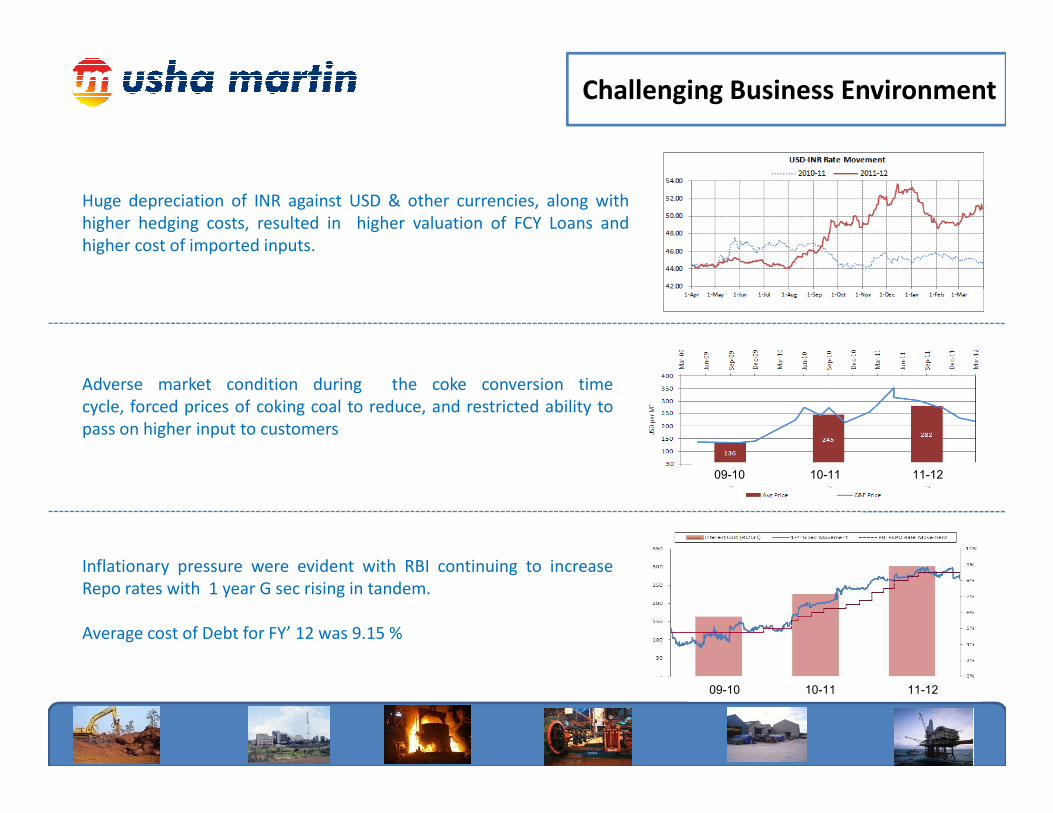
Challenging Business Environment
Adverse market condition during the coke conversion time
cycle, forced prices of coking coal to reduce, and restricted ability to
Huge depreciation of INR against USD & other currencies, along with
higher hedging costs, resulted in higher valuation of FCY Loans and
higher cost of imported inputs.
09-10 10-11 11-12
cycle, forced prices of coking coal to reduce, and restricted ability to
pass on higher input to customers
Inflationary pressure were evident with RBI continuing to increase
Repo rates with 1 year G sec rising in tandem.
Average cost of Debt for FY’ 12 was 9.15 %
09-10 10-11 11-12
Major Achivements
• Achieved highest ever production of coal, hot metal, billets, blooms and bars,
• Production of Sinter plant crossed 616,000 MT,
• Commissioned Stoves in Blast Furnace 1 at Jamshedpur,
• Optimized consumption of coke by increasing use of PCI in production of hot metal,
• Commissioned Bar Mill at Agra to produce Bars and TMT,
• Obtained further approvals from major OEMs for bloom and bar products
• Usha Siam started operations in record time after receding of water, produced 1400 MT in Q4’12
• Implementation of new projects to further perpetuate advantage of cost competitiveness are
under progress
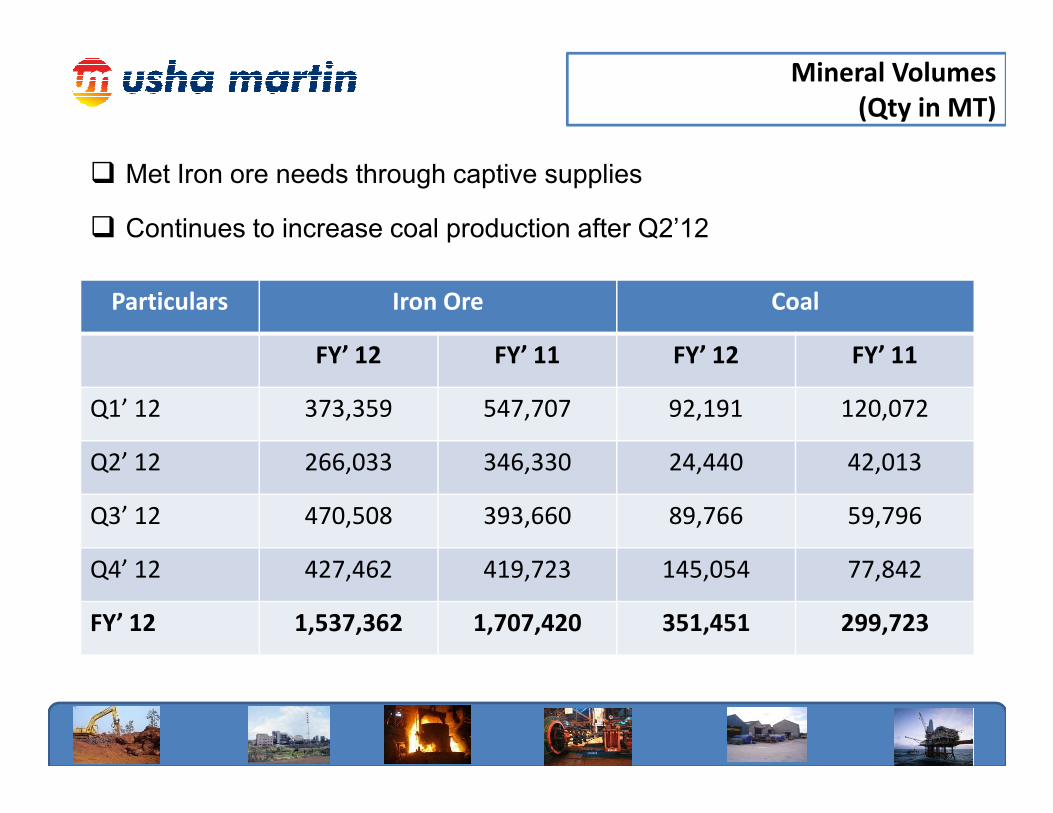
Mineral Volumes
(Qty in MT)
Particulars Iron Ore Coal
FY’ 12 FY’ 11 FY’ 12 FY’ 11
Q1’ 12 373,359 547,707 92,191 120,072
� Met Iron ore needs through captive supplies
� Continues to increase coal production after Q2’12
Q1’ 12 373,359 547,707 92,191 120,072
Q2’ 12 266,033 346,330 24,440 42,013
Q3’ 12 470,508 393,660 89,766 59,796
Q4’ 12 427,462 419,723 145,054 77,842
FY’ 12 1,537,362 1,707,420 351,451 299,723
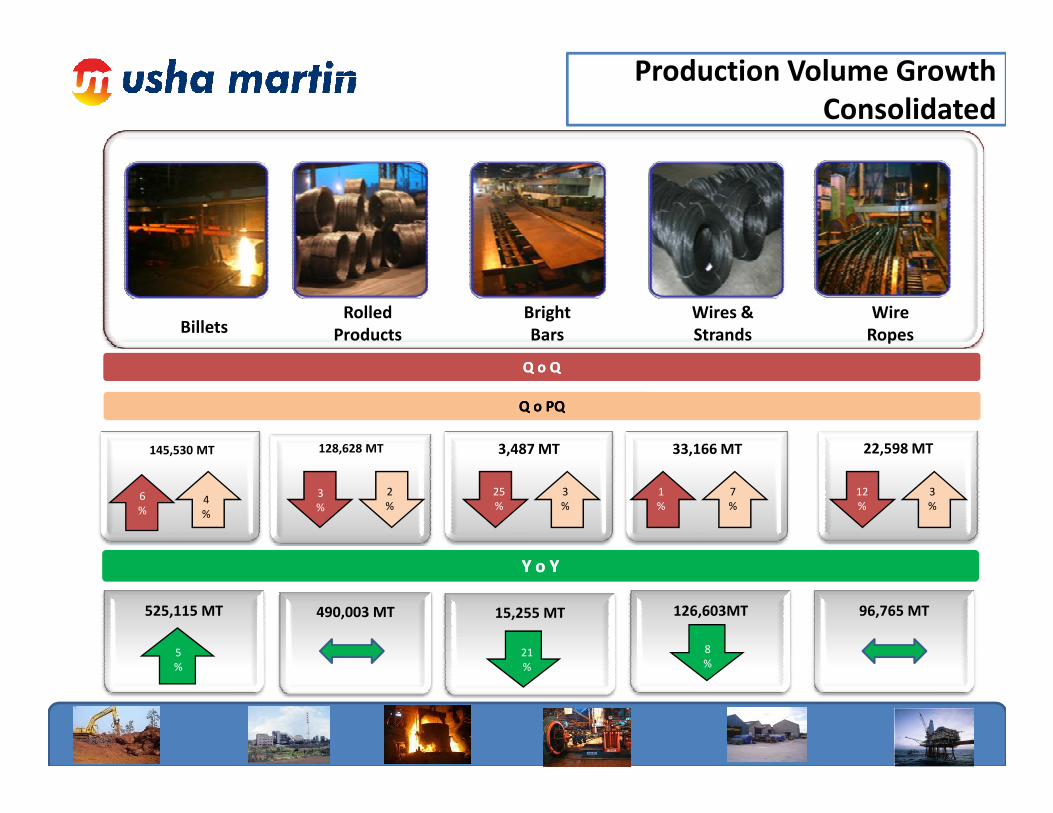
Production Volume Growth
Consolidated
Q o QQ o Q
BilletsRolled
Products
Bright
Bars
Wires &
Strands
Wire
Ropes
Q o PQQ o PQ
145,530 MT 128,628 MT 3,487 MT 33,166 MT 22,598 MT
Y o YY o Y
96,765 MT126,603MT15,255 MT525,115 MT 490,003 MT
1
%
4
%
3
%
Q o PQQ o PQ
2
%
1
%
7
%
3
%6
%
5
%
1
%21
%
25
%
8
%
3
%
12
%
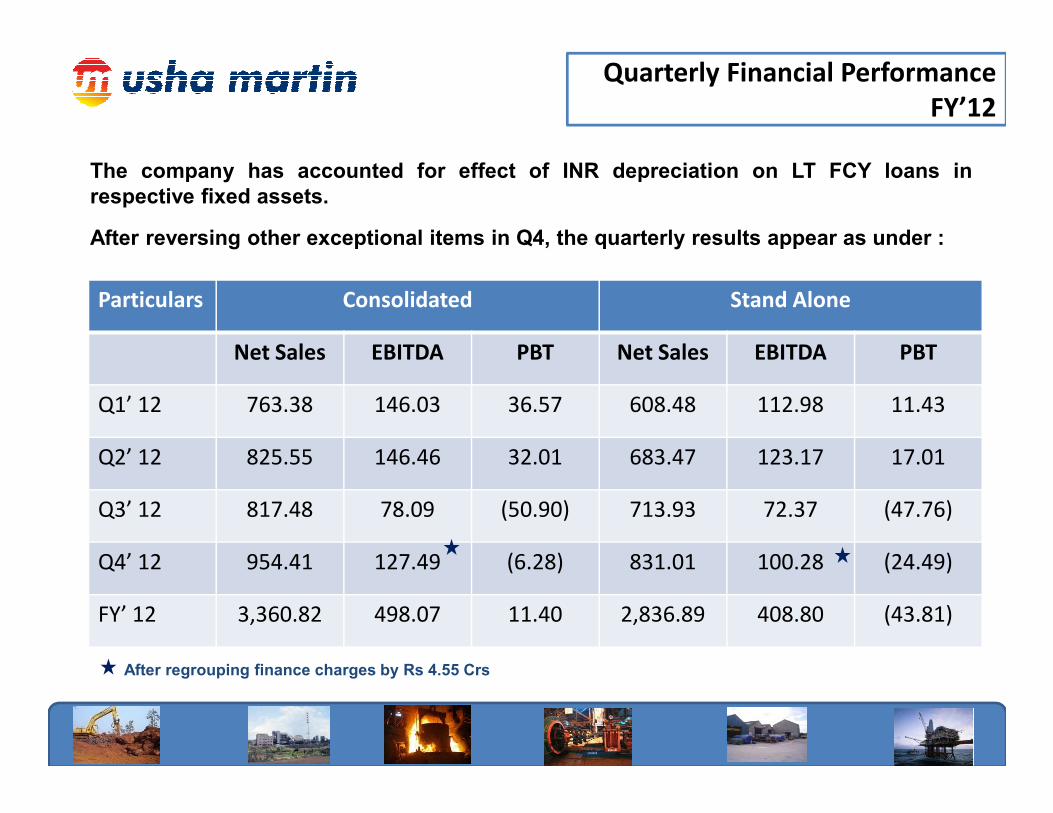
Quarterly Financial Performance
FY’12
Particulars Consolidated Stand Alone
Net Sales EBITDA PBT Net Sales EBITDA PBT
Q1’ 12 763.38 146.03 36.57 608.48 112.98 11.43
The company has accounted for effect of INR depreciation on LT FCY loans in
respective fixed assets.
After reversing other exceptional items in Q4, the quarterly results appear as under :
Q1’ 12 763.38 146.03 36.57 608.48 112.98 11.43
Q2’ 12 825.55 146.46 32.01 683.47 123.17 17.01
Q3’ 12 817.48 78.09 (50.90) 713.93 72.37 (47.76)
Q4’ 12 954.41 127.49 (6.28) 831.01 100.28 (24.49)
FY’ 12 3,360.82 498.07 11.40 2,836.89 408.80 (43.81)
After regrouping finance charges by Rs 4.55 Crs
Factors affecting Profitability
FY’12
� Higher cost of coke, non availability of linkage coal forcing the Company to buy coal from
market at higher rates along with increase in other input costs were the principal reasons
affecting profitability of the Company.
� Excessive monsoon and rainfall impacted mining operations, resulted in lower availability of
captive minerals
� Slow down in key market segments and higher competition in steel business also kept margins
under pressure and checked passing on of cost increase.
� Usha Siam, Thailand, a key subsidiary, was non functional due to floods since mid
October’11, affecting turnover and profitability in international business.
� Hardening of interest rates resulted in higher interest charge.
� Depreciation charge was also higher.
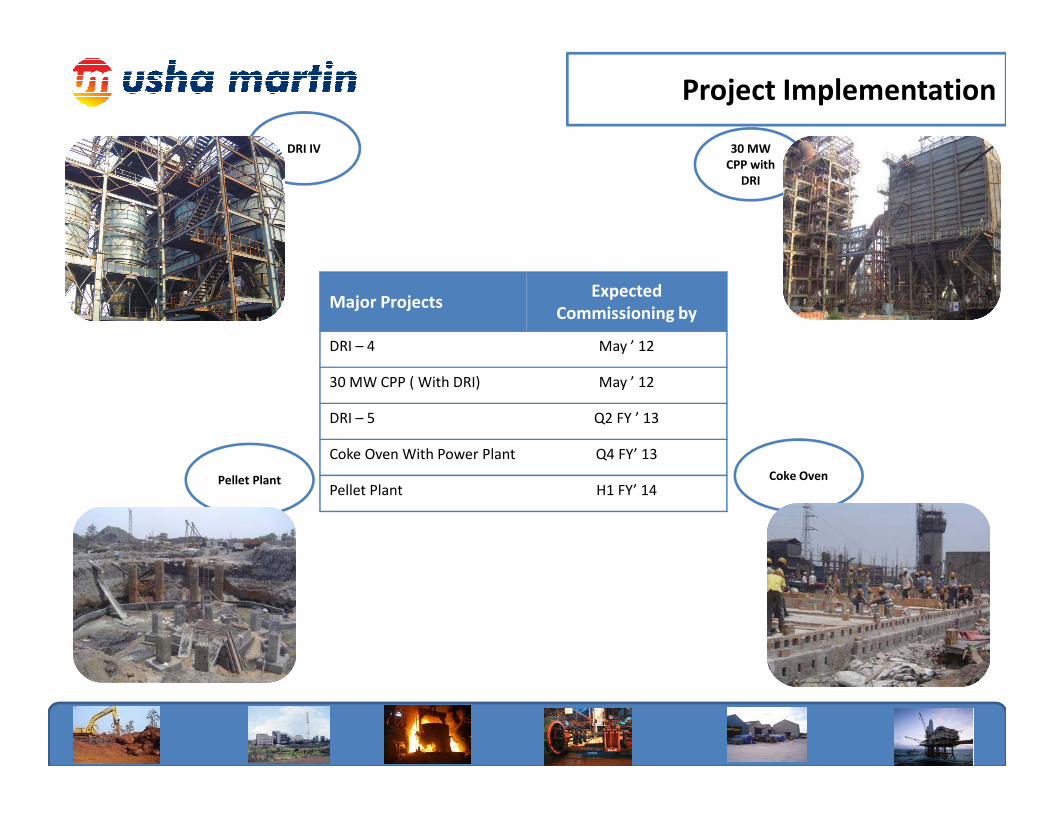
30 MW
CPP with
DRI
DRI IV
Project Implementation
Major ProjectsExpected
Commissioning by
DRI – 4 May ’ 12
30 MW CPP ( With DRI) May ’ 12
Coke Oven Pellet Plant
DRI – 5 Q2 FY ’ 13
Coke Oven With Power Plant Q4 FY’ 13
Pellet Plant H1 FY’ 14
Disclaimer:
This presentation may contain forward looking information that involves
risk and uncertainties. Such projections and forward looking statements
reflect various assumptions of management concerning future
performance of the Company, and are subject to significant
business, economic, environment, political, legal and competition
risks, uncertainties and contingencies, many of which are unknown and
beyond control of the Company and management. Accordingly, there can
be no assurance that such projections and forward looking statements
will be realized. The variations may be material. No representation or
warranties are made as to the accuracy, completeness or
reasonableness of such assumptions or the projections or forward
looking statements based thereon, or with respect to any of the
information contained in this presentation. The Company expressly
disclaims any and all liability that may be based on any of the information
contained herein, errors herein or omissions thereof.