Embed Size (px)
Citation preview

ICICI Securities Ltd. | Retail Equity Research
May 22, 2015
Monthly Update
Q4 numbers mixed; M&A hots up… The Q4 numbers declared by some companies under I-direct coverage have portrayed a mixed picture. Ajanta and Cadila continued to provide strong growth traction on expected lines whereas Biocon and Jubilant delivered better-than-expected numbers. Despite currency depreciation in emerging markets and lack of products approvals in the US, Dr Reddy’ managed to register double digit revenue growth (~11% YoY). On the other hand, Lupin and Torrent’s results were impacted by the high base of gCymbalta last year. Unichem continued to deliver a dismal set of numbers. M&A activities intensified during the month with Torrent Pharma acquiring Encore Group’s dermatology arm Zyg Pharma, which owns a USFDA approved plant in Pithampur (Indore), to foray into the US dermatology space. Similarly, Lupin made its maiden entry in the Brazilian market with an acquisition of Brazilian drug firm Medquimica. Strides will be re-entering the Australian market by agreeing with South African major Aspen to acquire the latter’s generic/branded generic portfolio in Australia and Singapore. On the legal front, the Supreme Court has restrained Glenmark from the manufacture and sale of Merck’s anti-diabetes drugs Januvia and Janumet for infringement of patent. In another development, US based retailer Meijer Inc has filed a case against Ranbaxy in the US district court for allegedly manipulating USFDA rules to keep generic drugs of other companies out of the marketplace. In other significant developments, Daiichi Sankyo finally exited Ranbaxy by offloading its entire 8.93% stake (21.4 crore shares) in Sun Pharmaceuticals for ~ | 20430 crore in the open market. Biocon has finally decided to list its research arm Syngene in July 2015. Finally, on the domestic front, the Indian pharmaceutical market (IPM) registered highest ever sales of | 8047 crore (grew 17.2% YoY) in April 2015. The YoY growth was mainly driven by robust YoY volume growth 8.8% (0.3% in April 2014) followed by price hikes – 5.2% (1.7% in April 2014) and new product launches (3.2%). Domestic markets took 24 months to move from | 6000 crore to | 7000 crore whereas it has taken just nine months to breach the | 8000 crore mark. Pharma takes breather after recent run up Pharma stocks are witnessing a brief phase of consolidation after riding the re-rating wave in FY15. The consolidation was warranted as even after re-rating, most pharma stocks were running slightly ahead of valuations. We, however, maintain our long term bullish view on the sector on the back of its structural strength. Strong visibility on the back of a good product basket and a reasonable base business growth continue to attract buying interest in the pharma sector despite premium valuations. US and Indian formulations remain the main growth drivers for the sector on the back of a strong pipeline and incremental product launches. Healthy operating margins, relatively low leverage and strong return ratios are some of the other attributes for most pharma players. Sun Pharma, Lupin and Dr Reddy’s are our top picks from the large cap pharma space whereas Cadila, Aurobindo, Torrent Pharma and Ajanta Pharma are our picks from the midcap pharma space. Near term headwinds for the sector are a slower-than-expected pick-up in USFDA approvals and currency volatility in some of the pharmerging markets.
Health CheckSector View
Outperformer
Index Performance as on May 21, 2015
Return (%) 1M 3M YTD 1Y
CNX 500 1 -3 3 19
Nifty 0 -4 2 16
CNX Pharma 1 7 15 69
Return (%)
Stocks Performance Mcap
Company 1M 3M YTD 1Y 21-May
Sun Pharma.Inds. 2 8 19 70 237111
Lupin -2 1 20 85 77137
Dr Reddy's Labs 2 7 12 58 61883
Cipla 2 -1 7 73 53847
Aurobindo Pharma 0 28 19 119 39580
Cadila Health. 0 10 10 85 35993
Glaxosmit Pharma 0 1 0 26 27197
Glenmark Pharma. 0 14 16 72 24327
Divi's Lab. 2 8 6 43 24284
Torrent Pharma. 3 12 10 97 21111
Apollo Hospitals 3 -3 15 42 18115
Wockhardt -17 -2 42 99 15822
Ajanta Pharma 1 28 49 218 12215
Pfizer -1 12 3 84 10195
Biocon -2 1 5 2 8952
Ipca Labs. 1 -1 -9 -17 8441
Natco Pharma 13 68 53 213 7757
Strides Arcolab 5 29 24 156 7070
Indoco Remedies 5 19 20 163 3457
Jubilant Life 10 6 42 -9 2742
Unichem Labs. -6 -7 -17 4 1827
Return (%)
Mcap: Market cap in | crore
Price movement
50006000700080009000
100001100012000130001400015000
May-14 Aug-14 Nov-14 Feb-15 May-15
4000
6000
8000
10000
12000
CNX Pharma Nifty (RHS)
Research Analyst
Siddhant Khandekar [email protected] Mitesh Shah [email protected]
Nandan Kamat [email protected]

ICICI Securities Ltd. | Retail Equity Research
Page 2
Regulatory approvals
Exhibit 1: Summary of USFDA approvals for March 2015
[5
Company Drug Name Therapeutic Area Innovator company Generic Version of Market SizeAurobindo Pharma Sildenafil Citrate Harmonal Pfizer Revatio US$ 300 millionAurobindo Pharma Atracurium Besylate CNS Hospira Tracrium NAGlenmark Ethinyl Estradiol; Levonorgestrel Contraceptive Wyeth Pharms Alesse US$ 6.4 millionLupin Memantine Hydrochloride CNS Forest Labs Namenda US$ 1.1 billionGlenmark Ethinyl Estradiol; Norethindrone Acetate Contraceptive Warner Chilcott Estrostep US$ 38.6 millionStrides Acrolab Polyetylene Glycol 3350; Potassium Chloride; Sodium Bicarbonate;
Sodium CchlorideColonoscopy Braintree Nulytely US$ 20 million
Aurobindo Pharma Cefixime Antibiotic Lederle Suprax US$ 123 millionNatco Pharma Alprazolam CNS UCB Inc Niravam NALupin Quinine Sulfate Anti-malaria Mutual Pharm Co Inc Qualaquin US$ 31.9 millionSun Pharma Oxymorphone Hydrochloride Pain Endo Pharms Opana US$ 25 millionTorrent Pharma Aripiprazole CNS Otsuka Abilify US$ 7.8 billion
Company Drug Name Therapeutic Area Innovator company Generic Version of Market SizeTorrent Pharma Rosuvastatin Calcium Avascular necrosis IPR Crestor US$ 5 billionLupin Fesoterodine Fumarate Urology Pfizer Toviaz US$ 159 millionGlenmark Calcipotriene Vitamins Leo Pharma Dovonex US$ 92.8 million
Tentative Approvals
CNS: Central Nervous System; CVS: Cardiovascular, NA: Not available; Source: USFDA, ICICIdirect.com Research
Regulatory approvals/IP issues
Dr Reddy’s launches Somazina for stroke patients in India Dr Reddy’s has launched Citicoline’s branded drug Somazina in India, for the treatment of post-stroke patients. The company has partnered with Citicoline for launching this drug in India. Somazina is indicated for improving cognitive function in patients who have suffered from stroke or cerebral infarction, or who have undergone brain surgery or suffered from head injuries. Every year, ~15 lakh people suffer from stroke in India. As per the Global Burden of Disease Study 2013, cerebral stroke is the third leading cause of deaths in India. Lawsuits/court rulings/settlements/USFDA regulations
Case filed against Ranbaxy in US court US based retailer Meijer Inc has filed a case against Ranbaxy in the US district court for alleging anti-trust and other violations for allegedly manipulating USFDA rules to keep generic drugs of other companies out of the marketplace. Supreme Court bars Glenmark from diabetes drug The Supreme Court has restrained Glenmark Pharmaceuticals from the manufacture and sale of Merck’s anti-diabetes drugs Januvia and Janumet for patent infringement. Glenmark sells the medicines under the brand names Zita and Zita-met. The Supreme Court has, however, allowed Glenmark to sell its existing stocks of these drugs in the market. As per MAT April 2015, annual sales of Zita and Zita-met brands were ~| 105 crore (1.5% of FY15 sales). M&As, demergers and JVs
Lupin acquires Brazilian company Lupin has acquired a 100% equity stake in Brazil based Medquimica Industria Farmaceutica for an undisclosed amount. The acquisition marks Lupin’s maiden foray into the Brazilian market. This is the second acquisition in the LatAm market after its acquisition of Laboratorios Grin in Mexico last fiscal. Medquimica is a broad-based pharmaceutical company engaged in development, manufacture and commercialisation of branded generics and over-the-counter (OTC) products. It reported net revenues of around BRL 94 million (US$31 million) in CY14 and has over 550 employees.

ICICI Securities Ltd. | Retail Equity Research
Page 3
Daiichi exits Sun Pharma Daiichi Sankyo has offloaded its entire 8.93% stake (21.4 crore shares) in Sun Pharma in the open market. The company has assigned an indicative price band of | 930.00 and | 1,043.80 per share. In the upper band, the total consideration stands at ~| 22420 crore. The company has cited ‘’perspective of improvement in corporate value’’ as the reason for offloading. Daiichi has taken a significant hit on its books due to a one-time write-down of 46.2 billion yen (~| 2450 crore) related to its investment in Ranbaxy Laboratories. Strides Arcolab to buy Aspen's generic pharma Strides Arcolab has signed definitive agreements with certain wholly-owned subsidiaries of South Africa based Aspen Pharmacare Holdings to acquire a generic pharmaceutical business in Australia together with certain branded pharmaceutical assets. The business, which will operate under the Arrow Pharmaceuticals brand, will sell approximately 140 generic prescription drugs and an extensive range of non-prescription pharmacy products. The acquired products had sales of approximately A$120 million in the past financial year (June 2014) with an EBITDA margin of ~31%. The consideration for the acquisitions will be ~A$ 380 million. The transaction is likely to be financed by a combination of internal accruals and debt financing. Torrent Pharma to acquire Zyg Pharma Torrent Pharmaceuticals has inked an agreement to fully acquire Zyg Pharma for an undisclosed amount. The company is engaged in manufacturing various dermatological formulations like creams, ointments, gels, lotions and solutions. The acquisition is likely to strengthen Torrent’s position in niche dermatological segment, especially in developed markets like the US and Europe. Cipla increases stake in Ugandan company Cipla's wholly owned subsidiary, Cipla (EU) Ltd, UK has entered into a definitive agreement to acquire a 51% stake in Quality Chemicals, Uganda (QCL) from the existing shareholders of QCL. As per the agreement, the consideration works out to US$30 million. QCL was incorporated in 1997 and is engaged in the business of import and distribution of pharmaceutical and consumer products. QCL also holds a 22.05% stake in the company's subsidiary in Uganda, Cipla Quality Chemical Industries (CQCIL). Consequent to this acquisition, Cipla's effective stake (held through its subsidiaries) in CQCIL will increase from the existing 51.05% to 62.30%. Cipla acquires Brazilian company Duomed Cipla has acquired Duomed Produtos Farmaceuticos Ltda. in Brazil at ~| 2.6 crore. The deal has an approval of Brazilian health authority (Anvisa) and other regulatory authorities to import and distribute pharmaceutical products in Brazil. Capex/investments/fund raising
Biocon initiates Syngene listing Biocon’s contract research subsidiary Syngene International Ltd (Syngene) has filed the draft DRHP with Sebi seeking approval for an initial public offering (IPO). This is an offer for sale (OFS) by Biocon of a part of its shareholding in Syngene. Biocon along with its subsidiary Biocon Research (BRL) currently holds an 84.5% equity stake in Syngene. Biocon is offering to sell up to 22 million equity shares of face value of | 10 each, through Syngene’s IPO. Syngene has reported revenues of | 822 crore in FY15.

ICICI Securities Ltd. | Retail Equity Research
Page 4
Glenmark raises | 945 crore via preferential allotment to Temasek Temasek Holdings Pvt Ltd, the investment arm of the Singapore government, has made an investment of | 945 crore in Glenmark through preferential issue (1.08 crore share @ | 875) through its wholly-owned subsidiary Aranda Investments (Mauritius) Pte Ltd. The money will most likely be utilised by the company for debt repayment. Q4FY15 Results
Torrent Pharma - High base impacts result, outlook robust Revenues de-grew 5.8% to YoY to | 1154 crore, on account of a 44% decline in US sales to | 224 crore. EBITDA margins declined 1453 bps to 14% on account of higher employee expenses and other expenditure. EBITDA de-grew 53.7% to | 162 crore. However, adjusted EBITDA (ex-one offs) came in at | 259 crore. Net profit witnessed a YoY reduction of 46.7% to | 130 crore mainly on account of a lower operational performance. Cadila - continues to thrive on superior US growth Revenues grew 16.2% to | 2288.2 crore mainly on the back of 44.3% YoY growth in the US formulations business to | 979 crore. EBITDA margins improved 346 bps to 21.7% while EBITDA grew 38.3% YoY to | 495.9 crore. PAT grew 46.5% YoY to | 350.4 crore boosted mainly by a strong operational performance. Lupin - US slowdown halts growth Revenues de-grew 1.4% YoY to | 3078.2 crore. US sales (45% of net sales) de-grew 6.3% to | 1378 crore on the back of a slowdown in product approvals and pricing pressure. Domestic formulations (22% of net sales) grew 15.2% YoY to | 664 crore. EBITDA margins declined 246 bps to 25.6% mainly on account of a 318 bps YoY increase in employee costs as percentage of sales and higher R&D spend. Net profit declined 1.1% YoY to | 547 crore owing to a decline in EBITDA margins. Jubilant - Pharma performance improves but LSI lags Revenues declined 1.7% YoY to | 1536.5 crore. Revenues in the pharmaceutical business grew 8.2% YoY to | 762.6 crore while life science ingredients (LSI) revenues de-grew 9.6% YoY to | 775.5 crore. EBITDA margins increased ~37 bps YoY to 16.1% mainly on account of lower other expenditure. EBITDA increased 0.7% to | 247.4 crore. Adjusted net profit grew 22.7% YoY to | 76.6 crore on the back of an EBITDA improvement, lower depreciation and finance cost. Dr Reddy’s - Higher R&D, adverse product mix hit margins Revenues grew 11.2% YoY to | 3870.4 crore mainly on account of 15% growth in US formulation sales to | 1715.4 crore. EBITDA margins declined 111 bps YoY to 21.3%. The delta was mainly due to higher R&D spends, change in product mix and currency fluctuation. EBITDA increased 5.7% to | 825.6 crore. Net profit increased 7.7% to | 518.8 crore. The miss was on account of lower operational income and higher finance expenses. Ajanta Pharma - maintains growth tempo Revenues grew 18.6% YoY to | 368.8 crore on the back of higher-than-expected export growth (up 18.9% to | 245 crore). EBITDA margins improved 261 bps YoY to 38.2% while EBITDA increased 27.3% YoY to | 140.7 crore. Adjusted net profit increased 30.3% YoY to | 91.3 crore, driven by a strong operational performance.
ICICI Securities Ltd. | Retail Equity Research
Page 5
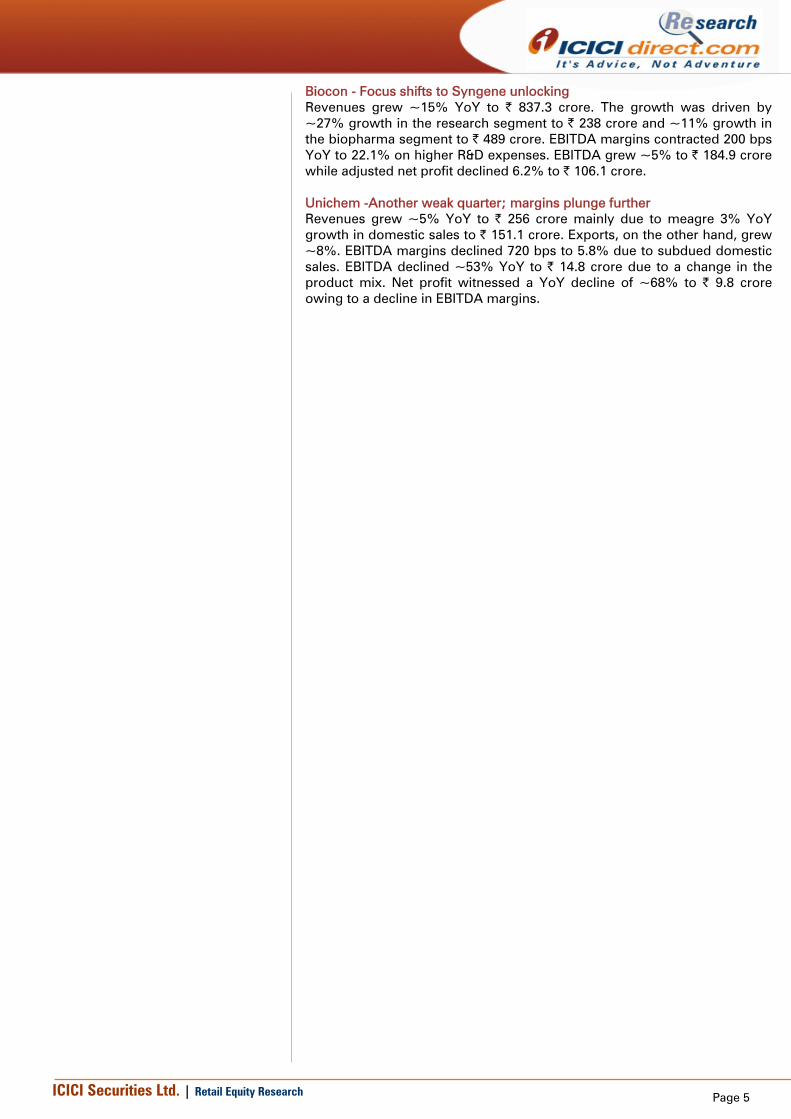
Biocon - Focus shifts to Syngene unlocking Revenues grew ~15% YoY to | 837.3 crore. The growth was driven by ~27% growth in the research segment to | 238 crore and ~11% growth in the biopharma segment to | 489 crore. EBITDA margins contracted 200 bps YoY to 22.1% on higher R&D expenses. EBITDA grew ~5% to | 184.9 crore while adjusted net profit declined 6.2% to | 106.1 crore. Unichem -Another weak quarter; margins plunge further Revenues grew ~5% YoY to | 256 crore mainly due to meagre 3% YoY growth in domestic sales to | 151.1 crore. Exports, on the other hand, grew ~8%. EBITDA margins declined 720 bps to 5.8% due to subdued domestic sales. EBITDA declined ~53% YoY to | 14.8 crore due to a change in the product mix. Net profit witnessed a YoY decline of ~68% to | 9.8 crore owing to a decline in EBITDA margins.

ICICI Securities Ltd. | Retail Equity Research
Page 6
Exhibit 2: Patent litigations in last 12 months
[5
Month Innovator ANDA Filer Brand Name API Used for May-14 Senju Pharmaceuticals Aurobindo Pharma Zymaxid Gatifloxacin ConjunctivitisMay-14 Otsuka Pharmaceutical Co. Alembic Pharma Abilify Aripiprazole SchizophraniaMay-14 Dr Reddy's Labs Purdue Pharmaceutical Product Intermezzo Zolpidem InsomniaMay-14 Otsuka Pharmaceutical Co. Cadila Healthcare Abilify Aripiprazole SchizophraniaMay-14 Otsuka Pharmaceutical Co. Aurobindo Pharma Abilify Aripiprazole SchizophraniaMay-14 AstraZeneca AB Aurobindo Pharma Onlyza Saxagliptin Type 2 DiabetesMay-14 AstraZeneca AB Glenmark Generics Onlyza Saxagliptin Type 2 DiabetesMay-14 AstraZeneca AB Wockhardt Onlyza Saxagliptin Type 2 DiabetesMay-14 Otsuka Pharmaceutical Co. Wockhardt Abilify Aripiprazole SchizophraniaMay-14 Forest Laboratories Inc. Ranbaxy Labs Namenda XR Memantine Alzheimer's diseaseJun-14 AstraZeneca Pharmaceuticals LP Sun Pharma Global FZE; Onglyza Saxagliptin DiabetesJun-14 Bristol-Myers Squibb Co. Aurobindo Pharma Reyataz Atazanavir HIVJun-14 Teva Women's Health Lupin Quartette Levonorgestre ContraceptiveJun-14 Forest Laboratories Inc Aurobindo Pharma Namenda XR Memantine Alzheimer's diseaseJun-14 Senju Pharma Lupin Pharma Inc. Prolensa Bromfenac Ocular InflammationJul-14 Pfizer Inc Aurobindo Pharma Tygacil Tygecycline InfectionJul-14 GlaxoSmithKline LLC Glenmark Generics Inc. Coreg Carvedilol High Blood PressureJul-14 Allos Therapuetics Inc Dr Reddy's Folotyn Pralatrexate LymphomaJul-14 Acorda Therapeutics Inc.; Aurobindo Pharma Ampyara Dalfampridine Multiple SyrosysJul-14 Alcon Pharmaceuticals Ltd. Aurobindo Pharma Vigamox Moxifloxacin Eye InfectionJul-14 Gilead Sciences Inc. Lupin Ltd. Atripla Efavirenz/Emtricitabine/Tenofovir HIVJul-14 AbbVie Inc. Aurobindo Pharma Norvir Ritonavir HIVJul-14 Alkermes Pharma Ltd. Sun Pharmaceuticals Focalin XR Dexmethylphenidate ADHDJul-14 Otsuka Pharma Co. Torrent Pharma Abilify Aripiprazole SchizophreniaJul-14 Astrazeneca AB Cadila Healthcare Nexium Esomeprazole Acid RefluxAug-14 Janssen Products LP Cipla Ltd. Prezista Darunavir HIVAug-14 Forest Labs Lupin Ltd. Namenda Memantine Hydrochloride Alzheimer's diseaseAug-14 Senju Pharma Ltd. Lupin Ltd. Prolensa Bromfenac Ocular InflammationAug-14 Novartis Pharma Dr. Reddy's Labs Gleevec Imatinib Mesylate Organ RejectionSep-14 Millenium Pharmaceuticals Glenmark Pharma Valcade Bortezomib Multiple MylomaSep-14 Teva Pharma Dr. Reddy's Labs Copaxon Glatiramer Acetate Multiple SclerosisSep-14 Reckitt Benckiser LLC Aurobindo Pharma Mucinex Guaifenesin MucusSep-14 Cephalon Inc. Dr. Reddy's Labs Treanda Bendamustine LeukemiaSep-14 Cephalon Inc. Sun Pharma Treanda Bendamustine LeukemiaOct-14 Novartis Pharma Dr. Reddy's Labs Gleevec Imatinib LeukemiaOct-14 Braintree Laboratory Inc. Taro Pharma Suprep Sodium Sulphate Bowel PreparationOct-14 Cephalon Inc. Wockhardt Treanda Bendamustine LeukemiaNov-14 Biomarin Pharma Dr. Reddy's Labs Kuvan Sapropterin Dihydrochloride phenylketonuriaNov-14 Otsuka Pharma Cadila Healthcare Abilify Aripiprazole schizophreniaNov-14 Otsuka Pharma Alembic Pharma Abilify Aripiprazole schizophrenia
Jan-15 iCeutica Lupin Ltd. Zorvolex Diclofenac Anti-Inflammatory
Jan-15 Senju Pharma Lupin Ltd. Prolensa Bromfenac Eye Inflammation
Jan-15 Sheonogi & Co. Aurobindo Pharma Doribax Doripenem Infection
Jan-15 Teva Pharma Dr. Reddy's Labs Copaxone Glatiramer Multiple Sclerosis
Feb-15 Roxane Laboratories Lupin Ltd. Roxane Calcium Acetate CCalcium Acetate Serum phosphorous Reduction
Feb-15 Cephalon Inc. Glenmark Generics Treanda Bendamustine Leukemia
Feb-15 Cephalon Inc. Dr. Reddy's Labs Treanda Bendamustine Leukemia
Mar-15 Otsuka Pharma Indoco Remedies Abilify Aripiprazole Schizophrenia
Apr-15 Sanofi Aventis Dr. Reddy's Labs Jevtana KIT Cabazitaxel Prostate Cancer
Apr-15 Sanofi Aventis Glenmark Jevtana KIT Cabazitaxel Prostate Cancer
Apr-15 Medicis Pharma Taro Pharma Zyclara Imiquimod Actinic Keratoses
Apr-15 Alcon Research Wockhardt Patanol Olopatadine hydrochloride Allergic Conjunctivitis
Apr-15 Janssen Products LP Cipla Prezista Darunavir Anti-Retroviral
Apr-15 Teva Pharma Dr. Reddy's Labs Copaxone Glatiramer Multiple Sclerosis
Apr-15 Eli Lilly Lupin Effient Prasugrel CVS
Apr-15 Horizon Pharma Lupin Pennsaid Diclofenac Osteoporosis
Source: Bloomberg, ICICIdirect.com Research
ICICI Securities Ltd. | Retail Equity Research
Page 7
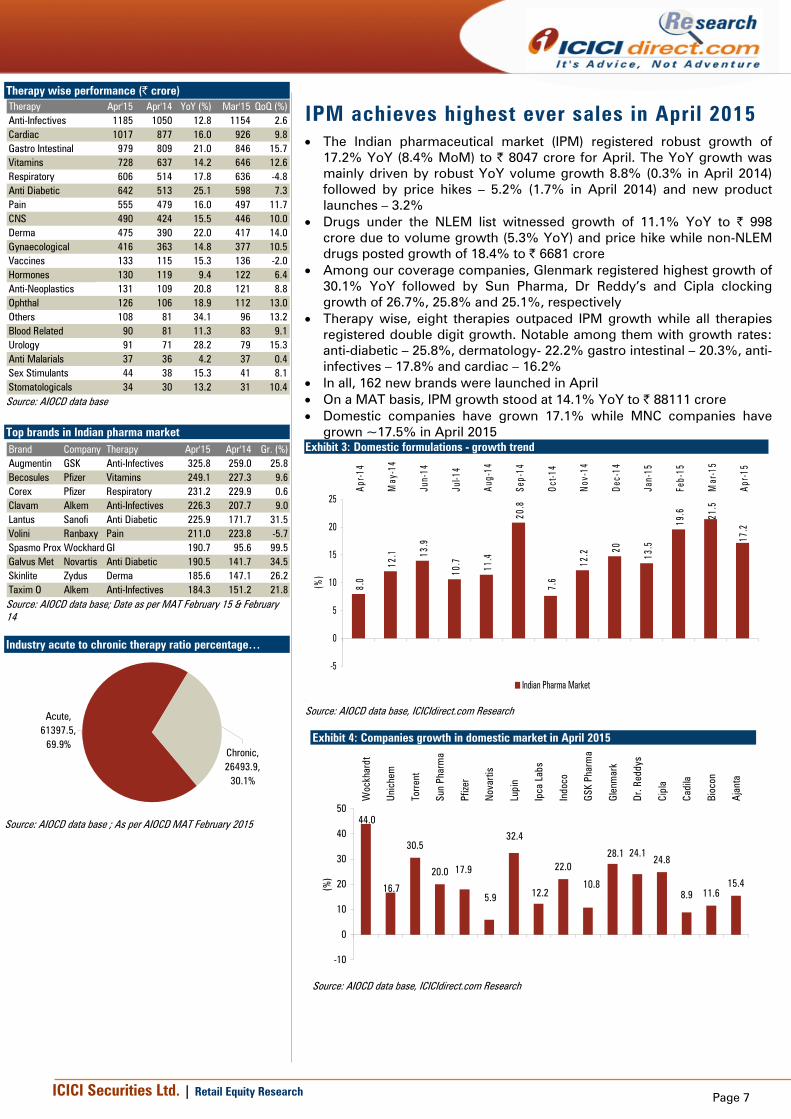
IPM achieves highest ever sales in April 2015 • The Indian pharmaceutical market (IPM) registered robust growth of
17.2% YoY (8.4% MoM) to | 8047 crore for April. The YoY growth was mainly driven by robust YoY volume growth 8.8% (0.3% in April 2014) followed by price hikes – 5.2% (1.7% in April 2014) and new product launches – 3.2%
• Drugs under the NLEM list witnessed growth of 11.1% YoY to | 998 crore due to volume growth (5.3% YoY) and price hike while non-NLEM drugs posted growth of 18.4% to | 6681 crore
• Among our coverage companies, Glenmark registered highest growth of 30.1% YoY followed by Sun Pharma, Dr Reddy’s and Cipla clocking growth of 26.7%, 25.8% and 25.1%, respectively
• Therapy wise, eight therapies outpaced IPM growth while all therapies registered double digit growth. Notable among them with growth rates: anti-diabetic – 25.8%, dermatology- 22.2% gastro intestinal – 20.3%, anti-infectives – 17.8% and cardiac – 16.2%
• In all, 162 new brands were launched in April • On a MAT basis, IPM growth stood at 14.1% YoY to | 88111 crore • Domestic companies have grown 17.1% while MNC companies have
grown ~17.5% in April 2015 Exhibit 3: Domestic formulations - growth trend
8.0
12.1 13
.9
10.7 11
.4
20.8
19.6
7.6
12.2 20
13.5
21.5
17.2
-5
0
5
10
15
20
25
Apr-1
4
May
-14
Jun-
14
Jul-1
4
Aug-
14
Sep-
14
Oct-1
4
Nov
-14
Dec-
14
Jan-
15
Feb-
15
Mar
-15
Apr-1
5
(%)
Indian Pharma Market [
Source: AIOCD data base, ICICIdirect.com Research
Exhibit 4: Companies growth in domestic market in April 2015
30.5
20.0 22.024.8
11.615.4
44.0
16.7
17.9
5.9
32.4
12.210.8
28.1 24.1
8.9
-10
0
10
20
30
40
50
Woc
khar
dt
Unic
hem
Torr
ent
Sun
Phar
ma
Pfize
r
Nov
artis
Lupi
n
Ipca
Lab
s
Indo
co
GSK
Phar
ma
Glen
mar
k
Dr. R
eddy
s
Cipl
a
Cadi
la
Bioc
on
Ajan
ta
(%)
Source: AIOCD data base, ICICIdirect.com Research
Therapy wise performance (| crore) Therapy Apr'15 Apr'14 YoY (%) Mar'15 QoQ (%)Anti-Infectives 1185 1050 12.8 1154 2.6Cardiac 1017 877 16.0 926 9.8Gastro Intestinal 979 809 21.0 846 15.7Vitamins 728 637 14.2 646 12.6Respiratory 606 514 17.8 636 -4.8Anti Diabetic 642 513 25.1 598 7.3Pain 555 479 16.0 497 11.7CNS 490 424 15.5 446 10.0Derma 475 390 22.0 417 14.0Gynaecological 416 363 14.8 377 10.5Vaccines 133 115 15.3 136 -2.0Hormones 130 119 9.4 122 6.4Anti-Neoplastics 131 109 20.8 121 8.8Ophthal 126 106 18.9 112 13.0Others 108 81 34.1 96 13.2Blood Related 90 81 11.3 83 9.1Urology 91 71 28.2 79 15.3Anti Malarials 37 36 4.2 37 0.4Sex Stimulants 44 38 15.3 41 8.1Stomatologicals 34 30 13.2 31 10.4
Source: AIOCD data base
Top brands in Indian pharma market Brand Company Therapy Apr'15 Apr'14 Gr. (%)Augmentin GSK Anti-Infectives 325.8 259.0 25.8Becosules Pfizer Vitamins 249.1 227.3 9.6Corex Pfizer Respiratory 231.2 229.9 0.6Clavam Alkem Anti-Infectives 226.3 207.7 9.0Lantus Sanofi Anti Diabetic 225.9 171.7 31.5Volini Ranbaxy Pain 211.0 223.8 -5.7Spasmo Prox Wockhard GI 190.7 95.6 99.5Galvus Met Novartis Anti Diabetic 190.5 141.7 34.5Skinlite Zydus Derma 185.6 147.1 26.2Taxim O Alkem Anti-Infectives 184.3 151.2 21.8
Source: AIOCD data base; Date as per MAT February 15 & February 14 Industry acute to chronic therapy ratio percentage…
Acute, 61397.5,
69.9%Chronic, 26493.9,
30.1%
Source: AIOCD data base ; As per AIOCD MAT February 2015

ICICI Securities Ltd. | Retail Equity Research
Page 8
Sun Pharmaceuticals
Stock Performance
80
125
170
May-14 Jul-14 Sep-14 Nov-14 Jan-15 Mar-15 May-15
CNX Pharma Sun Pharma
Source: NSE, ICICIdirect.com Research Exhibit 5: Company growth vis-à-vis Indian pharma market growth
8.0
12.1 13
.9
10.7
11.4
20.8
7.6
12.2 14
.8
13.5
19.6 21
.5
17.2
10.0
16.5 17
.6
15.3
14.4
9.9
9.7
14.9
21.7
13.5 16
.0
20.0
26.7
0
5
10
15
20
25
30
Apr-1
4
May
-14
Jun-
14
Jul-1
4
Aug-
14
Sep-
14
Oct-1
4
Nov
-14
Dec-
14
Jan-
15
Feb-
15
Mar
-15
Apr-1
5
(%)
Indian Pharma Market Sun Pharmaceutical Industries
Source: AIOCD data base, ICICIdirect.com Research
Exhibit 6: Market share in Indian formulations market
5.3
5.5
5.1
5.35.2
4.9
5.4
5.6 5.7
5.9
5.4
5.65.7
4.8
5.0
5.2
5.4
5.6
5.8
6.0
6.2
Apr-1
4
May
-14
Jun-
14
Jul-1
4
Aug-
14
Sep-
14
Oct-1
4
Nov
-14
Dec-
14
Jan-
15
Feb-
15
Mar
-15
Apr-1
5
(%)
Sun Pharmaceutical Industries
Source: AIOCD data base, ICICIdirect.com Research
Exhibit 7: Top 10 brands performance (| crore) Brand Therapy Apr'15 Apr'14 Var. (%) Mar'15 Var. (%)
Gemer Anti Diabetic 12.8 10.2 26 11.6 10
Istamet Anti Diabetic 12.5 7.9 59 11.5 9
Susten Gynaecological 12.3 9.9 24 11.4 8
Pantocid Gastro Intestinal 11.9 9.5 25 11.2 7
Levipil Neuro 11.6 8.3 41 10.7 9
Aztor Cardiac 9.9 7.4 34 8.7 14
Pantocid Dsr Gastro Intestinal 9.8 6.8 44 9.4 5
Montek-Lc Respiratory 6.3 4.6 37 6.5 -3
Glucored Anti Diabetic 6.3 5.7 10 5.7 10
Cardivas Cardiac 6.0 4.6 30 5.3 13
Source: AIOCD data base, ICICIdirect.com Research
Exhibit 8: Contribution of therapies to domestic sales (MAT April’15) z
Neuro 35%
Cardiac23%
Gastro Intestinal19%
Anti Diabetic15%
Gynaecological8%
Source: AIOCD data base, ICICIdirect.com Research
Exhibit 9: Therapy wise performance (| crore)
Therapy Apr'15 Apr'14 YoY (%) Mar'15 QoQ (%)
Neuro 123.5 95.8 29.0 113.1 9.3
Cardiac 84.9 68.0 24.9 76.0 11.8
Gastro Intestinal 70.2 51.0 37.7 63.2 11.1
Anti Diabetic 55.9 42.5 31.5 50.5 10.8
Gynaecological 28.4 30.1 -5.6 25.8 10.1
Pain 20.4 15.3 32.9 18.0 13.5
Ophthal 20.0 15.4 30.1 17.6 13.7
Respiratory 16.9 14.0 20.4 17.2 -1.8
Vitamins 15.2 10.4 47.1 14.1 8.1
Hormones 9.1 9.0 2.0 7.6 19.9
Source: AIOCD data base, ICICIdirect.com Research
Acute : Chronic contribution (MAT April’15)
Acute, 90.4, 28%
Chronic, 231.4, 72%
Brands contribution to domestic sales (MAT April’15)
21%
11%
8%
11%
49%
Top 10 11 to 20 21 to 30 31 to 50 Others
Source: AIOCD data base
ICICI Securities Ltd. | Retail Equity Research
Page 9
Ranbaxy Laboratories
Stock Performance
80120160200240
May-14 Jul-14 Sep-14 Nov-14 Jan-15 Mar-15 May-15
CNX Pharma Ranbaxy
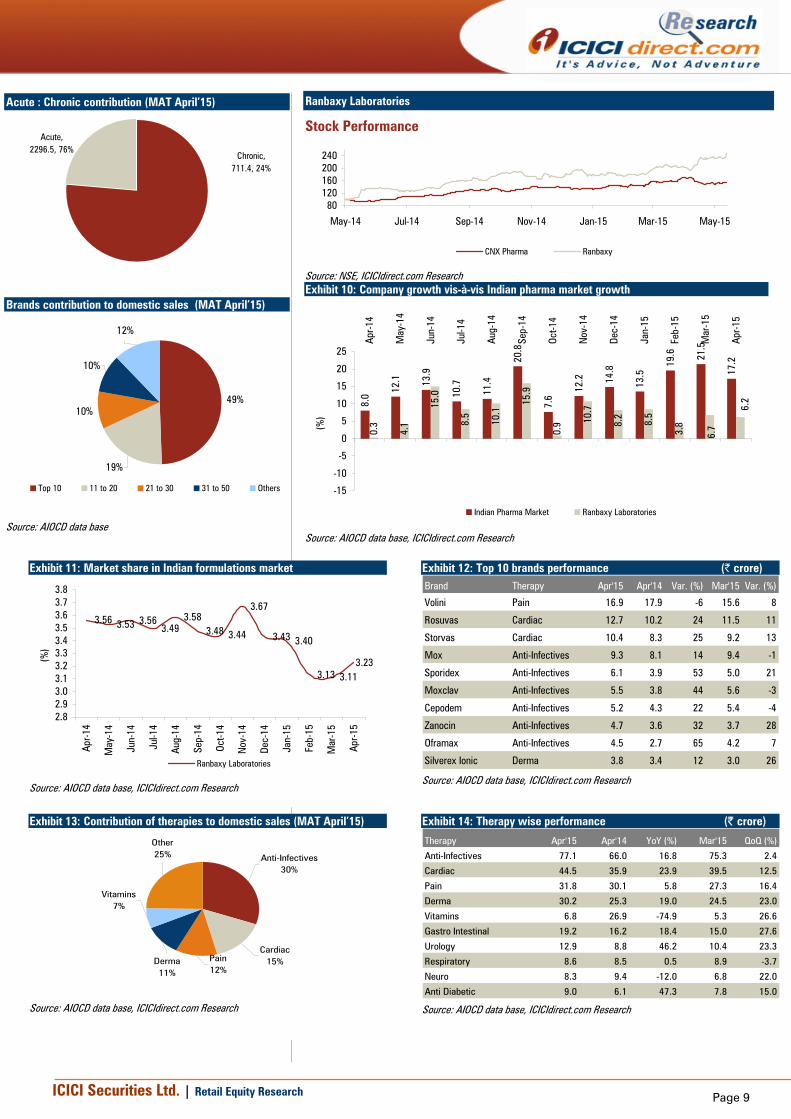
Source: NSE, ICICIdirect.com Research Exhibit 10: Company growth vis-à-vis Indian pharma market growth
8.0
12.1 13
.9
10.7
11.4
20.8
7.6
12.2 14
.8
13.5
19.6 21
.5
17.2
0.3
4.1
15.0
8.5
10.1
15.9
0.9 10
.7
8.2
8.5
3.8
6.7
6.2
-15
-10
-5
0
5
10
15
20
25
Apr-1
4
May
-14
Jun-
14
Jul-1
4
Aug-
14
Sep-
14
Oct-1
4
Nov
-14
Dec-
14
Jan-
15
Feb-
15
Mar
-15
Apr-1
5
(%)
Indian Pharma Market Ranbaxy Laboratories
Source: AIOCD data base, ICICIdirect.com Research
Exhibit 11: Market share in Indian formulations market
3.56 3.53 3.563.49
3.583.48 3.44
3.67
3.43 3.40
3.13 3.113.23
2.82.93.03.13.23.33.43.53.63.73.8
Apr-1
4
May
-14
Jun-
14
Jul-1
4
Aug-
14
Sep-
14
Oct-1
4
Nov
-14
Dec-
14
Jan-
15
Feb-
15
Mar
-15
Apr-1
5
(%)
Ranbaxy Laboratories
Source: AIOCD data base, ICICIdirect.com Research
Exhibit 12: Top 10 brands performance (| crore) Brand Therapy Apr'15 Apr'14 Var. (%) Mar'15 Var. (%)
Volini Pain 16.9 17.9 -6 15.6 8
Rosuvas Cardiac 12.7 10.2 24 11.5 11
Storvas Cardiac 10.4 8.3 25 9.2 13
Mox Anti-Infectives 9.3 8.1 14 9.4 -1
Sporidex Anti-Infectives 6.1 3.9 53 5.0 21
Moxclav Anti-Infectives 5.5 3.8 44 5.6 -3
Cepodem Anti-Infectives 5.2 4.3 22 5.4 -4
Zanocin Anti-Infectives 4.7 3.6 32 3.7 28
Oframax Anti-Infectives 4.5 2.7 65 4.2 7
Silverex Ionic Derma 3.8 3.4 12 3.0 26
Source: AIOCD data base, ICICIdirect.com Research
Exhibit 13: Contribution of therapies to domestic sales (MAT April’15) z
Anti-Infectives30%
Cardiac15%Pain
12%Derma11%
Vitamins 7%
Other25%
Source: AIOCD data base, ICICIdirect.com Research
Exhibit 14: Therapy wise performance (| crore)
Therapy Apr'15 Apr'14 YoY (%) Mar'15 QoQ (%)
Anti-Infectives 77.1 66.0 16.8 75.3 2.4
Cardiac 44.5 35.9 23.9 39.5 12.5
Pain 31.8 30.1 5.8 27.3 16.4
Derma 30.2 25.3 19.0 24.5 23.0
Vitamins 6.8 26.9 -74.9 5.3 26.6
Gastro Intestinal 19.2 16.2 18.4 15.0 27.6
Urology 12.9 8.8 46.2 10.4 23.3
Respiratory 8.6 8.5 0.5 8.9 -3.7
Neuro 8.3 9.4 -12.0 6.8 22.0
Anti Diabetic 9.0 6.1 47.3 7.8 15.0
Source: AIOCD data base, ICICIdirect.com Research
Acute : Chronic contribution (MAT April’15)
Acute, 2296.5, 76%
Chronic, 711.4, 24%
Brands contribution to domestic sales (MAT April’15)
49%
19%
10%
10%
12%
Top 10 11 to 20 21 to 30 31 to 50 Others
Source: AIOCD data base

ICICI Securities Ltd. | Retail Equity Research
Page 10
Cipla
Stock Performance
80
110
140
170
200
May-14 Jul-14 Sep-14 Nov-14 Jan-15 Mar-15 May-15
CNX Pharma Cipla
Source: NSE, ICICIdirect.com Research
Exhibit 15: Company growth vis-à-vis Indian pharma market growth
8.0 12
.1 13.9
10.7
11.4
20.8
7.6
12.2 14
.8
13.5
19.6 21
.5
17.2
8.3
7.2 12
.4
10.4
15.4
38.8
10.3
8.3 13
.5
13.2
24.0
24.8
25.1
0
5
10
15
20
25
30
35
40
45
Apr-1
4
May
-14
Jun-
14
Jul-1
4
Aug-
14
Sep-
14
Oct-1
4
Nov
-14
Dec-
14
Jan-
15
Feb-
15
Mar
-15
Apr-1
5
(%)
Indian Pharma Market Cipla
Source: AIOCD data base, ICICIdirect.com Research
Exhibit 16: Market share in Indian formulations market
5.0
4.74.6
4.7
4.9
5.4
5.04.9
5.1 5.15.3
5.1
5.3
4.04.24.44.64.85.05.25.45.6
Apr-1
4
May
-14
Jun-
14
Jul-1
4
Aug-
14
Sep-
14
Oct-1
4
Nov
-14
Dec-
14
Jan-
15
Feb-
15
Mar
-15
Apr-1
5
(%)
Cipla
Source: AIOCD data base, ICICIdirect.com Research
Exhibit 17: Top 10 brands performance (| crore) Brand Therapy Apr'15 Apr'14 Var. (%) Mar'15 Var. (%)
Foracort Respiratory 17.5 13.1 33 15.5 13
Budecort Respiratory 13.0 10.1 29 13.3 -2
Seroflo Respiratory 12.5 10.5 19 11.3 11
Asthalin Respiratory 12.1 11.6 4 12.3 -1
Duolin Respiratory 10.6 8.7 22 9.7 9
Aerocort Respiratory 9.8 8.5 16 7.8 25
Azee Anti-Infectives 7.2 5.8 24 7.4 -2
Emeset Gastro Intestinal 6.9 3.9 77 5.3 30
Montair Lc Respiratory 6.7 5.0 33 6.5 2
Dytor Cardiac 6.6 5.1 30 5.7 17
Source: AIOCD data base, ICICIdirect.com Research
Exhibit 18: Contribution of therapies to domestic sales (MAT April’15)
Respiratory30%
Anti-Infectives27%
Cardiac13%
Gastro Intestinal7%
Urology5%
Other18%
Source: AIOCD data base, ICICIdirect.com Research
Exhibit 19: Therapy wise performance (| crore)
Therapy Apr '15 Apr'14 YoY (%) Mar '15 QoQ (%)Respiratory 128.9 104.8 23.0 119.8 7.6Anti-Infect ives 109.1 86.7 25.8 96.6 12.9
Cardiac 55.8 44.8 24.7 48.7 14.6Gastro Intestinal 33.0 25.4 29.7 25.9 27.2
Urology 20.6 14.4 43.5 17.8 15.7Neuro 15.6 12.1 29.3 13.6 14.4
Pain 12.6 8.2 54.0 10.4 20.8
Ophthal 10.7 9.6 12.0 8.6 24.7
Derma 9.5 8.7 9.6 8.0 19.0
Vitamins 9.0 8.5 5.6 6.6 37.4
Source: AIOCD data base, ICICIdirect.com Research
Acute : Chronic contribution (MAT April’15)
Acute, 2609.7, 59%
Chronic, 1812.6, 41%
Brands contribution to domestic sales (MAT April’15)
25%
12%
9%12%
42%
Top 10 11 to 20 21 to 30 31 to 50 Others
Source: AIOCD data base

ICICI Securities Ltd. | Retail Equity Research
Page 11
Dr Reddy’s Laboratories
Stock Performance
70
100
130
160
May-14 Jul-14 Sep-14 Nov-14 Jan-15 Mar-15 May-15CNX Pharma Dr. Reddys
Source: NSE, ICICIdirect.com Research
Exhibit 20: Company growth vis-à-vis Indian pharma market growth
8.0
12.1 13
.9
10.7
11.4
20.8
7.6
12.2 14
.8
13.5
19.6 21
.5
17.2
5.0 8.
9
16.0
9.3
15.3 16.6
1.6
9.3 12
.8
12.3 16
.1
24.1 25
.8
-10
0
10
20
30
Apr-1
4
May
-14
Jun-
14
Jul-1
4
Aug-
14
Sep-
14
Oct-1
4
Nov
-14
Dec-
14
Jan-
15
Feb-
15
Mar
-15
Apr-1
5
(%)
Indian Pharma Market Dr. Reddys Laboratories
Source: AIOCD data base, ICICIdirect.com Research
Exhibit 21: Market share in Indian formulations market
2.0
2.12.1
2.1
2.1 2.1
2.0
2.1
2.2
2.12.1
2.2 2.2
1.9
2.0
2.0
2.1
2.1
2.2
2.2
Apr-1
4
May
-14
Jun-
14
Jul-1
4
Aug-
14
Sep-
14
Oct-1
4
Nov
-14
Dec-
14
Jan-
15
Feb-
15
Mar
-15
Apr-1
5
(%)
Dr. Reddys Laboratories
Source: AIOCD data base, ICICIdirect.com Research
Exhibit 22: Top 10 brands performance (| crore) Brand Therapy Apr'15 Apr'14 Var. (%) Mar'15 Var. (%)
Omez Gastro Intestinal 10.3 7.7 33 9.0 15
Omez D Gastro Intestinal 7.1 5.4 32 6.3 13
Econorm Gastro Intestinal 6.1 4.6 34 4.7 29
Nise Pain 5.5 4.6 18 5.1 7
Stamlo Cardiac 5.4 4.5 20 5.1 5
Reditux Anti-Neoplastics 4.8 4.0 22 3.9 23
Mintop Derma 4.6 3.6 29 4.3 7
Grafeel Anti-Neoplastics 4.3 1.1 290 2.9 48
Stamlo Beta Cardiac 4.3 3.8 13 4.5 -5
Razo D Gastro Intestinal 4.2 3.6 17 4.0 5
Source: AIOCD data base, ICICIdirect.com Research
Exhibit 23: Contribution of therapies to domestic sales (MAT April’15)
Gastro Intestinal23%
Cardiac16%
Anti-Neoplastics
11%Anti-Infectives9%
Pain 8%
Other33%
Source: AIOCD data base, ICICIdirect.com Research
Exhibit 24: Therapy wise performance (| crore)
Therapy Apr'15 Apr'14 YoY (%) Mar'15 QoQ (%)
Gastro Intestinal 40.9 32.1 27.5 35.3 15.8
Cardiac 28.9 23.0 25.4 25.8 11.9
Anti-Neoplastics 21.7 15.7 38.4 18.4 17.8
Anti-Infectives 13.6 9.7 40.4 13.5 0.1
Pain 12.9 11.3 14.1 11.5 12.2
Anti Diabetic 12.6 9.9 27.1 12.5 1.1
Derma 12.1 10.9 10.4 11.5 4.5
Respiratory 7.7 6.5 19.2 9.0 -14.3
Urology 6.5 5.6 16.2 6.4 1.2
Stomatologicals 6.2 5.4 15.3 5.9 6.3
Source: AIOCD data base, ICICIdirect.com Research
Acute : Chronic contribution (MAT April’15)
Acute, 1294.4, 70%
Chronic, 565.0, 30%
Brands contribution to domestic sales (MAT April’15)
31%
16%9%
12%
32%
Top 10 11 to 20 21 to 30 31 to 50 Others
Source: AIOCD data base
ICICI Securities Ltd. | Retail Equity Research
Page 12
Lupin
Stock Performance
75115155195
May-14 Jul-14 Sep-14 Nov-14 Jan-15 Mar-15 May-15
CNX Pharma Lupin
Source: NSE, ICICIdirect.com Research
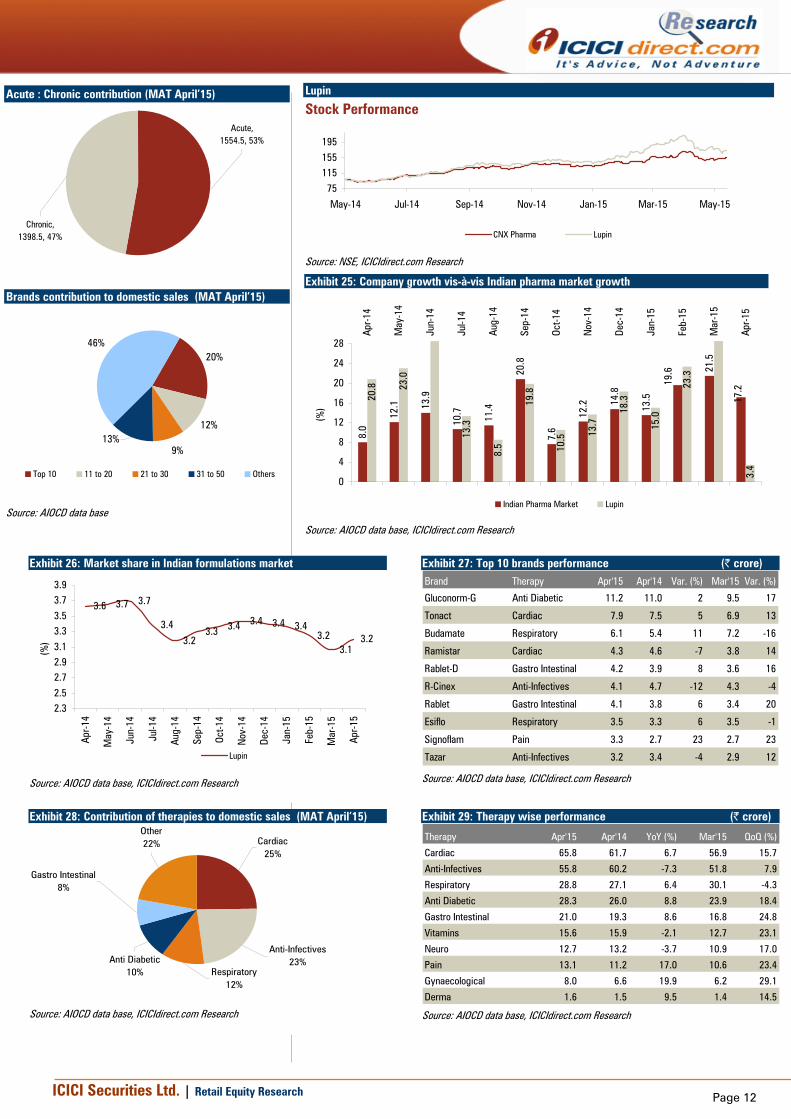
Exhibit 25: Company growth vis-à-vis Indian pharma market growth
8.0
12.1 13
.9
10.7
11.4
20.8
7.6
12.2 14
.8
13.5
21.5
20.8 23
.0
13.3
8.5
19.8
10.5 13
.7
18.3
15.0
23.3
3.4
19.6
17.2
0
4
8
12
16
20
24
28
Apr-1
4
May
-14
Jun-
14
Jul-1
4
Aug-
14
Sep-
14
Oct-1
4
Nov
-14
Dec-
14
Jan-
15
Feb-
15
Mar
-15
Apr-1
5
(%)
Indian Pharma Market Lupin
Source: AIOCD data base, ICICIdirect.com Research
Exhibit 26: Market share in Indian formulations market
3.6 3.7 3.7
3.4
3.23.3 3.4 3.4 3.4 3.4
3.23.1
3.2
2.32.52.72.93.13.33.53.73.9
Apr-1
4
May
-14
Jun-
14
Jul-1
4
Aug-
14
Sep-
14
Oct-1
4
Nov
-14
Dec-
14
Jan-
15
Feb-
15
Mar
-15
Apr-1
5
(%)
Lupin
Source: AIOCD data base, ICICIdirect.com Research
Exhibit 27: Top 10 brands performance (| crore) Brand Therapy Apr'15 Apr'14 Var. (%) Mar'15 Var. (%)
Gluconorm-G Anti Diabetic 11.2 11.0 2 9.5 17
Tonact Cardiac 7.9 7.5 5 6.9 13
Budamate Respiratory 6.1 5.4 11 7.2 -16
Ramistar Cardiac 4.3 4.6 -7 3.8 14
Rablet-D Gastro Intestinal 4.2 3.9 8 3.6 16
R-Cinex Anti-Infectives 4.1 4.7 -12 4.3 -4
Rablet Gastro Intestinal 4.1 3.8 6 3.4 20
Esiflo Respiratory 3.5 3.3 6 3.5 -1
Signoflam Pain 3.3 2.7 23 2.7 23
Tazar Anti-Infectives 3.2 3.4 -4 2.9 12
Source: AIOCD data base, ICICIdirect.com Research
Exhibit 28: Contribution of therapies to domestic sales (MAT April’15)
Cardiac25%
Anti-Infectives23%
Respiratory12%
Anti Diabetic10%
Gastro Intestinal8%
Other22%
Source: AIOCD data base, ICICIdirect.com Research
Exhibit 29: Therapy wise performance (| crore)
Therapy Apr'15 Apr'14 YoY (%) Mar'15 QoQ (%)
Cardiac 65.8 61.7 6.7 56.9 15.7
Anti-Infectives 55.8 60.2 -7.3 51.8 7.9
Respiratory 28.8 27.1 6.4 30.1 -4.3
Anti Diabetic 28.3 26.0 8.8 23.9 18.4
Gastro Intestinal 21.0 19.3 8.6 16.8 24.8
Vitamins 15.6 15.9 -2.1 12.7 23.1
Neuro 12.7 13.2 -3.7 10.9 17.0
Pain 13.1 11.2 17.0 10.6 23.4
Gynaecological 8.0 6.6 19.9 6.2 29.1
Derma 1.6 1.5 9.5 1.4 14.5
Source: AIOCD data base, ICICIdirect.com Research
Acute : Chronic contribution (MAT April’15)
Acute, 1554.5, 53%
Chronic, 1398.5, 47%
Brands contribution to domestic sales (MAT April’15)
20%
12%
9%13%
46%
Top 10 11 to 20 21 to 30 31 to 50 Others
Source: AIOCD data base

ICICI Securities Ltd. | Retail Equity Research
Page 13
Cadila Healthcare
Stock Performance
5080
110140170200230
May-14 Jul-14 Sep-14 Nov-14 Jan-15 Mar-15 May-15
CNX Pharma Cadila Healthcare
Source: NSE, ICICIdirect.com Research
Exhibit 30: Company growth vis-à-vis Indian pharma market growth
8.0
12.1 13
.9
10.7 11
.4
20.8
7.6
12.2 14
.8
13.5
19.6 21
.5
17.2
9.7
8.8 11
.2
9.1
8.9
12.0
0.9
7.4
11.6
5.1
5.2
8.9
8.1
0
5
10
15
20
25
Apr-1
4
May
-14
Jun-
14
Jul-1
4
Aug-
14
Sep-
14
Oct-1
4
Nov
-14
Dec-
14
Jan-
15
Feb-
15
Mar
-15
Apr-1
5
(%)
Indian Pharma Market Cadila Healthcare
Source: AIOCD data base, ICICIdirect.com Research
Exhibit 31: Market share in Indian formulations market
4.1
3.9 3.9
3.83.8
3.6
3.7
4.0
3.9 3.9
3.73.7 3.7
3.6
3.8
4.0
4.2
Apr-1
4
May
-14
Jun-
14
Jul-1
4
Aug-
14
Sep-
14
Oct-1
4
Nov
-14
Dec-
14
Jan-
15
Feb-
15
Mar
-15
Apr-1
5
(%)
Source: AIOCD data base, ICICIdirect.com Research
Exhibit 32: Top 10 brands performance (| crore) Brand Therapy Apr'15 Apr'14 Var. (%) Mar'15 Var. (%)
Skinlite Derma 16.3 13.4 22 15.6 5
Mifegest Kit Gynaecological 14.6 13.2 11 10.0 47
Atorva Cardiac 10.4 8.8 18 10.4 0
Deriphyllin Respiratory 8.8 8.9 -1 8.8 0
Pantodac Gastro Intestinal 7.8 6.8 15 7.3 6
Amlodac Cardiac 6.1 6.0 1 6.1 -1
Primolut N Gynaecological 5.5 4.4 25 4.4 24
Aten Cardiac 5.3 6.1 -13 6.0 -11
Clopitorva Cardiac 4.5 3.0 49 4.1 11
Dexona Hormones 4.4 5.8 -25 3.3 32
Source: AIOCD data base, ICICIdirect.com Research
Exhibit 33: Contribution of therapies to domestic sales (MAT April’15)
Cardiac18%
Gastro Intestinal14%
Gynaecological12%
Respiratory11%
Derma9%
Other36%
Source: AIOCD data base, ICICIdirect.com Research
Exhibit 34: Therapy wise performance (| crore)
Therapy Apr'15 Apr'14 YoY (%) Mar'15 QoQ (%)
Cardiac 54.4 49.7 9.4 52.9 2.8
Gastro Intestinal 41.8 39.5 5.7 35.6 17.3
Gynaecological 42.8 36.5 17.2 34.2 24.9
Respiratory 31.8 28.8 10.7 31.7 0.2
Derma 26.1 20.7 26.2 24.3 7.5
Pain 20.4 22.5 -9.5 20.4 -0.2
Anti-Infectives 17.3 19.5 -11.2 15.2 13.3
Vitamins 12.1 10.3 17.4 12.5 -3.0
Anti-Neoplastics 13.7 9.3 48.4 13.1 4.7
Anti Malarials 5.4 4.8 13.0 5.5 -2.5
Source: AIOCD data base, ICICIdirect.com Research
Acute : Chronic contribution (MAT April’15)
Acute, 2260.0, 68%
Chronic, 1086.8, 32%
Brands contribution to domestic sales (MAT April’15)
27%
13%
8%11%
41%
Top 10 11 to 20 21 to 30 31 to 50 Others
Source: AIOCD data base

ICICI Securities Ltd. | Retail Equity Research
Page 14
GlaxoSmithKline Pharmaceuticals
Stock Performance
80110140170200
May-14 Jul-14 Sep-14 Nov-14 Jan-15 Mar-15 May-15
CNX Pharma GSK Pharma
Source: NSE, ICICIdirect.com Research
Exhibit 35: Company growth vis-à-vis Indian pharma market growth
8.0
12.1 13
.9
10.7
11.4
20.8
7.6
12.2 14
.8
13.5
19.6 21
.5
17.2
-12.
2 -7.0 -4.5
-6.0
1.4
13.0
12.1
5.5
0.8 2.
6 6.6 10
.8 12.9
-15
-10
-5
0
5
10
15
20
25
Apr-1
4
May
-14
Jun-
14
Jul-1
4
Aug-
14
Sep-
14
Oct-1
4
Nov
-14
Dec-
14
Jan-
15
Feb-
15
Mar
-15
Apr-1
5
(%)
Indian Pharma Market Glaxosmithkline Pharmaceuticals
Source: AIOCD data base, ICICIdirect.com Research
Exhibit 36: Market share in Indian formulations market
3.53.6 3.6
3.63.7
3.53.4 3.5 3.4
3.3 3.3
3.4 3.4
3.0
3.2
3.4
3.6
3.8
Apr-1
4
May
-14
Jun-
14
Jul-1
4
Aug-
14
Sep-
14
Oct-1
4
Nov
-14
Dec-
14
Jan-
15
Feb-
15
Mar
-15
Apr-1
5
(%)
Glaxosmithkline Pharmaceuticals
Source: AIOCD data base, ICICIdirect.com Research
Exhibit 37: Top 10 brands performance (| crore) Brand Therapy Apr'15 Apr'14 Var. (%) Mar'15 Var. (%)
Augmentin Anti-Infectives 26.6 20.5 30 30.1 -12
Synflorix Vaccines 15.8 10.3 54 14.4 10
Betnovate C Derma 14.5 7.6 90 10.6 37
Zinetac Gastro Intestinal 14.4 12.6 14 12.3 17
Calpol Pain 13.9 11.7 19 13.4 4
Betnovate N Derma 12.2 9.6 27 9.6 28
Eltroxin Hormones 11.9 11.4 4 10.6 13
Ceftum Anti-Infectives 10.2 10.0 3 10.6 -3
Betnesol Hormones 10.0 5.5 82 9.3 7
T Bact Derma 8.0 7.0 14 6.9 16
Source: AIOCD data base, ICICIdirect.com Research
Exhibit 38: Contribution of therapies to domestic sales (MAT April’15)
Anti-Infectives26%
Derma20%Vaccines
12%
Pain 9%
Vitamins 7%
Other26%
Source: AIOCD data base, ICICIdirect.com Research
Exhibit 39: Therapy wise performance (| crore)
Therapy Apr'15 Apr'14 YoY (%) Mar'15 QoQ (%)
Anti-Infectives 63.2 63.1 0.1 64.2 -1.6
Derma 61.7 44.5 38.4 50.6 21.9
Vaccines 30.9 27.8 11.3 31.1 -0.5
Pain 24.9 20.6 20.4 21.9 13.3
Vitamins 19.1 18.0 6.0 17.7 7.6
Hormones 22.7 17.9 27.1 20.7 9.6
Respiratory 15.0 13.4 11.7 16.6 -9.6
Gastro Intestinal 17.2 16.4 4.7 14.5 18.6
Cardiac 6.3 7.4 -15.1 6.2 0.7
Ophthal 3.6 3.3 8.2 2.9 21.3
Source: AIOCD data base, ICICIdirect.com Research
Acute : Chronic contribution (MAT April’15)
Acute, 2666.9, 87%
Chronic, 401.3, 13%
Brands contribution to domestic sales (MAT April’15)
48%
16%
9%
11%
16%
Top 10 11 to 20 21 to 30 31 to 50 Others
Source: AIOCD data base

ICICI Securities Ltd. | Retail Equity Research
Page 15
Wockhardt
Stock Performance
050
100150200250300350400
May-14 Jul-14 Sep-14 Nov-14 Jan-15 Mar-15 May-15
CNX Pharma Wockhardt
Source: NSE, ICICIdirect.com Research Exhibit 40: Company growth vis-à-vis Indian pharma market growth
8.0 12
.1 13.9
10.7
11.4
20.8
7.6 12
.2 14.8
13.5 19
.6 21.5
17.2
-6.1
-2.4
14.6
-5.1
-5.9
18.0
8.5
5.0
-2.6
19.0
31.2
44.0
27.5
-10
0
10
20
30
40
50
Apr-1
4
May
-14
Jun-
14
Jul-1
4
Aug-
14
Sep-
14
Oct-1
4
Nov
-14
Dec-
14
Jan-
15
Feb-
15
Mar
-15
Apr-1
5
(%)
Indian Pharma Market Wockhardt
Source: AIOCD data base, ICICIdirect.com Research
Exhibit 41: Market share in Indian formulations market
1.171.15
1.09
1.191.24
1.08
1.161.10
1.16
1.37
1.47
1.40
1.28
1.01.11.11.21.21.31.31.41.41.51.5
Apr-1
4
May
-14
Jun-
14
Jul-1
4
Aug-
14
Sep-
14
Oct-1
4
Nov
-14
Dec-
14
Jan-
15
Feb-
15
Mar
-15
Apr-1
5
(%)
Wockhardt
Source: AIOCD data base, ICICIdirect.com Research
Exhibit 42: Top 10 brands performance (| crore) Brand Therapy Apr'15 Apr'14 Var. (%) Mar'15 Var. (%)
Spasmo Proxyvon PluGastro Intestinal 23.4 11.0 113 22.3 5
Practin Vitamins 6.9 5.8 NA 7.1 -2
Biovac V Vaccines 6.1 0.0 #DIV/0! 7.6 -20
Bro Zedex Respiratory 4.5 4.8 -8 5.2 -13
Tryptomer Neuro 4.1 4.0 2 4.0 2
Zedex Respiratory 3.4 3.4 0 3.6 -5
Methycobal Vitamins 3.3 3.2 3 3.0 9
Biovac A Vaccines 3.0 1.4 120 3.3 -10
Ace Proxyvon Pain 2.9 2.4 21 2.5 16
Libotryp Neuro 2.0 1.6 23 1.7 17
Source: AIOCD data base, ICICIdirect.com Research
Exhibit 43: Contribution of therapies to domestic sales (MAT April’15)
Gastro Intestinal19%
Vitamins 17%
Respiratory15%
Derma8%
Anti-Infectives7%
Other34%
Source: AIOCD data base, ICICIdirect.com Research
Exhibit 44: Therapy wise performance (| crore)
Therapy Apr'15 Apr'14 YoY (%) Mar'15 QoQ (%)
Gastro Intestinal 25.3 12.3 105.9 24.0 5.7
Vitamins 17.0 17.0 0.5 16.1 6.0
Respiratory 13.2 12.6 4.5 15.2 -13.2
Derma 6.9 6.1 12.5 7.6 -9.8
Anti-Infectives 6.1 6.6 -8.3 6.1 -0.1
Neuro 6.8 6.2 9.4 6.3 7.8
Pain 6.1 5.1 18.9 5.9 2.1
Vaccines 9.1 1.5 495.4 11.0 -16.9
Anti Diabetic 5.7 5.0 14.9 5.1 13.2
Hormones 1.8 4.0 -55.6 1.9 -5.4
Source: AIOCD data base, ICICIdirect.com Research
Acute : Chronic contribution (MAT April’15)
Acute, 861.4, 80%
Chronic, 215.0, 20%
Brands contribution to domestic sales (MAT April’15)
53%
17%
8%
8%14%
Top 10 11 to 20 21 to 30 31 to 50 Others
Source: AIOCD data base

ICICI Securities Ltd. | Retail Equity Research
Page 16
Glenmark Pharmaceuticals
Stock Performance
60
100
140
180
May-14 Jul-14 Sep-14 Nov-14 Jan-15 Mar-15 May-15CNX Pharma Glenmark
Source: NSE, ICICIdirect.com Research
Exhibit 45: Company growth vis-à-vis Indian pharma market growth
8.0
12.1 13
.9
10.7
11.4
20.8
7.6
12.2 14
.8
13.5
19.6 21
.5
17.2
11.4 15
.0 18.0
9.9
9.1
27.2
2.6
20.4 21
.5
21.4 24
.2
28.1 30
.1
0
5
10
15
20
25
30
35
Apr-1
4
May
-14
Jun-
14
Jul-1
4
Aug-
14
Sep-
14
Oct-1
4
Nov
-14
Dec-
14
Jan-
15
Feb-
15
Mar
-15
Apr-1
5
(%)
Indian Pharma Market Glenmark Pharmaceuticals
Source: AIOCD data base, ICICIdirect.com Research
Exhibit 46: Market share in Indian formulations market
2.1
1.92.0
2.02.1
2.4
2.1
2.4 2.52.4
2.32.3
2.3
1.9
2.1
2.3
2.5
Apr-1
4
May
-14
Jun-
14
Jul-1
4
Aug-
14
Sep-
14
Oct-1
4
Nov
-14
Dec-
14
Jan-
15
Feb-
15
Mar
-15
Apr-1
5
(%)
Glenmark Pharmaceuticals
Source: AIOCD data base, ICICIdirect.com Research
Exhibit 47: Top 10 brands performance (| crore) Brand Therapy Apr'15 Apr'14 Var. (%) Mar'15 Var. (%)
Telma Cardiac 13.6 11.7 16 12.8 6
Telma H Cardiac 10.8 9.4 15 9.8 10
Ascoril Plus Respiratory 7.9 7.0 13 8.8 -10
Candid-B Derma 7.4 5.9 24 5.6 32
Zitamet Anti Diabetic 6.8 3.2 114 6.2 8
Candid Derma 6.3 4.4 43 5.0 26
Telma Am Cardiac 5.5 4.3 28 4.9 13
Zita(Glenmark) Anti Diabetic 4.9 2.0 146 4.3 13
Candid Mouth Derma 3.3 1.9 67 2.6 27
Milixim Anti-Infectives 3.2 1.7 97 3.0 9
Source: AIOCD data base, ICICIdirect.com Research
Exhibit 48: Contribution of therapies to domestic sales (MAT April’15)
Derma29%
Cardiac23%
Respiratory15%
Anti-Infectives14%
Anti Diabetic8%
Other11%
Source: AIOCD data base, ICICIdirect.com Research
Exhibit 49: Therapy wise performance (| crore)
Therapy Apr'15 Apr'14 YoY (%) Mar'15 QoQ (%)
Derma 52.3 40.4 29.5 42.7 22.5
Cardiac 43.0 35.3 21.8 38.8 10.8
Respiratory 26.4 20.6 28.5 28.8 -8.1
Anti-Infectives 27.1 18.6 45.4 25.3 6.9
Anti Diabetic 15.9 9.9 60.4 14.8 6.9
Gastro Intestinal 5.1 3.3 56.8 4.2 21.8
Vitamins 4.4 3.3 34.5 3.6 20.7
Pain 4.0 3.5 14.3 3.4 17.5
Gynaecological 3.2 4.3 -25.3 3.1 2.8
Otologicals 2.9 2.4 23.2 2.4 24.3
Source: AIOCD data base, ICICIdirect.com Research
Acute : Chronic contribution (MAT April’15)
Acute, 1240.2, 63%
Chronic, 723.3, 37%
Brands contribution to domestic sales (MAT April’15)
37%
13%10%
12%
28%
Top 10 11 to 20 21 to 30 31 to 50 Others
Source: AIOCD data base

ICICI Securities Ltd. | Retail Equity Research
Page 17
Torrent Pharmaceuticals
Stock Performance
80
170
260
May-14 Jul-14 Sep-14 Nov-14 Jan-15 Mar-15 May-15
CNX Pharma Torrent Pharma
Source: NSE, ICICIdirect.com Research
Exhibit 50: Company growth vis-à-vis Indian pharma market growth
8.0
12.1 13
.9
10.7
11.4
20.8
7.6
12.2 14
.8
13.5
19.6 21
.5
17.2
1.1
4.7
12.2
10.9
8.4
18.5
6.0
23.2
30.7
21.1
30.9
30.5
28.7
0
5
10
15
20
25
30
35
Apr-1
4
May
-14
Jun-
14
Jul-1
4
Aug-
14
Sep-
14
Oct-1
4
Nov
-14
Dec-
14
Jan-
15
Feb-
15
Mar
-15
Apr-1
5
(%)
Indian Pharma Market Torrent Pharmaceuticals
Source: AIOCD data base, ICICIdirect.com Research
Exhibit 51: Market share in Indian formulations market
2.232.20
2.26 2.26
2.11 2.12
2.242.31
2.43
2.362.402.32
2.45
1.9
2.0
2.1
2.2
2.3
2.4
2.5
Apr-1
4
May
-14
Jun-
14
Jul-1
4
Aug-
14
Sep-
14
Oct-1
4
Nov
-14
Dec-
14
Jan-
15
Feb-
15
Mar
-15
Apr-1
5
(%)
Torrent Pharmaceuticals
Source: AIOCD data base, ICICIdirect.com Research
Exhibit 52: Top 10 brands performance (| crore) Brand Therapy Apr'15 Apr'14 Var. (%) Mar'15 Var. (%)
Shelcal Vitamins 19.8 8.7 127 14.7 34
Chymoral Forte Pain 9.9 4.7 113 9.8 1
Nikoran Cardiac 6.8 6.0 14 6.3 8
Dilzem Cardiac 5.7 5.7 0 5.1 12
Nebicard Cardiac 5.1 4.4 17 4.3 20
Azulix-Mf Anti Diabetic 4.7 3.9 20 4.2 12
Nexpro Rd Gastro Intestinal 4.2 3.5 18 4.2 0
Nexpro Gastro Intestinal 4.1 3.3 25 4.1 0
Alprax Neuro 3.4 3.0 12 2.9 16
Rozucor Cardiac 3.4 2.7 27 2.6 31
Source: AIOCD data base, ICICIdirect.com Research
Exhibit 53: Contribution of therapies to domestic sales (MAT April’15)
Cardiac29%
Neuro 16%Gastro Intestinal
16%
Vitamins 14%
Anti-Infectives7%
Other18%
Source: AIOCD data base, ICICIdirect.com Research
Exhibit 54: Therapy wise performance (| crore)
Therapy Apr'15 Apr'14 YoY (%) Mar'15 QoQ (%)
Cardiac 57.5 49.2 16.9 51.1 12.5
Neuro 31.2 26.4 18.5 27.2 14.8
Gastro Intestinal 29.1 23.6 23.4 26.0 11.9
Vitamins 31.2 17.8 74.9 24.2 29.0
Anti-Infectives 10.5 11.0 -4.5 10.8 -2.6
Pain 14.6 7.7 89.4 13.9 4.9
Anti Diabetic 11.1 9.3 19.6 10.1 9.8
Derma 4.4 3.2 37.6 3.8 15.9
Gynaecological 3.8 2.9 31.6 3.0 26.4
Urology 0.6 0.5 23.2 0.5 27.0
Source: AIOCD data base, ICICIdirect.com Research
Acute : Chronic contribution (MAT April’15)
Acute, 1000.0, 50%
Chronic, 1017.4, 50%
Brands contribution to domestic sales (MAT April’15)
32%
14%9%
12%
33%
Top 10 11 to 20 21 to 30 31 to 50 Others
Source: AIOCD data base

ICICI Securities Ltd. | Retail Equity Research
Page 18
Ipca Laboratories
Stock Performance
60
120
180
May-14 Jul-14 Sep-14 Nov-14 Jan-15 Mar-15 May-15
CNX Pharma Ipca
Source: NSE, ICICIdirect.com Research
Exhibit 55: Company growth vis-à-vis Indian pharma market growth
8.0
12.1 13
.9
10.7
11.4
20.8
7.6
12.2 14
.8
13.5
19.6 21
.5
17.2
2.5
22.2
23.1
15.5
21.4
9.2 13
.0
12.9
28.6
35.9
12.2
16.3
14.5
0
5
10
15
20
25
30
35
40
Apr-1
4
May
-14
Jun-
14
Jul-1
4
Aug-
14
Sep-
14
Oct-1
4
Nov
-14
Dec-
14
Jan-
15
Feb-
15
Mar
-15
Apr-1
5
(%)
Indian Pharma Market Ipca Laboratories
Source: AIOCD data base, ICICIdirect.com Research
Exhibit 56: Market share in Indian formulations market
1.3
1.5 1.51.4 1.5
1.51.4
1.31.2 1.2 1.2 1.2 1.3
1.0
1.2
1.4
1.6
1.8
2.0
Apr-1
4
May
-14
Jun-
14
Jul-1
4
Aug-
14
Sep-
14
Oct-1
4
Nov
-14
Dec-
14
Jan-
15
Feb-
15
Mar
-15
Apr-1
5
(%)
Ipca Laboratories
Source: AIOCD data base, ICICIdirect.com Research
Exhibit 57: Top 10 brands performance (| crore) Brand Therapy Apr'15 Apr'14 Var. (%) Mar'15 Var. (%)
Zerodol Sp Pain 6.7 4.2 59 5.7 18
Hcqs Anti Malarials 5.9 4.1 45 5.1 17
Zerodol P Pain 5.2 4.7 11 4.0 29
Rapither-Ab Anti Malarials 3.4 2.4 43 2.7 25
Folitrax Anti-Neoplastics 2.8 2.2 26 2.3 20
Lariago Anti Malarials 2.6 2.3 16 2.8 -6
Glycinorm M Anti Diabetic 2.3 2.5 -7 2.4 -2
Saaz Gastro Intestinal 2.2 1.2 80 1.8 20
Mmf (Ipca) Anti-Neoplastics 2.1 0.5 295 2.3 -7
Larinate Anti Malarials 2.0 2.3 -12 2.1 -5
Source: AIOCD data base, ICICIdirect.com Research
Exhibit 58: Contribution of therapies to domestic sales (MAT April’15)
Pain 23%
Anti Malarials21%
Cardiac17%
Gastro Intestinal8%
Anti-Infectives7%
Other24%
Source: AIOCD data base, ICICIdirect.com Research
Exhibit 59: Therapy wise performance (| crore)
Therapy Apr'15 Apr'14 YoY (%) Mar'15 QoQ (%)
Pain 24.8 20.4 21.9 20.8 19.5
Anti Malarials 17.6 16.2 9.1 16.1 9.5
Cardiac 17.8 16.8 6.4 16.4 8.8
Gastro Intestinal 8.8 7.9 11.5 7.2 22.3
Anti-Infectives 6.6 5.9 10.7 6.8 -3.4
Anti Diabetic 4.9 5.3 -6.0 4.8 2.4
Respiratory 3.7 3.5 3.9 4.3 -14.8
Neuro 4.9 3.5 41.9 4.5 10.1
Anti-Neoplastics 4.9 2.7 79.5 4.6 6.4
Derma 2.8 2.6 8.9 2.8 -1.5
Source: AIOCD data base, ICICIdirect.com Research
Acute : Chronic contribution (MAT April’15)
Acute, 877.5, 73%
Chronic, 325.6, 27%
Brands contribution to domestic sales (MAT April’15)
36%
15%
11%
13%
25%
Top 10 11 to 20 21 to 30 31 to 50 Others
Source: AIOCD data base

ICICI Securities Ltd. | Retail Equity Research
Page 19
Biocon
Stock Performance
6080
100120140160180
May-14 Jul-14 Sep-14 Nov-14 Jan-15 Mar-15 May-15CNX Pharma Biocon
Source: NSE, ICICIdirect.com Research
Exhibit 60: Company growth vis-à-vis Indian pharma market growth
8.0 12
.1 13.9
10.7
11.4
20.8
7.6
12.2 14
.8 19.6 21
.5
17.226.8
33.8
13.5
43.1
20.3
11.4
31.3
9.8
1.0
7.2
18.8
17.5
11.6
11.5
05
101520253035404550
Apr-1
4
May
-14
Jun-
14
Jul-1
4
Aug-
14
Sep-
14
Oct-1
4
Nov
-14
Dec-
14
Jan-
15
Feb-
15
Mar
-15
Apr-1
5
(%)
Indian Pharma Market Biocon
Source: AIOCD data base, ICICIdirect.com Research
Exhibit 61: Market share in Indian formulations market
0.35
0.37
0.40
0.360.35
0.39
0.37
0.36 0.36
0.38
0.350.34
0.36
0.33
0.34
0.35
0.36
0.37
0.38
0.39
0.40
Apr-1
4
May
-14
Jun-
14
Jul-1
4
Aug-
14
Sep-
14
Oct-1
4
Nov
-14
Dec-
14
Jan-
15
Feb-
15
Mar
-15
Apr-1
5
(%)
Biocon
Source: AIOCD data base, ICICIdirect.com Research
Exhibit 62: Top 10 brands performance (| crore) Brand Therapy Apr'15 Apr'14 Var. (%) Mar'15 Var. (%)
Insugen Anti Diabetic 6.7 5.7 17 6.9 -4
Basalog Anti Diabetic 4.7 3.4 41 4.5 6
Blisto Mf Anti Diabetic 1.7 2.1 -18 1.6 11
Canmab Anti-Neoplastics 1.6 0.2 706 2.0 -22
Erypro Blood Related 1.4 0.9 62 1.2 15
Insugen R Anti Diabetic 1.4 1.1 23 1.3 9
Abraxane Anti-Neoplastics 1.0 1.7 -43 1.3 -29
Insugen N Anti Diabetic 0.9 0.6 41 0.8 13
Abstet Anti-Neoplastics 0.8 0.1 521 0.4 94
Psorid Anti-Neoplastics 0.5 0.2 151 0.4 34
Source: AIOCD data base, ICICIdirect.com Research
Exhibit 63: Contribution of therapies to domestic sales (MAT April’15)
Anti Diabetic59%
Anti-Neoplastics
20%
Cardiac9%
Blood Related4%
Anti-Infectives3%
Other 5%
Source: AIOCD data base, ICICIdirect.com Research
Exhibit 64: Therapy wise performance (| crore)
Therapy Apr'15 Apr'14 YoY (%) Mar'15 QoQ (%)
Anti Diabetic 16.9 14.8 14.4 16.4 2.7
Anti-Neoplastics 5.0 2.9 69.1 5.1 -1.4
Cardiac 1.9 2.9 -33.9 1.9 3.2
Blood Related 1.4 0.9 61.7 1.2 15.4
Anti-Infectives 0.6 1.3 -54.9 0.7 -18.8
Derma 0.8 0.9 -10.9 0.7 5.6
Others 0.3 0.4 -25.1 0.2 27.1
Vitamins 0.2 0.2 -8.1 0.3 -39.0
Gastro Intestinal 0.1 0.0 299.7 0.0 77.3
Pain 0.0 0.0 -59.7 0.0 42.9
Source: AIOCD data base, ICICIdirect.com Research
Acute : Chronic contribution (MAT April’15)
Acute, 90.4, 28%
Chronic, 231.4, 72%
Brands contribution to domestic sales (MAT April’15)
72%
12%
7%
6%
3%
Top 10 11 to 20 21 to 30 31 to 50 Others
ICICI Securities Ltd. | Retail Equity Research
Page 20
Pfizer
Stock Performance
80110140170200230
May-14 Jul-14 Sep-14 Nov-14 Jan-15 Mar-15 May-15
CNX Pharma Pfizer
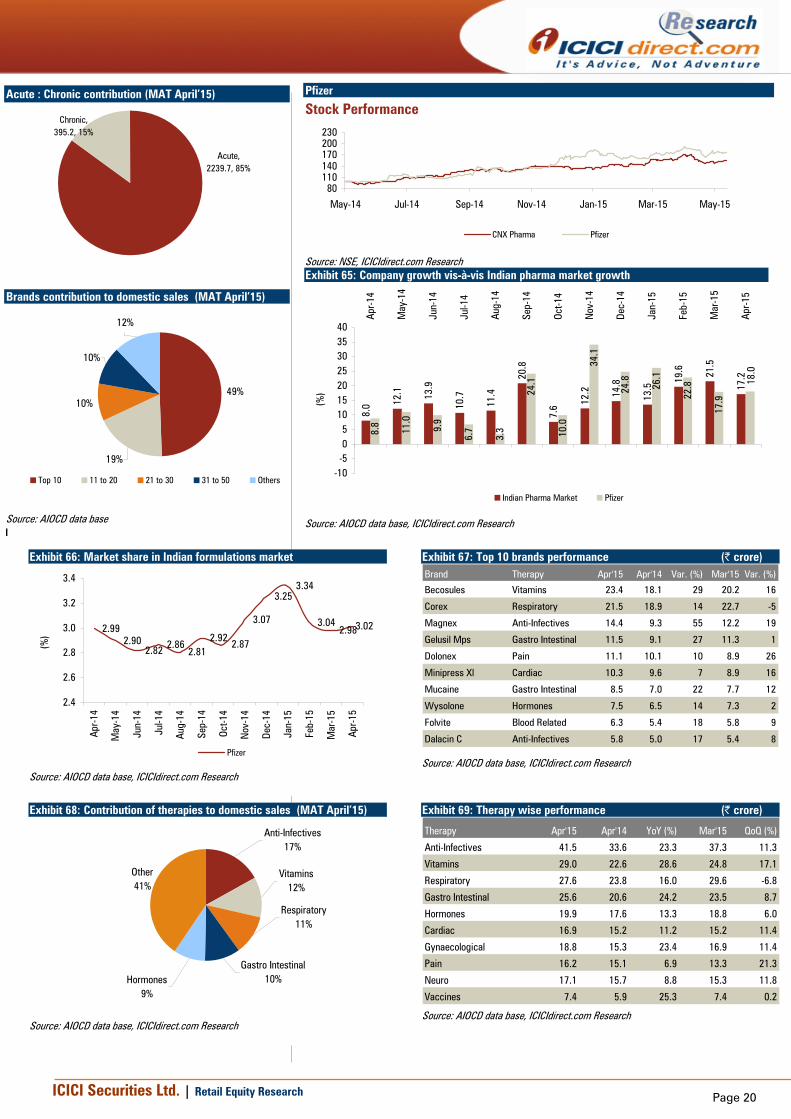
Source: NSE, ICICIdirect.com Research Exhibit 65: Company growth vis-à-vis Indian pharma market growth
8.0 12
.1 13.9
10.7
11.4
20.8
7.6 12
.2 14.8
13.5
19.6 21
.5
17.2
8.8
11.0
9.9
6.7
3.3
24.1
10.0
34.1
24.8
26.1
22.8
17.9
18.0
-10-505
10152025303540
Apr-1
4
May
-14
Jun-
14
Jul-1
4
Aug-
14
Sep-
14
Oct-1
4
Nov
-14
Dec-
14
Jan-
15
Feb-
15
Mar
-15
Apr-1
5
(%)
Indian Pharma Market Pfizer
Source: AIOCD data base, ICICIdirect.com Research
Exhibit 66: Market share in Indian formulations market
2.992.90
2.82 2.862.81
2.922.87
3.07
3.253.34
3.042.983.02
2.4
2.6
2.8
3.0
3.2
3.4
Apr-1
4
May
-14
Jun-
14
Jul-1
4
Aug-
14
Sep-
14
Oct-1
4
Nov
-14
Dec-
14
Jan-
15
Feb-
15
Mar
-15
Apr-1
5
(%)
Pfizer
Source: AIOCD data base, ICICIdirect.com Research
Exhibit 67: Top 10 brands performance (| crore) Brand Therapy Apr'15 Apr'14 Var. (%) Mar'15 Var. (%)
Becosules Vitamins 23.4 18.1 29 20.2 16
Corex Respiratory 21.5 18.9 14 22.7 -5
Magnex Anti-Infectives 14.4 9.3 55 12.2 19
Gelusil Mps Gastro Intestinal 11.5 9.1 27 11.3 1
Dolonex Pain 11.1 10.1 10 8.9 26
Minipress Xl Cardiac 10.3 9.6 7 8.9 16
Mucaine Gastro Intestinal 8.5 7.0 22 7.7 12
Wysolone Hormones 7.5 6.5 14 7.3 2
Folvite Blood Related 6.3 5.4 18 5.8 9
Dalacin C Anti-Infectives 5.8 5.0 17 5.4 8
Source: AIOCD data base, ICICIdirect.com Research
Exhibit 68: Contribution of therapies to domestic sales (MAT April’15)
Anti-Infectives17%
Vitamins 12%
Respiratory11%
Gastro Intestinal10%Hormones
9%
Other41%
Source: AIOCD data base, ICICIdirect.com Research
Exhibit 69: Therapy wise performance (| crore)
Therapy Apr'15 Apr'14 YoY (%) Mar'15 QoQ (%)
Anti-Infectives 41.5 33.6 23.3 37.3 11.3
Vitamins 29.0 22.6 28.6 24.8 17.1
Respiratory 27.6 23.8 16.0 29.6 -6.8
Gastro Intestinal 25.6 20.6 24.2 23.5 8.7
Hormones 19.9 17.6 13.3 18.8 6.0
Cardiac 16.9 15.2 11.2 15.2 11.4
Gynaecological 18.8 15.3 23.4 16.9 11.4
Pain 16.2 15.1 6.9 13.3 21.3
Neuro 17.1 15.7 8.8 15.3 11.8
Vaccines 7.4 5.9 25.3 7.4 0.2
Source: AIOCD data base, ICICIdirect.com Research
Acute : Chronic contribution (MAT April’15)
Acute, 2239.7, 85%
Chronic, 395.2, 15%
Brands contribution to domestic sales (MAT April’15)
49%
19%
10%
10%
12%
Top 10 11 to 20 21 to 30 31 to 50 Others
Source: AIOCD data base l

ICICI Securities Ltd. | Retail Equity Research
Page 21
Novartis India
Stock Performance
80
130
180
May-14 Jul-14 Sep-14 Nov-14 Jan-15 Mar-15 May-15
CNX Pharma Novartis India
Source: NSE, ICICIdirect.com Research
Exhibit 70: Company growth vis-à-vis Indian pharma market growth
8.0
12.1 13
.9
10.7
11.4
20.8
7.6
12.2 14
.8
13.5
19.6 21
.5
17.2
0.1
-0.9
-1.9
-2.4
-0.5
13.4
5.9
5.1 6.
7
2.6 5.
9
-0.1
1.1
-5
0
5
10
15
20
25
Apr-1
4
May
-14
Jun-
14
Jul-1
4
Aug-
14
Sep-
14
Oct-1
4
Nov
-14
Dec-
14
Jan-
15
Feb-
15
Mar
-15
Apr-1
5
(%)
Indian Pharma Market Novartis India
Source: AIOCD data base, ICICIdirect.com Research
Exhibit 71: Market share in Indian formulations market
1.46
1.36 1.35 1.341.30
1.34
1.42
1.32
1.381.34
1.26 1.251.25
1.11.21.21.31.31.41.41.51.5
Apr-1
4
May
-14
Jun-
14
Jul-1
4
Aug-
14
Sep-
14
Oct-1
4
Nov
-14
Dec-
14
Jan-
15
Feb-
15
Mar
-15
Apr-1
5
(%)
Novartis India
Source: AIOCD data base, ICICIdirect.com Research
Exhibit 72: Top 10 brands performance (| crore) Brand Therapy Apr'15 Apr'14 Var. (%) Mar'15 Var. (%)
Galvus Met Anti Diabetic 17.3 14.3 21 16.1 8
Voveran Pain 13.5 11.7 15 9.5 42
Rabipur (Novartis) Vaccines 8.4 8.9 -6 8.6 -3
Galvus Anti Diabetic 8.3 7.8 7 8.0 4
Otrivin Respiratory 5.5 5.0 9 5.8 -5
Tegrital Neuro 4.5 5.7 -21 4.1 9
Regestrone Gynaecological 3.2 3.5 -10 3.9 -19
Methergin Gynaecological 3.0 2.8 7 2.7 12
Genteal Ophthal 2.9 2.4 20 2.7 7
Calcium Sandoz Vitamins 2.1 2.1 2 1.5 41
Source: AIOCD data base, ICICIdirect.com Research
Exhibit 73: Contribution of therapies to domestic sales (MAT April’15)
Anti Diabetic26%
Pain 19%
Respiratory12%
Vitamins 10%
Gynaecological8%
Other25%
Source: AIOCD data base, ICICIdirect.com Research
Exhibit 74: Therapy wise performance (| crore)
Therapy Apr'15 Apr'14 YoY (%) Mar'15 QoQ (%)
Anti Diabetic 26.4 23.0 14.3 25.1 4.9
Pain 21.1 19.7 6.7 16.4 28.5
Respiratory 9.6 11.3 -14.8 10.6 -9.1
Vitamins 9.5 10.1 -6.0 8.2 15.6
Gynaecological 8.1 8.5 -4.7 8.5 -3.9
Vaccines 8.4 9.1 -7.9 8.7 -3.8
Neuro 7.3 8.7 -16.5 6.7 9.1
Anti-Infectives 4.4 4.1 7.3 3.9 15.1
Ophthal 3.3 2.9 15.7 3.1 8.3
Cardiac 1.1 1.4 -24.3 1.0 4.9
Source: AIOCD data base, ICICIdirect.com Research
Acute : Chronic contribution (MAT April’15)
Acute, 752.4, 64%
Chronic, 415.6, 36%
Brands contribution to domestic sales (MAT April’15)
65%
15%
7%
6%7%
Top 10 11 to 20 21 to 30 31 to 50 Others
Source: AIOCD data base
ICICI Securities Ltd. | Retail Equity Research
Page 22
Unichem Laboratories
Stock Performance
70100130160
May-14 Jul-14 Sep-14 Nov-14 Jan-15 Mar-15 May-15
CNX Pharma Unichem Labs
Source: NSE, ICICIdirect.com Research
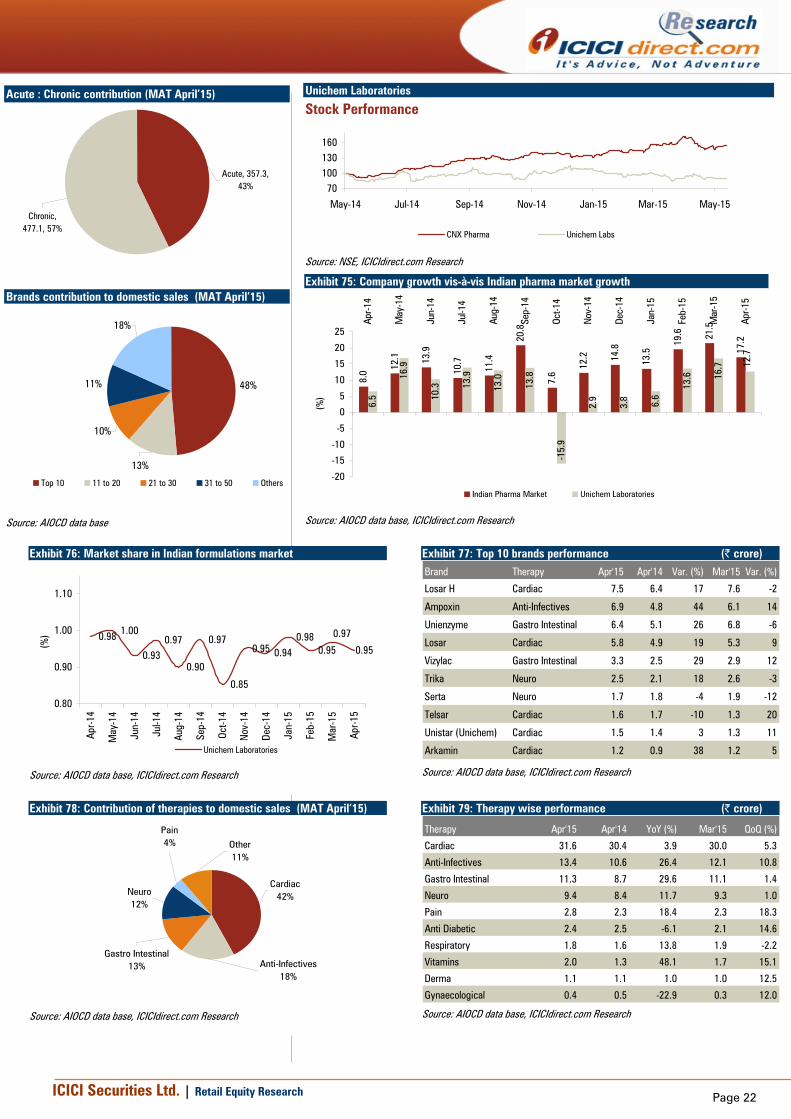
Exhibit 75: Company growth vis-à-vis Indian pharma market growth
8.0 12
.1 13.9
10.7
11.4
20.8
7.6
12.2 14
.8
13.5
19.6 21
.5
17.2
6.5
16.9
10.3 13
.9
13.0
13.8
-15.
9
2.9
3.8 6.6
13.6 16
.7 12.7
-20
-15
-10
-5
0
5
10
15
20
25
Apr-1
4
May
-14
Jun-
14
Jul-1
4
Aug-
14
Sep-
14
Oct-1
4
Nov
-14
Dec-
14
Jan-
15
Feb-
15
Mar
-15
Apr-1
5
(%)
Indian Pharma Market Unichem Laboratories
Source: AIOCD data base, ICICIdirect.com Research
Exhibit 76: Market share in Indian formulations market
0.98 1.00
0.930.97
0.90
0.97
0.85
0.95 0.940.98
0.95 0.95
0.97
0.80
0.90
1.00
1.10
Apr-1
4
May
-14
Jun-
14
Jul-1
4
Aug-
14
Sep-
14
Oct-1
4
Nov
-14
Dec-
14
Jan-
15
Feb-
15
Mar
-15
Apr-1
5
(%)
Unichem Laboratories
Source: AIOCD data base, ICICIdirect.com Research
Exhibit 77: Top 10 brands performance (| crore) Brand Therapy Apr'15 Apr'14 Var. (%) Mar'15 Var. (%)
Losar H Cardiac 7.5 6.4 17 7.6 -2
Ampoxin Anti-Infectives 6.9 4.8 44 6.1 14
Unienzyme Gastro Intestinal 6.4 5.1 26 6.8 -6
Losar Cardiac 5.8 4.9 19 5.3 9
Vizylac Gastro Intestinal 3.3 2.5 29 2.9 12
Trika Neuro 2.5 2.1 18 2.6 -3
Serta Neuro 1.7 1.8 -4 1.9 -12
Telsar Cardiac 1.6 1.7 -10 1.3 20
Unistar (Unichem) Cardiac 1.5 1.4 3 1.3 11
Arkamin Cardiac 1.2 0.9 38 1.2 5
Source: AIOCD data base, ICICIdirect.com Research
Exhibit 78: Contribution of therapies to domestic sales (MAT April’15)
Cardiac42%
Anti-Infectives18%
Gastro Intestinal13%
Neuro 12%
Pain 4% Other
11%
Source: AIOCD data base, ICICIdirect.com Research
Exhibit 79: Therapy wise performance (| crore)
Therapy Apr'15 Apr'14 YoY (%) Mar'15 QoQ (%)
Cardiac 31.6 30.4 3.9 30.0 5.3
Anti-Infectives 13.4 10.6 26.4 12.1 10.8
Gastro Intestinal 11.3 8.7 29.6 11.1 1.4
Neuro 9.4 8.4 11.7 9.3 1.0
Pain 2.8 2.3 18.4 2.3 18.3
Anti Diabetic 2.4 2.5 -6.1 2.1 14.6
Respiratory 1.8 1.6 13.8 1.9 -2.2
Vitamins 2.0 1.3 48.1 1.7 15.1
Derma 1.1 1.1 1.0 1.0 12.5
Gynaecological 0.4 0.5 -22.9 0.3 12.0
Source: AIOCD data base, ICICIdirect.com Research
Acute : Chronic contribution (MAT April’15)
Acute, 357.3, 43%
Chronic, 477.1, 57%
Brands contribution to domestic sales (MAT April’15)
48%
13%
10%
11%
18%
Top 10 11 to 20 21 to 30 31 to 50 Others
Source: AIOCD data base

ICICI Securities Ltd. | Retail Equity Research
Page 23
Indoco Remedies
Stock Performance
80
180
280
May-14 Jul-14 Sep-14 Nov-14 Jan-15 Mar-15 May-15
CNX Pharma Indoco
Source: NSE, ICICIdirect.com Research
Exhibit 80: Company growth vis-à-vis Indian pharma market growth
8.0
12.1 13
.9
10.7
11.4
20.8
7.6
12.2 14
.8
13.5
19.6 21
.5
17.2
11.7
19.0
19.0
8.5
17.5
34.4
6.1
2.8
4.8
8.6 8.9
18.9
22.0
0
5
10
15
20
25
30
35
40
Apr-1
4
May
-14
Jun-
14
Jul-1
4
Aug-
14
Sep-
14
Oct-1
4
Nov
-14
Dec-
14
Jan-
15
Feb-
15
Mar
-15
Apr-1
5
(%)
Indian Pharma Market Indoco Remedies
Source: AIOCD data base, ICICIdirect.com Research
Exhibit 81: Market share in Indian formulations market
0.8
0.70.8 0.8
0.8
0.9
0.8
0.70.7
0.70.8
0.7
0.70.70.70.80.80.80.80.80.90.9
Apr-1
4
May
-14
Jun-
14
Jul-1
4
Aug-
14
Sep-
14
Oct-1
4
Nov
-14
Dec-
14
Jan-
15
Feb-
15
Mar
-15
Apr-1
5
(%)
Indoco Remedies
Source: AIOCD data base, ICICIdirect.com Research
Exhibit 82: Top 10 brands performance (| crore) Brand Therapy Apr'15 Apr'14 Var. (%) Mar'15 Var. (%)
Febrex Plus Respiratory 5.8 5.6 3 6.2 -7
Cyclopam Gastro Intestinal 3.5 3.6 -3 3.1 16
Cital Urology 3.2 2.8 12 2.6 20
Sensodent-K Stomatologicals 3.1 3.1 0 3.2 -5
Oxipod Anti-Infectives 2.5 2.3 5 2.5 -2
Atm Anti-Infectives 2.1 1.9 10 2.3 -10
Sensodent-Kf Stomatologicals 1.8 1.4 23 1.8 -2
Cloben G Derma 1.7 1.6 5 1.3 26
Cyclopam Gastro Intestinal 1.7 1.6 4 1.5 12
Sensoform Stomatologicals 1.7 1.6 5 1.8 -8
Source: AIOCD data base, ICICIdirect.com Research
Exhibit 83: Contribution of therapies to domestic sales (MAT April’15) Respiratory
19%
Stomatologicals17%
Anti-Infectives16%
Gastro Intestinal14%
Vitamins 6%
Other28%
Source: AIOCD data base, ICICIdirect.com Research
Exhibit 84: Therapy wise performance (| crore)
Therapy Apr'15 Apr'14 YoY (%) Mar'15 QoQ (%)
Respiratory 9.1 9.3 -2.6 11.0 -17.7
Stomatologicals 9.4 8.5 9.8 9.4 -0.5
Anti-Infectives 8.4 8.3 1.3 8.8 -4.3
Gastro Intestinal 7.9 8.3 -3.8 7.1 12.0
Vitamins 3.4 2.6 29.8 3.1 7.7
Urology 3.4 3.0 12.8 2.8 19.6
Pain 2.1 2.5 -14.9 2.1 1.5
Derma 2.3 2.1 7.1 1.9 20.2
Anti Diabetic 1.9 2.2 -13.7 1.9 4.7
Ophthal 2.2 1.9 17.4 1.9 17.4
Source: AIOCD data base, ICICIdirect.com Research
Acute : Chronic contribution (MAT April’15)
Acute, 622.1, 93%
Chronic, 45.2, 7%
Brands contribution to domestic sales (MAT April’15)
48%
17%
8%
10%
17%
Top 10 11 to 20 21 to 30 31 to 50 Others
Source: AIOCD data base

ICICI Securities Ltd. | Retail Equity Research
Page 24
Ajanta Pharma
Stock Performance
50100150200250300350400
May-14 Jul-14 Sep-14 Nov-14 Jan-15 Mar-15 May-15
CNX Pharma Ajanta
Source: NSE, ICICIdirect.com Research
Exhibit 85: Company growth vis-à-vis Indian pharma market growth
8.0 12
.1 13.9
10.7
11.4
20.8
7.6
12.2 14
.8
13.5
19.6 21
.5
17.2
39.6
44.8
41.5
33.1
45.6
27.5
36.0
23.2
19.9
14.6 16.2
15.4
10.1
05
1015
2025
3035
4045
50Ap
r-14
May
-14
Jun-
14
Jul-1
4
Aug-
14
Sep-
14
Oct-1
4
Nov
-14
Dec-
14
Jan-
15
Feb-
15
Mar
-15
Apr-1
5
(%)
Indian Pharma Market Ajanta Pharma
Source: AIOCD data base, ICICIdirect.com Research
Exhibit 86: Market share in Indian formulations market
0.50 0.50 0.500.49
0.470.45
0.50
0.53
0.51 0.510.52
0.480.47
0.4
0.4
0.4
0.5
0.5
0.5
0.5
0.5
Apr-1
4
May
-14
Jun-
14
Jul-1
4
Aug-
14
Sep-
14
Oct-1
4
Nov
-14
Dec-
14
Jan-
15
Feb-
15
Mar
-15
Apr-1
5
(%)
Ajanta Pharma
Source: AIOCD data base, ICICIdirect.com Research
Exhibit 87: Top 10 brands performance (| crore) Brand Therapy Apr'15 Apr'14 Var. (%) Mar'15 Var. (%)Melacare Derma 3.7 3.8 -2.6 3.6 2.0
Met Xl Cardiac 3.2 3.8 -15.2 3.6 -12.1
Atorfit Cv Cardiac 2.8 2.3 17.8 2.4 14.0
Soft Drops Ophthal 1.1 1.0 9.1 1.0 12.6
Met Xl Am Cardiac 0.9 1.0 -15.4 1.0 -7.7
Rosufit Cv Cardiac 0.9 0.7 25.9 0.9 -5.2
Feburic Pain 0.9 0.8 7.8 0.8 6.4
Cinod Cardiac 0.7 0.4 58.8 0.7 -7.2
Melacare Plus Derma 0.6 0.7 -7.9 0.5 27.8
Peroclin Derma 0.6 0.6 3.4 0.5 32.5
Source: AIOCD data base, ICICIdirect.com Research
Exhibit 88: Contribution of therapies to domestic sales (MAT April’15)
Cardiac33%
Derma24%
Ophthal22%
Vitamins 6%
Pain 5%
Others10%
Source: AIOCD data base, ICICIdirect.com Research
Exhibit 89: Therapy wise performance (| crore)
Therapy Apr'15 Apr'14 YoY (%) Mar'15 QoQ (%)
Cardiac 11.6 10.5 10.0 11.8 -2.1
Derma 9.0 9.1 -0.6 8.4 7.3
Ophthal 8.8 7.7 14.3 8.2 8.1
Vitamins 2.3 1.9 22.0 2.1 6.9
Pain 1.8 1.4 29.4 1.7 8.6
Gastro Intestinal 1.4 1.2 22.6 1.0 39.2
Neuro 0.8 0.8 -4.3 0.8 6.4
Ophthal 0.6 0.5 5.7 0.5 12.4
Respiratory 0.3 0.5 -39.1 0.4 -22.3
Anti-Infectives 0.4 0.2 126.8 0.3 45.6
Source: AIOCD data base, ICICIdirect.com Research
Acute : Chronic contribution (MAT April’15)
Acute, 223.1, 51%
Chronic, 210.9, 49%
Brands contribution to domestic sales (MAT April’15)
43%
14%9%
13%
21%
Top 10 11 to 20 21 to 30 31 to 50 Others
Source: AIOCD data base

ICICI Securities Ltd. | Retail Equity Research
Page 25
Exhibit 90: One year forward P/E of CNX Pharma vs. Nifty
0
5
10
15
20
25
30
35
Mar
-06
Oct-0
6
May
-07
Dec-
07
Jul-0
8
Feb-
09
Sep-
09
Apr-1
0
Nov
-10
Jun-
11
Jan-
12
Aug-
12
Mar
-13
Oct-1
3
May
-14
Dec-
14
x
CNX Pharma Sensex
83.9% Premium
[
Source: Company, ICICIdirect.com Research
Exhibit 91: Two year forward P/E of CNX Pharma Index vs. Nifty
0
5
10
15
20
25
30
Mar
-07
Aug-
07
Jan-
08
Jun-
08
Nov
-08
Apr-0
9
Sep-
09
Feb-
10
Jul-1
0
Dec-
10
May
-11
Oct-1
1
Mar
-12
Aug-
12
Jan-
13
Jun-
13
Nov
-13
Apr-1
4
Sep-
14
Feb-
15
x
CNX Pharma Sensex
69.2% Premium
Source: Company, ICICIdirect.com Research
ICICIdirect.com coverage universe (Healthcare) I-Direct CMP TP Rating M CapCode (|) (|) (| Cr) FY14 FY15E FY16E FY14 FY15E FY16E FY14 FY15E FY16E FY14 FY15E FY16E FY14 FY15E FY16E
Ajanta Pharma AJAPHA 1372 1488 BUY 12071.6 26.5 38.3 45.6 51.8 35.8 30.1 32.8 23.7 20.0 44.9 40.6 38.1 39.4 32.8 28.9
Apollo Hospitals APOHOS 1297 1455 BUY 18034.4 22.8 26.8 36.8 57.0 48.4 35.2 28.2 25.0 17.7 11.6 12.0 15.5 10.6 11.5 14.2
Aurobindo Pharma AURPHA 1359 1303 BUY 39666.0 47.3 57.4 70.5 28.7 23.7 19.3 20.3 16.7 13.6 24.1 23.4 24.4 31.3 31.6 28.6
Biocon BIOCON 446 447 HOLD 8923.4 20.7 20.1 22.5 35.1 29.2 32.4 21.2 21.1 18.0 12.2 10.7 11.7 13.7 15.2 12.4
Cadila Healthcare CADHEA 1752 1913 BUY 35864.6 39.2 56.2 75.4 44.6 31.2 23.2 31.6 21.5 16.5 15.9 21.3 24.7 23.4 26.4 27.4
Cipla CIPLA 674 648 HOLD 54132.0 17.3 15.9 21.7 39.0 42.3 31.0 25.7 23.3 18.7 15.5 14.2 17.6 13.8 11.3 14.2
Dr Reddy's Labs DRREDD 3619 3949 BUY 61646.5 126.7 123.6 150.9 28.6 29.3 24.0 18.6 17.7 15.2 19.2 18.1 20.2 23.7 19.3 19.6
Glenmark Pharma GLEPHA 896 824 HOLD 25266.9 20.0 21.5 34.0 44.8 41.7 26.4 21.2 22.8 15.2 16.0 17.1 23.5 18.3 17.4 22.8
Indoco Remedies INDREM 366 375 BUY 3374.5 6.3 9.5 13.3 58.3 38.6 27.5 28.5 19.4 15.0 16.6 21.8 28.1 12.6 16.4 19.4
Ipca Laboratories IPCLAB 666 622 HOLD 8405.0 37.9 25.6 31.8 17.6 26.0 20.9 11.0 14.5 14.0 27.6 16.1 17.8 24.4 14.7 16.0
Jubilant Life Sciences VAMORG 171 168 HOLD 2726.1 6.8 -6.5 20.0 25.0 -26.4 8.6 6.6 11.9 5.8 10.1 5.7 8.2 4.2 -2.4 6.6
Lupin LUPIN 1709 1899 BUY 76859.0 41.0 53.6 61.1 41.7 31.9 28.0 26.2 20.6 18.3 31.8 31.1 29.9 24.3 25.3 23.4
Natco Pharma NATPHA 2295 1354 HOLD 7625.2 30.3 32.5 44.9 65.7 61.3 44.3 43.8 36.4 29.4 15.3 16.7 18.7 14.1 13.5 16.1
Sun Pharma SUNPHA 981 1036 BUY 236062.0 29.0 34.8 39.9 33.8 28.2 24.6 24.3 23.7 20.3 32.4 31.2 28.8 27.0 25.3 23.1
Torrent Pharma TORPHA 1246 1450 BUY 21074.0 39.2 47.2 50.4 31.8 26.4 24.7 22.3 19.8 15.9 28.5 21.4 26.7 34.9 32.4 28.0
Unichem Laboratories UNILAB 199 214 HOLD 1806.2 18.7 7.2 14.1 10.7 27.5 14.1 10.0 17.0 10.3 15.7 7.2 13.5 20.7 7.5 13.9
RoNW (%)Company
EPS (|) PE(x) EV/EBITDA (x) RoCE (%)
ICICI Securities Ltd. | Retail Equity Research
Page 26
RATING RATIONALE ICICIdirect.com endeavours to provide objective opinions and recommendations. ICICIdirect.com assigns ratings to its stocks according to their notional target price vs. current market price and then categorises them as Strong Buy, Buy, Add, Reduce and Sell. The performance horizon is two years unless specified and the notional target price is defined as the analysts' valuation for a stock. Sector view: Over weight compared to index Equal weight compared to index Under weight compared to index Index here refers to BSE 500
Pankaj Pandey Head – Research [email protected]
ICICIdirect.com Research Desk, ICICI Securities Limited, 1st Floor, Akruti Trade Centre, Road No. 7, MIDC, Andheri (East) Mumbai – 400 093

ICICI Securities Ltd. | Retail Equity Research
Page 27
ANALYST CERTIFICATION We /I, Siddhant Khandekar CA-INTER Mitesh Shah MS (Finance) Nandan Kamat MBA Finance, Research Analysts, authors and the names subscribed to this report, hereby certify that all of the views expressed in this research report accurately reflect our views about the subject issuer(s) or securities. We also certify that no part of our compensation was, is, or will be directly or indirectly related to the specific recommendation(s) or view(s) in this report.
Terms & conditions and other disclosures: ICICI Securities Limited (ICICI Securities) is a full-service, integrated investment banking and is, inter alia, engaged in the business of stock brokering and distribution of financial products. ICICI Securities is a wholly-owned subsidiary of ICICI Bank which is India’s largest private sector bank and has its various subsidiaries engaged in businesses of housing finance, asset management, life insurance, general insurance, venture capital fund management, etc. (“associates”), the details in respect of which are available on www.icicibank.com. ICICI Securities is one of the leading merchant bankers/ underwriters of securities and participate in virtually all securities trading markets in India. We and our associates might have investment banking and other business relationship with a significant percentage of companies covered by our Investment Research Department. ICICI Securities generally prohibits its analysts, persons reporting to analysts and their relatives from maintaining a financial interest in the securities or derivatives of any companies that the analysts cover. The information and opinions in this report have been prepared by ICICI Securities and are subject to change without any notice. The report and information contained herein is strictly confidential and meant solely for the selected recipient and may not be altered in any way, transmitted to, copied or distributed, in part or in whole, to any other person or to the media or reproduced in any form, without prior written consent of ICICI Securities. While we would endeavour to update the information herein on a reasonable basis, ICICI Securitiesis is under no obligation to update or keep the information current. Also, there may be regulatory, compliance or other reasons that may prevent ICICI Securities from doing so. Non-rated securities indicate that rating on a particular security has been suspended temporarily and such suspension is in compliance with applicable regulations and/or ICICI Securities policies, in circumstances where ICICI Securities might be acting in an advisory capacity to this company, or in certain other circumstances. This report is based on information obtained from public sources and sources believed to be reliable, but no independent verification has been made nor is its accuracy or completeness guaranteed. This report and information herein is solely for informational purpose and shall not be used or considered as an offer document or solicitation of offer to buy or sell or subscribe for securities or other financial instruments. Though disseminated to all the customers simultaneously, not all customers may receive this report at the same time. ICICI Securities will not treat recipients as customers by virtue of their receiving this report. Nothing in this report constitutes investment, legal, accounting and tax advice or a representation that any investment or strategy is suitable or appropriate to your specific circumstances. The securities discussed and opinions expressed in this report may not be suitable for all investors, who must make their own investment decisions, based on their own investment objectives, financial positions and needs of specific recipient. This may not be taken in substitution for the exercise of independent judgment by any recipient. The recipient should independently evaluate the investment risks. The value and return on investment may vary because of changes in interest rates, foreign exchange rates or any other reason. ICICI Securities accepts no liabilities whatsoever for any loss or damage of any kind arising out of the use of this report. Past performance is not necessarily a guide to future performance. Investors are advised to see Risk Disclosure Document to understand the risks associated before investing in the securities markets. Actual results may differ materially from those set forth in projections. Forward-looking statements are not predictions and may be subject to change without notice. ICICI Securities or its associates might have managed or co-managed public offering of securities for the subject company or might have been mandated by the subject company for any other assignment in the past twelve months. ICICI Securities or its associates might have received any compensation from the companies mentioned in the report during the period preceding twelve months from the date of this report for services in respect of managing or co-managing public offerings, corporate finance, investment banking or merchant banking, brokerage services or other advisory service in a merger or specific transaction. ICICI Securities or its associates might have received any compensation for products or services other than investment banking or merchant banking or brokerage services from the companies mentioned in the report in the past twelve months. ICICI Securities encourages independence in research report preparation and strives to minimize conflict in preparation of research report. ICICI Securities or its analysts did not receive any compensation or other benefits from the companies mentioned in the report or third party in connection with preparation of the research report. Accordingly, neither ICICI Securities nor Research Analysts have any material conflict of interest at the time of publication of this report. It is confirmed that Siddhant Khandekar CA-INTER Mitesh Shah MS (Finance) Nandan Kamat MBA Finance, Research Analysts of this report have not received any compensation from the companies mentioned in the report in the preceding twelve months. Compensation of our Research Analysts is not based on any specific merchant banking, investment banking or brokerage service transactions. ICICI Securities or its subsidiaries collectively or Research Analysts do not own 1% or more of the equity securities of the Company mentioned in the report as of the last day of the month preceding the publication of the research report. Since associates of ICICI Securities are engaged in various financial service businesses, they might have financial interests or beneficial ownership in various companies including the subject company/companies mentioned in this report. It is confirmed that Siddhant Khandekar CA-INTER Mitesh Shah MS (Finance) Nandan Kamat MBA Finance, Research Analysts do not serve as an officer, director or employee of the companies mentioned in the report. ICICI Securities may have issued other reports that are inconsistent with and reach different conclusion from the information presented in this report. Neither the Research Analysts nor ICICI Securities have been engaged in market making activity for the companies mentioned in the report. We submit that no material disciplinary action has been taken on ICICI Securities by any Regulatory Authority impacting Equity Research Analysis activities. This report is not directed or intended for distribution to, or use by, any person or entity who is a citizen or resident of or located in any locality, state, country or other jurisdiction, where such distribution, publication, availability or use would be contrary to law, regulation or which would subject ICICI Securities and affiliates to any registration or licensing requirement within such jurisdiction. The securities described herein may or may not be eligible for sale in all jurisdictions or to certain category of investors. Persons in whose possession this document may come are required to inform themselves of and to observe such restriction.