Embed Size (px)
Citation preview

Q4 and Year End 2013 Financial
Results March 14, 2014
Michael Ansley President, CEO & Board Chairman
David G. Burke Chief Financial Officer & Treasurer
© 2014 by Diversified Restaurant Holdings, Inc.

© 2014 by Diversified Restaurant Holdings, Inc. 2
Safe Harbor Statement
The information made available in this presentation contains forward-looking statements which reflect the Company’s current view of future events, results of operations, cash flows, performance, business prospects and opportunities. Wherever used, the words "anticipate," "believe," "expect," "intend," "plan," "project," "will continue," "will likely result," "may," and similar expressions identify forward-looking statements as such term is defined in the Securities Exchange Act of 1934. Any such forward-looking statements are subject to risks and uncertainties and the Company's actual growth, results of operations, financial condition, cash flows, performance, business prospects and opportunities could differ materially from historical results or current expectations. Some of these risks include, without limitation, the impact of economic and industry conditions, competition, food and drug safety issues, store expansion and remodeling, labor relations issues, costs of providing employee benefits, regulatory matters, legal and administrative proceedings, information technology, security, severe weather, natural disasters, accounting matters, other risk factors relating to our business or industry and other risks detailed from time to time in the Securities and Exchange Commission filings of DRH. Forward-looking statements contained herein speak only as of the date made and, thus, DRH undertakes no obligation to update or publicly announce the revision of any of the forward-looking statements contained herein to reflect new information, future events, developments or changed circumstances or for any other reason.

NASDAQ: BAGR
© 2014 by Diversified Restaurant Holdings, Inc. 3
Executing our Growth Strategy
$26.1
$28.5
Q4 2012 Q4 2013
Quarterly Revenue ($ in millions)
Q4 2013 revenue up $2.4 mm, or 9.0%
Consolidated comparable store growth of 1.1% in Q4 2013 Comparable with exceptionally strong 9.2%, same
period last year
Two years comparable sales growth of 10.3%
Opened 10 restaurants in 2013 Seven Bagger Dave’s
Three Buffalo Wild Wings and one relocation
$77.4
$108.9
2012 2013
Year End Revenue
NASDAQ: BAGR
© 2014 by Diversified Restaurant Holdings, Inc. 4
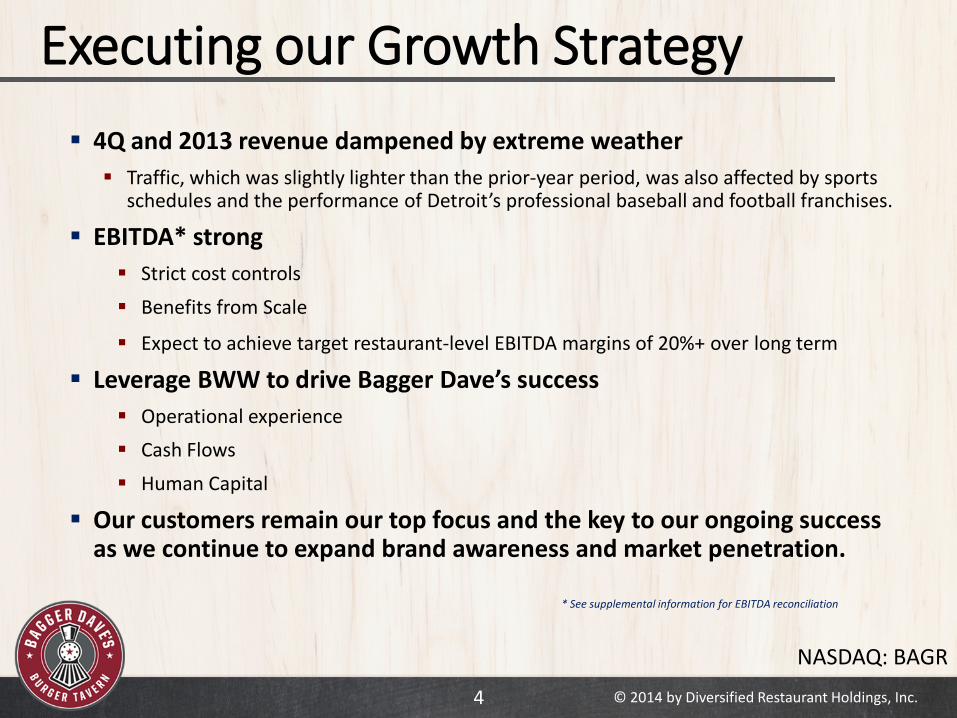
Executing our Growth Strategy 4Q and 2013 revenue dampened by extreme weather Traffic, which was slightly lighter than the prior-year period, was also affected by sports
schedules and the performance of Detroit’s professional baseball and football franchises.
EBITDA* strong Strict cost controls
Benefits from Scale
Expect to achieve target restaurant-level EBITDA margins of 20%+ over long term
Leverage BWW to drive Bagger Dave’s success Operational experience Cash Flows
Human Capital
Our customers remain our top focus and the key to our ongoing success as we continue to expand brand awareness and market penetration.
* See supplemental information for EBITDA reconciliation

NASDAQ: BAGR
© 2014 by Diversified Restaurant Holdings, Inc. 5
Restaurant Operating Costs
$8.2 $8.2
Q4 2012 Q4 2013
$6.6
$7.2
Q4 2012 Q4 2013
Improved 200 basis points primarily due to lower wing costs
Increased staffing consistent with new restaurant locations
Expect to improve as a percentage of revenue over time as we continue to grow
Food, Beverage and Packaging Compensation
31.4% 29.4% 25.3% 25.3%
($ in millions, % of revenue)

NASDAQ: BAGR
© 2014 by Diversified Restaurant Holdings, Inc. 6
Operating Expenses
General & Administrative Pre-Opening Costs
($ in millions, % of revenue)
$2.3 $2.2
Q4 2012 Q4 2013
$1.2 $1.2
Q4 2012 Q4 2013 80 basis point improvement from cost
control and operating leverage
Expect improvement to continue as number of units grow
Average expected to be $200,000 -$250,000 per restaurant going forward
8.8% 7.7%

NASDAQ: BAGR
© 2014 by Diversified Restaurant Holdings, Inc. 7
Adjusted EBITDA & Margin* Adjusted EBITDA Restaurant-Level EBITDA
($ in millions, % of revenue)
$5.0
$14.6
$5.7
$20.2
Fourth quarter increased 25.8% to $3.4 million
Margin improved 160 basis points to 12.1%
Increased 62.7% 2013 over 2012
Fourth quarter increased 13.2% over Q4 2012
Increased 38.2% 2013 over 2012
* See supplemental information for EBITDA reconciliation
19.1% 19.9% 18.8% 18.5%
$2.7
$8.0
$3.4
$13.0
10.5% 12.1% 10.3% 12.0%
Q4 12 Q4 13 2012 2013 Q4 12 Q4 13 2012 2013

NASDAQ: BAGR
© 2014 by Diversified Restaurant Holdings, Inc. 8
Flexibility for Growth ($ in millions)
$2.7
$18.2
12/30/2012 12/29/2013
Cash, Cash Equivalents and Investments
$15.7 $25.3
12/30/12 12/29/13
Capital Expenditures
Cash balance reflects April 2013 follow-on offering
CapEx focused on new restaurant development, re-freshenings and technology
Total Debt to Equity was 1.4x at year-end 2013 compared with 30.0x at year-end 2012

NASDAQ: BAGR
© 2014 by Diversified Restaurant Holdings, Inc. 9
2014 Outlook
Fiscal 2014 Guidance* Revenue $125.0 million to $130.0 million
Restaurant-Level EBITDA $22.0 million to $23.5 million
Adjusted EBITDA $13.5 million to $14.5 million
Capital Expenditures $33.0 million to $36.0 million
* Guidance provided on 3/14/2014

NASDAQ: BAGR
© 2014 by Diversified Restaurant Holdings, Inc. 10
How is Bagger Dave’s Different?

© 2014 by Diversified Restaurant Holdings, Inc. 11
Prime Rib Message

© 2014 by Diversified Restaurant Holdings, Inc. 12
Fry Message
© 2014 by Diversified Restaurant Holdings, Inc. 13
Beef Burger Message

© 2014 by Diversified Restaurant Holdings, Inc. 14
Turkey Burger Billboard

NASDAQ: BAGR
© 2014 by Diversified Restaurant Holdings, Inc. 15
New Menu Design & Offerings New Grilled Chicken Offering
7oz marinated farm-raised breast
New protein for sandwiches
All-New Chopped Salads
Salad entrees with chicken
Greatly enhanced presentation/size
New Spicy Artichoke Dip Appetizer
Jalapeno and smoked gouda blend
Used on No Joke Artichoke Burger
At Bagger Dave’s, our guests have the option to completely customize their dining experience through Create Your Own
table-side sheets and al-la-carte menu offerings

NASDAQ: BAGR
© 2014 by Diversified Restaurant Holdings, Inc. 16
Bagger Dave’s Craft Soda
Premium Craft Soda sold on draft Eight favors available Includes mystery rotator flavor
Launching retail sales in bottles In-store only; brings customers in
Ability to add proprietary flavors Unique differentiator Flexibility to add / promote new flavors Exceedingly better margins than Coca-Cola
or Pepsi 50-year supply agreement

NASDAQ: BAGR
© 2014 by Diversified Restaurant Holdings, Inc. 17
Technology Bagger Dave’s invests in technology to improve guest experience and
productivity – driving sales and increasing margins.
Allows servers to spend more time with guests Increases order
accuracy Improves ticket
times
Tableside Ordering
Online ordering allows guests to order from their computer or mobile device – anytime, anywhere Integrated with
POS www.baggerdaves.com
Online Ordering
Guests can pay using their phone Credit card never
has to leave guest’s wallet Fully integrated
with POS
Mobile Payment
Integrated with POS Fully integrated
with online ordering Critical to allowing
customization options Working with
NCR to further advance this technology for BD
Kitchen Display Units
Host manages seating with iPad Guest receives
text when table is ready
Table Management

NASDAQ: BAGR
© 2014 by Diversified Restaurant Holdings, Inc. 18
Fresh Rewards Loyalty Program
Bagger Dave’s new Fresh Rewards Loyalty Program has gone mobile!
Phase I - Live today Mobile Payment
Guest Comment
Guest Survey
Social Media Integration:
Facebook Like/Share
Twitter Tweets
Four Square Check-In
Instant Win Game
Phase II – Q3/Q4 2014 POS Integration
CRM – Targeted Offers
Tiered Rewards
Interactive Gaming
Newly-developed apps for iOS and Android platforms will enhance the success of this program.
www.baggerdaves.com/freshrewards

Q4 and Year End 2013 Financial
Results March 14, 2014
© 2014 by Diversified Restaurant Holdings, Inc. 19

Supplemental Information
© 2014 by Diversified Restaurant Holdings, Inc.

NASDAQ: BAGR
© 2014 by Diversified Restaurant Holdings, Inc.
EBITDA Reconciliation
* See slide 23 for footnotes and references regarding EBITDA
For the quarter ended, Dec. 30, 2012 Dec. 29, 2013
Net loss attributable to DRH $(623,008) $(177,539)
+ Income Tax Provision (Benefit) (333,554) (313,637)
+ Change in Fair Value of Derivative Instruments - -
+ Interest Expense 439,428 377,024
+ Other Income (Expense), net 342,079 (92,294)
+ Loss on Disposal of Property and Equipment 6,856 14,451
+ Depreciation and Amortization 1,656,704 2,434,607
+ (Loss) Income attributable to noncontrolling interest - -
EBITDA $1,488,505 $2,242.612
+ Pre-opening Expense 1,244,292 1,194,100
+ Non recurring Expense - -
Adjusted EBITDA $2,732,797 $3,436,712
Adjusted EBITDA Margin (%) 10.5% 12.1%
+ Adjusted General and Administrative 2,257,353 2,234,582
Restaurant-Level EBITDA $4,990,150 $5,671,294
Restaurant-Level EBITDA Margin (%) 19.1% 19.9%
21

NASDAQ: BAGR
© 2014 by Diversified Restaurant Holdings, Inc.
EBITDA Reconciliation
* See next slide for footnotes and references regarding EBITDA
For the fiscal year ended, 2012 2013
Net Income attributable to DRH $180,099 $134,308
+ Income Tax Provision (Benefit) (167) (261,450)
+ Change in Fair Value of Derivative Instruments 43,361 -
+ Interest Expense 1,282,991 1,718,711
+ Other Income (Expense), net (20,081) (151,292)
+ Loss on Disposal of Property and Equipment 36,833 98,162
+ Depreciation and Amortization 4,587,310 7,974,481
+ (Loss) Income attributable to noncontrolling interest 95,040 -
EBITDA $6,205,386 $9,512,920
+ Pre-opening Expense 1,792,168 3,230,122
+ Non recurring Expense - 271,000
Adjusted EBITDA $7,997,554 $13,014,042
Adjusted EBITDA Margin (%) 10.3% 12.0%
+ Adjusted General and Administrative 6,585,908 7,139,597
Restaurant-Level EBITDA $14,583,462 $20,153,639
Restaurant-Level EBITDA Margin (%) 18.8% 18.5%
22

NASDAQ: BAGR
© 2014 by Diversified Restaurant Holdings, Inc.
EBITDA Reconciliation Restaurant-Level EBITDA represents net income plus the sum of non-restaurant specific general and administrative expenses, restaurant pre-opening costs, loss on property and equipment disposals, the change in fair value of derivative instruments, depreciation and amortization, other income and expenses, interest, taxes and non-recurring acquisition related costs expenses. Adjusted EBITDA represents net income plus the sum of restaurant pre-opening costs, loss on property and equipment disposals, the change in fair value of derivative instruments, depreciation and amortization, other income and expenses, interest, taxes and non-recurring acquisition related costs expenses. We are presenting Restaurant-Level EBITDA and Adjusted EBITDA, which are not prepared in accordance with GAAP, because we believe that they provide an additional metric by which to evaluate our operations and, when considered together with our GAAP results and the reconciliation to our net income, we believe they provide a more complete understanding of our business than could be obtained absent this disclosure. We use Restaurant-Level EBITDA and Adjusted EBITDA, together with financial measures prepared in accordance with GAAP, such as revenue, income from operations, net income and cash flows from operations, to assess our historical and prospective operating performance and to enhance our understanding of our core operating performance. Restaurant-Level EBITDA and Adjusted EBITDA are presented because: (i) we believe they are useful measures for investors to assess the operating performance of our business without the effect of non-cash depreciation and amortization expenses; (ii) we believe that investors will find these measures useful in assessing our ability to service or incur indebtedness; and (iii) we use Restaurant-Level EBITDA and Adjusted EBITDA internally as benchmarks to evaluate our operating performance or compare our performance to that of our competitors. Additionally, we present Restaurant-Level EBITDA because it excludes the impact of general and administrative expenses, which are not incurred at the restaurant level, and restaurant pre-opening costs, which are non-recurring at the restaurant level. The use of Restaurant-Level EBITDA thereby enables us and our investors to compare our operating performance between periods and to compare our operating performance to the performance of our competitors. The measure is also widely used within the restaurant industry to evaluate restaurant level productivity, efficiency and performance. The use of Restaurant-Level EBITDA and Adjusted EBITDA as performance measures permits a comparative assessment of our operating performance relative to our performance based on our GAAP results, while isolating the effects of some items that vary from period to period without any correlation to core operating performance or that vary widely among similar companies. Companies within our industry exhibit significant variations with respect to capital structures and cost of capital (which affect interest expense and tax rates) and differences in book depreciation of facilities and equipment (which affect relative depreciation expense), including significant differences in the depreciable lives of similar assets among various companies. Our management believes that Restaurant-Level EBITDA and Adjusted EBITDA facilitate company-to-company comparisons within our industry by eliminating some of the foregoing variations. Restaurant-Level EBITDA and Adjusted EBITDA are not determined in accordance with GAAP and should not be considered in isolation or as an alternative to net income, income from operations, net cash provided by operating, investing or financing activities or other financial statement data presented as indicators of financial performance or liquidity, each as presented in accordance with GAAP. Neither Restaurant-Level EBITDA nor Adjusted EBITDA should be considered as a measure of discretionary cash available to us to invest in the growth of our business. Restaurant-Level EBITDA and Adjusted EBITDA as presented may not be comparable to other similarly titled measures of other companies and our presentation of Restaurant-Level EBITDA and Adjusted EBITDA should not be construed as an inference that our future results will be unaffected by unusual items. Our management recognizes that Restaurant-Level EBITDA and Adjusted EBITDA have limitations as analytical financial measures, including the following: • Restaurant-Level EBITDA and Adjusted EBITDA do not reflect our current capital expenditures or future requirements for capital expenditures; • Restaurant-Level EBITDA and Adjusted EBITDA do not reflect the interest expense, or the cash requirements necessary to service interest or principal payments, associated with our
indebtedness; • Restaurant-Level EBITDA and Adjusted EBITDA do not reflect depreciation and amortization, which are non-cash charges, although the assets being depreciated and amortized will likely
have to be replaced in the future, nor do Restaurant-Level EBITDA and Adjusted EBITDA reflect any cash requirements for such replacements; • Restaurant-Level EBITDA and Adjusted EBITDA do not reflect changes in, or cash requirements for, our working capital needs; • Restaurant-Level EBITDA and Adjusted EBITDA do not reflect disposals or other non-recurring income and expenses; • Restaurant-Level EBITDA and Adjusted EBITDA do not reflect changes in fair value of derivative instruments; • Restaurant-Level EBITDA and Adjusted EBITDA do not reflect restaurant pre-opening costs; and • Restaurant-Level EBITDA does not reflect general and administrative expenses. Adjusted EBITDA margin and Restaurant-Level EBITDA margin is defined as the ratio of Adjusted EBITDA and Restaurant-Level EBITDA to revenue. We present Adjusted EBITDA margin and Restaurant-Level EBITDA margin because it is used by management as a performance measurement to judge the level of Adjusted EBITDA and Restaurant-Level EBITDA generated from revenue and we believe its inclusion is appropriate to provide additional information to investors.
23