Embed Size (px)
Citation preview
› March 7, 2017
Q4 and Full Year 2016 Results
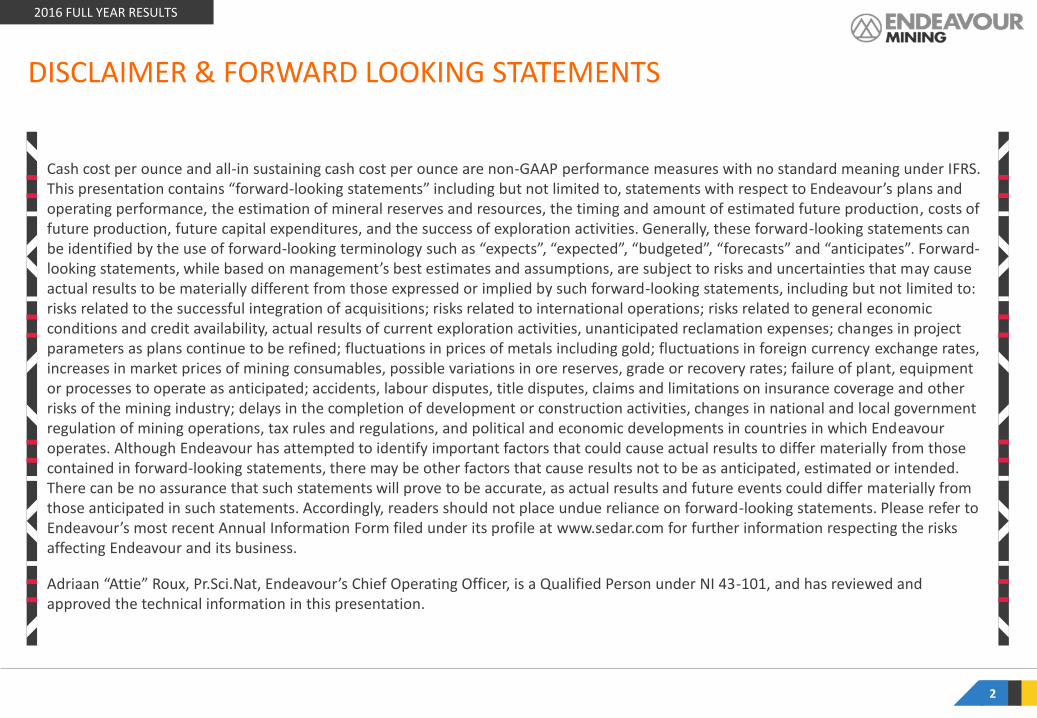
Cash cost per ounce and all-in sustaining cash cost per ounce are non-GAAP performance measures with no standard meaning under IFRS. This presentation contains “forward-looking statements” including but not limited to, statements with respect to Endeavour’s plans and operating performance, the estimation of mineral reserves and resources, the timing and amount of estimated future production, costs of future production, future capital expenditures, and the success of exploration activities. Generally, these forward-looking statements can be identified by the use of forward-looking terminology such as “expects”, “expected”, “budgeted”, “forecasts” and “anticipates”. Forward-looking statements, while based on management’s best estimates and assumptions, are subject to risks and uncertainties that may cause actual results to be materially different from those expressed or implied by such forward-looking statements, including but not limited to: risks related to the successful integration of acquisitions; risks related to international operations; risks related to general economic conditions and credit availability, actual results of current exploration activities, unanticipated reclamation expenses; changes in project parameters as plans continue to be refined; fluctuations in prices of metals including gold; fluctuations in foreign currency exchange rates, increases in market prices of mining consumables, possible variations in ore reserves, grade or recovery rates; failure of plant, equipment or processes to operate as anticipated; accidents, labour disputes, title disputes, claims and limitations on insurance coverage and other risks of the mining industry; delays in the completion of development or construction activities, changes in national and local government regulation of mining operations, tax rules and regulations, and political and economic developments in countries in which Endeavour operates. Although Endeavour has attempted to identify important factors that could cause actual results to differ materially from those contained in forward-looking statements, there may be other factors that cause results not to be as anticipated, estimated or intended. There can be no assurance that such statements will prove to be accurate, as actual results and future events could differ materially from those anticipated in such statements. Accordingly, readers should not place undue reliance on forward-looking statements. Please refer to Endeavour’s most recent Annual Information Form filed under its profile at www.sedar.com for further information respecting the risks affecting Endeavour and its business.
Adriaan “Attie” Roux, Pr.Sci.Nat, Endeavour’s Chief Operating Officer, is a Qualified Person under NI 43-101, and has reviewed and approved the technical information in this presentation.
DISCLAIMER & FORWARD LOOKING STATEMENTS
2016 FULL YEAR RESULTS
2
Note : All amonts are in US$ and may differ from MD&A due to rounding
SÉBASTIEN DE MONTESSUS
Chief Executive Officer,
President & Director
ADRIAAN "ATTIE" ROUX
Chief Operating Officer
VINCENT BENOIT
EVP – CFO
and Corporate Development
PATRICK BOUISSET
EVP – Exploration and Growth
SPEAKERS TABLE OF CONTENT
OPERATIONAL AND FINANCIAL SUMMARY 1
CONCLUSION 3
DETAILS BY MINE AND PROJECT 2
APPENDIX 4
JEREMY LANGFORD
EVP – Construction Services
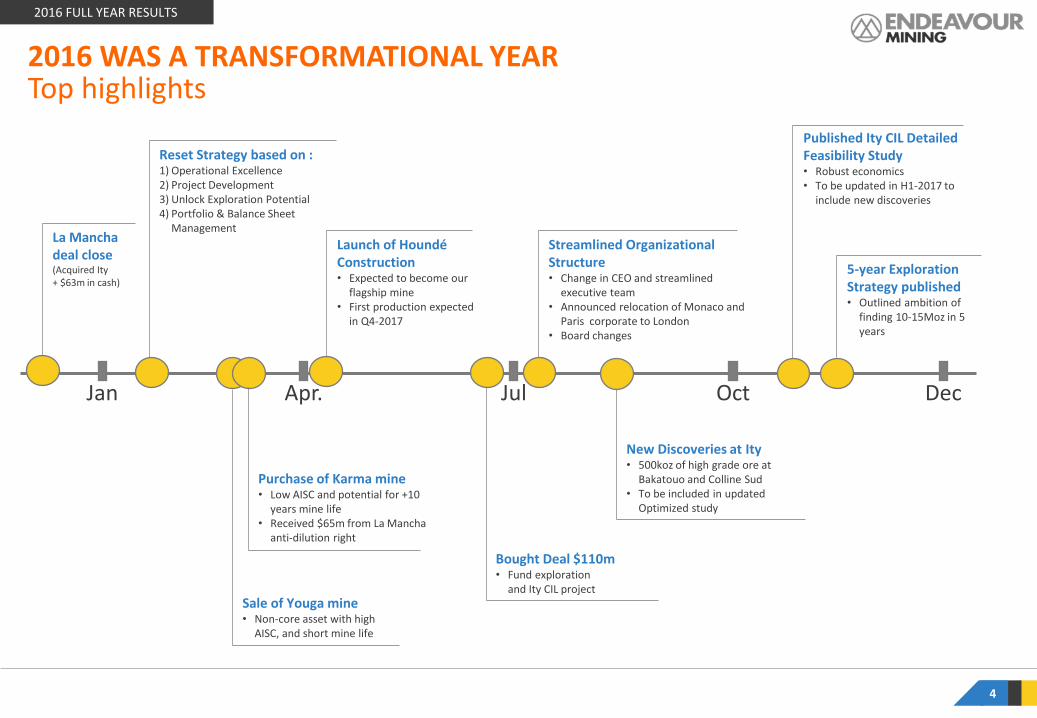
2016 WAS A TRANSFORMATIONAL YEAR Top highlights
4
2016 FULL YEAR RESULTS
Jan Apr. Jul Dec Oct
La Mancha deal close (Acquired Ity + $63m in cash)
Reset Strategy based on : 1) Operational Excellence 2) Project Development 3) Unlock Exploration Potential 4) Portfolio & Balance Sheet
Management
Sale of Youga mine • Non-core asset with high
AISC, and short mine life
Purchase of Karma mine • Low AISC and potential for +10
years mine life • Received $65m from La Mancha
anti-dilution right
Launch of Houndé Construction • Expected to become our
flagship mine • First production expected
in Q4-2017
New Discoveries at Ity • 500koz of high grade ore at
Bakatouo and Colline Sud • To be included in updated
Optimized study
Bought Deal $110m • Fund exploration
and Ity CIL project
5-year Exploration Strategy published • Outlined ambition of
finding 10-15Moz in 5 years
Published Ity CIL Detailed Feasibility Study • Robust economics • To be updated in H1-2017 to
include new discoveries
Streamlined Organizational Structure • Change in CEO and streamlined
executive team • Announced relocation of Monaco and
Paris corporate to London • Board changes
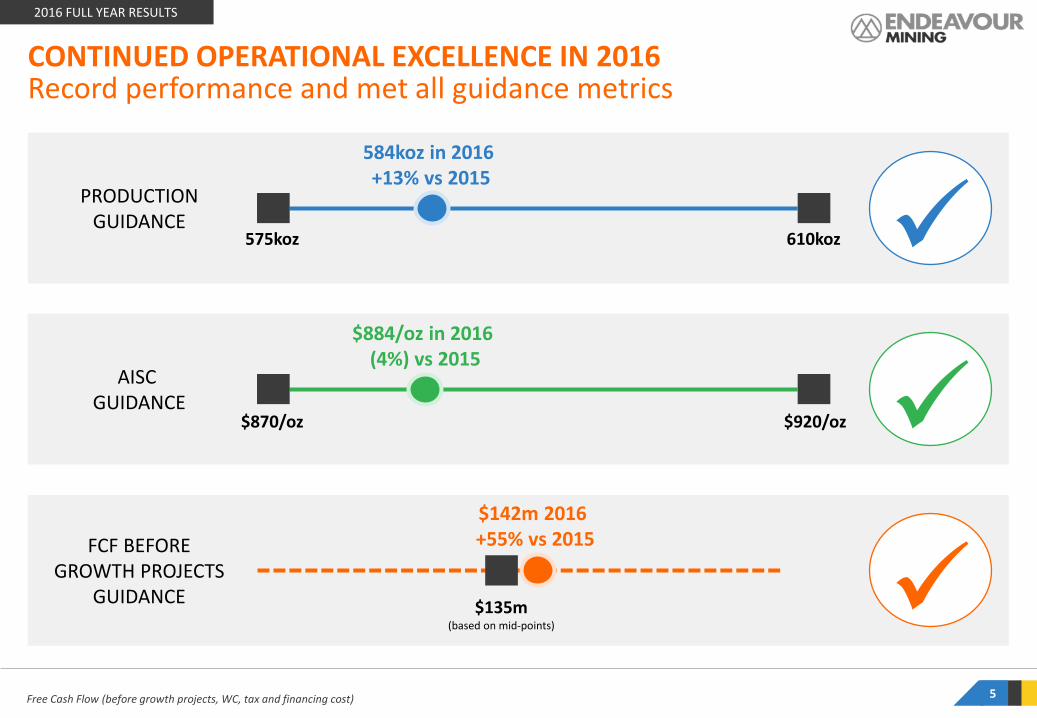
CONTINUED OPERATIONAL EXCELLENCE IN 2016 Record performance and met all guidance metrics
Free Cash Flow (before growth projects, WC, tax and financing cost)
2016 FULL YEAR RESULTS
584koz in 2016 +13% vs 2015
575koz
PRODUCTION GUIDANCE
610koz
$884/oz in 2016 (4%) vs 2015
$870/oz
AISC GUIDANCE
$920/oz
$142m 2016 +55% vs 2015
$135m (based on mid-points)
FCF BEFORE GROWTH PROJECTS
GUIDANCE
5
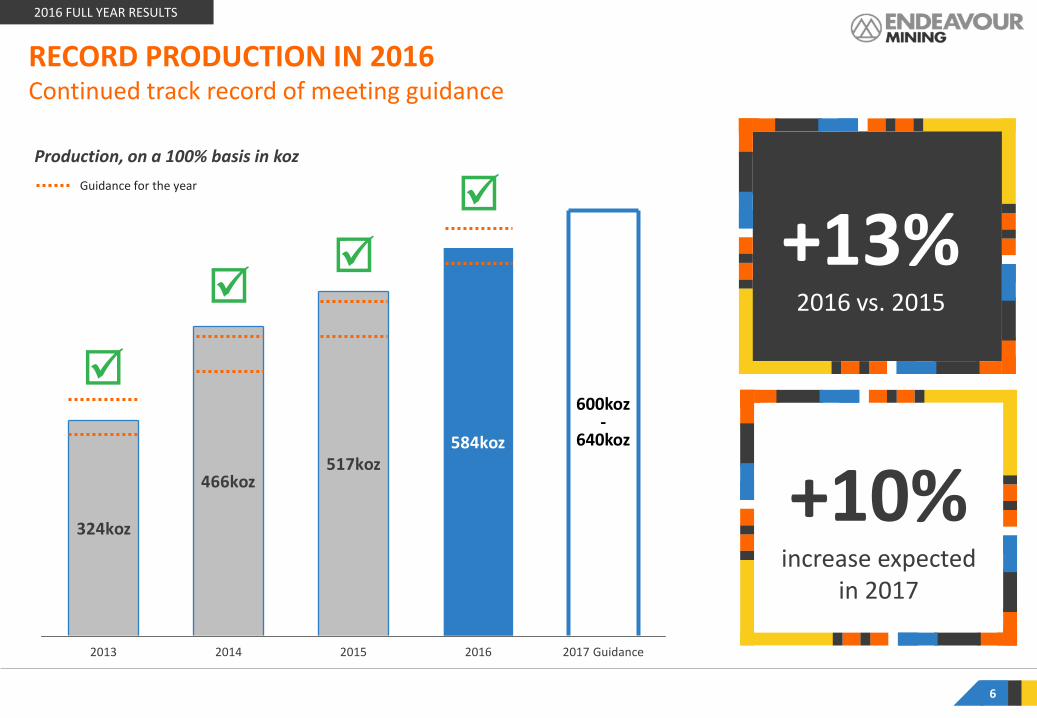
RECORD PRODUCTION IN 2016 Continued track record of meeting guidance
2016 FULL YEAR RESULTS
466koz517koz
324koz
584koz
600koz -
640koz
2015 2017 Guidance 2013 2014 2016
Production, on a 100% basis in koz
6
+13% 2016 vs. 2015
+10% increase expected
in 2017
Guidance for the year
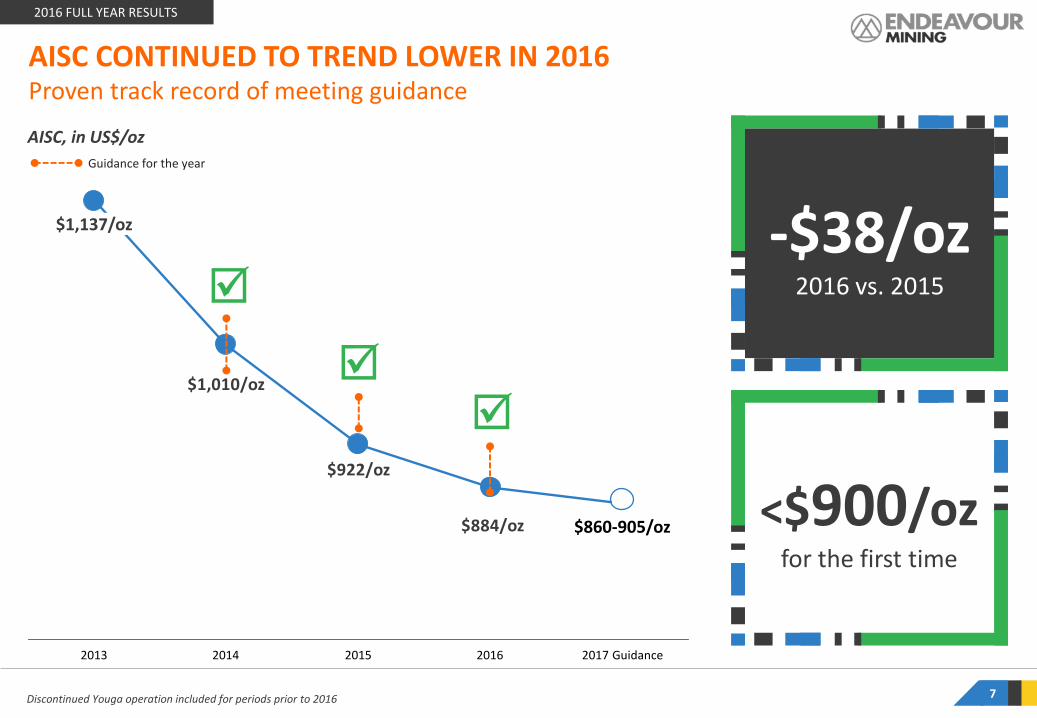
AISC CONTINUED TO TREND LOWER IN 2016 Proven track record of meeting guidance
Discontinued Youga operation included for periods prior to 2016
2016 FULL YEAR RESULTS
AISC, in US$/oz
7
$1,010/oz
$884/oz
$922/oz
$1,137/oz
2013 2014 2017 Guidance
$860-905/oz
2016 2015
Guidance for the year
-$38/oz 2016 vs. 2015
<$900/oz for the first time
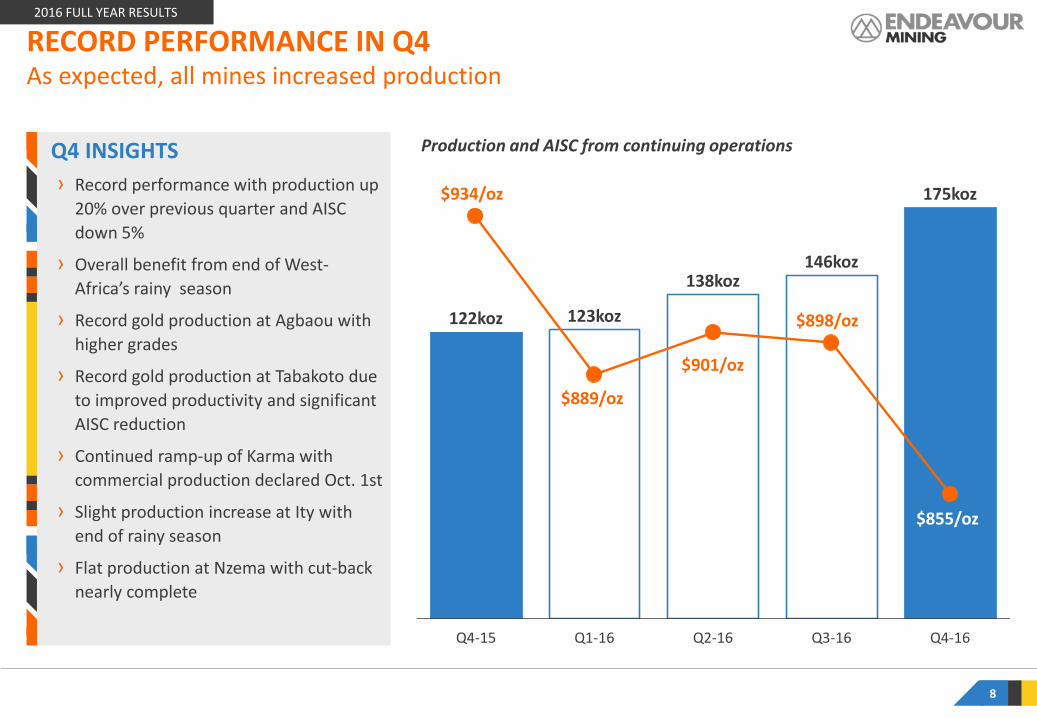
Q4 INSIGHTS
› Record performance with production up
20% over previous quarter and AISC
down 5%
› Overall benefit from end of West-
Africa’s rainy season
› Record gold production at Agbaou with
higher grades
› Record gold production at Tabakoto due
to improved productivity and significant
AISC reduction
› Continued ramp-up of Karma with
commercial production declared Oct. 1st
› Slight production increase at Ity with
end of rainy season
› Flat production at Nzema with cut-back
nearly complete
8
2016 FULL YEAR RESULTS
123koz
175koz
138koz
Q4-16 Q2-16
122koz
Q1-16
146koz
Q3-16 Q4-15
RECORD PERFORMANCE IN Q4 As expected, all mines increased production
Production and AISC from continuing operations
$889/oz
$901/oz
$898/oz
$855/oz
$934/oz
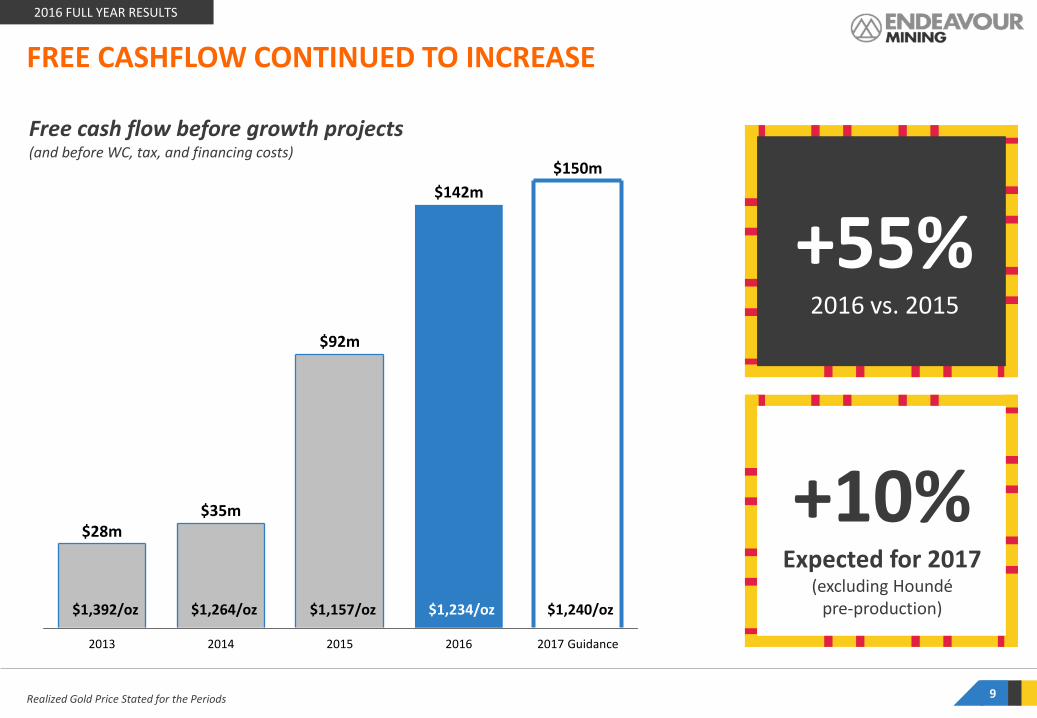
Realized Gold Price Stated for the Periods 9
2017 Guidance
$150m
2016
$142m
2015
$92m
2014
$35m
2013
$28m
FREE CASHFLOW CONTINUED TO INCREASE
2016 FULL YEAR RESULTS
Free cash flow before growth projects (and before WC, tax, and financing costs)
$1,392/oz $1,264/oz $1,157/oz $1,234/oz $1,240/oz
+55% 2016 vs. 2015
+10% Expected for 2017
(excluding Houndé pre-production)
10
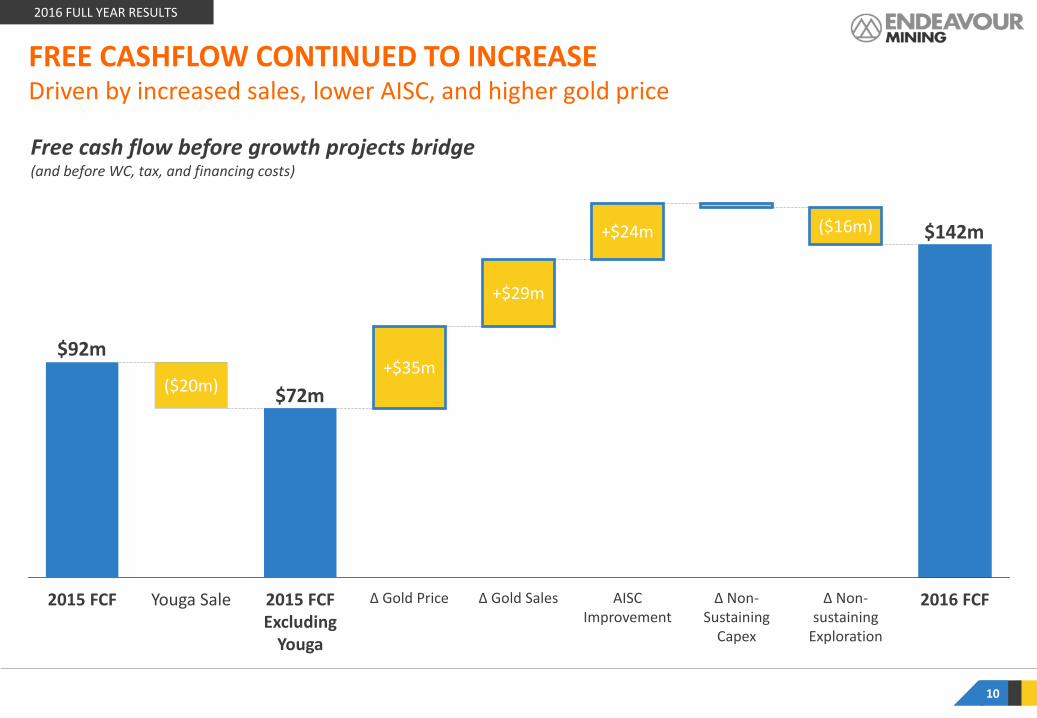
2016 FULL YEAR RESULTS
$142m
$72m
$92m
Δ Non-Sustaining
Capex
AISC Improvement
Δ Gold Sales Δ Non-sustaining
Exploration
2016 FCF Δ Gold Price 2015 FCF Excluding
Youga
Youga Sale 2015 FCF
($20m)
+$29m
+$35m
+$24m ($16m)
Free cash flow before growth projects bridge (and before WC, tax, and financing costs)
FREE CASHFLOW CONTINUED TO INCREASE Driven by increased sales, lower AISC, and higher gold price
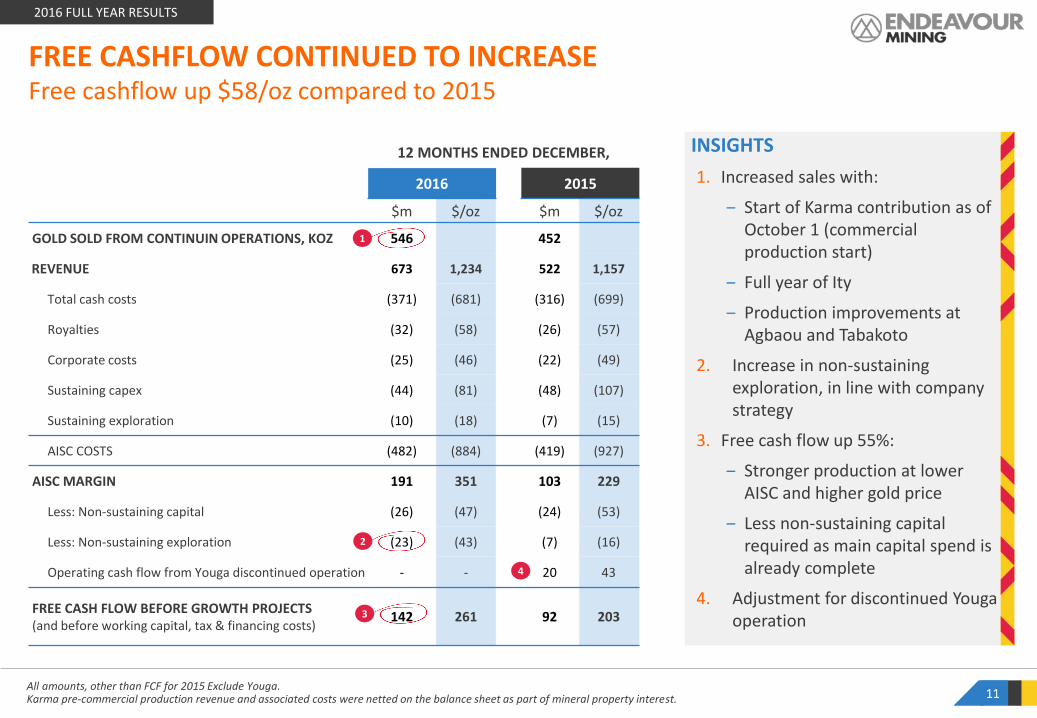
INSIGHTS
1. Increased sales with:
‒ Start of Karma contribution as of October 1 (commercial production start)
‒ Full year of Ity
‒ Production improvements at Agbaou and Tabakoto
2. Increase in non-sustaining exploration, in line with company strategy
3. Free cash flow up 55%:
‒ Stronger production at lower AISC and higher gold price
‒ Less non-sustaining capital required as main capital spend is already complete
4. Adjustment for discontinued Youga operation
All amounts, other than FCF for 2015 Exclude Youga. Karma pre-commercial production revenue and associated costs were netted on the balance sheet as part of mineral property interest. 11
2016 FULL YEAR RESULTS
FREE CASHFLOW CONTINUED TO INCREASE Free cashflow up $58/oz compared to 2015
12 MONTHS ENDED DECEMBER,
2016 2015
$m $/oz $m $/oz
GOLD SOLD FROM CONTINUIN OPERATIONS, KOZ 546 452
REVENUE 673 1,234 522 1,157
Total cash costs (371) (681) (316) (699)
Royalties (32) (58) (26) (57)
Corporate costs (25) (46) (22) (49)
Sustaining capex (44) (81) (48) (107)
Sustaining exploration (10) (18) (7) (15)
AISC COSTS (482) (884) (419) (927)
AISC MARGIN 191 351 103 229
Less: Non-sustaining capital (26) (47) (24) (53)
Less: Non-sustaining exploration (23) (43) (7) (16)
Operating cash flow from Youga discontinued operation - - 20 43
FREE CASH FLOW BEFORE GROWTH PROJECTS (and before working capital, tax & financing costs)
142 261 92 203
1
2
3
4

12 MONTHS ENDED DEC.
US$m 2016 2015
FREE CASH FLOW BEFORE GROWTH PROJECTS (and WC, tax & financing costs)
142 92
Working capital changes (27) 6
Taxes paid (11) (7)
Interest paid (20) (25)
Cash settlements on hedge programs and gold collar premiums (14) (3)
NET FREE CASH FLOW FROM OPERATIONS 70 62
Growth Project1 (110) (7)
Change in growth project working capital (6) -
Cash received for Youga mineral property interests (net) 22 -
Cash received for Ity mineral property interests (net) - 86
True Gold (Bridge loan, cash acquired, less change of control payments) (11) -
Restructuring and acquisition costs (24) -
Other (1) (30)
Net equity proceeds 185 -
NET CASH/(NET DEBT) VARIATION 125 110
Reduction of debt obligations (110) (63)
CASH INFLOW (OUTFLOW) FOR THE PERIOD 15 47
INSIGHTS
1. Mainly due to inventory, gold-in-circuit and VAT build-up at Karma related to its commissioning phase
2. Includes: $10m hedge settlements, $5m gold collar premiums
3. Associated with $102m capex spend for Houndé build with bulk of remaining for Ity CIL Project Study
4. Mainly Houndé payables
5. Includes $6m of acquisition cost and $18m of restructuring related to ex-CEO, BOD and executive level restructuring costs and office consolidation
6. Includes dividends to minority interests for ($3m), settlement of share appreciation rights, DSUs and PSUs ($6m)
NET FREE CASH FLOW Remains positive despite Houndé Capex
1 Includes Houndé, Ity CIL, and studies
3
4
5
6
2016 FULL YEAR RESULTS
12
1
2
$1,050/oz
$1,100/oz
$1,150/oz
$1,200/oz
$1,250/oz
$1,300/oz
$1,350/oz
$1,400/oz
$1,450/oz
Jan Apr Jul Oct Jan
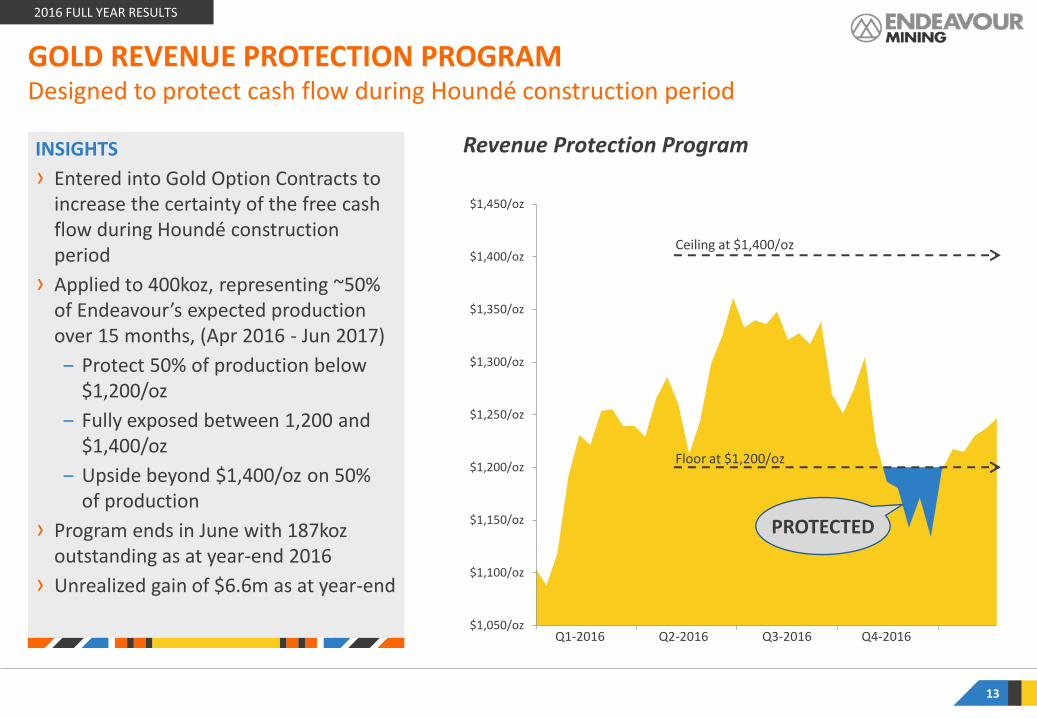
GOLD REVENUE PROTECTION PROGRAM Designed to protect cash flow during Houndé construction period
13
2016 FULL YEAR RESULTS
Q1-2016 Q4-2016 Q3-2016 Q2-2016
INSIGHTS
› Entered into Gold Option Contracts to increase the certainty of the free cash flow during Houndé construction period
› Applied to 400koz, representing ~50% of Endeavour’s expected production over 15 months, (Apr 2016 - Jun 2017)
‒ Protect 50% of production below $1,200/oz
‒ Fully exposed between 1,200 and $1,400/oz
‒ Upside beyond $1,400/oz on 50% of production
› Program ends in June with 187koz outstanding as at year-end 2016
› Unrealized gain of $6.6m as at year-end
Ceiling at $1,400/oz
Floor at $1,200/oz
PROTECTED
Revenue Protection Program
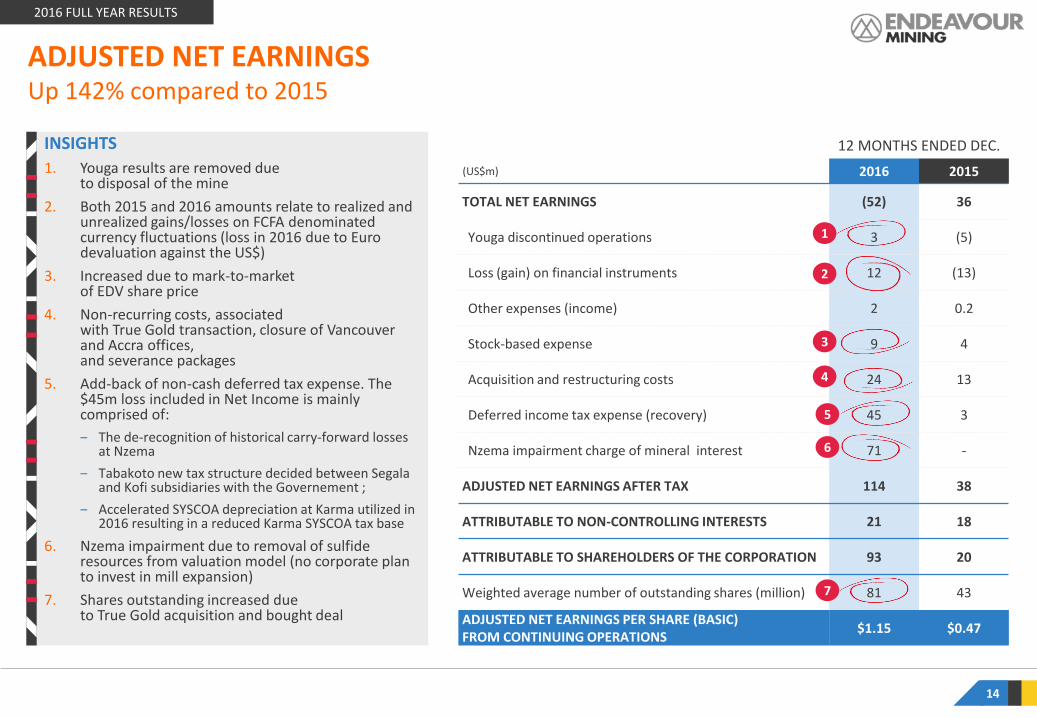
INSIGHTS
1. Youga results are removed due to disposal of the mine
2. Both 2015 and 2016 amounts relate to realized and unrealized gains/losses on FCFA denominated currency fluctuations (loss in 2016 due to Euro devaluation against the US$)
3. Increased due to mark-to-market of EDV share price
4. Non-recurring costs, associated with True Gold transaction, closure of Vancouver and Accra offices, and severance packages
5. Add-back of non-cash deferred tax expense. The $45m loss included in Net Income is mainly comprised of:
‒ The de-recognition of historical carry-forward losses at Nzema
‒ Tabakoto new tax structure decided between Segala and Kofi subsidiaries with the Governement ;
‒ Accelerated SYSCOA depreciation at Karma utilized in 2016 resulting in a reduced Karma SYSCOA tax base
6. Nzema impairment due to removal of sulfide resources from valuation model (no corporate plan to invest in mill expansion)
7. Shares outstanding increased due to True Gold acquisition and bought deal
ADJUSTED NET EARNINGS Up 142% compared to 2015
12 MONTHS ENDED DEC.
(US$m) 2016 2015
TOTAL NET EARNINGS (52) 36
Youga discontinued operations 3 (5)
Loss (gain) on financial instruments 12 (13)
Other expenses (income) 2 0.2
Stock-based expense 9 4
Acquisition and restructuring costs 24 13
Deferred income tax expense (recovery) 45 3
Nzema impairment charge of mineral interest 71 -
ADJUSTED NET EARNINGS AFTER TAX 114 38
ATTRIBUTABLE TO NON-CONTROLLING INTERESTS 21 18
ATTRIBUTABLE TO SHAREHOLDERS OF THE CORPORATION 93 20
Weighted average number of outstanding shares (million) 81 43
ADJUSTED NET EARNINGS PER SHARE (BASIC) FROM CONTINUING OPERATIONS
$1.15 $0.47
1
2
3
4
7
2016 FULL YEAR RESULTS
14
5
6
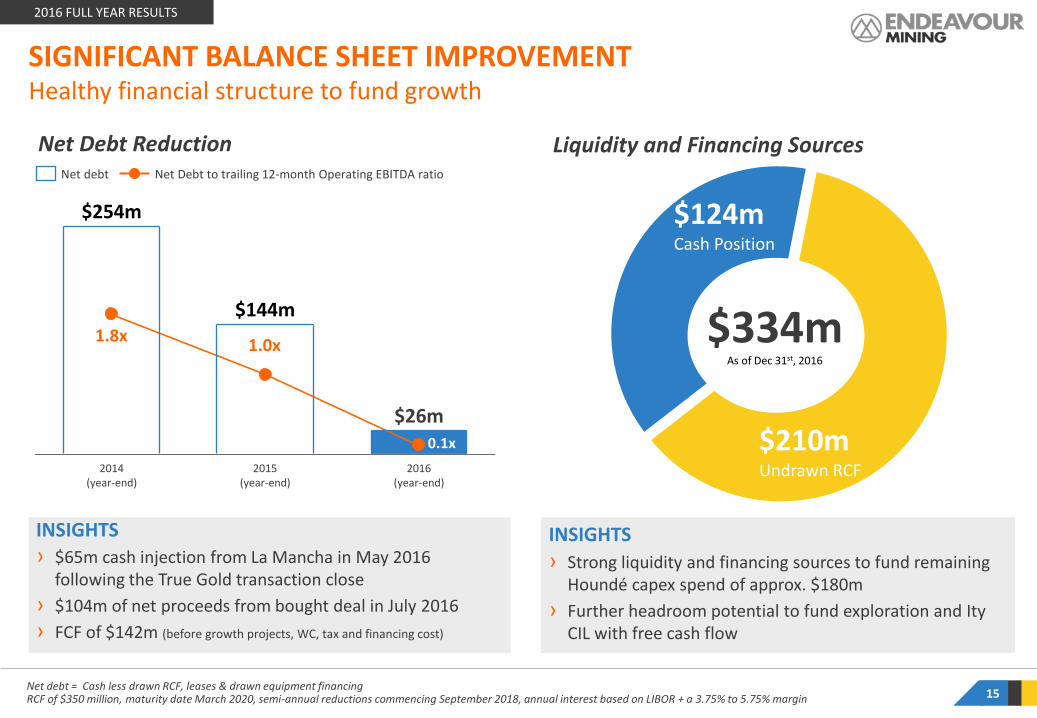
INSIGHTS
› Strong liquidity and financing sources to fund remaining Houndé capex spend of approx. $180m
› Further headroom potential to fund exploration and Ity CIL with free cash flow
INSIGHTS › $65m cash injection from La Mancha in May 2016
following the True Gold transaction close
› $104m of net proceeds from bought deal in July 2016
› FCF of $142m (before growth projects, WC, tax and financing cost)
SIGNIFICANT BALANCE SHEET IMPROVEMENT Healthy financial structure to fund growth
Net debt = Cash less drawn RCF, leases & drawn equipment financing RCF of $350 million, maturity date March 2020, semi-annual reductions commencing September 2018, annual interest based on LIBOR + a 3.75% to 5.75% margin
2016 FULL YEAR RESULTS
$26m
2014 (year-end)
2015 (year-end)
$144m
2016 (year-end)
$254m
Net Debt to trailing 12-month Operating EBITDA ratio Net debt
15
$210m Undrawn RCF
$124m Cash Position
$334m As of Dec 31st, 2016
Liquidity and Financing Sources Net Debt Reduction
1.8x 1.0x
0.1x
Production Guidance, koz
AISC Guidance, $/oz
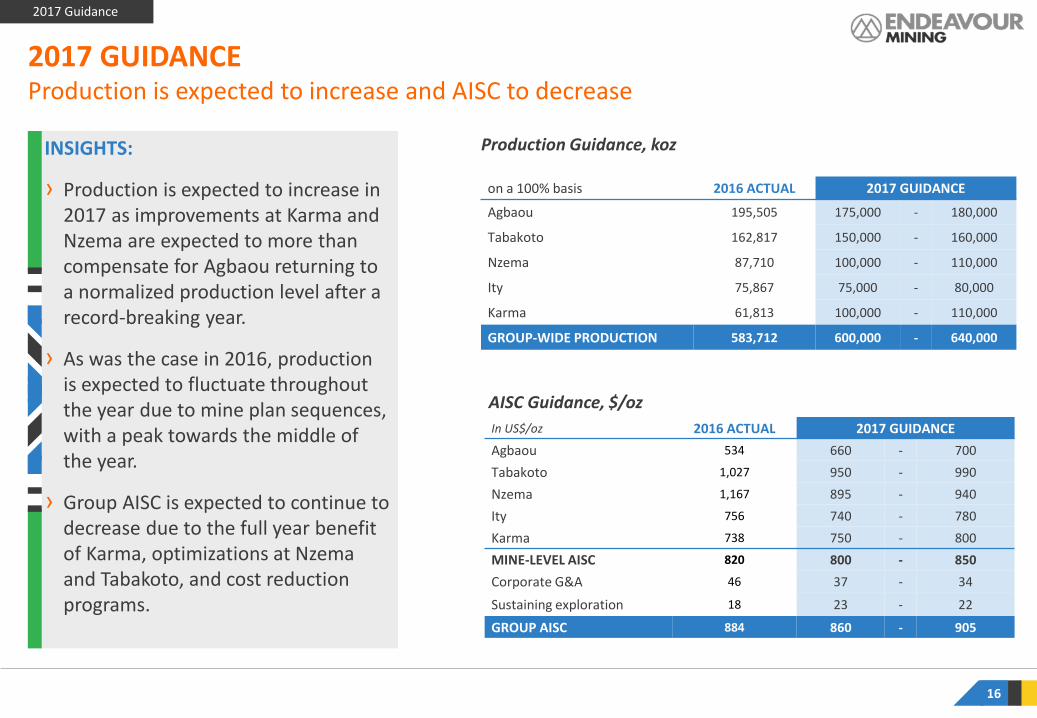
2017 GUIDANCE Production is expected to increase and AISC to decrease
on a 100% basis 2016 ACTUAL 2017 GUIDANCE
Agbaou 195,505 175,000 - 180,000
Tabakoto 162,817 150,000 - 160,000
Nzema 87,710 100,000 - 110,000
Ity 75,867 75,000 - 80,000
Karma 61,813 100,000 - 110,000
GROUP-WIDE PRODUCTION 583,712 600,000 - 640,000
In US$/oz 2016 ACTUAL 2017 GUIDANCE
Agbaou 534 660 - 700
Tabakoto 1,027 950 - 990
Nzema 1,167 895 - 940
Ity 756 740 - 780
Karma 738 750 - 800
MINE-LEVEL AISC 820 800 - 850
Corporate G&A 46 37 - 34
Sustaining exploration 18 23 - 22
GROUP AISC 884 860 - 905
16
2017 Guidance
INSIGHTS:
› Production is expected to increase in 2017 as improvements at Karma and Nzema are expected to more than compensate for Agbaou returning to a normalized production level after a record-breaking year.
› As was the case in 2016, production is expected to fluctuate throughout the year due to mine plan sequences, with a peak towards the middle of the year.
› Group AISC is expected to continue to decrease due to the full year benefit of Karma, optimizations at Nzema and Tabakoto, and cost reduction programs.
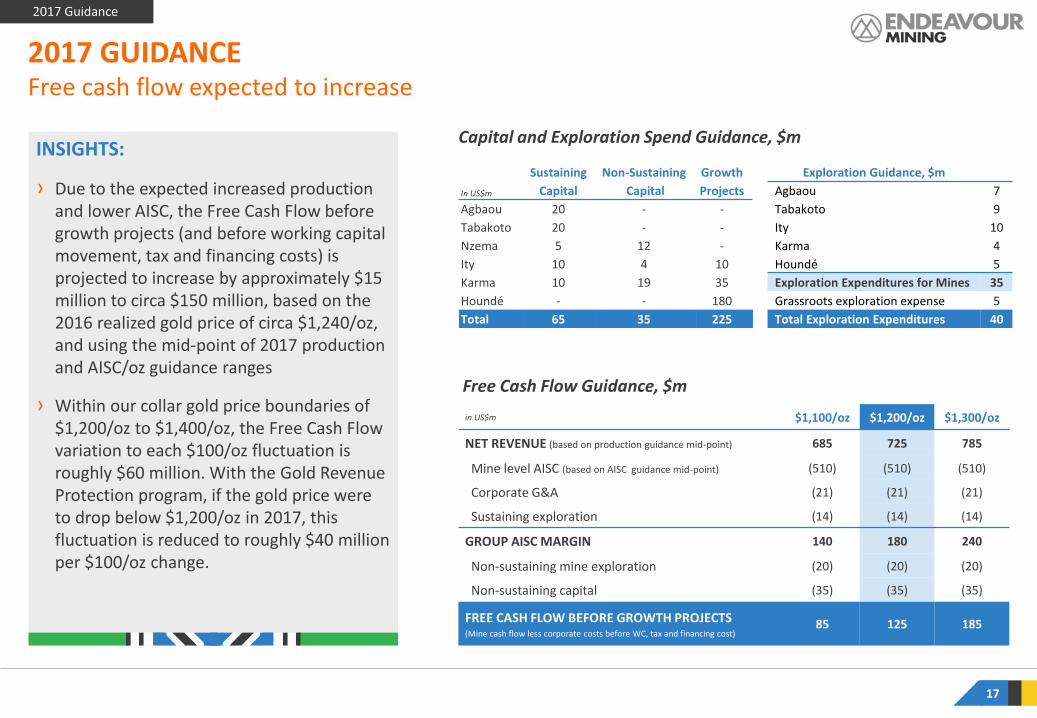
2017 GUIDANCE Free cash flow expected to increase
17
Free Cash Flow Guidance, $m
in US$m $1,100/oz $1,200/oz $1,300/oz
NET REVENUE (based on production guidance mid-point) 685 725 785
Mine level AISC (based on AISC guidance mid-point) (510) (510) (510)
Corporate G&A (21) (21) (21)
Sustaining exploration (14) (14) (14)
GROUP AISC MARGIN 140 180 240
Non-sustaining mine exploration (20) (20) (20)
Non-sustaining capital (35) (35) (35)
FREE CASH FLOW BEFORE GROWTH PROJECTS (Mine cash flow less corporate costs before WC, tax and financing cost)
85 125 185
In US$m
Sustaining
Capital
Non-Sustaining
Capital
Growth
Projects
Agbaou 20 - -
Tabakoto 20 - -
Nzema 5 12 -
Ity 10 4 10
Karma 10 19 35
Houndé - - 180
Total 65 35 225
2017 Guidance
Exploration Guidance, $m
Agbaou 7
Tabakoto 9
Ity 10
Karma 4
Houndé 5
Exploration Expenditures for Mines 35
Grassroots exploration expense 5
Total Exploration Expenditures 40
Capital and Exploration Spend Guidance, $m INSIGHTS:
› Due to the expected increased production and lower AISC, the Free Cash Flow before growth projects (and before working capital movement, tax and financing costs) is projected to increase by approximately $15 million to circa $150 million, based on the 2016 realized gold price of circa $1,240/oz, and using the mid-point of 2017 production and AISC/oz guidance ranges
› Within our collar gold price boundaries of $1,200/oz to $1,400/oz, the Free Cash Flow variation to each $100/oz fluctuation is roughly $60 million. With the Gold Revenue Protection program, if the gold price were to drop below $1,200/oz in 2017, this fluctuation is reduced to roughly $40 million per $100/oz change.
OPERATIONAL AND FINANCIAL SUMMARY 1
APPENDIX 4
DETAILS BY MINE AND PROJECT 2
CONCLUSION 3
*Pro-Forma for sale of Youga Mine and purchase of Karma Mine. See Appendix for details. 19
2016 FULL YEAR RESULTS
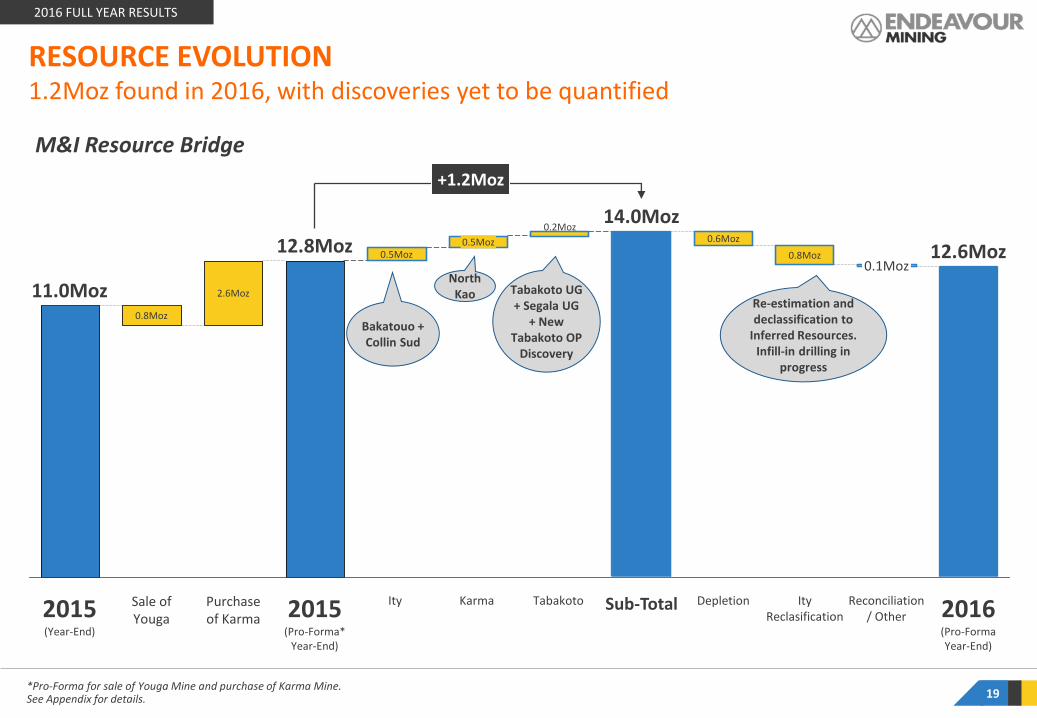
RESOURCE EVOLUTION 1.2Moz found in 2016, with discoveries yet to be quantified
Ity Reclasification
0.5Moz
2015 (Year-End)
11.0Moz
+9%
12.8Moz 12.6Moz
Purchase of Karma 2015
(Pro-Forma* Year-End)
2.6Moz
Sale of Youga
Ity
0.8Moz
0.1Moz
2016 (Pro-Forma Year-End)
0.5Moz
Tabakoto Karma Sub-Total
14.0Moz 0.6Moz
0.8Moz
Depletion Reconciliation / Other
+1.2Moz
Bakatouo + Collin Sud
North Kao Tabakoto UG
+ Segala UG + New
Tabakoto OP Discovery
M&I Resource Bridge
Re-estimation and declassification to
Inferred Resources. Infill-in drilling in
progress
0.2Moz
*Pro-Forma for sale of Youga Mine and purchase of Karma Mine See Appendix for details. 20
2016 FULL YEAR RESULTS
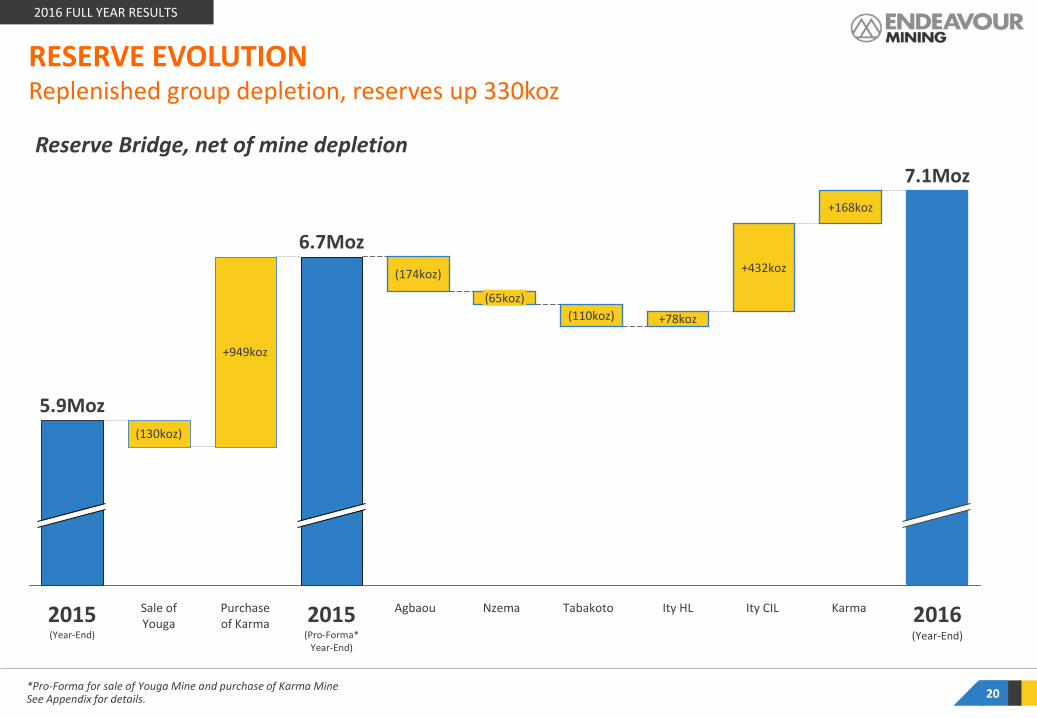
RESERVE EVOLUTION Replenished group depletion, reserves up 330koz
2016 (Year-End)
+168koz
Ity CIL
+432koz
Ity HL
+78koz
Tabakoto
(110koz)
Nzema
(65koz)
Agbaou
(174koz)
2015 (Pro-Forma*
Year-End)
6.7Moz
Purchase of Karma
+949koz
Sale of Youga
(130koz)
2015 (Year-End)
5.9Moz
7.1Moz
Karma
Reserve Bridge, net of mine depletion
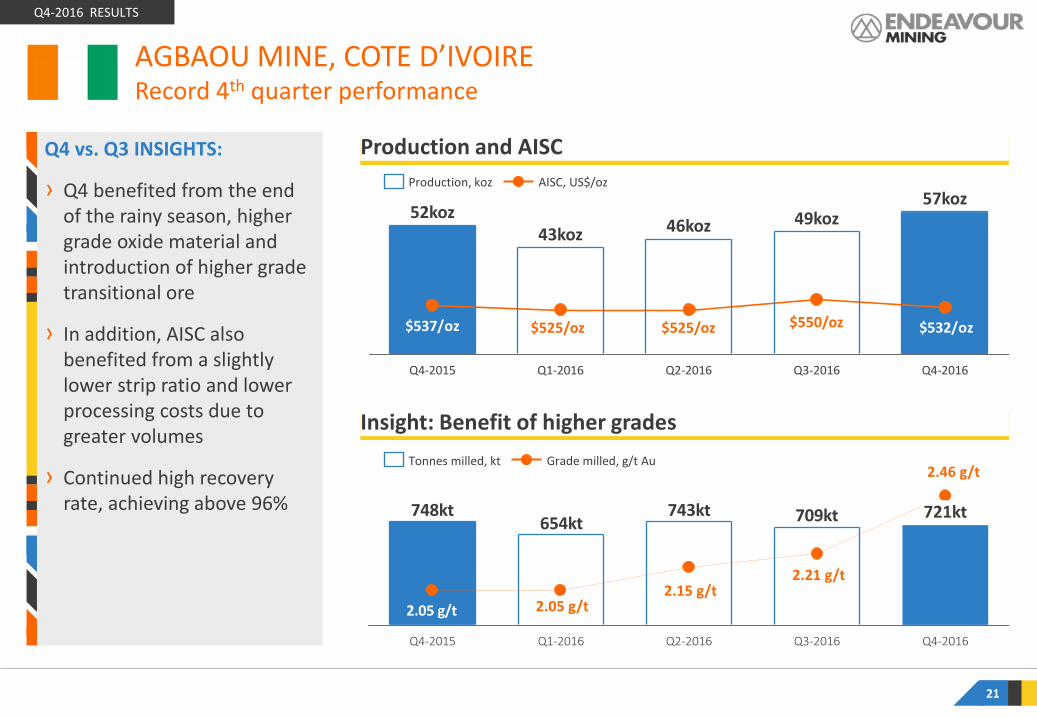
Insight: Benefit of higher grades
Production and AISC
Q4 vs. Q3 INSIGHTS:
› Q4 benefited from the end of the rainy season, higher grade oxide material and introduction of higher grade transitional ore
› In addition, AISC also benefited from a slightly lower strip ratio and lower processing costs due to greater volumes
› Continued high recovery rate, achieving above 96%
AGBAOU MINE, COTE D’IVOIRE Record 4th quarter performance
Q4-2016 RESULTS
709kt743kt654kt
748kt
2.05 g/t
Q3-2016 Q2-2016 Q4-2016
721kt
Q4-2015 Q1-2016
Grade milled, g/t Au Tonnes milled, kt
$532/oz$537/oz
Q3-2016
49koz
Q1-2016 Q4-2015
52koz
Q4-2016
57koz
Q2-2016
46koz 43koz
AISC, US$/oz Production, koz
21
$525/oz $525/oz $550/oz
2.05 g/t 2.15 g/t
2.21 g/t
2.46 g/t

Production and AISC
2016 vs 2015 INSIGHTS
› Production benefited from higher grades and continued mill over-performance
› The secondary crusher (commissioned in mid-2016 ahead of schedule and under-budget) provides the flexibility to process higher grade transitional ore while maintaining a fairly constant ore blend and throughput over the remaining life of mine
2017 OUTLOOK
› After achieving an exceptional year, Agbaou is expected to return to a more normalized and sustainable production rate of 175-180koz in 2017 with fresh ore representing up to 50% of tonnes processed
› AISC is expected to remain competitive, at $660-700/oz, as higher grade transitional ore is expected to compensate for increased unit costs and lower throughput
AGBAOU MINE, COTE D’IVOIRE Record 2016 performance
2016 FULL YEAR RESULTS
Δ Recovery Rate
2017 Production
2016 Production
2015 Production
Δ Tonnes Processed
Δ Grade Processed
175-180koz
196koz
181koz
$576/oz
$534/oz
$660-700/oz
22
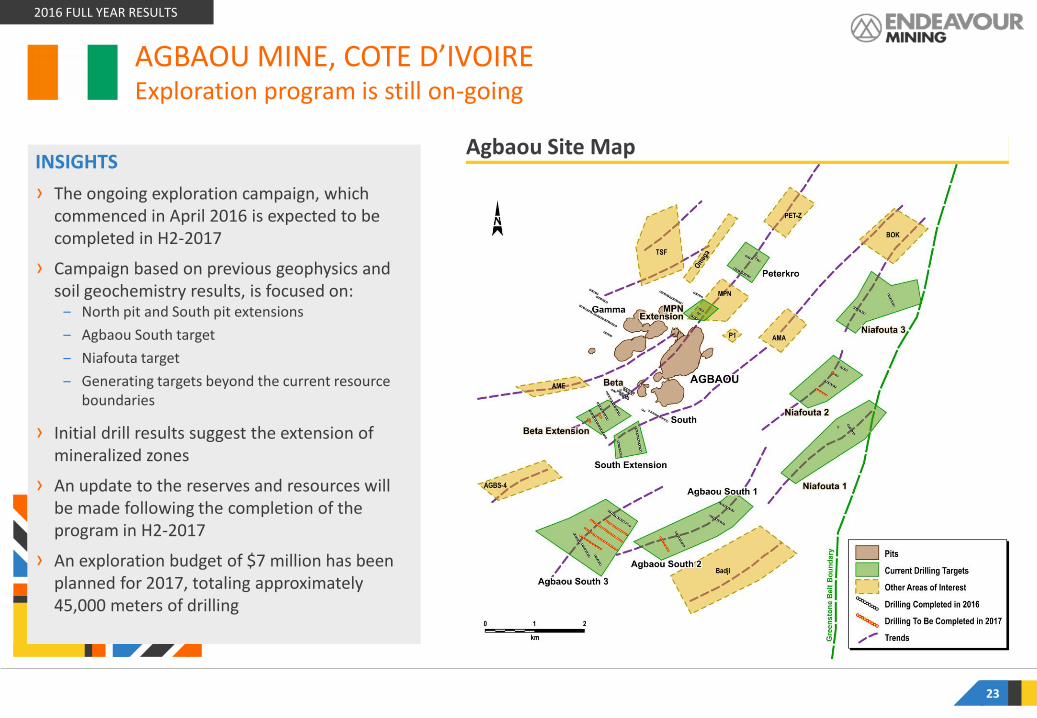
INSIGHTS
› The ongoing exploration campaign, which commenced in April 2016 is expected to be completed in H2-2017
› Campaign based on previous geophysics and soil geochemistry results, is focused on:
‒ North pit and South pit extensions
‒ Agbaou South target
‒ Niafouta target
‒ Generating targets beyond the current resource boundaries
› Initial drill results suggest the extension of mineralized zones
› An update to the reserves and resources will be made following the completion of the program in H2-2017
› An exploration budget of $7 million has been planned for 2017, totaling approximately 45,000 meters of drilling
Agbaou Site Map
2016 FULL YEAR RESULTS
23
AGBAOU MINE, COTE D’IVOIRE Exploration program is still on-going
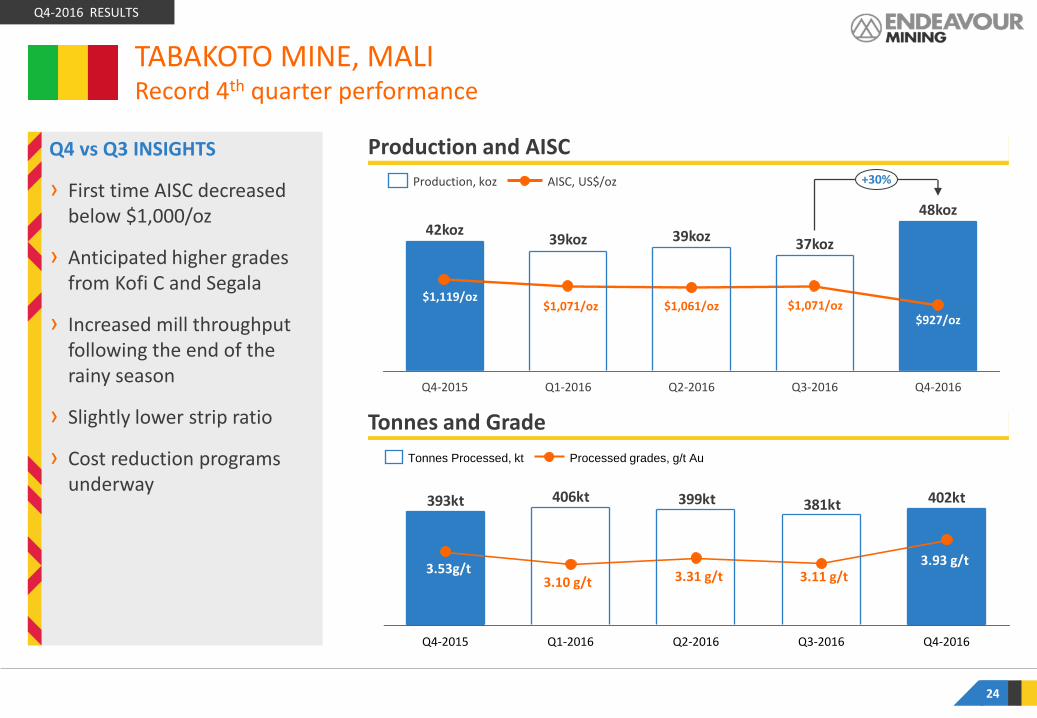
Tonnes and Grade
Production and AISC
Q4 vs Q3 INSIGHTS
› First time AISC decreased below $1,000/oz
› Anticipated higher grades from Kofi C and Segala
› Increased mill throughput following the end of the rainy season
› Slightly lower strip ratio
› Cost reduction programs underway
TABAKOTO MINE, MALI Record 4th quarter performance
Q4-2016 RESULTS
Q3-2016 Q4-2015
48koz
Q2-2016
+30%
Q4-2016
37koz 39koz
Q1-2016
39koz 42koz
AISC, US$/oz Production, koz
402kt381kt399kt406kt393kt
Q3-2016 Q4-2016 Q1-2016 Q4-2015 Q2-2016
Processed grades, g/t Au Tonnes Processed, kt
24
3.10 g/t 3.31 g/t 3.11 g/t 3.93 g/t
$1,119/oz $1,071/oz $1,061/oz $1,071/oz
3.53g/t
$927/oz
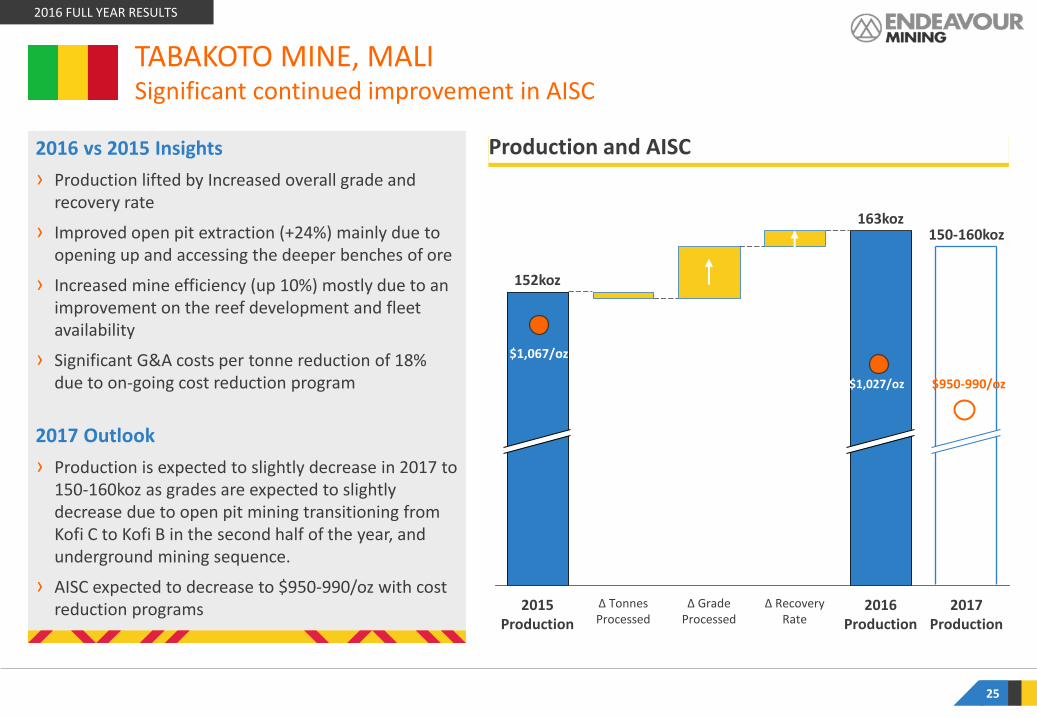
2016 vs 2015 Insights
› Production lifted by Increased overall grade and recovery rate
› Improved open pit extraction (+24%) mainly due to opening up and accessing the deeper benches of ore
› Increased mine efficiency (up 10%) mostly due to an improvement on the reef development and fleet availability
› Significant G&A costs per tonne reduction of 18% due to on-going cost reduction program
2017 Outlook
› Production is expected to slightly decrease in 2017 to 150-160koz as grades are expected to slightly decrease due to open pit mining transitioning from Kofi C to Kofi B in the second half of the year, and underground mining sequence.
› AISC expected to decrease to $950-990/oz with cost reduction programs
2016 FULL YEAR RESULTS
25
Production and AISC
2017 Production
150-160koz
2016 Production
163koz
Δ Recovery Rate
Δ Grade Processed
Δ Tonnes Processed
2015 Production
152koz
TABAKOTO MINE, MALI Significant continued improvement in AISC
$1,067/oz
$1,027/oz $950-990/oz
Tabakoto Site Map
Kreko
Fougala
2016 FULL YEAR RESULTS
26
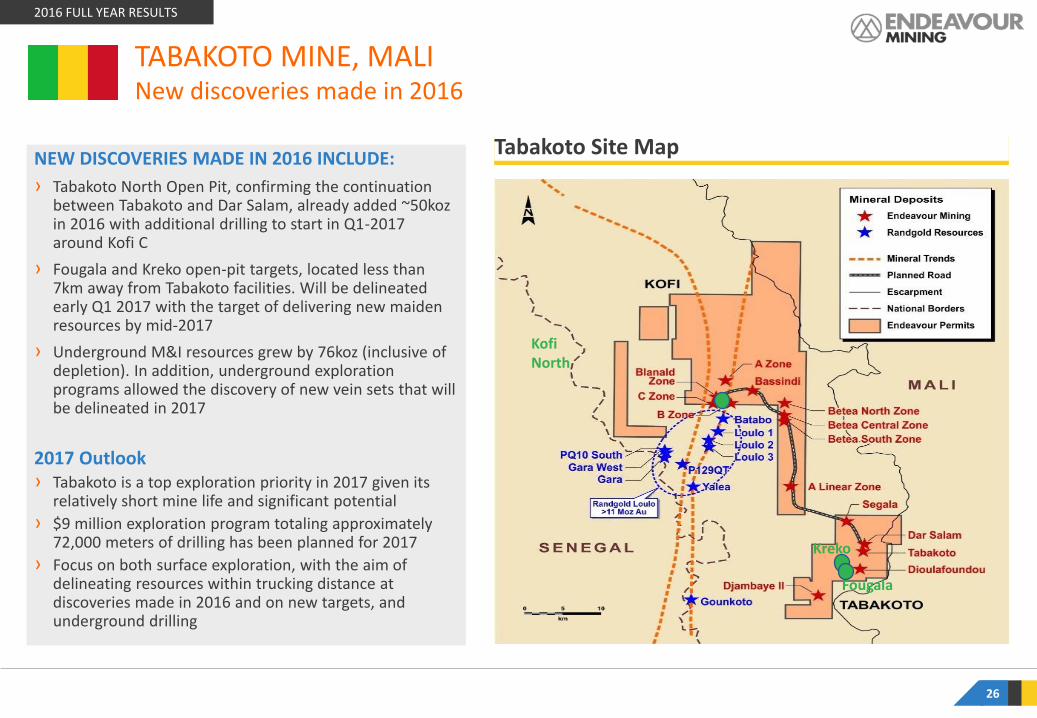
TABAKOTO MINE, MALI New discoveries made in 2016
NEW DISCOVERIES MADE IN 2016 INCLUDE:
› Tabakoto North Open Pit, confirming the continuation between Tabakoto and Dar Salam, already added ~50koz in 2016 with additional drilling to start in Q1-2017 around Kofi C
› Fougala and Kreko open-pit targets, located less than 7km away from Tabakoto facilities. Will be delineated early Q1 2017 with the target of delivering new maiden resources by mid-2017
› Underground M&I resources grew by 76koz (inclusive of depletion). In addition, underground exploration programs allowed the discovery of new vein sets that will be delineated in 2017
2017 Outlook › Tabakoto is a top exploration priority in 2017 given its
relatively short mine life and significant potential
› $9 million exploration program totaling approximately 72,000 meters of drilling has been planned for 2017
› Focus on both surface exploration, with the aim of delineating resources within trucking distance at discoveries made in 2016 and on new targets, and underground drilling
Kofi North
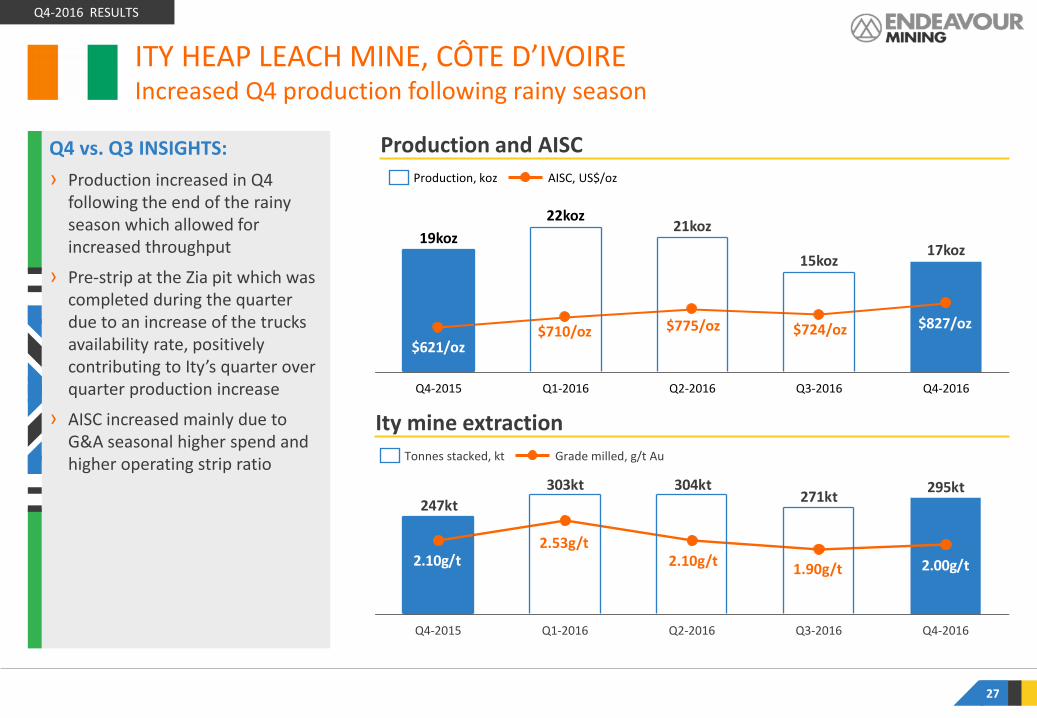
Q4 vs. Q3 INSIGHTS:
› Production increased in Q4 following the end of the rainy season which allowed for increased throughput
› Pre-strip at the Zia pit which was completed during the quarter due to an increase of the trucks availability rate, positively contributing to Ity’s quarter over quarter production increase
› AISC increased mainly due to G&A seasonal higher spend and higher operating strip ratio
ITY HEAP LEACH MINE, CÔTE D’IVOIRE Increased Q4 production following rainy season
Q4-2016 RESULTS
$621/oz
$827/oz
21koz
Q2-2016 Q3-2016
17koz 15koz
Q4-2016 Q4-2015
22koz
Q1-2016
19koz
AISC, US$/oz Production, koz
295kt271kt
304kt303kt
247kt
2.10g/t 2.00g/t
Q2-2016 Q4-2016 Q4-2015 Q3-2016 Q1-2016
Tonnes stacked, kt Grade milled, g/t Au
27
Production and AISC
Ity mine extraction
$710/oz $775/oz $724/oz
1.90g/t 2.10g/t
2.53g/t
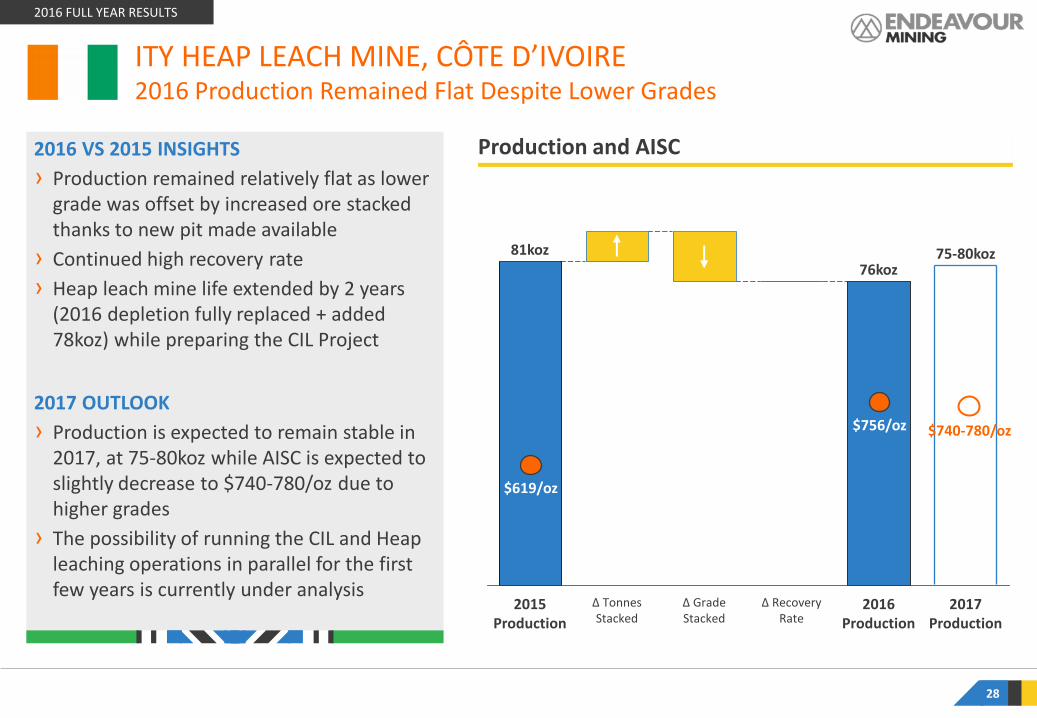
2016 VS 2015 INSIGHTS
› Production remained relatively flat as lower grade was offset by increased ore stacked thanks to new pit made available
› Continued high recovery rate
› Heap leach mine life extended by 2 years (2016 depletion fully replaced + added 78koz) while preparing the CIL Project
2017 OUTLOOK
› Production is expected to remain stable in 2017, at 75-80koz while AISC is expected to slightly decrease to $740-780/oz due to higher grades
› The possibility of running the CIL and Heap leaching operations in parallel for the first few years is currently under analysis
ITY HEAP LEACH MINE, CÔTE D’IVOIRE 2016 Production Remained Flat Despite Lower Grades
2016 FULL YEAR RESULTS
28
Production and AISC
Δ Tonnes Stacked
2017 Production
75-80koz
Δ Recovery Rate
2016 Production
Δ Grade Stacked
2015 Production
81koz 76koz
$756/oz $740-780/oz
$619/oz
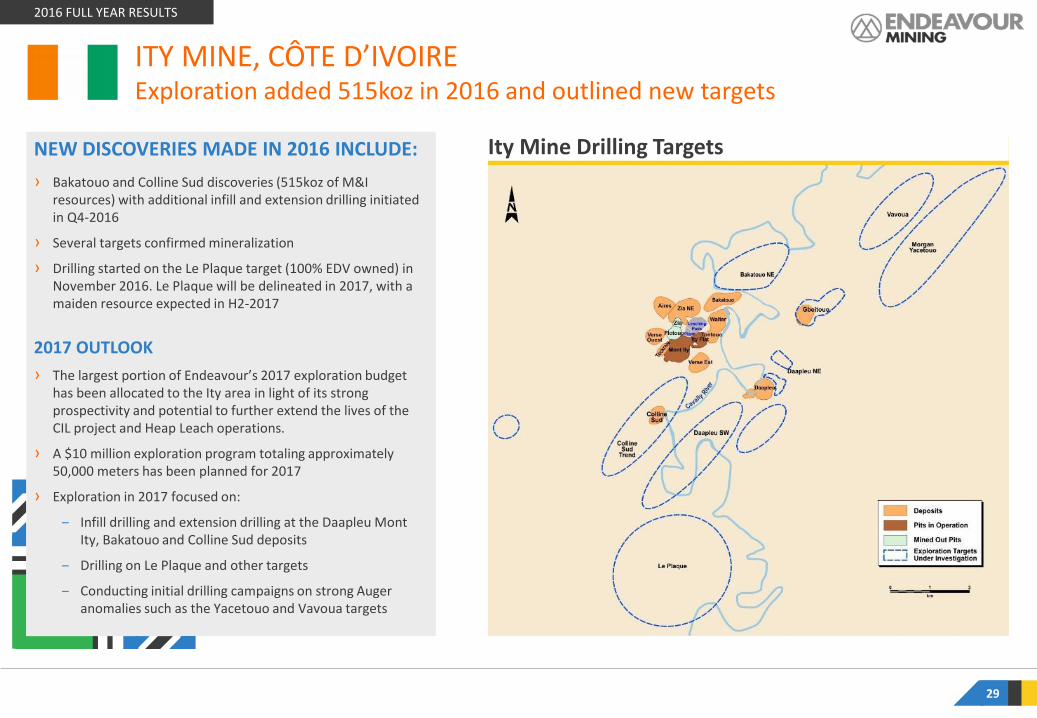
NEW DISCOVERIES MADE IN 2016 INCLUDE:
› Bakatouo and Colline Sud discoveries (515koz of M&I resources) with additional infill and extension drilling initiated in Q4-2016
› Several targets confirmed mineralization
› Drilling started on the Le Plaque target (100% EDV owned) in November 2016. Le Plaque will be delineated in 2017, with a maiden resource expected in H2-2017
2017 OUTLOOK
› The largest portion of Endeavour’s 2017 exploration budget has been allocated to the Ity area in light of its strong prospectivity and potential to further extend the lives of the CIL project and Heap Leach operations.
› A $10 million exploration program totaling approximately 50,000 meters has been planned for 2017
› Exploration in 2017 focused on:
‒ Infill drilling and extension drilling at the Daapleu Mont Ity, Bakatouo and Colline Sud deposits
‒ Drilling on Le Plaque and other targets
‒ Conducting initial drilling campaigns on strong Auger anomalies such as the Yacetouo and Vavoua targets
Ity Mine Drilling Targets
ITY MINE, CÔTE D’IVOIRE Exploration added 515koz in 2016 and outlined new targets
2016 FULL YEAR RESULTS
29
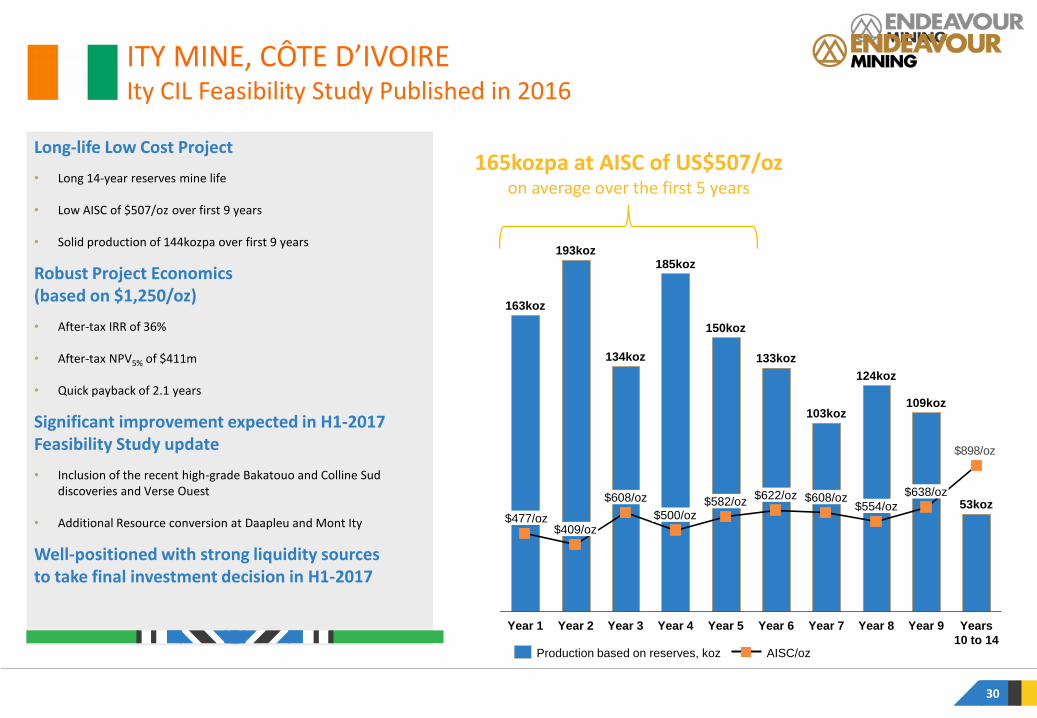
$898/oz
53koz
Years
10 to 14
Year 9
109koz
$638/oz
Year 8
124koz
$554/oz
Year 7
103koz
$608/oz
Year 6
133koz
$622/oz
Year 5
150koz
$582/oz
Year 4
185koz
$500/oz
Year 3
134koz
$608/oz
Year 2
193koz
$409/oz
Year 1
163koz
$477/oz
AISC/oz Production based on reserves, koz
165kozpa at AISC of US$507/oz on average over the first 5 years
Long-life Low Cost Project
• Long 14-year reserves mine life
• Low AISC of $507/oz over first 9 years
• Solid production of 144kozpa over first 9 years
Robust Project Economics (based on $1,250/oz)
• After-tax IRR of 36%
• After-tax NPV5% of $411m
• Quick payback of 2.1 years
Significant improvement expected in H1-2017 Feasibility Study update
• Inclusion of the recent high-grade Bakatouo and Colline Sud discoveries and Verse Ouest
• Additional Resource conversion at Daapleu and Mont Ity
Well-positioned with strong liquidity sources to take final investment decision in H1-2017
ITY MINE, CÔTE D’IVOIRE Ity CIL Feasibility Study Published in 2016
30

Feasibility Study Optimization to Include:
› Recent high-grade Bakatouo and Colline Sud discoveries
› Verse Ouest following recently completed infill drilling program
› Additional Resource conversion at Daapleu and Mont Ity based on planned infill drilling program
Significant opportunity to delineate additional resources at known deposits
and make new discoveries
2016 FULL YEAR RESULTS
31
Deposits to be added in the study
ITY CIL PROJECT, CÔTE D’IVOIRE Feasibility Study to be optimized in Q2-2017
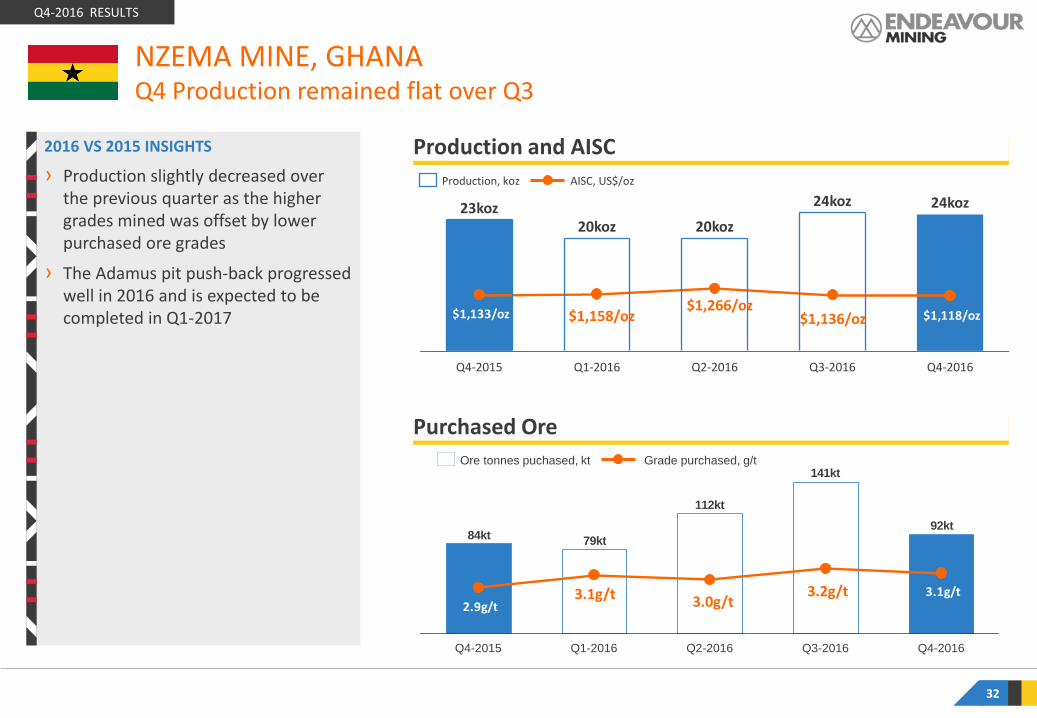
$1,118/oz$1,133/oz
Q4-2016
24koz
Q3-2016
24koz
Q2-2016
20koz
Q1-2016
20koz
Q4-2015
23koz
Purchased Ore
Production and AISC 2016 VS 2015 INSIGHTS
› Production slightly decreased over the previous quarter as the higher grades mined was offset by lower purchased ore grades
› The Adamus pit push-back progressed well in 2016 and is expected to be completed in Q1-2017
NZEMA MINE, GHANA Q4 Production remained flat over Q3
Q4-2016 RESULTS
AISC, US$/oz Production, koz
32
92kt
141kt
112kt
79kt84kt
3.1g/t2.9g/t
Q4-2016 Q3-2016 Q2-2016 Q1-2016 Q4-2015
Grade purchased, g/t Ore tonnes puchased, kt
$1,158/oz $1,266/oz
$1,136/oz
3.2g/t 3.0g/t 3.1g/t
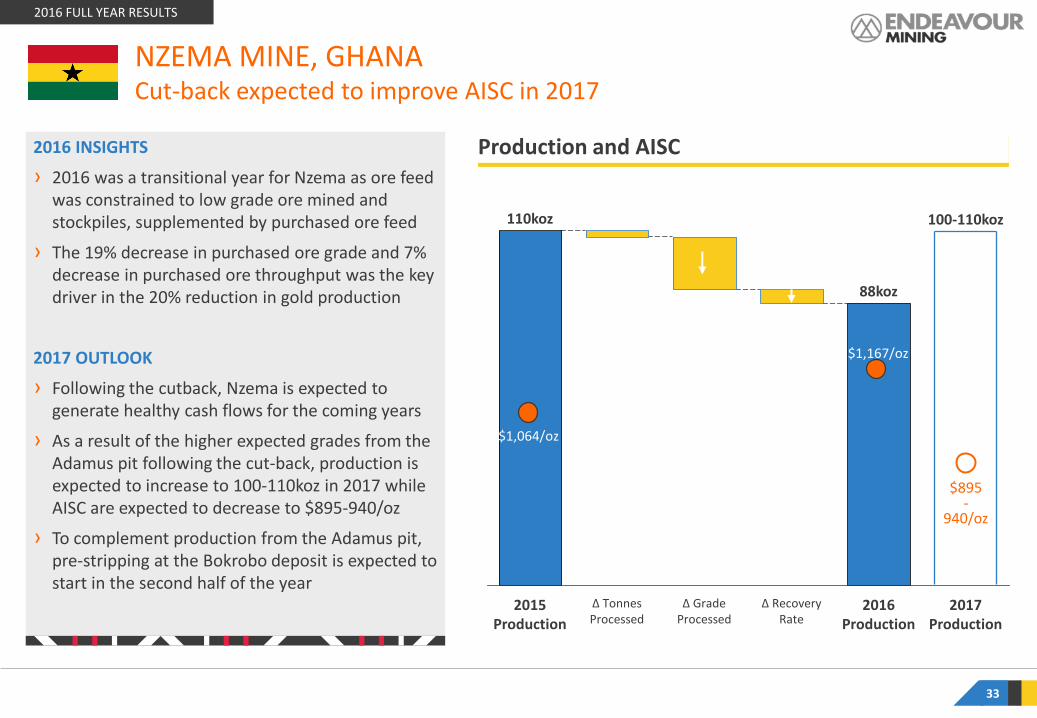
2016 INSIGHTS
› 2016 was a transitional year for Nzema as ore feed was constrained to low grade ore mined and stockpiles, supplemented by purchased ore feed
› The 19% decrease in purchased ore grade and 7% decrease in purchased ore throughput was the key driver in the 20% reduction in gold production
2017 OUTLOOK
› Following the cutback, Nzema is expected to generate healthy cash flows for the coming years
› As a result of the higher expected grades from the Adamus pit following the cut-back, production is expected to increase to 100-110koz in 2017 while AISC are expected to decrease to $895-940/oz
› To complement production from the Adamus pit, pre-stripping at the Bokrobo deposit is expected to start in the second half of the year
NZEMA MINE, GHANA Cut-back expected to improve AISC in 2017
2016 FULL YEAR RESULTS
33
Production and AISC
Δ Grade Processed
2015 Production
110koz
Δ Tonnes Processed
100-110koz
2017 Production
88koz
2016 Production
Δ Recovery Rate
$1,064/oz
$1,167/oz
$895 -
940/oz
Process throughput continues to ramp-up
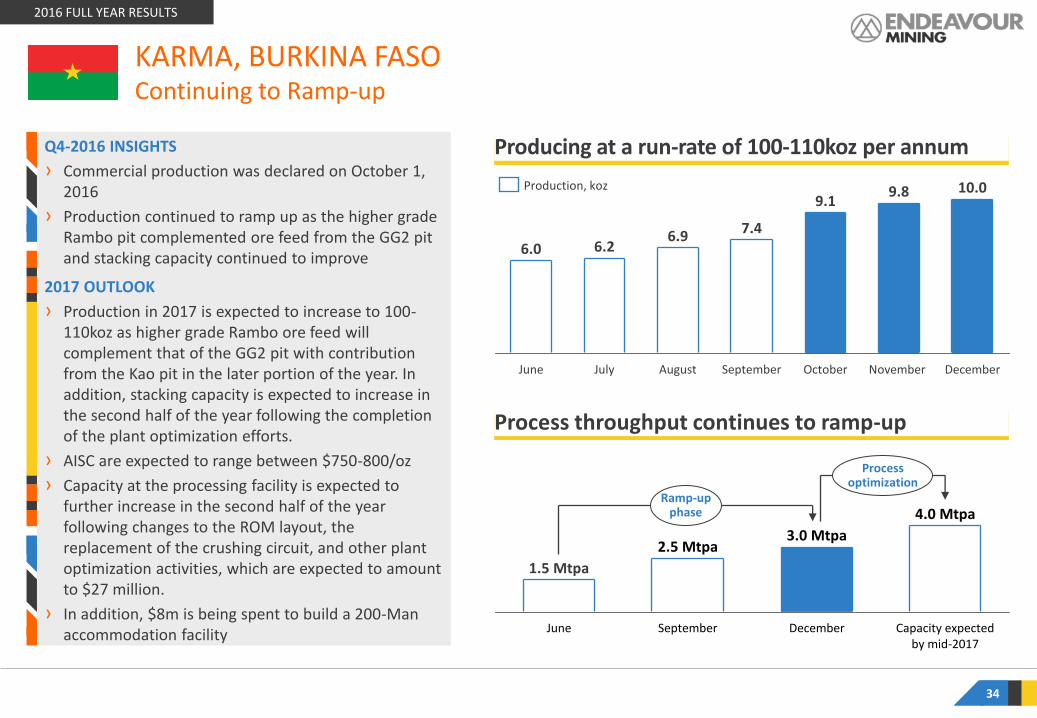
Producing at a run-rate of 100-110koz per annum Q4-2016 INSIGHTS
› Commercial production was declared on October 1, 2016
› Production continued to ramp up as the higher grade Rambo pit complemented ore feed from the GG2 pit and stacking capacity continued to improve
2017 OUTLOOK
› Production in 2017 is expected to increase to 100-110koz as higher grade Rambo ore feed will complement that of the GG2 pit with contribution from the Kao pit in the later portion of the year. In addition, stacking capacity is expected to increase in the second half of the year following the completion of the plant optimization efforts.
› AISC are expected to range between $750-800/oz
› Capacity at the processing facility is expected to further increase in the second half of the year following changes to the ROM layout, the replacement of the crushing circuit, and other plant optimization activities, which are expected to amount to $27 million.
› In addition, $8m is being spent to build a 200-Man accommodation facility
KARMA, BURKINA FASO Continuing to Ramp-up
2016 FULL YEAR RESULTS
6.0
December
6.2
June
10.0
7.4
November August July
6.9
9.8
October September
9.1 Production, koz
Process optimization
December
4.0 Mtpa
Capacity expected by mid-2017
Ramp-up phase
2.5 Mtpa 3.0 Mtpa
September
1.5 Mtpa
June
34
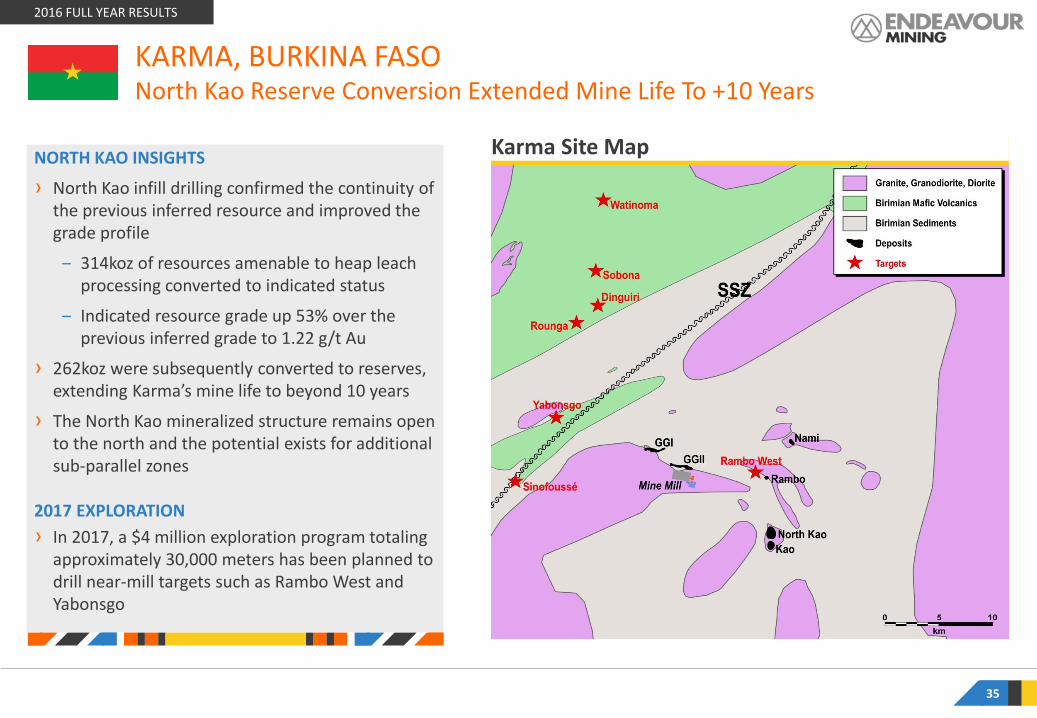
Karma Site Map NORTH KAO INSIGHTS
› North Kao infill drilling confirmed the continuity of the previous inferred resource and improved the grade profile
‒ 314koz of resources amenable to heap leach processing converted to indicated status
‒ Indicated resource grade up 53% over the previous inferred grade to 1.22 g/t Au
› 262koz were subsequently converted to reserves, extending Karma’s mine life to beyond 10 years
› The North Kao mineralized structure remains open to the north and the potential exists for additional sub-parallel zones
2017 EXPLORATION
› In 2017, a $4 million exploration program totaling approximately 30,000 meters has been planned to drill near-mill targets such as Rambo West and Yabonsgo
KARMA, BURKINA FASO North Kao Reserve Conversion Extended Mine Life To +10 Years
2016 FULL YEAR RESULTS
35

Procurement Was 80% Complete At Year-end SIGNIFICANT ACHIEVEMENTS TO-DATE: › Construction is progressing as planned, with over 65% completed
› Over 2.7 million man-hours have been worked without LTI.
› The 38km long, 91kv overhead power line construction over 60% complete. First power from Sonabel is scheduled for August 2017.
› Open pit pre-strip mining at the Main Vindaloo open pit, adjacent the processing facility, commenced in late 2016.
› Detailed engineering of the processing facility along with the design HAZOP has been completed, also ahead of schedule in November 2016.
› TSF progressing ahead of schedule with 60% already completed.
› CIL ring beam concrete pour was achieved in early August 2016, and the SAG and Ball Mill first lift on both plinths was completed by year-end.
› The construction of the water harvest dam decant system is complete, with water already being pumped to the water storage dam two months ahead of schedule.
› Construction of the 300-person permanent accommodation village is approaching completion.
› Over 2,000 personnel including contractors are currently employed on-site, more than 94% of which are Burkinabe.
› Full back-up 26Mw power gensets has been awarded. This is on schedule to be operational in Q3-2017.
› The land compensation process has been successfully completed and resettlement commenced in early 2017.
HOUNDÉ PROJECT, BURKINA FASO Construction Progressing On-time And On-budget
2016 FULL YEAR RESULTS
302
$210m
Total Capex (incl. $26m contigency)
$328m
$100m
Committed Capex (end of dec)
Incurred Capex (end of Dec.)
26 contingency
36
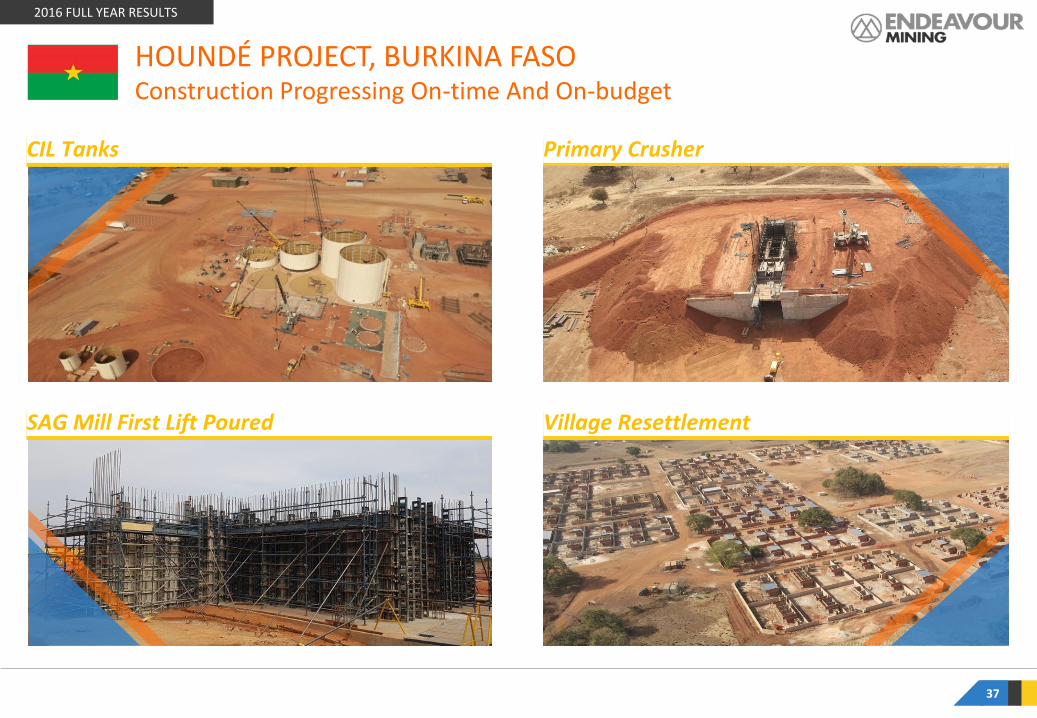
CIL Tanks Primary Crusher
SAG Mill First Lift Poured Village Resettlement
37
2016 FULL YEAR RESULTS
HOUNDÉ PROJECT, BURKINA FASO Construction Progressing On-time And On-budget
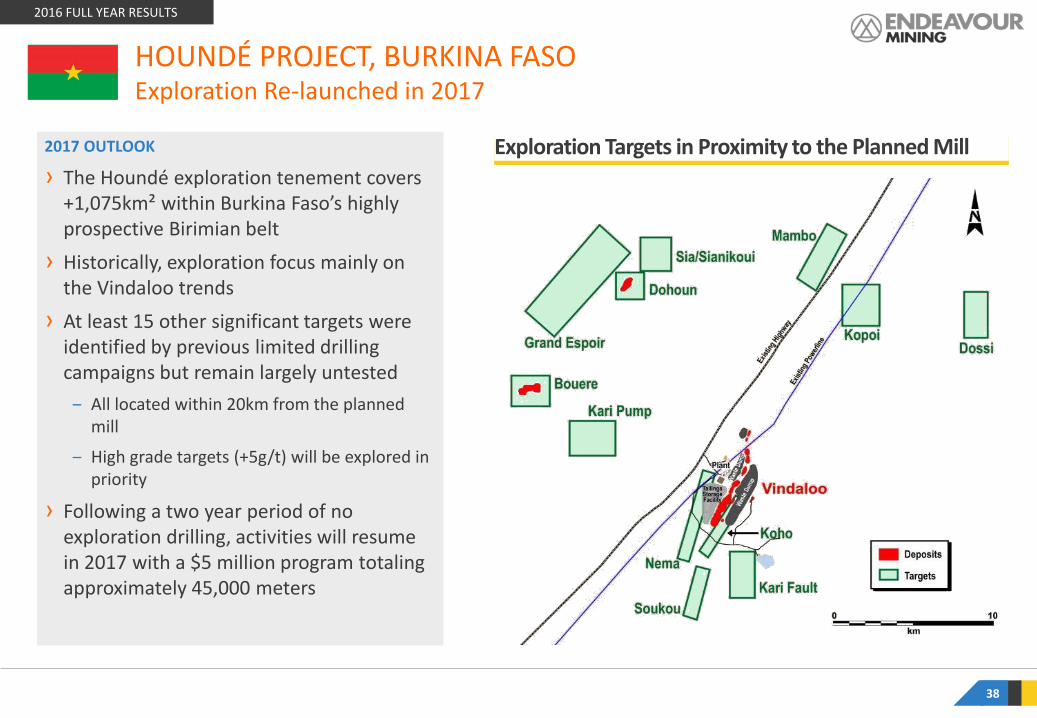
Exploration Targets in Proximity to the Planned Mill 2017 OUTLOOK
› The Houndé exploration tenement covers +1,075km² within Burkina Faso’s highly prospective Birimian belt
› Historically, exploration focus mainly on the Vindaloo trends
› At least 15 other significant targets were identified by previous limited drilling campaigns but remain largely untested
‒ All located within 20km from the planned mill
‒ High grade targets (+5g/t) will be explored in priority
› Following a two year period of no exploration drilling, activities will resume in 2017 with a $5 million program totaling approximately 45,000 meters
2016 FULL YEAR RESULTS
38
HOUNDÉ PROJECT, BURKINA FASO Exploration Re-launched in 2017
OPERATIONAL AND FINANCIAL SUMMARY 1
APPENDIX 4
DETAILS BY MINE AND PROJECT 2
CONCLUSION 3
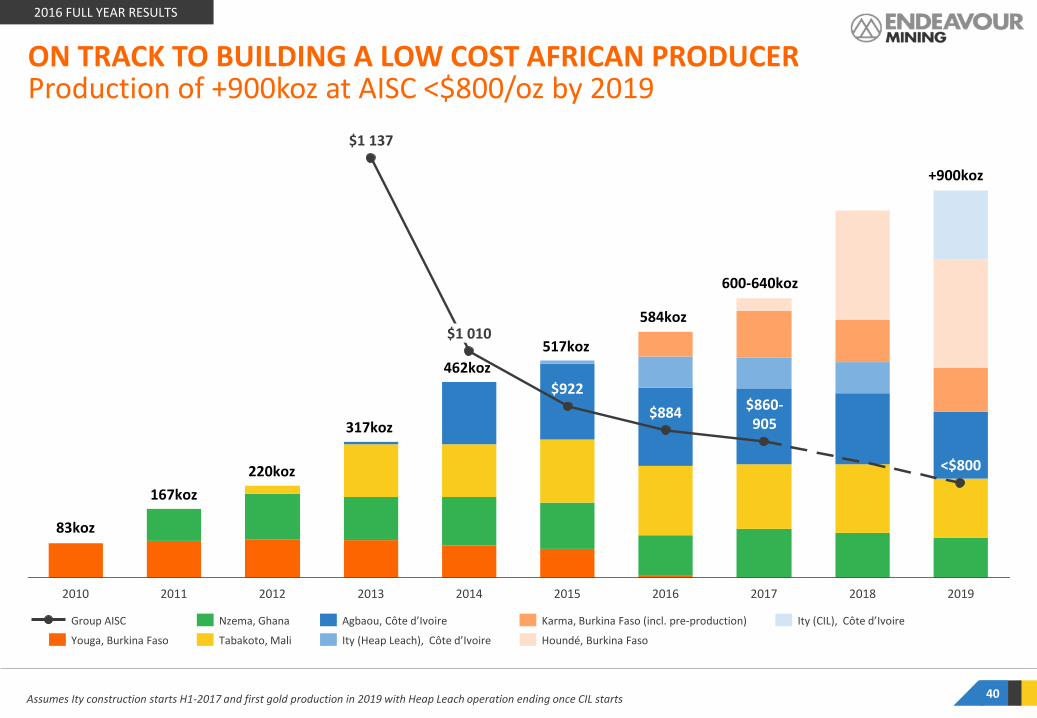
2019
<$800
2018 2017
$860- 905
2016
$884
2015
$922
2014
$1 010
2013
$1 137
2012 2011 2010
ON TRACK TO BUILDING A LOW COST AFRICAN PRODUCER Production of +900koz at AISC <$800/oz by 2019
Assumes Ity construction starts H1-2017 and first gold production in 2019 with Heap Leach operation ending once CIL starts
2016 FULL YEAR RESULTS
Ity (CIL), Côte d’Ivoire Karma, Burkina Faso (incl. pre-production)
Houndé, Burkina Faso Ity (Heap Leach), Côte d’Ivoire
Agbaou, Côte d’Ivoire
Tabakoto, Mali
Nzema, Ghana
Youga, Burkina Faso
Group AISC
83koz
167koz
220koz
317koz
462koz
517koz
+900koz
584koz
600-640koz
40
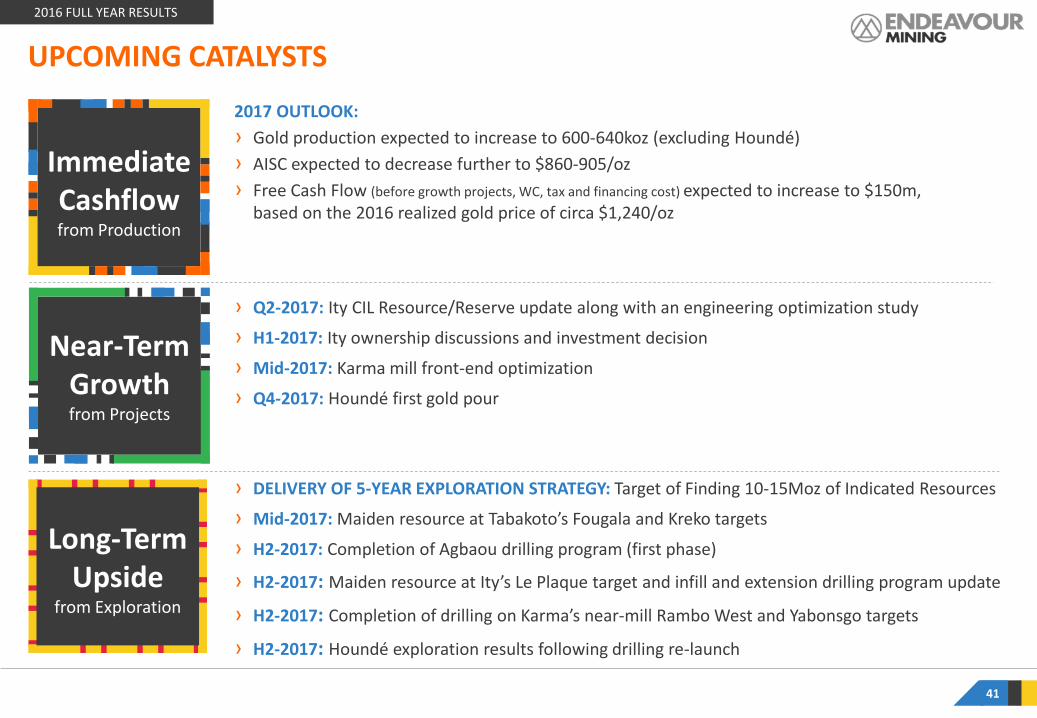
UPCOMING CATALYSTS
41
2016 FULL YEAR RESULTS
Immediate Cashflow from Production
Near-Term Growth from Projects
Long-Term Upside
from Exploration
2017 OUTLOOK:
› Gold production expected to increase to 600-640koz (excluding Houndé)
› AISC expected to decrease further to $860-905/oz
› Free Cash Flow (before growth projects, WC, tax and financing cost) expected to increase to $150m, based on the 2016 realized gold price of circa $1,240/oz
› Q2-2017: Ity CIL Resource/Reserve update along with an engineering optimization study
› H1-2017: Ity ownership discussions and investment decision
› Mid-2017: Karma mill front-end optimization
› Q4-2017: Houndé first gold pour
› DELIVERY OF 5-YEAR EXPLORATION STRATEGY: Target of Finding 10-15Moz of Indicated Resources
› Mid-2017: Maiden resource at Tabakoto’s Fougala and Kreko targets
› H2-2017: Completion of Agbaou drilling program (first phase)
› H2-2017: Maiden resource at Ity’s Le Plaque target and infill and extension drilling program update
› H2-2017: Completion of drilling on Karma’s near-mill Rambo West and Yabonsgo targets
› H2-2017: Houndé exploration results following drilling re-launch
OPERATIONAL AND FINANCIAL SUMMARY 1
APPENDIX 4
DETAILS BY MINE AND PROJECT 2
CONCLUSION 3
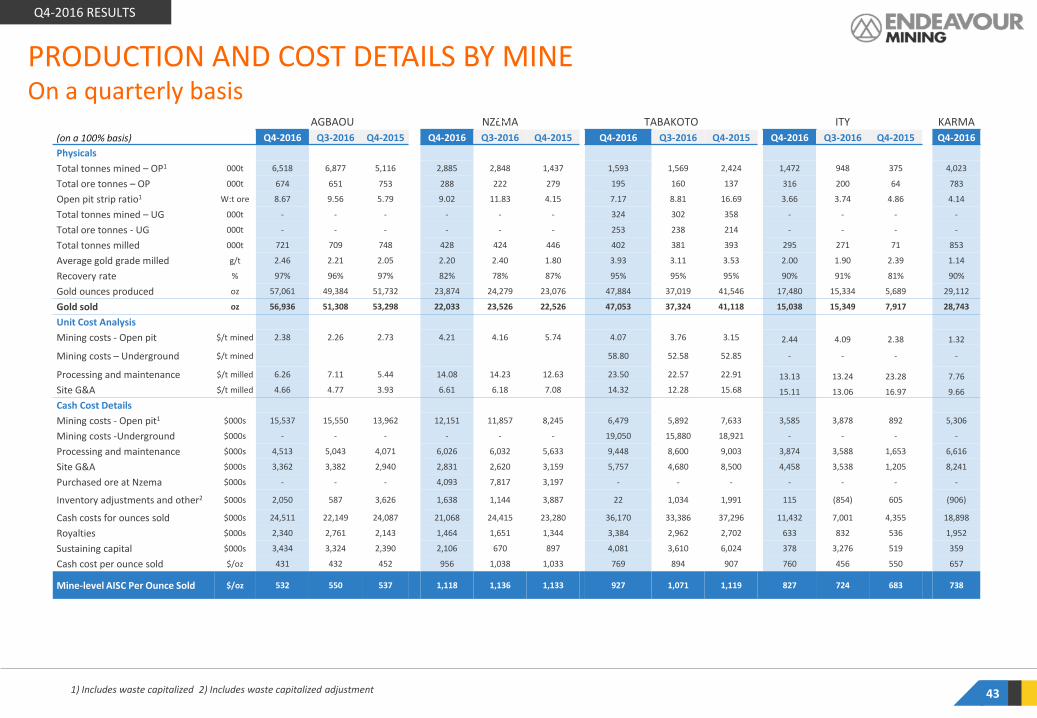
PRODUCTION AND COST DETAILS BY MINE On a quarterly basis
1) Includes waste capitalized 2) Includes waste capitalized adjustment
(on a 100% basis)
AGBAOU NZEMA TABAKOTO ITY KARMA Unit Q4-2016 Q3-2016 Q4-2015 Q4-2016 Q3-2016 Q4-2015 Q4-2016 Q3-2016 Q4-2015 Q4-2016 Q3-2016 Q4-2015 Q4-2016
Physicals
Total tonnes mined – OP1 000t 6,518 6,877 5,116 2,885 2,848 1,437 1,593 1,569 2,424 1,472 948 375 4,023
Total ore tonnes – OP 000t 674 651 753 288 222 279 195 160 137 316 200 64 783
Open pit strip ratio1 W:t ore 8.67 9.56 5.79 9.02 11.83 4.15 7.17 8.81 16.69 3.66 3.74 4.86 4.14
Total tonnes mined – UG 000t - - - - - - 324 302 358 - - - -
Total ore tonnes - UG 000t - - - - - - 253 238 214 - - - -
Total tonnes milled 000t 721 709 748 428 424 446 402 381 393 295 271 71 853
Average gold grade milled g/t 2.46 2.21 2.05 2.20 2.40 1.80 3.93 3.11 3.53 2.00 1.90 2.39 1.14
Recovery rate % 97% 96% 97% 82% 78% 87% 95% 95% 95% 90% 91% 81% 90%
Gold ounces produced oz 57,061 49,384 51,732 23,874 24,279 23,076 47,884 37,019 41,546 17,480 15,334 5,689 29,112
Gold sold oz 56,936 51,308 53,298 22,033 23,526 22,526 47,053 37,324 41,118 15,038 15,349 7,917 28,743
Unit Cost Analysis
Mining costs - Open pit $/t mined 2.38 2.26 2.73 4.21 4.16 5.74 4.07 3.76 3.15 2.44 4.09 2.38 1.32
Mining costs – Underground $/t mined 58.80 52.58 52.85 - - - -
Processing and maintenance $/t milled 6.26 7.11 5.44 14.08 14.23 12.63 23.50 22.57 22.91 13.13 13.24 23.28 7.76
Site G&A $/t milled 4.66 4.77 3.93 6.61 6.18 7.08 14.32 12.28 15.68 15.11 13.06 16.97 9.66
Cash Cost Details
Mining costs - Open pit1 $000s 15,537 15,550 13,962 12,151 11,857 8,245 6,479 5,892 7,633 3,585 3,878 892 5,306
Mining costs -Underground $000s - - - - - - 19,050 15,880 18,921 - - - -
Processing and maintenance $000s 4,513 5,043 4,071 6,026 6,032 5,633 9,448 8,600 9,003 3,874 3,588 1,653 6,616
Site G&A $000s 3,362 3,382 2,940 2,831 2,620 3,159 5,757 4,680 8,500 4,458 3,538 1,205 8,241
Purchased ore at Nzema $000s - - - 4,093 7,817 3,197 - - - - - - -
Inventory adjustments and other2 $000s 2,050 587 3,626 1,638 1,144 3,887 22 1,034 1,991 115 (854) 605 (906)
Cash costs for ounces sold $000s 24,511 22,149 24,087 21,068 24,415 23,280 36,170 33,386 37,296 11,432 7,001 4,355 18,898
Royalties $000s 2,340 2,761 2,143 1,464 1,651 1,344 3,384 2,962 2,702 633 832 536 1,952
Sustaining capital $000s 3,434 3,324 2,390 2,106 670 897 4,081 3,610 6,024 378 3,276 519 359
Cash cost per ounce sold $/oz 431 432 452 956 1,038 1,033 769 894 907 760 456 550 657
Mine-level AISC Per Ounce Sold $/oz 532 550 537 1,118 1,136 1,133 927 1,071 1,119 827 724 683 738
43
Q4-2016 RESULTS
43
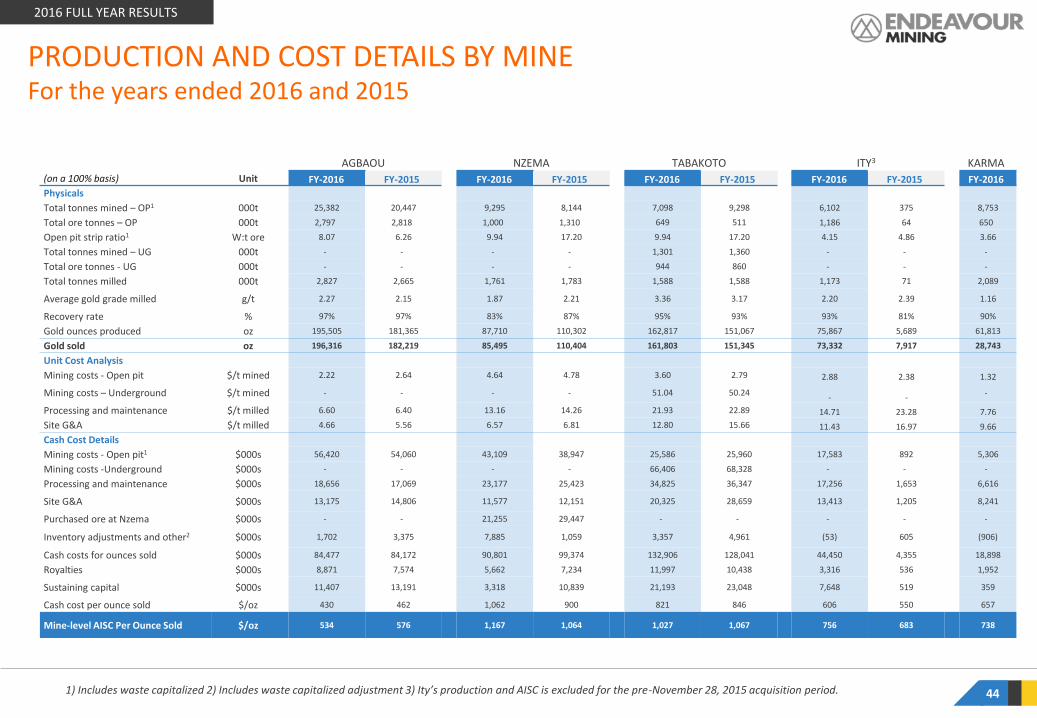
(on a 100% basis)
AGBAOU NZEMA TABAKOTO ITY3 KARMA
Unit FY-2016 FY-2015 FY-2016 FY-2015 FY-2016 FY-2015 FY-2016 FY-2015 FY-2016
Physicals
Total tonnes mined – OP1 000t 25,382 20,447 9,295 8,144 7,098 9,298 6,102 375 8,753
Total ore tonnes – OP 000t 2,797 2,818 1,000 1,310 649 511 1,186 64 650
Open pit strip ratio1 W:t ore 8.07 6.26 9.94 17.20 9.94 17.20 4.15 4.86 3.66
Total tonnes mined – UG 000t - - - - 1,301 1,360 - - -
Total ore tonnes - UG 000t - - - - 944 860 - - -
Total tonnes milled 000t 2,827 2,665 1,761 1,783 1,588 1,588 1,173 71 2,089
Average gold grade milled g/t 2.27 2.15 1.87 2.21 3.36 3.17 2.20 2.39 1.16
Recovery rate % 97% 97% 83% 87% 95% 93% 93% 81% 90%
Gold ounces produced oz 195,505 181,365 87,710 110,302 162,817 151,067 75,867 5,689 61,813
Gold sold oz 196,316 182,219 85,495 110,404 161,803 151,345 73,332 7,917 28,743
Unit Cost Analysis
Mining costs - Open pit $/t mined 2.22 2.64 4.64 4.78 3.60 2.79 2.88 2.38 1.32
Mining costs – Underground $/t mined - - - - 51.04 50.24 - -
-
Processing and maintenance $/t milled 6.60 6.40 13.16 14.26 21.93 22.89 14.71 23.28 7.76
Site G&A $/t milled 4.66 5.56 6.57 6.81 12.80 15.66 11.43 16.97 9.66
Cash Cost Details
Mining costs - Open pit1 $000s 56,420 54,060 43,109 38,947 25,586 25,960 17,583 892 5,306
Mining costs -Underground $000s - - - - 66,406 68,328 - - -
Processing and maintenance $000s 18,656 17,069 23,177 25,423 34,825 36,347 17,256 1,653 6,616
Site G&A $000s 13,175 14,806 11,577 12,151 20,325 28,659 13,413 1,205 8,241
Purchased ore at Nzema $000s - - 21,255 29,447 - - - - -
Inventory adjustments and other2 $000s 1,702 3,375 7,885 1,059 3,357 4,961 (53) 605 (906)
Cash costs for ounces sold $000s 84,477 84,172 90,801 99,374 132,906 128,041 44,450 4,355 18,898
Royalties $000s 8,871 7,574 5,662 7,234 11,997 10,438 3,316 536 1,952
Sustaining capital $000s 11,407 13,191 3,318 10,839 21,193 23,048 7,648 519 359
Cash cost per ounce sold $/oz 430 462 1,062 900 821 846 606 550 657
Mine-level AISC Per Ounce Sold $/oz 534 576 1,167 1,064 1,027 1,067 756 683 738
PRODUCTION AND COST DETAILS BY MINE For the years ended 2016 and 2015
1) Includes waste capitalized 2) Includes waste capitalized adjustment 3) Ity’s production and AISC is excluded for the pre-November 28, 2015 acquisition period.
2016 FULL YEAR RESULTS
44
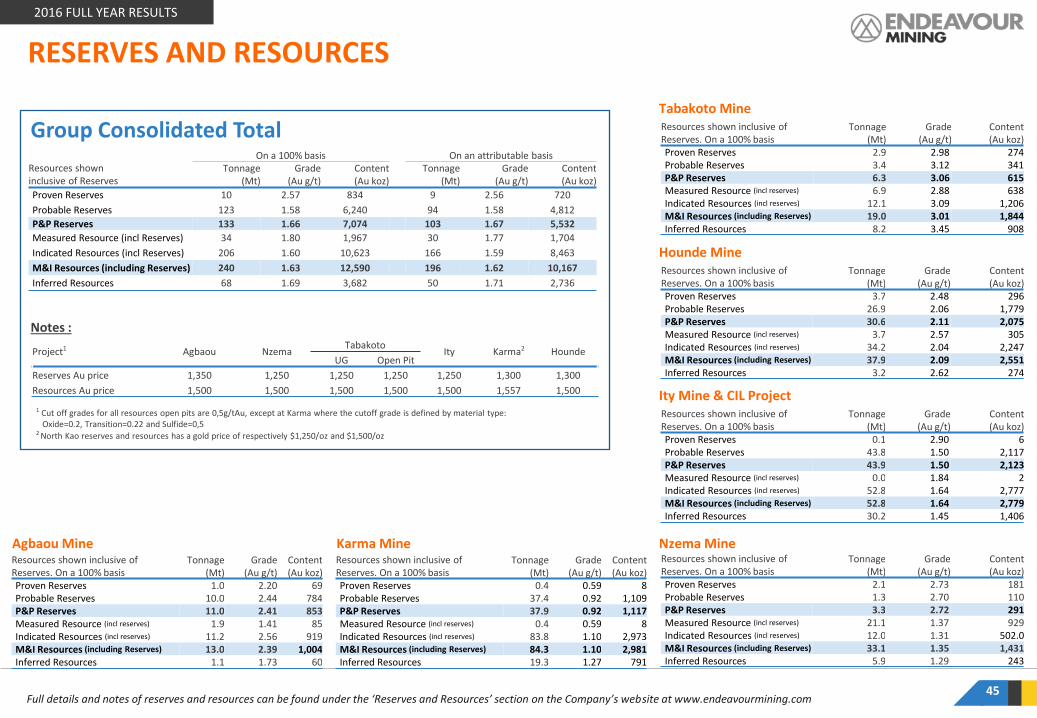
RESERVES AND RESOURCES
Full details and notes of reserves and resources can be found under the ‘Reserves and Resources’ section on the Company’s website at www.endeavourmining.com 45
2016 FULL YEAR RESULTS
On a 100% basis On an attributable basis Resources shown inclusive of Reserves
Tonnage (Mt)
Grade (Au g/t)
Content (Au koz)
Tonnage (Mt)
Grade (Au g/t)
Content (Au koz)
Proven Reserves 10 2.57 834 9 2.56 720
Probable Reserves 123 1.58 6,240 94 1.58 4,812
P&P Reserves 133 1.66 7,074 103 1.67 5,532
Measured Resource (incl Reserves) 34 1.80 1,967 30 1.77 1,704
Indicated Resources (incl Reserves) 206 1.60 10,623 166 1.59 8,463
M&I Resources (including Reserves) 240 1.63 12,590 196 1.62 10,167
Inferred Resources 68 1.69 3,682 50 1.71 2,736
Group Consolidated Total
Resources shown inclusive of Reserves. On a 100% basis
Tonnage (Mt)
Grade (Au g/t)
Content (Au koz)
Proven Reserves 0.1 2.90 6 Probable Reserves 43.8 1.50 2,117 P&P Reserves 43.9 1.50 2,123 Measured Resource (incl reserves) 0.0 1.84 2 Indicated Resources (incl reserves) 52.8 1.64 2,777 M&I Resources (including Reserves) 52.8 1.64 2,779 Inferred Resources 30.2 1.45 1,406
Ity Mine & CIL Project
Resources shown inclusive of Reserves. On a 100% basis
Tonnage (Mt)
Grade (Au g/t)
Content (Au koz)
Proven Reserves 2.1 2.73 181 Probable Reserves 1.3 2.70 110 P&P Reserves 3.3 2.72 291 Measured Resource (incl reserves) 21.1 1.37 929 Indicated Resources (incl reserves) 12.0 1.31 502.0 M&I Resources (including Reserves) 33.1 1.35 1,431 Inferred Resources 5.9 1.29 243
Nzema Mine
Resources shown inclusive of Reserves. On a 100% basis
Tonnage (Mt)
Grade (Au g/t)
Content (Au koz)
Proven Reserves 2.9 2.98 274 Probable Reserves 3.4 3.12 341 P&P Reserves 6.3 3.06 615 Measured Resource (incl reserves) 6.9 2.88 638 Indicated Resources (incl reserves) 12.1 3.09 1,206 M&I Resources (including Reserves) 19.0 3.01 1,844 Inferred Resources 8.2 3.45 908
Tabakoto Mine
Resources shown inclusive of Reserves. On a 100% basis
Tonnage (Mt)
Grade (Au g/t)
Content (Au koz)
Proven Reserves 3.7 2.48 296 Probable Reserves 26.9 2.06 1,779 P&P Reserves 30.6 2.11 2,075 Measured Resource (incl reserves) 3.7 2.57 305 Indicated Resources (incl reserves) 34.2 2.04 2,247 M&I Resources (including Reserves) 37.9 2.09 2,551 Inferred Resources 3.2 2.62 274
Hounde Mine
Resources shown inclusive of Reserves. On a 100% basis
Tonnage (Mt)
Grade (Au g/t)
Content (Au koz)
Proven Reserves 1.0 2.20 69 Probable Reserves 10.0 2.44 784 P&P Reserves 11.0 2.41 853 Measured Resource (incl reserves) 1.9 1.41 85 Indicated Resources (incl reserves) 11.2 2.56 919 M&I Resources (including Reserves) 13.0 2.39 1,004 Inferred Resources 1.1 1.73 60
Agbaou Mine Resources shown inclusive of Reserves. On a 100% basis
Tonnage (Mt)
Grade (Au g/t)
Content (Au koz)
Proven Reserves 0.4 0.59 8 Probable Reserves 37.4 0.92 1,109 P&P Reserves 37.9 0.92 1,117 Measured Resource (incl reserves) 0.4 0.59 8 Indicated Resources (incl reserves) 83.8 1.10 2,973 M&I Resources (including Reserves) 84.3 1.10 2,981 Inferred Resources 19.3 1.27 791
Karma Mine
Project1 Agbaou Nzema Tabakoto
Ity Karma2 Hounde UG Open Pit
Reserves Au price 1,350 1,250 1,250 1,250 1,250 1,300 1,300
Resources Au price 1,500 1,500 1,500 1,500 1,500 1,557 1,500
1 Cut off grades for all resources open pits are 0,5g/tAu, except at Karma where the cutoff grade is defined by material type: Oxide=0.2, Transition=0.22 and Sulfide=0,5
2 North Kao reserves and resources has a gold price of respectively $1,250/oz and $1,500/oz
Notes :


![Q4 and full year FY 2016 Earning Presentation [Company Update]](https://img.pdfslide.us/doc/110x75/577c7de81a28abe054a00e9b/q4-and-full-year-fy-2016-earning-presentation-company-update.jpg)