Embed Size (px)
Citation preview

Q4 2019 And Full Year
Earnings ReviewFebruary 4, 2020
2019 (01-14-20) Version 1.0 6:00pm
All-Electric Mustang Mach-E
2
Information Regarding This PresentationForward-Looking Statements
This presentation includes forward-looking statements. Forward-looking statements are based on expectations, forecasts, and assumptions by our management and involve a number of risks, uncertainties, and other factors that could cause actual results to differ materially from those stated. For a discussion of these risks, uncertainties, and other factors, please see the “Cautionary Note on Forward-Looking Statements” at the end of this presentation and “Item 1A. Risk Factors” in our most recent Annual Report on Form 10-K, as updated by additional factors in subsequent filings with the United States Securities and Exchange Commission.
GAAP and Non-GAAP Financial Measures
This presentation includes financial measures calculated in accordance with generally accepted accounting principles (“GAAP”) and non-GAAP financial measures. The non-GAAP financial measures are intended to be considered supplemental information to their comparable GAAP financial measures. The non-GAAP financial measures are defined and reconciled to the most comparable GAAP financial measures in the Appendix to this presentation.
Additional Information
Calculated results may not sum due to rounding. N / M denotes “Not Meaningful.” All variances are year-over-year unless otherwise noted.
3
4
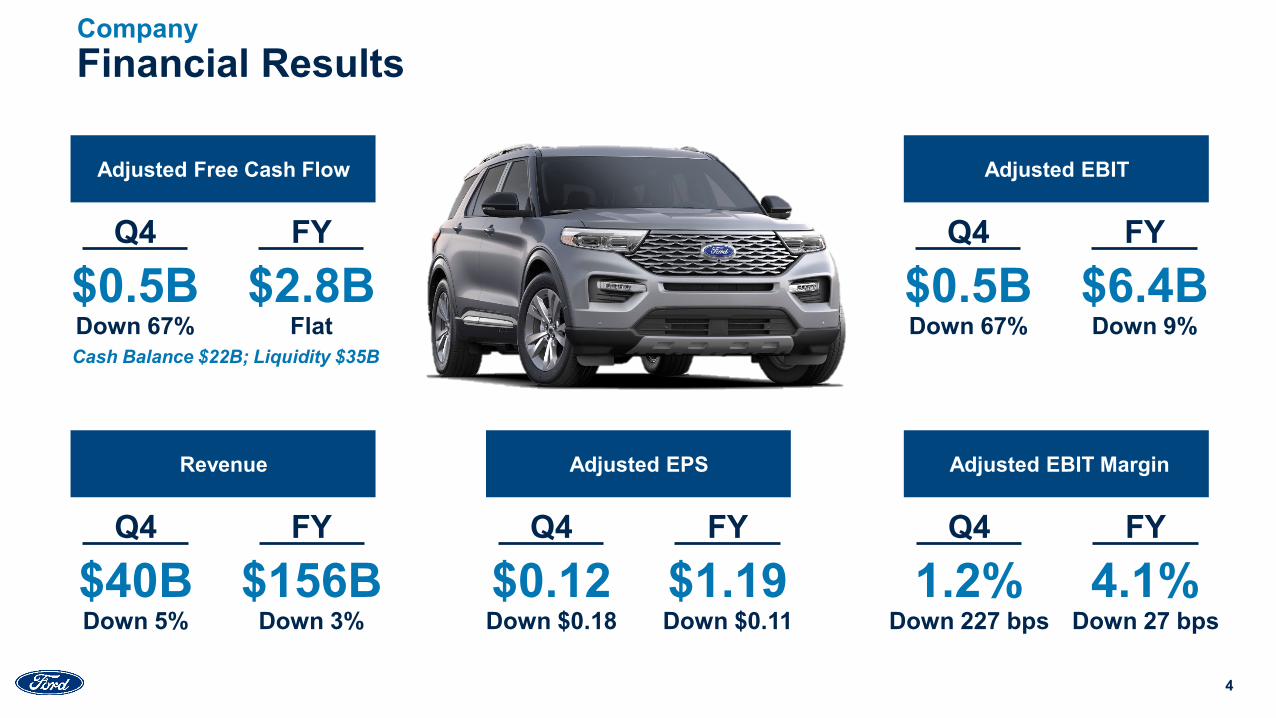
Cash Balance $22B; Liquidity $35B
Financial ResultsCompany
Adjusted EPS Adjusted EBIT Margin
Adjusted EBIT
Down 67%$0.5B
Q4
$6.4BFY
Down 9%
Adjusted Free Cash Flow
Down 67%$0.5B
Q4
$2.8BFY
Flat
Down 5%$40B
Q4
$156BFY
Down 3%
Revenue
Down 227 bps1.2%
Q4
4.1%FY
Down 27 bpsDown $0.18 $0.12
Q4
$1.19FY
Down $0.11
5
Strategic Focus – 2019 Highlights
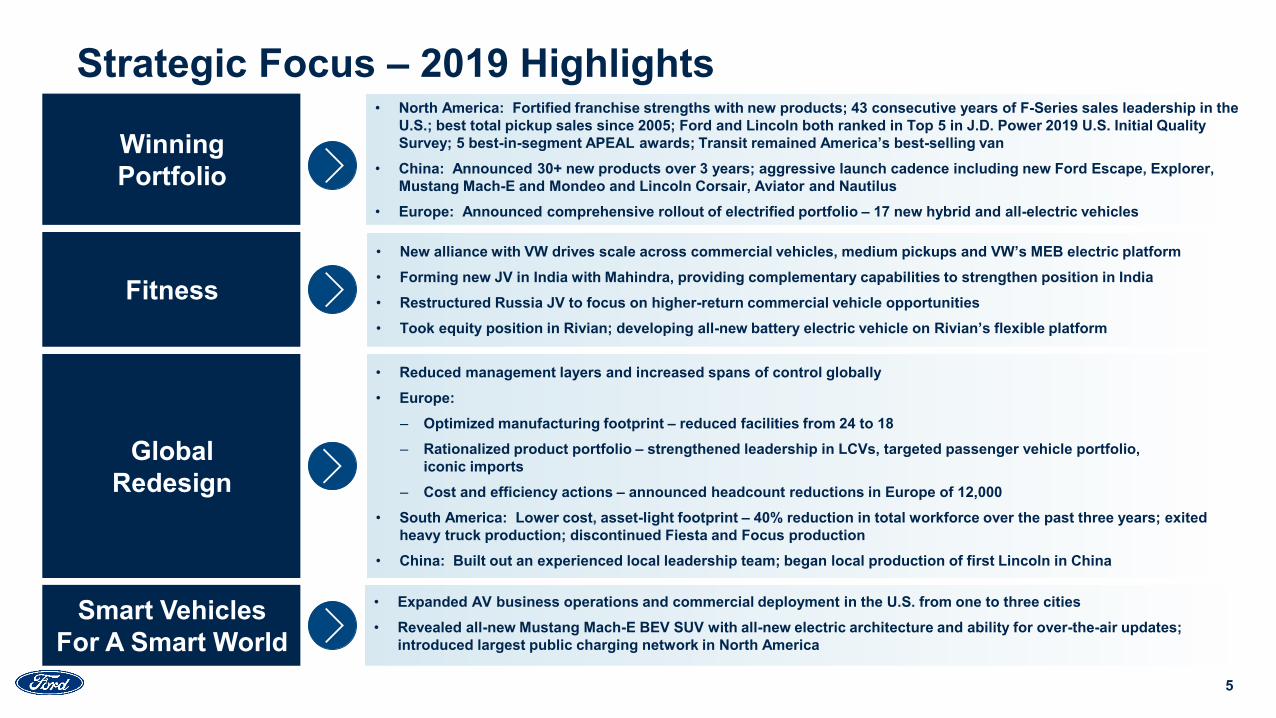
• Reduced management layers and increased spans of control globally• Europe:
– Optimized manufacturing footprint – reduced facilities from 24 to 18– Rationalized product portfolio – strengthened leadership in LCVs, targeted passenger vehicle portfolio,
iconic imports– Cost and efficiency actions – announced headcount reductions in Europe of 12,000
• South America: Lower cost, asset-light footprint – 40% reduction in total workforce over the past three years; exited heavy truck production; discontinued Fiesta and Focus production
• China: Built out an experienced local leadership team; began local production of first Lincoln in China
Global Redesign
• Expanded AV business operations and commercial deployment in the U.S. from one to three cities• Revealed all-new Mustang Mach-E BEV SUV with all-new electric architecture and ability for over-the-air updates;
introduced largest public charging network in North America
Smart Vehicles For A Smart World
• New alliance with VW drives scale across commercial vehicles, medium pickups and VW’s MEB electric platform• Forming new JV in India with Mahindra, providing complementary capabilities to strengthen position in India• Restructured Russia JV to focus on higher-return commercial vehicle opportunities• Took equity position in Rivian; developing all-new battery electric vehicle on Rivian’s flexible platform
Fitness
• North America: Fortified franchise strengths with new products; 43 consecutive years of F-Series sales leadership in the U.S.; best total pickup sales since 2005; Ford and Lincoln both ranked in Top 5 in J.D. Power 2019 U.S. Initial Quality Survey; 5 best-in-segment APEAL awards; Transit remained America’s best-selling van
• China: Announced 30+ new products over 3 years; aggressive launch cadence including new Ford Escape, Explorer, Mustang Mach-E and Mondeo and Lincoln Corsair, Aviator and Nautilus
• Europe: Announced comprehensive rollout of electrified portfolio – 17 new hybrid and all-electric vehicles
Winning Portfolio
6
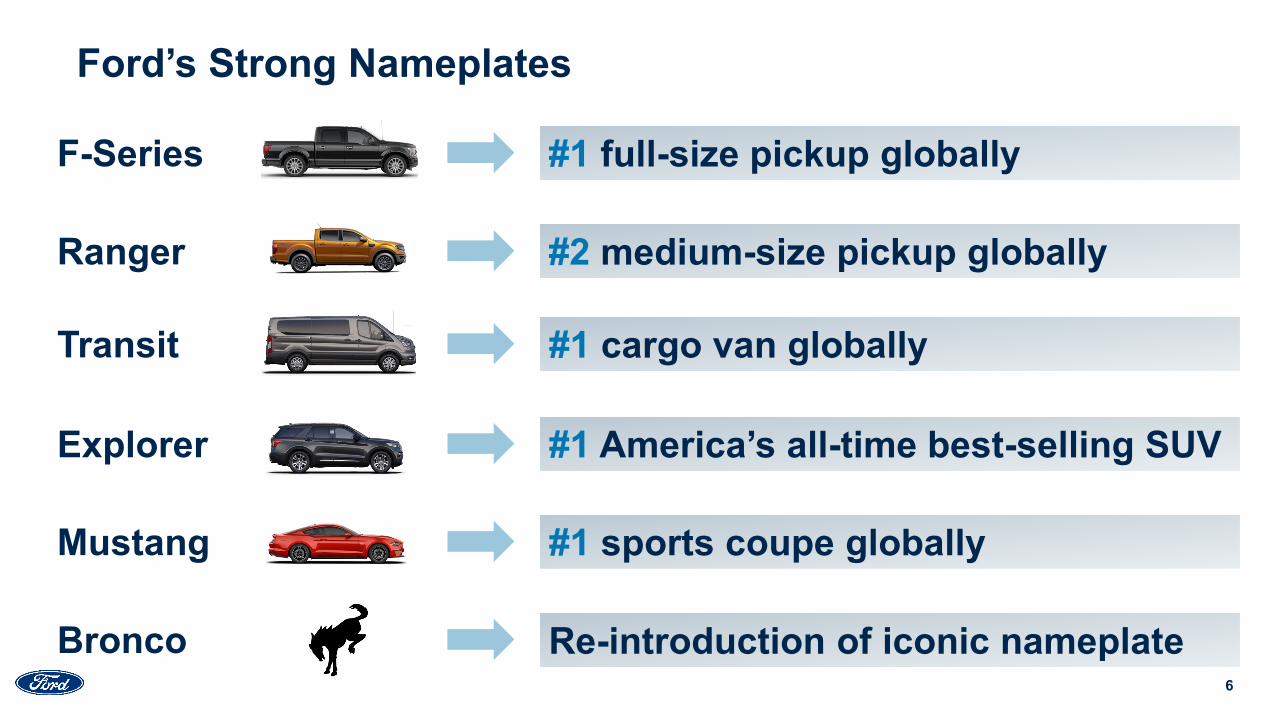
Mustang #1 sports coupe globally
Ford’s Strong Nameplates
Ranger #2 medium-size pickup globally
Explorer #1 America’s all-time best-selling SUV
F-Series #1 full-size pickup globally
Transit #1 cargo van globally
Bronco Re-introduction of iconic nameplate

7
Winning Portfolio
Portfolio Transformation Underway With SignificantNew Introductions From Late 2018 Through Early 2021
Super Duty
North America South America ChinaEurope Asia Pacific Ops Middle East & Africa Hybrid / Electric OfferingNot Yet In Showrooms
Small, RuggedOff-Road Utility
Puma
F-150
Bronco
Ranger
Explorer
AviatorEscape / Kuga
Transit 2T
CorsairTerritoryMustangMach-E
8
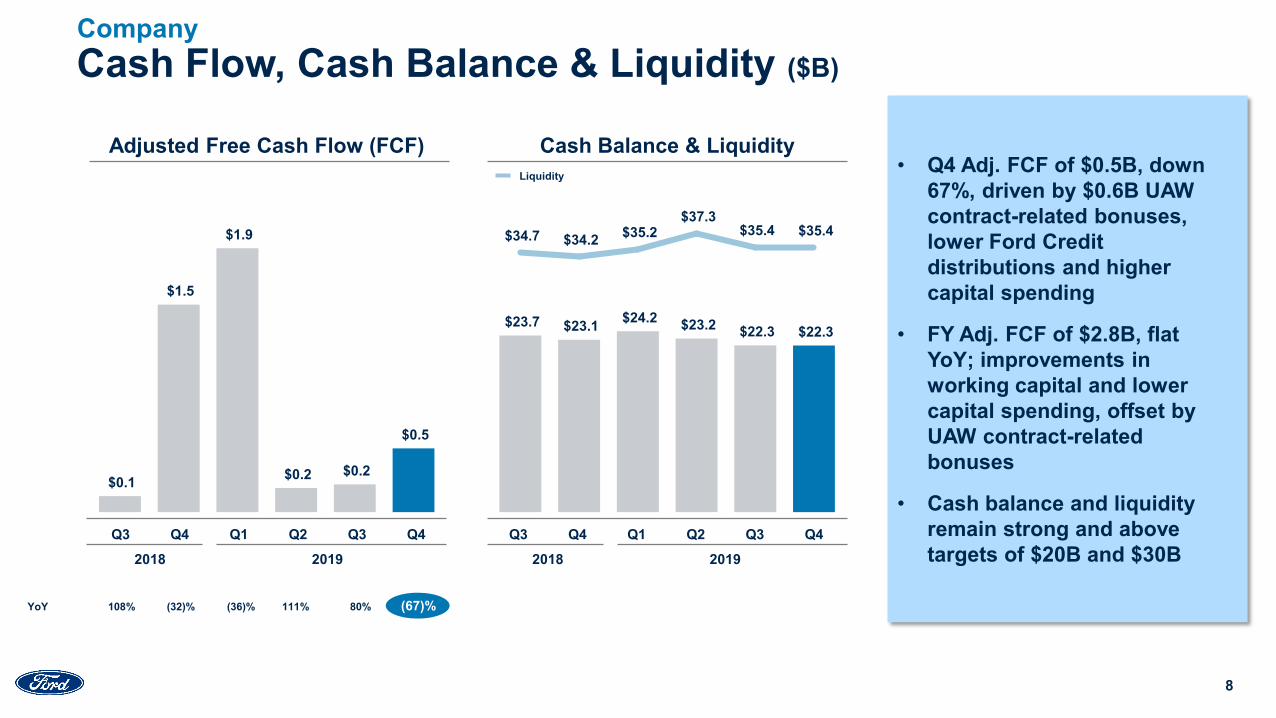
Cash Flow, Cash Balance & Liquidity ($B)
• Q4 Adj. FCF of $0.5B, down 67%, driven by $0.6B UAW contract-related bonuses, lower Ford Credit distributions and higher capital spending
• FY Adj. FCF of $2.8B, flat YoY; improvements in working capital and lower capital spending, offset by UAW contract-related bonuses
• Cash balance and liquidity remain strong and above targets of $20B and $30B
YoY 108% (32)% (36)% 111% 80% (67)%
Company
Adjusted Free Cash Flow (FCF)
$0.1
$1.5
$1.9
$0.2 $0.2
$0.5
Cash Balance & Liquidity
$23.7 $23.1 $24.2 $23.2 $22.3 $22.3
$34.7 $34.2 $35.2 $37.3
$35.4 $35.4
Liquidity
Q3 Q4 Q1 Q2 Q3 Q42018 2019
Q3 Q4 Q1 Q2 Q3 Q42018 2019
9
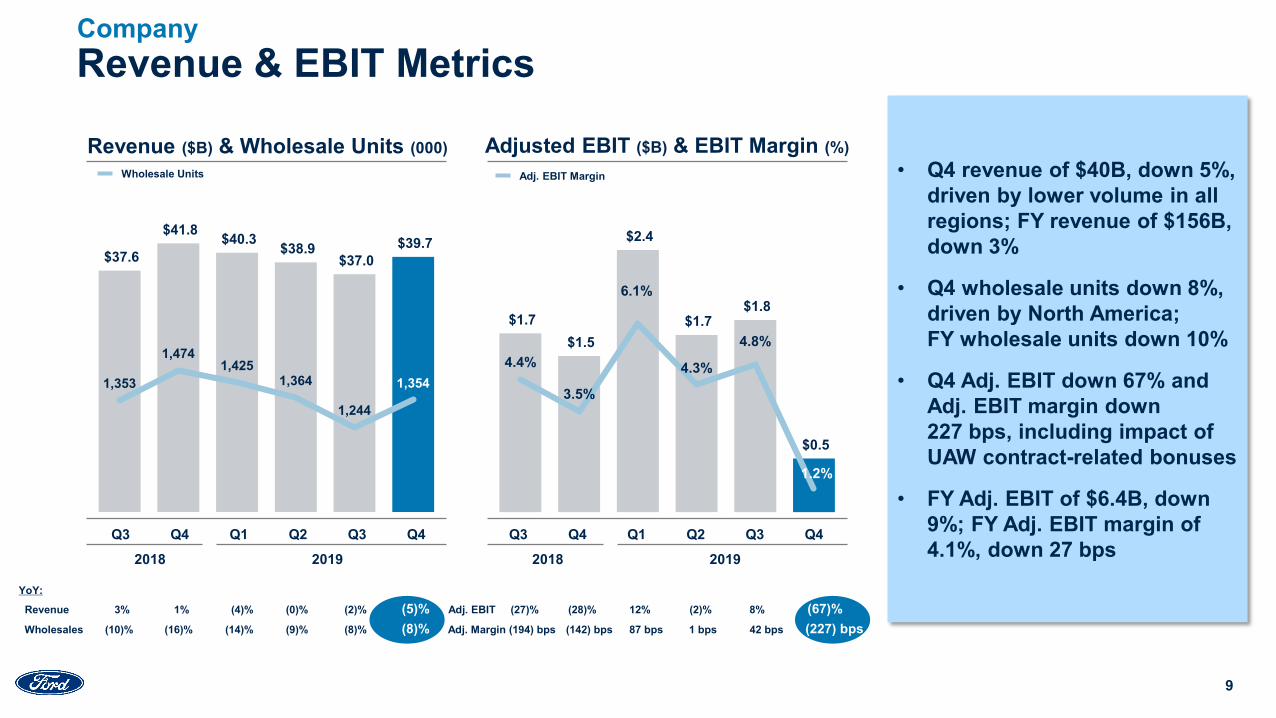
Revenue & EBIT Metrics
• Q4 revenue of $40B, down 5%, driven by lower volume in all regions; FY revenue of $156B, down 3%
• Q4 wholesale units down 8%, driven by North America; FY wholesale units down 10%
• Q4 Adj. EBIT down 67% and Adj. EBIT margin down 227 bps, including impact of UAW contract-related bonuses
• FY Adj. EBIT of $6.4B, down 9%; FY Adj. EBIT margin of 4.1%, down 27 bps
YoY:
Revenue 3% 1% (4)% (0)% (2)% (5)% Adj. EBIT (27)% (28)% 12% (2)% 8% (67)%Wholesales (10)% (16)% (14)% (9)% (8)% (8)% Adj. Margin (194) bps (142) bps 87 bps 1 bps 42 bps (227) bps
Company
Adjusted EBIT ($B) & EBIT Margin (%)
$1.7 $1.5
$2.4
$1.7 $1.8
$0.5
4.4%
3.5%
6.1%
4.3%
4.8%
1.2%
Revenue ($B) & Wholesale Units (000)
$37.6
$41.8 $40.3 $38.9 $37.0
$39.7
1,353
1,4741,425
1,364
1,244
1,354
Wholesale Units Adj. EBIT Margin
Q3 Q4 Q1 Q2 Q3 Q42018 2019
Q3 Q4 Q1 Q2 Q3 Q42018 2019
10
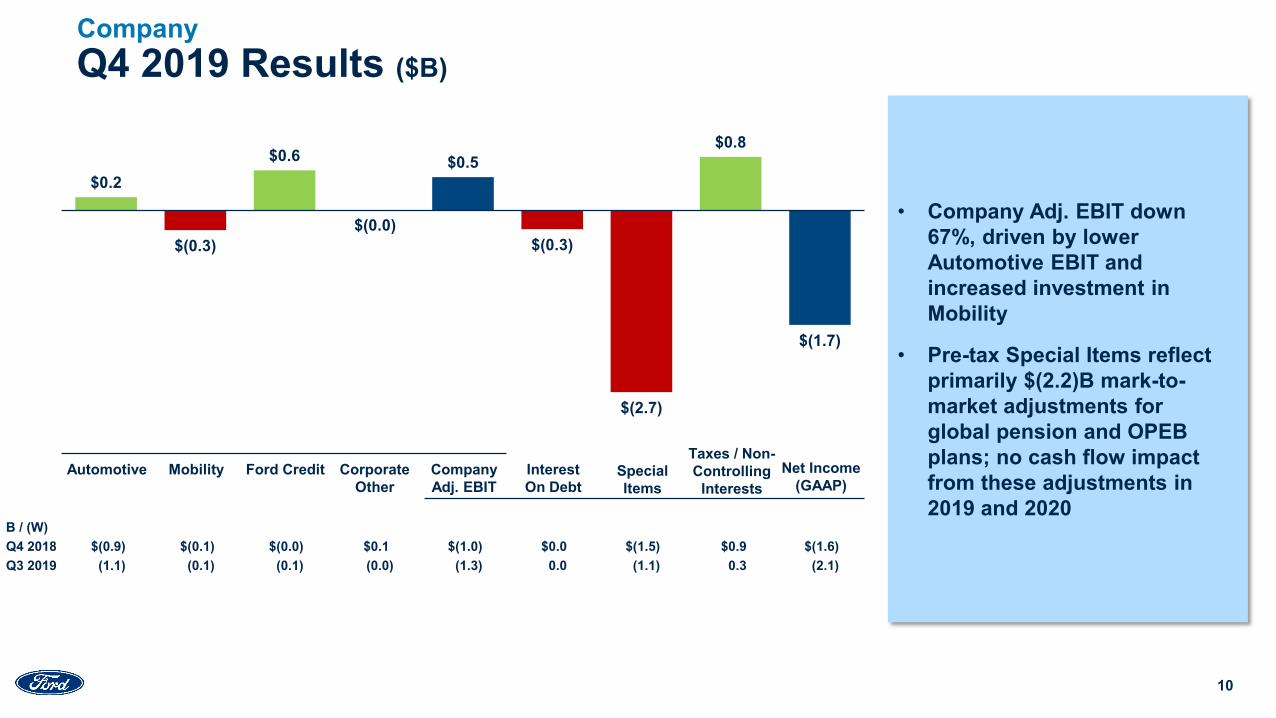
Q4 2019 Results ($B)
Automotive Net Income (GAAP)
Ford CreditMobility Corporate Other
Company Adj. EBIT
Interest On Debt
SpecialItems
Taxes / Non-Controlling
Interests
B / (W) Q4 2018 $(0.9) $(0.1) $(0.0) $0.1 $(1.0) $0.0 $(1.5) $0.9 $(1.6)Q3 2019 (1.1) (0.1) (0.1) (0.0) (1.3) 0.0 (1.1) 0.3 (2.1)
$0.2
$(0.3)
$0.6
$(0.0)
$0.5
$(0.3)
$(2.7)
$0.8
$(1.7)
• Company Adj. EBIT down 67%, driven by lower Automotive EBIT and increased investment in Mobility
• Pre-tax Special Items reflect primarily $(2.2)B mark-to-market adjustments for global pension and OPEB plans; no cash flow impact from these adjustments in 2019 and 2020
Company
11
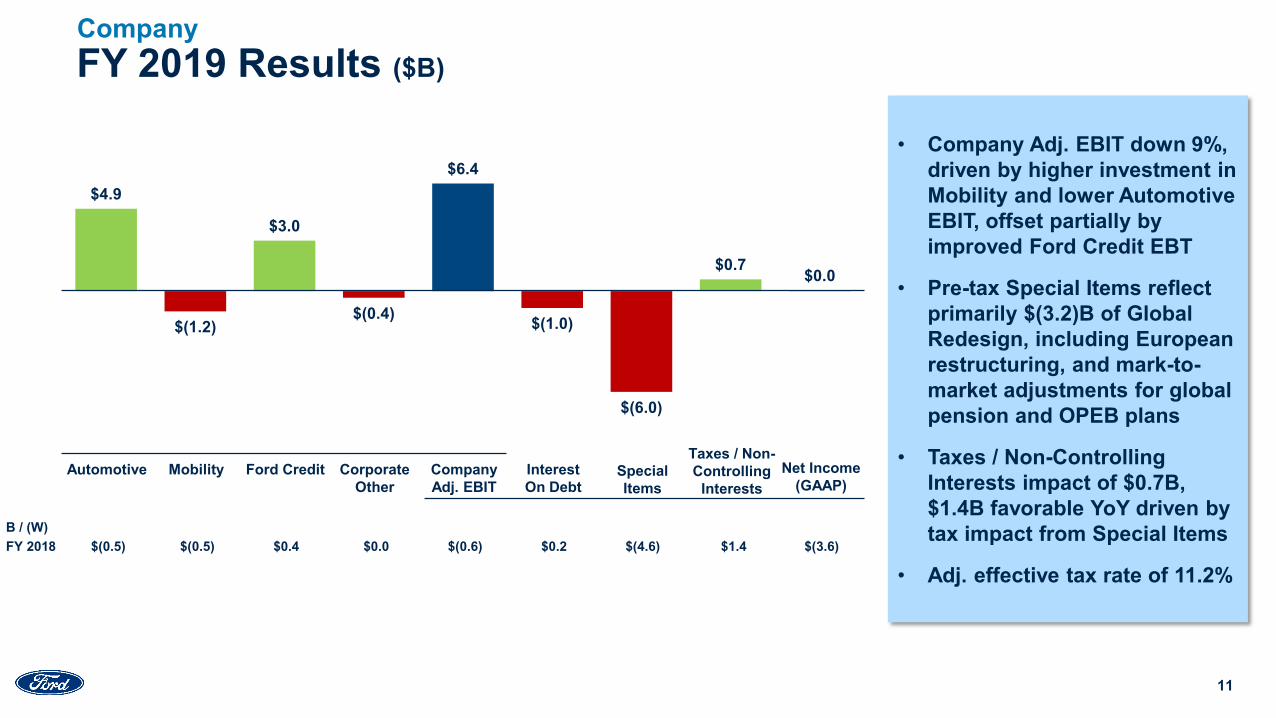
FY 2019 Results ($B)
B / (W) FY 2018 $(0.5) $(0.5) $0.4 $0.0 $(0.6) $0.2 $(4.6) $1.4 $(3.6)
$4.9
$(1.2)
$3.0
$(0.4)
$6.4
$(1.0)
$(6.0)
$0.7 $0.0
• Company Adj. EBIT down 9%, driven by higher investment in Mobility and lower Automotive EBIT, offset partially by improved Ford Credit EBT
• Pre-tax Special Items reflect primarily $(3.2)B of Global Redesign, including European restructuring, and mark-to-market adjustments for global pension and OPEB plans
• Taxes / Non-Controlling Interests impact of $0.7B, $1.4B favorable YoY driven by tax impact from Special Items
• Adj. effective tax rate of 11.2%
Company
Automotive Net Income (GAAP)
Ford CreditMobility Corporate Other
Company Adj. EBIT
Interest On Debt
SpecialItems
Taxes / Non-Controlling
Interests
12
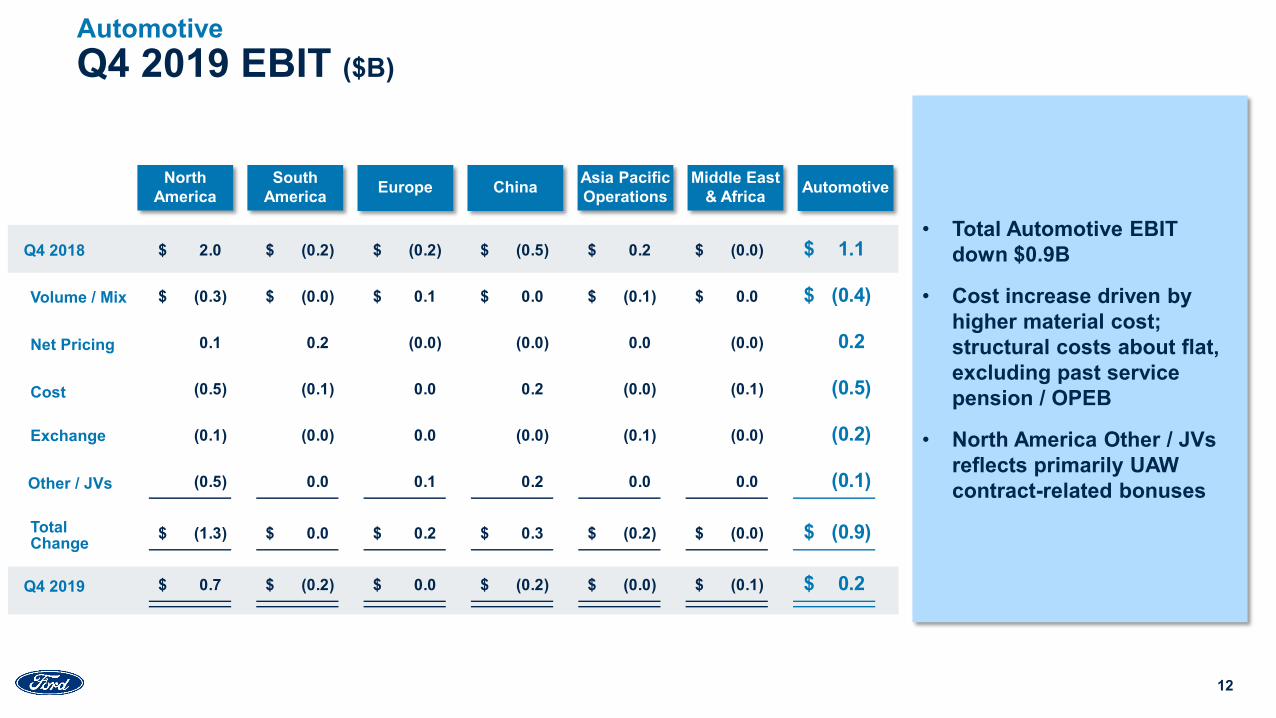
• Total Automotive EBIT down $0.9B
• Cost increase driven by higher material cost; structural costs about flat, excluding past service pension / OPEB
• North America Other / JVs reflects primarily UAW contract-related bonuses
Q4 2019 EBIT ($B)Automotive
Automotive China Middle East& Africa
Q4 2018
NorthAmerica Europe Asia Pacific
OperationsSouth
America
Volume / Mix
Net Pricing
Other / JVs
Cost
Q4 2019
Exchange
TotalChange
2.0$ (0.2)$ (0.2)$ (0.5)$ 0.2$ (0.0)$ 1.1$
(0.3)$ (0.0)$ 0.1$ 0.0$ (0.1)$ 0.0$ (0.4)$
0.1 0.2 (0.0) (0.0) 0.0 (0.0) 0.2
(0.5) (0.1) 0.0 0.2 (0.0) (0.1) (0.5)
(0.1) (0.0) 0.0 (0.0) (0.1) (0.0) (0.2)
(0.5) 0.0 0.1 0.2 0.0 0.0 (0.1)
(1.3)$ 0.0$ 0.2$ 0.3$ (0.2)$ (0.0)$ (0.9)$
0.7$ (0.2)$ 0.0$ (0.2)$ (0.0)$ (0.1)$ 0.2$
13
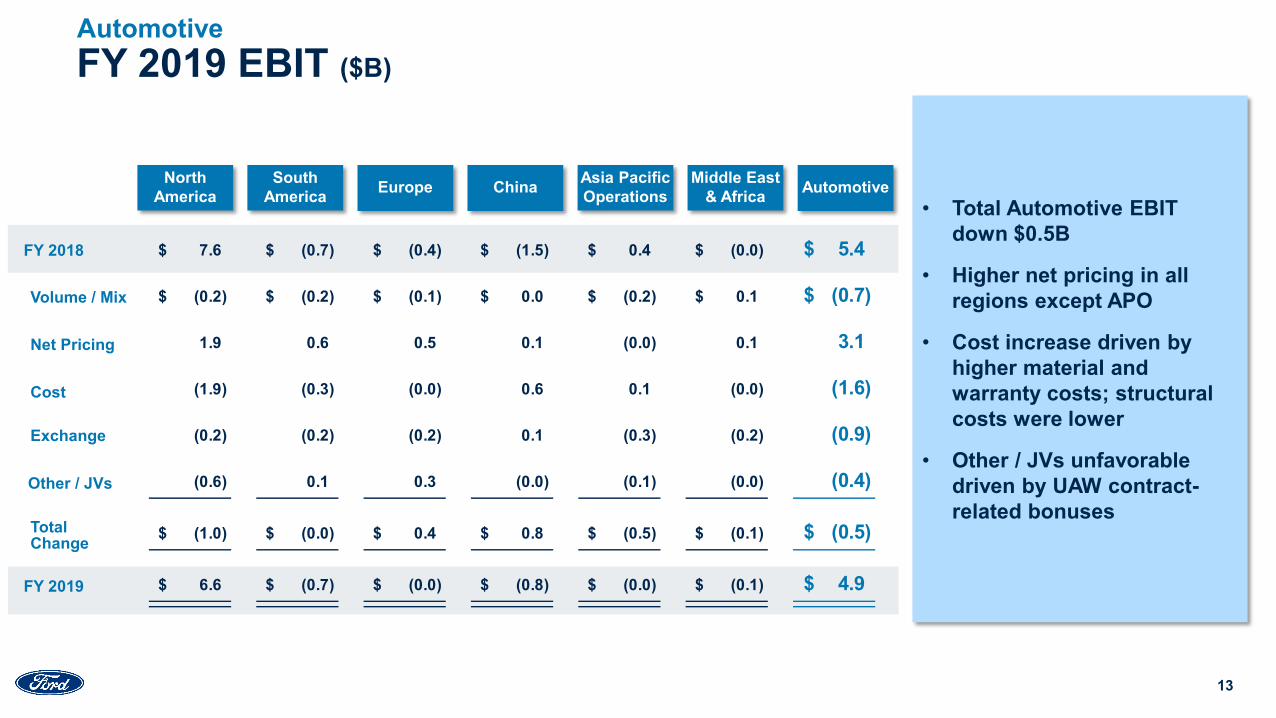
• Total Automotive EBIT down $0.5B
• Higher net pricing in all regions except APO
• Cost increase driven by higher material and warranty costs; structural costs were lower
• Other / JVs unfavorable driven by UAW contract-related bonuses
FY 2019 EBIT ($B)Automotive
Automotive China Middle East& Africa
Volume / Mix
Net Pricing
Other / JVs
Cost
FY 2018
Exchange
TotalChange
NorthAmerica Europe Asia Pacific
OperationsSouth
America
FY 2019
7.6$ (0.7)$ (0.4)$ (1.5)$ 0.4$ (0.0)$ 5.4$
(0.2)$ (0.2)$ (0.1)$ 0.0$ (0.2)$ 0.1$ (0.7)$
1.9 0.6 0.5 0.1 (0.0) 0.1 3.1
(1.9) (0.3) (0.0) 0.6 0.1 (0.0) (1.6)
(0.2) (0.2) (0.2) 0.1 (0.3) (0.2) (0.9)
(0.6) 0.1 0.3 (0.0) (0.1) (0.0) (0.4)
(1.0)$ (0.0)$ 0.4$ 0.8$ (0.5)$ (0.1)$ (0.5)$
6.6$ (0.7)$ (0.0)$ (0.8)$ (0.0)$ (0.1)$ 4.9$
14
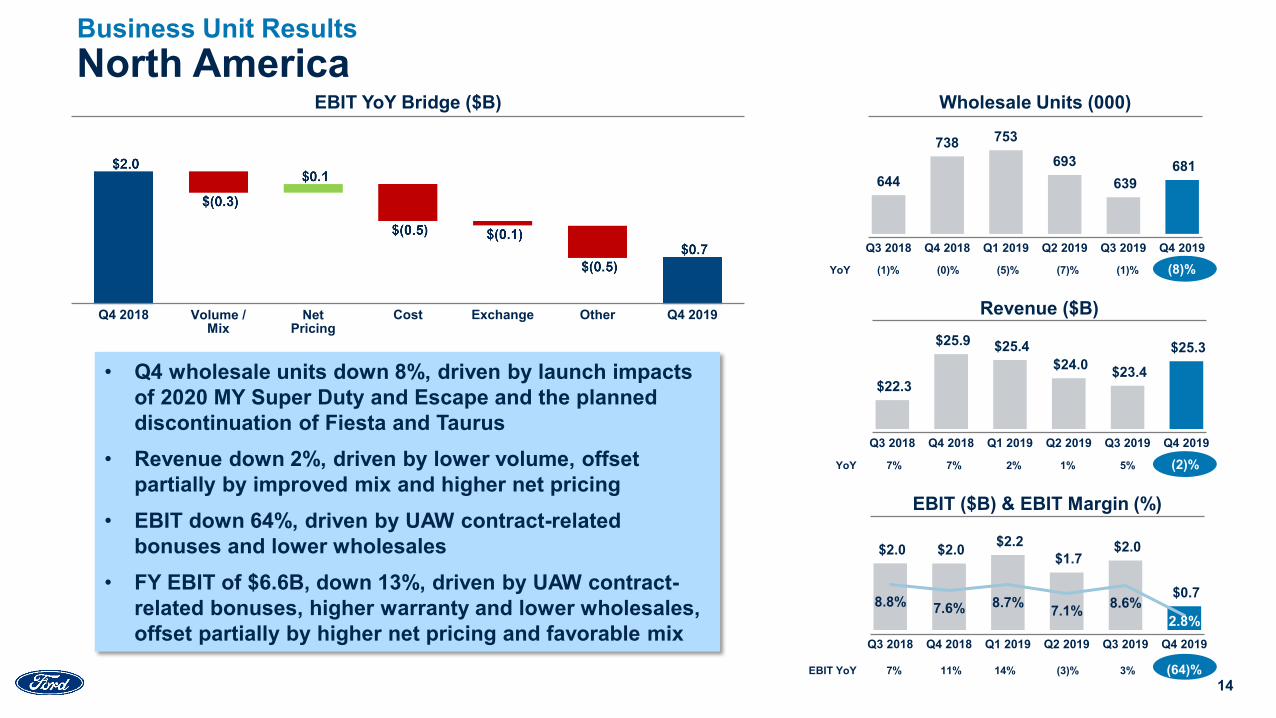
North AmericaBusiness Unit Results
Volume /Mix
NetPricing
ExchangeCost Q4 2019Q4 2018 Other
EBIT YoY Bridge ($B)
$22.3
$25.9 $25.4 $24.0 $23.4
$25.3
Q3 2018 Q4 2018 Q1 2019 Q2 2019 Q3 2019 Q4 2019
Revenue ($B)
YoY 7% 7% 2% 1% 5% (2)%
EBIT YoY 7% 11% 14% (3)% 3% (64)%
644
738 753693
639 681
Q3 2018 Q4 2018 Q1 2019 Q2 2019 Q3 2019 Q4 2019
Wholesale Units (000)
YoY (1)% (0)% (5)% (7)% (1)% (8)%
• Q4 wholesale units down 8%, driven by launch impacts of 2020 MY Super Duty and Escape and the planned discontinuation of Fiesta and Taurus
• Revenue down 2%, driven by lower volume, offset partially by improved mix and higher net pricing
• EBIT down 64%, driven by UAW contract-related bonuses and lower wholesales
• FY EBIT of $6.6B, down 13%, driven by UAW contract-related bonuses, higher warranty and lower wholesales, offset partially by higher net pricing and favorable mix
$2.0 $2.0 $2.2 $1.7
$2.0
$0.7 8.8% 7.6% 8.7% 7.1% 8.6%2.8%
Q3 2018 Q4 2018 Q1 2019 Q2 2019 Q3 2019 Q4 2019
EBIT ($B) & EBIT Margin (%)
15
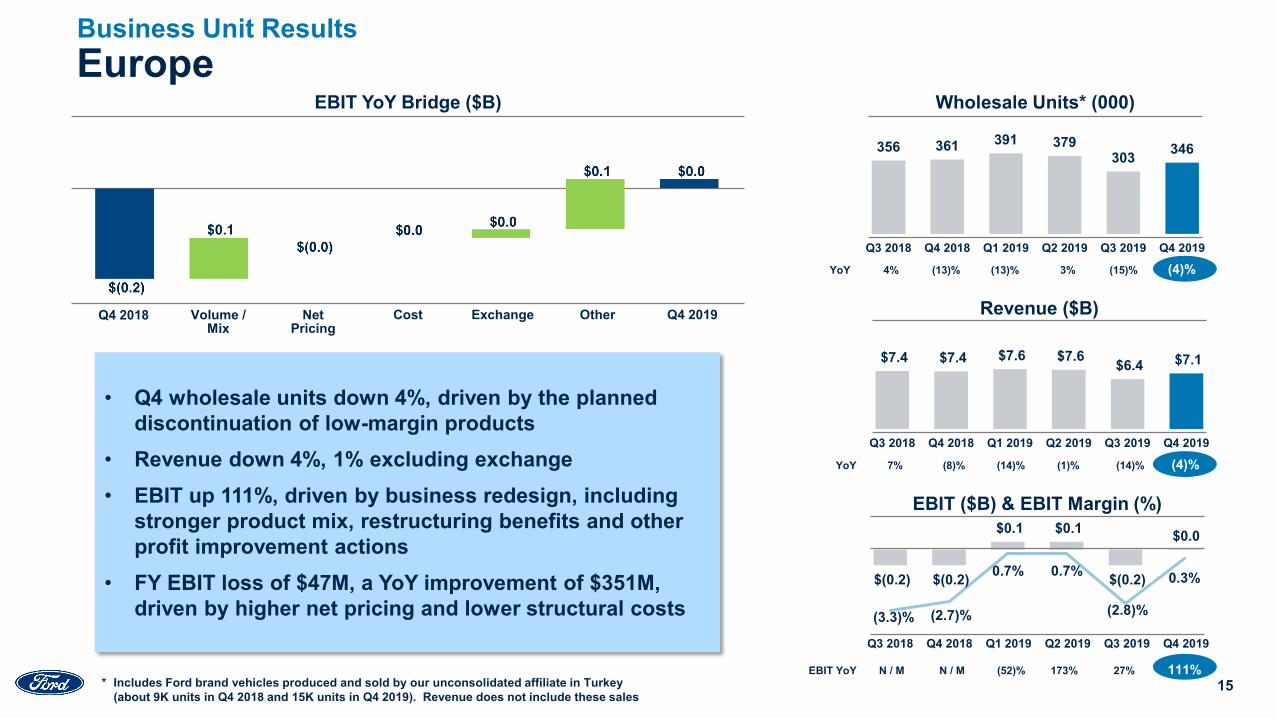
Europe
$7.4 $7.4 $7.6 $7.6 $6.4 $7.1
Q3 2018 Q4 2018 Q1 2019 Q2 2019 Q3 2019 Q4 2019
Revenue ($B)Volume /Mix
NetPricing
ExchangeCost Q4 2019Q4 2018 Other
356 361 391 379303 346
Q3 2018 Q4 2018 Q1 2019 Q2 2019 Q3 2019 Q4 2019
Wholesale Units* (000)
YoY 4% (13)% (13)% 3% (15)% (4)%
YoY 7% (8)% (14)% (1)% (14)% (4)%
EBIT YoY Bridge ($B)
Business Unit Results
EBIT YoY N / M N / M (52)% 173% 27% 111%* Includes Ford brand vehicles produced and sold by our unconsolidated affiliate in Turkey
(about 9K units in Q4 2018 and 15K units in Q4 2019). Revenue does not include these sales
• Q4 wholesale units down 4%, driven by the planned discontinuation of low-margin products
• Revenue down 4%, 1% excluding exchange• EBIT up 111%, driven by business redesign, including
stronger product mix, restructuring benefits and other profit improvement actions
• FY EBIT loss of $47M, a YoY improvement of $351M, driven by higher net pricing and lower structural costs
$(0.2) $(0.2)
$0.1 $0.1
$(0.2)
$0.0
(3.3)% (2.7)%
0.7% 0.7%
(2.8)%
0.3%
EBIT ($B) & EBIT Margin (%)
Q3 2018 Q4 2018 Q1 2019 Q2 2019 Q3 2019 Q4 2019
16EBIT YoY N / M N / M 15% 68% 26% 61%Ford Equity Income (0.0) (0.2) (0.0) 0.0 (0.1) (0.0)
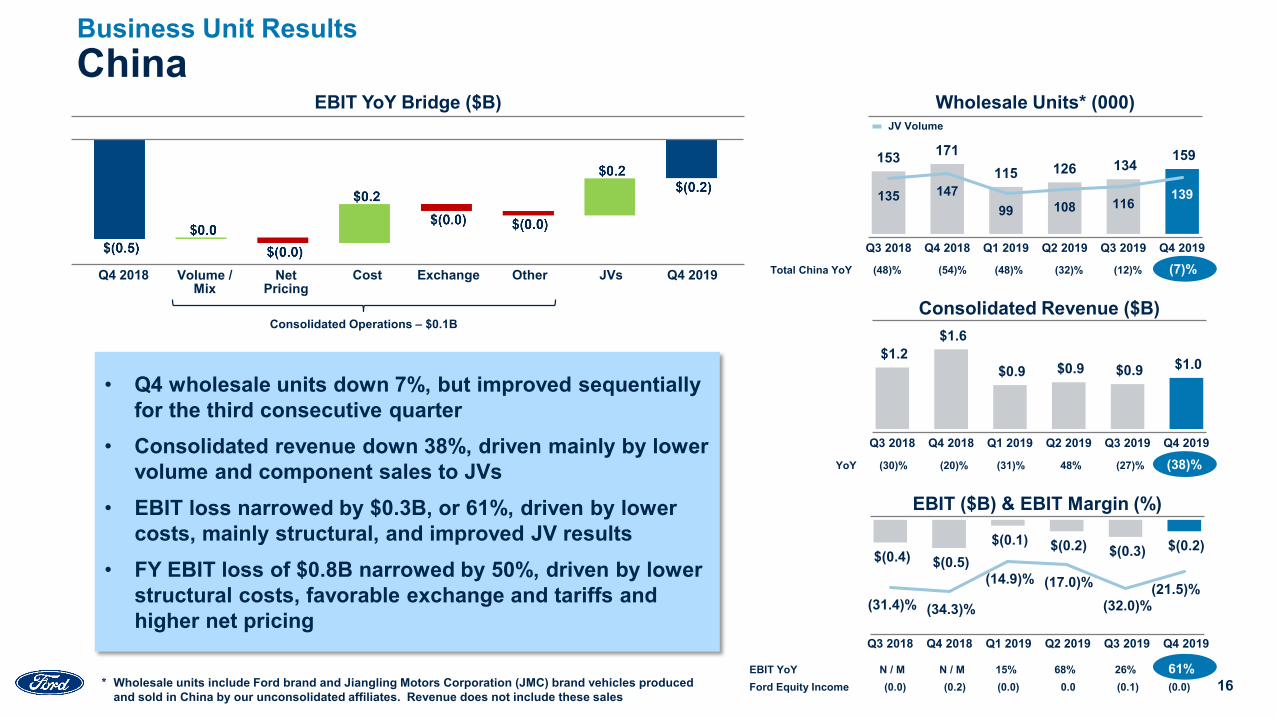
China
$1.2 $1.6
$0.9 $0.9 $0.9 $1.0
Q3 2018 Q4 2018 Q1 2019 Q2 2019 Q3 2019 Q4 2019
Consolidated Revenue ($B)
YoY (30)% (20)% (31)% 48% (27)% (38)%
Wholesale Units* (000)JV Volume
Business Unit Results
Total China YoY (48)% (54)% (48)% (32)% (12)% (7)%
EBIT YoY Bridge ($B)
Consolidated Operations – $0.1B
153 171115 126 134
159
135 14799 108 116 139
Q3 2018 Q4 2018 Q1 2019 Q2 2019 Q3 2019 Q4 2019
Volume /Mix
NetPricing
ExchangeCost Q4 2019Q4 2018 Other JVs
• Q4 wholesale units down 7%, but improved sequentially for the third consecutive quarter
• Consolidated revenue down 38%, driven mainly by lower volume and component sales to JVs
• EBIT loss narrowed by $0.3B, or 61%, driven by lower costs, mainly structural, and improved JV results
• FY EBIT loss of $0.8B narrowed by 50%, driven by lower structural costs, favorable exchange and tariffs and higher net pricing
$(0.4) $(0.5)$(0.1) $(0.2) $(0.3) $(0.2)
(31.4)% (34.3)%
(14.9)% (17.0)%(32.0)%
(21.5)%
EBIT ($B) & EBIT Margin (%)
Q3 2018 Q4 2018 Q1 2019 Q2 2019 Q3 2019 Q4 2019
* Wholesale units include Ford brand and Jiangling Motors Corporation (JMC) brand vehicles produced and sold in China by our unconsolidated affiliates. Revenue does not include these sales
17
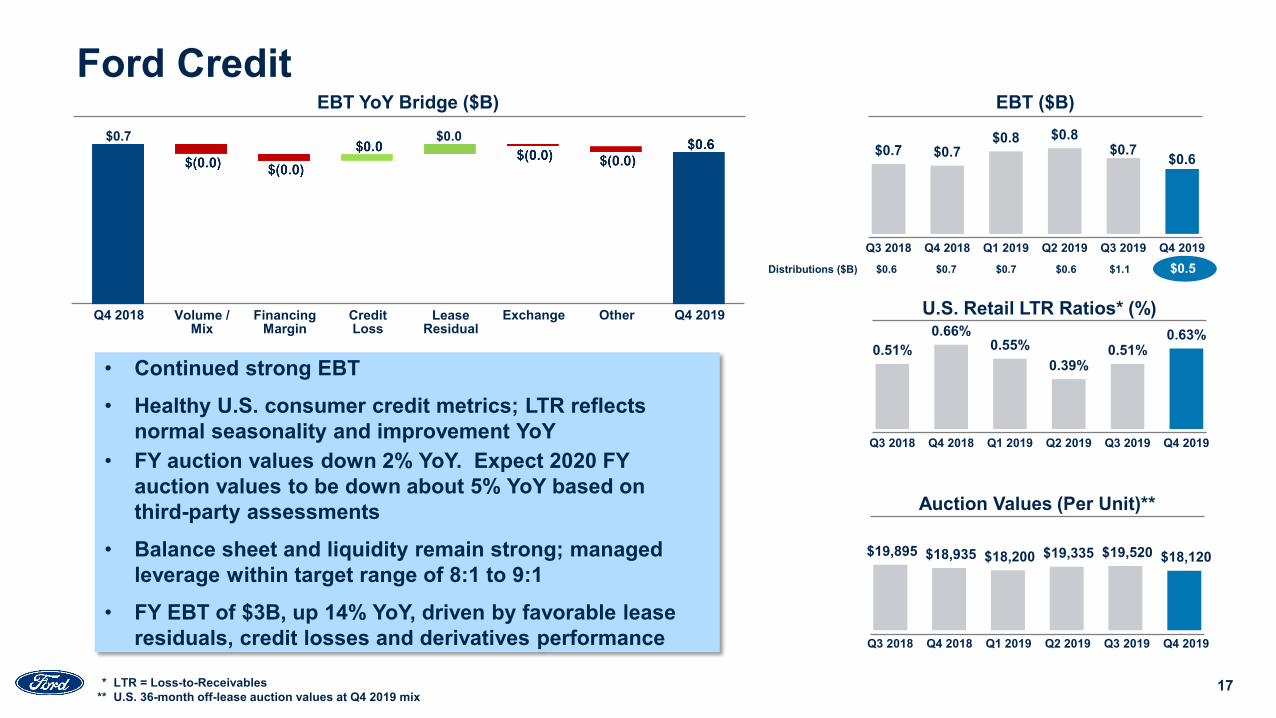
Distributions ($B) $0.6 $0.7 $0.7 $0.6 $1.1 ( $0.5
0.51%0.66%
0.55%0.39%
0.51%0.63%
Q3 2018 Q4 2018 Q1 2019 Q2 2019 Q3 2019 Q4 2019
U.S. Retail LTR Ratios* (%)
EBT YoY Bridge ($B)
$0.7 $0.7 $0.8 $0.8
$0.7 $0.6
Q3 2018 Q4 2018 Q1 2019 Q2 2019 Q3 2019 Q4 2019
EBT ($B)
• Continued strong EBT• Healthy U.S. consumer credit metrics; LTR reflects
normal seasonality and improvement YoY• FY auction values down 2% YoY. Expect 2020 FY
auction values to be down about 5% YoY based on third-party assessments
• Balance sheet and liquidity remain strong; managed leverage within target range of 8:1 to 9:1
• FY EBT of $3B, up 14% YoY, driven by favorable lease residuals, credit losses and derivatives performance
Volume /Mix
FinancingMargin
LeaseResidual
Credit Loss
Q4 2019Q4 2018 Exchange Other
* LTR = Loss-to-Receivables** U.S. 36-month off-lease auction values at Q4 2019 mix
$0.7 $0.0
$19,895 $18,935 $18,200 $19,335 $19,520 $18,120
Auction Values (Per Unit)**
Ford Credit
Q3 2018 Q4 2018 Q1 2019 Q2 2019 Q3 2019 Q4 2019
18
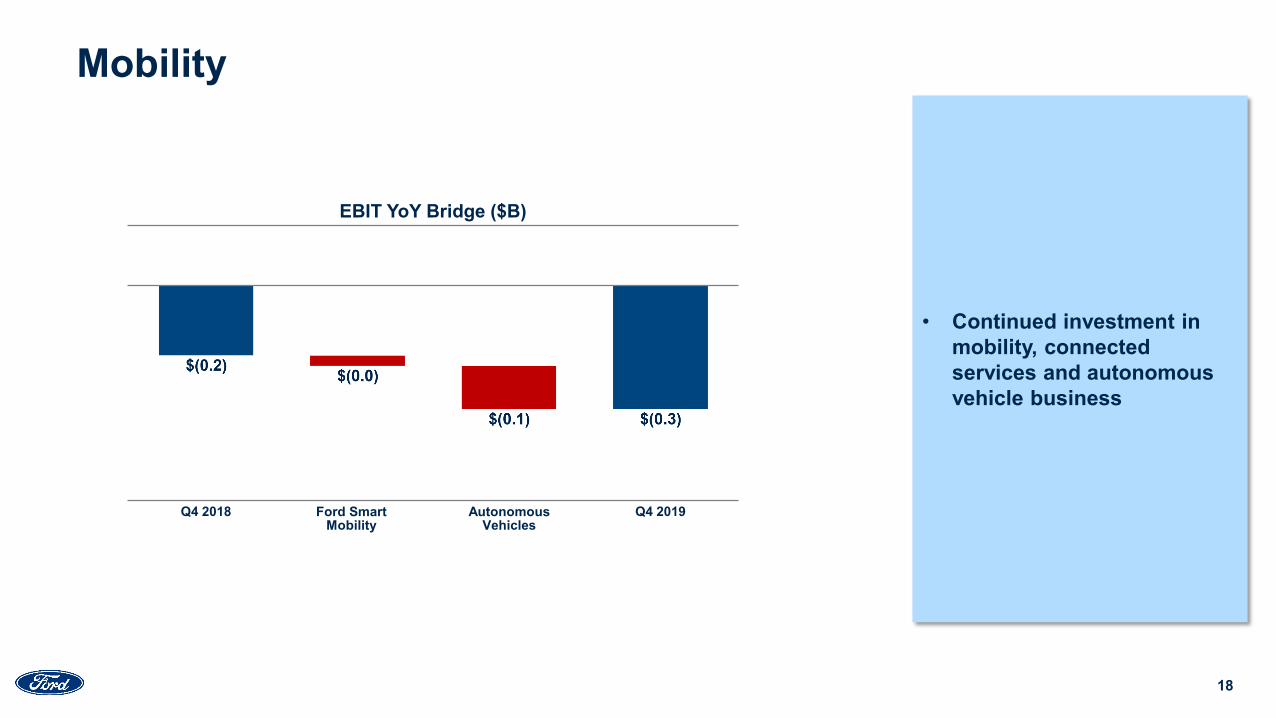
Mobility
Q4 2019Q4 2018 Ford Smart Mobility
AutonomousVehicles
EBIT YoY Bridge ($B)
• Continued investment in mobility, connected services and autonomous vehicle business
19
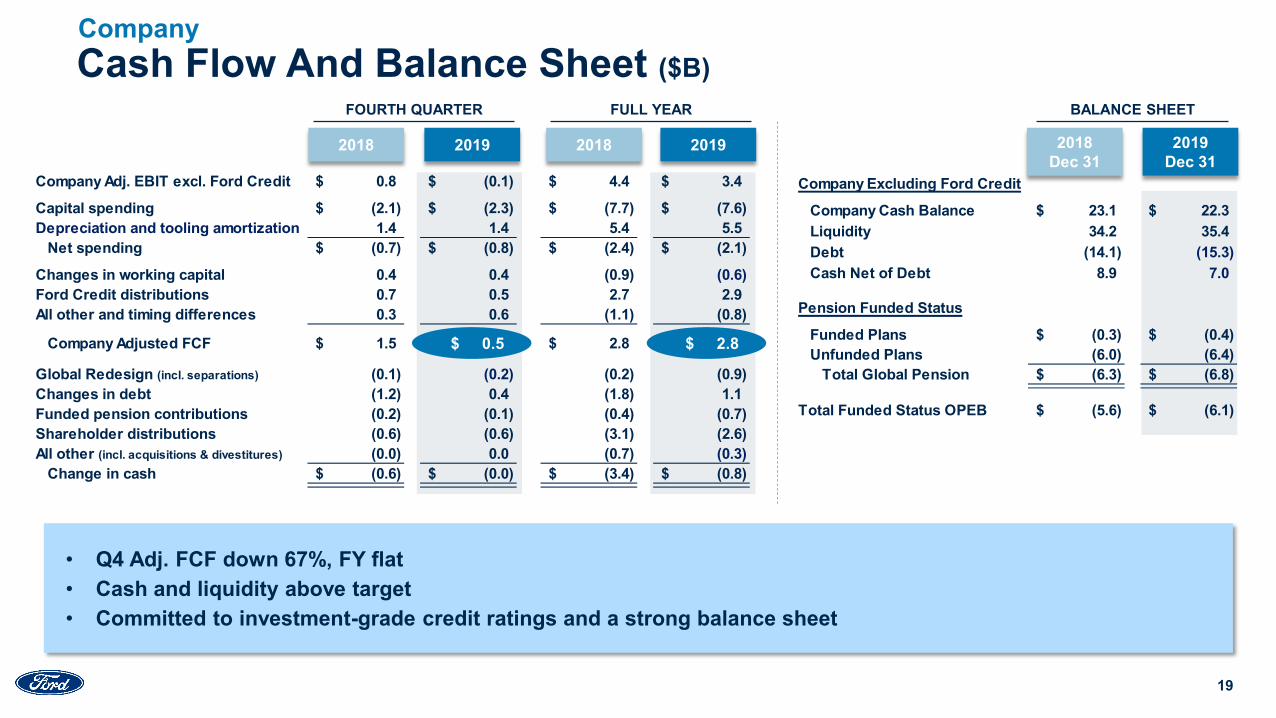
Cash Flow And Balance Sheet ($B)FOURTH QUARTER FULL YEAR
20192018 20192018
Company Adj. EBIT excl. Ford Credit 0.8$ (0.1)$ 4.4$ 3.4$
Capital spending (2.1)$ (2.3)$ (7.7)$ (7.6)$ Depreciation and tooling amortization 1.4 1.4 5.4 5.5
Net spending (0.7)$ (0.8)$ (2.4)$ (2.1)$
Changes in working capital 0.4 0.4 (0.9) (0.6)Ford Credit distributions 0.7 0.5 2.7 2.9All other and timing differences 0.3 0.6 (1.1) (0.8)
Company Adjusted FCF 1.5$ 0.5$ 2.8$ 2.8$
Global Redesign (incl. separations) (0.1) (0.2) (0.2) (0.9) Changes in debt (1.2) 0.4 (1.8) 1.1 Funded pension contributions (0.2) (0.1) (0.4) (0.7) Shareholder distributions (0.6) (0.6) (3.1) (2.6) All other (incl. acquisitions & divestitures) (0.0) 0.0 (0.7) (0.3)
Change in cash (0.6)$ (0.0)$ (3.4)$ (0.8)$
2018Dec 31
2019Dec 31
Company
Company Excluding Ford Credit
Company Cash Balance 23.1$ 22.3$ Liquidity 34.2 35.4Debt (14.1) (15.3)Cash Net of Debt 8.9 7.0
Pension Funded Status
Funded Plans (0.3)$ (0.4)$ Unfunded Plans (6.0) (6.4)
Total Global Pension (6.3)$ (6.8)$
Total Funded Status OPEB (5.6)$ (6.1)$
BALANCE SHEET
$ 0.5 $ 2.8
• Q4 Adj. FCF down 67%, FY flat• Cash and liquidity above target• Committed to investment-grade credit ratings and a strong balance sheet
20
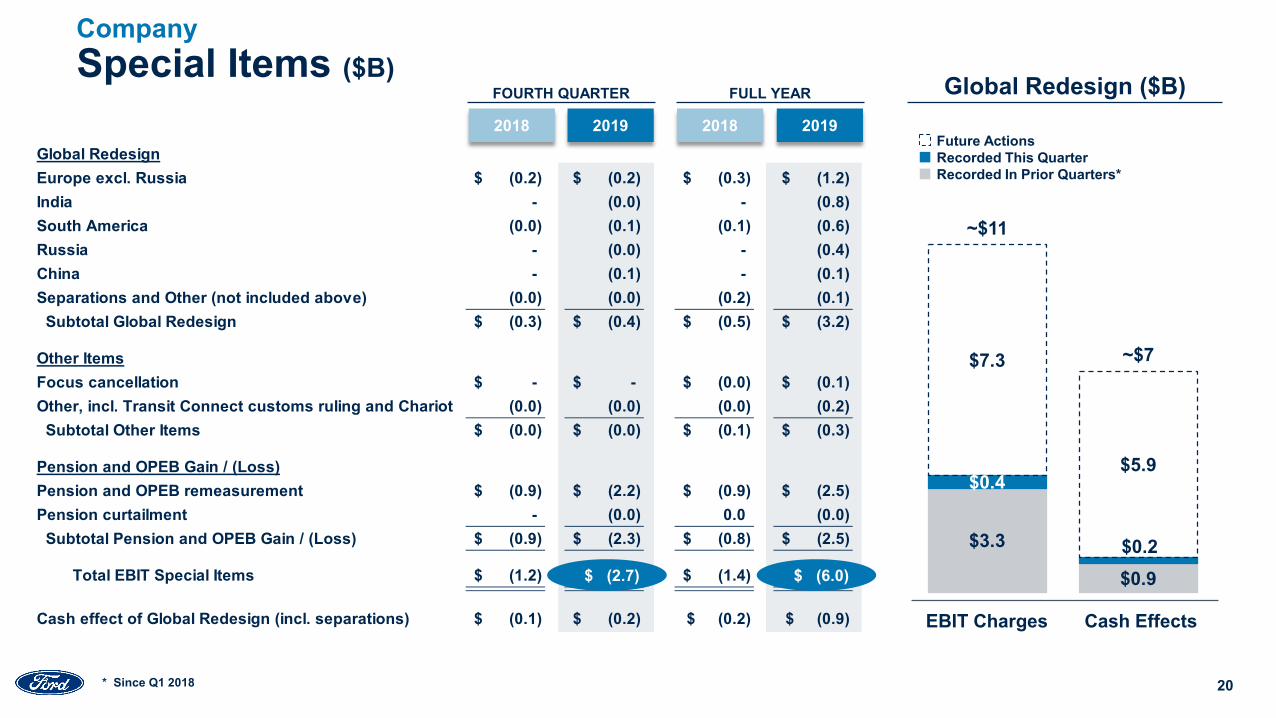
Global RedesignEurope excl. Russia (0.2)$ (0.2)$ (0.3)$ (1.2)$ India - (0.0) - (0.8) South America (0.0) (0.1) (0.1) (0.6) Russia - (0.0) - (0.4) China - (0.1) - (0.1) Separations and Other (not included above) (0.0) (0.0) (0.2) (0.1)
Subtotal Global Redesign (0.3)$ (0.4)$ (0.5)$ (3.2)$
Other ItemsFocus cancellation -$ -$ (0.0)$ (0.1)$ Other, incl. Transit Connect customs ruling and Chariot (0.0) (0.0) (0.0) (0.2) Subtotal Other Items (0.0)$ (0.0)$ (0.1)$ (0.3)$
Pension and OPEB Gain / (Loss)Pension and OPEB remeasurement (0.9)$ (2.2)$ (0.9)$ (2.5)$ Pension curtailment - (0.0) 0.0 (0.0) Subtotal Pension and OPEB Gain / (Loss) (0.9)$ (2.3)$ (0.8)$ (2.5)$
Total EBIT Special Items (1.2)$ (2.7)$ (1.4)$ (6.0)$
Cash effect of Global Redesign (incl. separations) (0.1)$ (0.2)$ (0.2)$ (0.9)$
$3.3
$0.9
$0.4
$0.2
$7.3
$5.9
~$11
~$7
Special Items ($B)Company
EBIT Charges Cash Effects
Future ActionsRecorded This QuarterRecorded In Prior Quarters*
Global Redesign ($B)20192018
FOURTH QUARTER
20192018
FULL YEAR
$ (2.7)
* Since Q1 2018
$ (6.0)
21
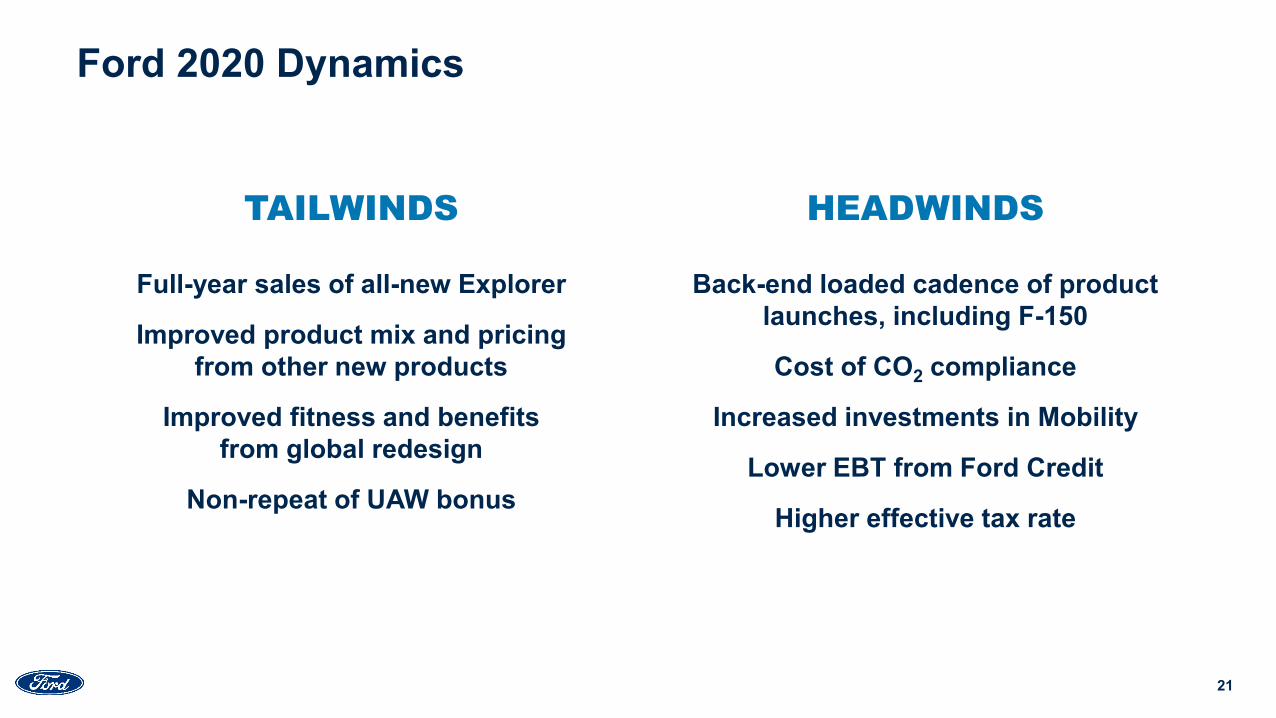
Ford 2020 Dynamics
Full-year sales of all-new Explorer
Improved product mix and pricing from other new products
Improved fitness and benefits from global redesign
Non-repeat of UAW bonus
Back-end loaded cadence of product launches, including F-150
Cost of CO2 compliance
Increased investments in Mobility
Lower EBT from Ford Credit
Higher effective tax rate
TAILWINDS HEADWINDS
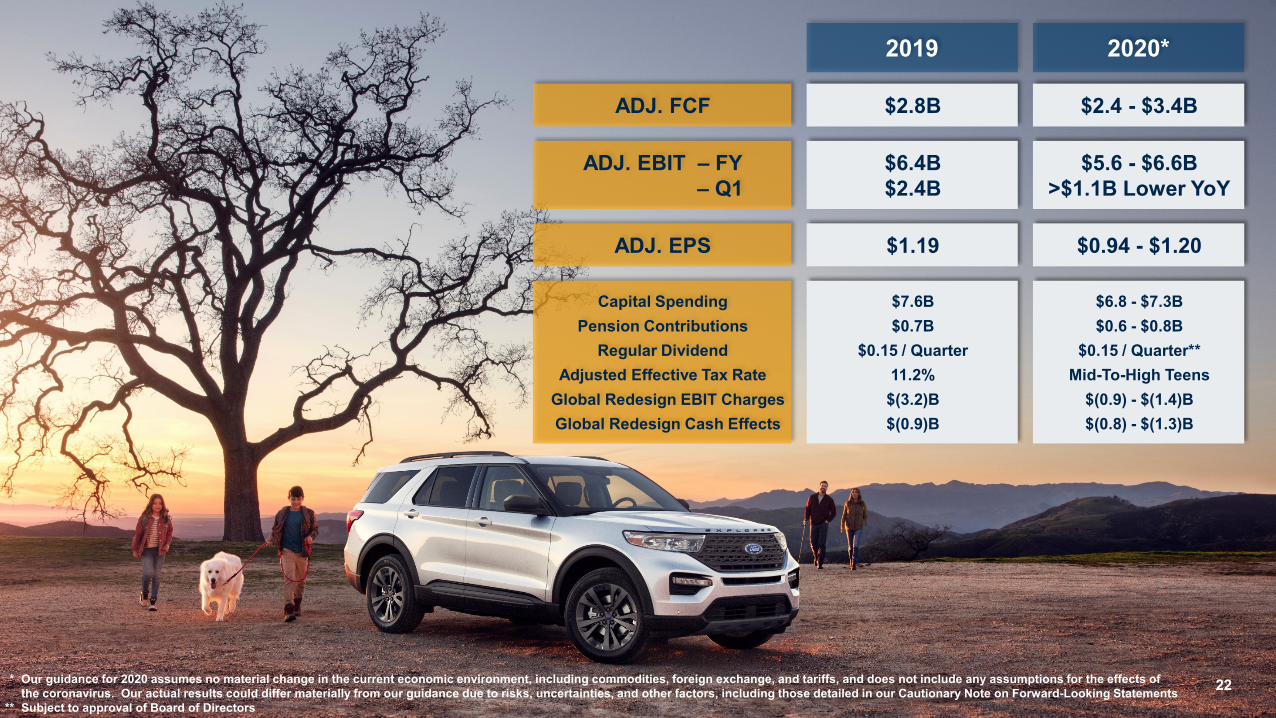
2020*2019
$5.6 - $6.6B>$1.1B Lower YoY
$6.4B$2.4B
ADJ. EBIT – FY– Q1
$2.4 - $3.4B$2.8BADJ. FCF
$0.94 - $1.20$1.19ADJ. EPS
$6.8 - $7.3B$0.6 - $0.8B
$0.15 / Quarter**Mid-To-High Teens
$(0.9) - $(1.4)B$(0.8) - $(1.3)B
$7.6B$0.7B
$0.15 / Quarter11.2%$(3.2)B$(0.9)B
Capital SpendingPension Contributions
Regular DividendAdjusted Effective Tax Rate
Global Redesign EBIT ChargesGlobal Redesign Cash Effects
22* Our guidance for 2020 assumes no material change in the current economic environment, including commodities, foreign exchange, and tariffs, and does not include any assumptions for the effects of the coronavirus. Our actual results could differ materially from our guidance due to risks, uncertainties, and other factors, including those detailed in our Cautionary Note on Forward-Looking Statements
** Subject to approval of Board of Directors
23
Summary• First, our customers are informing and driving everything we do
– That is why 2019 was – and 2020 will continue to be – such robust launch years for us – We are bolstering our Winning Portfolio of vehicles based on what consumers want and
need – reallocating capital to those higher-return growth opportunities and carrying out changeovers of our highest-volume and most profitable vehicles
• Second, we are determined to always get better – to persistently improve our fitness and our operational execution– We have abundant opportunities across our business to drive improvements in free cash
flow, along with long-term growth in revenue and profitability, including adjusted EBIT margins of 8 percent or better
– We remain committed to maintaining a strong balance sheet and investment-grade credit ratings
• And third, as we look ahead, we are optimistic– We have many opportunities to improve our operational execution, drive growth,
strengthen our financial results – including cash flow – and, in the process, earn the confidence of our stakeholders

Q & A
25
Closing ThoughtsOur Global Redesign is on track, and we are focused on operational execution and
decisive actions to strengthen our business, including the rigorous allocation of capital to higher-return investments to optimize long-term value creation – This year we will have our strongest lineup of electrified vehicles yet. New
products include battery-electric vehicles for the U.S., Europe and China, with a full range of BEVs, PHEVs and HEVs to support compliance with new European emissions standards
– All-new and refreshed products are transforming our portfolio – we will start to fully benefit from this transformation in 2021
We are committed to investment-grade credit ratings and a strong balance sheetWe begin this decade with optimism and the conviction that we are taking the right
steps to redesign and restructure our business, improve our fitness and prepare the company to compete and win in the future
26
Cautionary Note On Forward-Looking StatementsStatements included or incorporated by reference herein may constitute “forward-looking statements” within the meaning of the Private Securities Litigation Reform Act of 1995. Forward-looking statements are based on expectations, forecasts, and assumptions by our management and involve a number of risks, uncertainties, and other factors that could cause actual results to differ materially from those stated, including, without limitation:• Ford’s long-term competitiveness depends on the successful execution of fitness actions;• Industry sales volume, particularly in the United States, Europe, or China, can be volatile and could decline if there is a financial crisis, recession, or significant geopolitical event;• Ford’s new and existing products and mobility services are subject to market acceptance;• Ford’s results are dependent on sales of larger, more profitable vehicles, particularly in the United States;• Ford may face increased price competition resulting from industry excess capacity, currency fluctuations, or other factors;• Fluctuations in commodity prices, foreign currency exchange rates, and interest rates can have a significant effect on results;• With a global footprint, Ford’s results could be adversely affected by economic, geopolitical, protectionist trade policies, or other events, including Brexit;• Ford’s production, as well as Ford’s suppliers’ production, could be disrupted by labor disputes, natural or man-made disasters, financial distress, production difficulties, or other factors;• Ford’s ability to maintain a competitive cost structure could be affected by labor or other constraints;• Pension and other postretirement liabilities could adversely affect Ford’s liquidity and financial condition;• Economic and demographic experience for pension and other postretirement benefit plans (e.g., discount rates or investment returns) could be worse than Ford has assumed;• Ford’s vehicles could be affected by defects that result in delays in new model launches, recall campaigns, or increased warranty costs;• Ford may need to substantially modify its product plans to comply with safety, emissions, fuel economy, and other regulations that may change in the future;• Ford could experience unusual or significant litigation, governmental investigations, or adverse publicity arising out of alleged defects in products, perceived environmental impacts, or otherwise;• Ford’s receipt of government incentives could be subject to reduction, termination, or clawback;• Operational systems, security systems, and vehicles could be affected by cyber incidents;• Ford and Ford Credit’s access to debt, securitization, or derivative markets around the world at competitive rates or in sufficient amounts could be affected by credit rating downgrades, market volatility,
market disruption, regulatory requirements, or other factors;• Ford Credit could experience higher-than-expected credit losses, lower-than-anticipated residual values, or higher-than-expected return volumes for leased vehicles;• Ford Credit could face increased competition from banks, financial institutions, or other third parties seeking to increase their share of financing Ford vehicles; and• Ford Credit could be subject to new or increased credit regulations, consumer or data protection regulations, or other regulations.We cannot be certain that any expectation, forecast, or assumption made in preparing forward-looking statements will prove accurate, or that any projection will be realized. It is to be expected that there may be differences between projected and actual results. Our forward-looking statements speak only as of the date of their initial issuance, and we do not undertake any obligation to update or revise publicly any forward-looking statement, whether as a result of new information, future events, or otherwise. For additional discussion, see “Item 1A. Risk Factors” in our Annual Report on Form 10-K for the year ended December 31, 2018, as updated by subsequent filings with the United States Securities and Exchange Commission.

Appendix
28
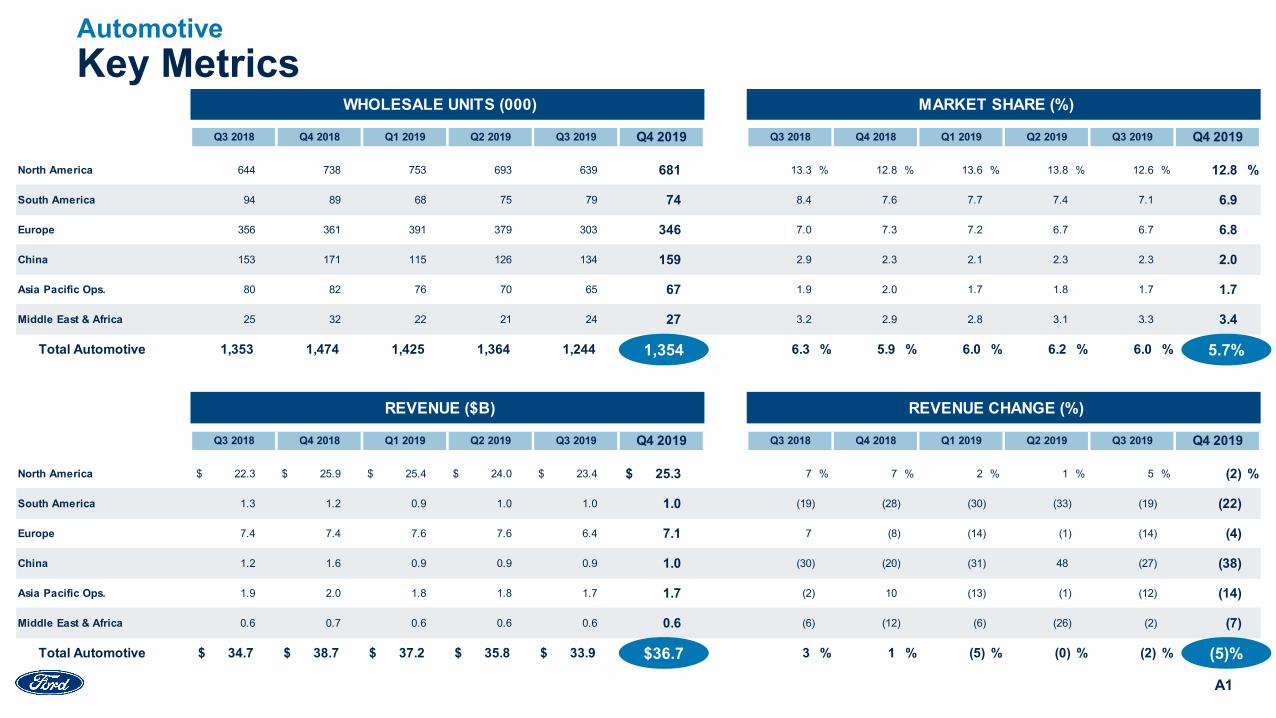
North America 644 738 753 693 639 681 13.3 % 12.8 % 13.6 % 13.8 % 12.6 % 12.8 %
South America 94 89 68 75 79 74 8.4 7.6 7.7 7.4 7.1 6.9
Europe 356 361 391 379 303 346 7.0 7.3 7.2 6.7 6.7 6.8
China 153 171 115 126 134 159 2.9 2.3 2.1 2.3 2.3 2.0
Asia Pacific Ops. 80 82 76 70 65 67 1.9 2.0 1.7 1.8 1.7 1.7
Middle East & Africa 25 32 22 21 24 27 3.2 2.9 2.8 3.1 3.3 3.4
Total Automotive 1,353 1,474 1,425 1,364 1,244 1,354 6.3 % 5.9 % 6.0 % 6.2 % 6.0 % 5.7 %
North America 22.3$ 25.9$ 25.4$ 24.0$ 23.4$ 25.3$ 7 % 7 % 2 % 1 % 5 % (2) %
South America 1.3 1.2 0.9 1.0 1.0 1.0 (19) (28) (30) (33) (19) (22)
Europe 7.4 7.4 7.6 7.6 6.4 7.1 7 (8) (14) (1) (14) (4)
China 1.2 1.6 0.9 0.9 0.9 1.0 (30) (20) (31) 48 (27) (38)
Asia Pacific Ops. 1.9 2.0 1.8 1.8 1.7 1.7 (2) 10 (13) (1) (12) (14)
Middle East & Africa 0.6 0.7 0.6 0.6 0.6 0.6 (6) (12) (6) (26) (2) (7)
Total Automotive 34.7$ 38.7$ 37.2$ 35.8$ 33.9$ 36.7$ 3 % 1 % (5) % (0) % (2) % (5) %
Q3 2019 Q4 2019Q4 2019 Q3 2018 Q4 2018 Q1 2019 Q2 2019Q3 2018 Q4 2018 Q1 2019 Q2 2019 Q3 2019
Q4 2018 Q1 2019 Q2 2019 Q3 2019 Q4 2019Q1 2019 Q2 2019 Q3 2019 Q4 2019 Q3 2018
REVENUE ($B) REVENUE CHANGE (%)
WHOLESALE UNITS (000) MARKET SHARE (%)
Q3 2018 Q4 2018
Key MetricsAutomotive
$36.7 (5)%
5.7%1,354
A1
29
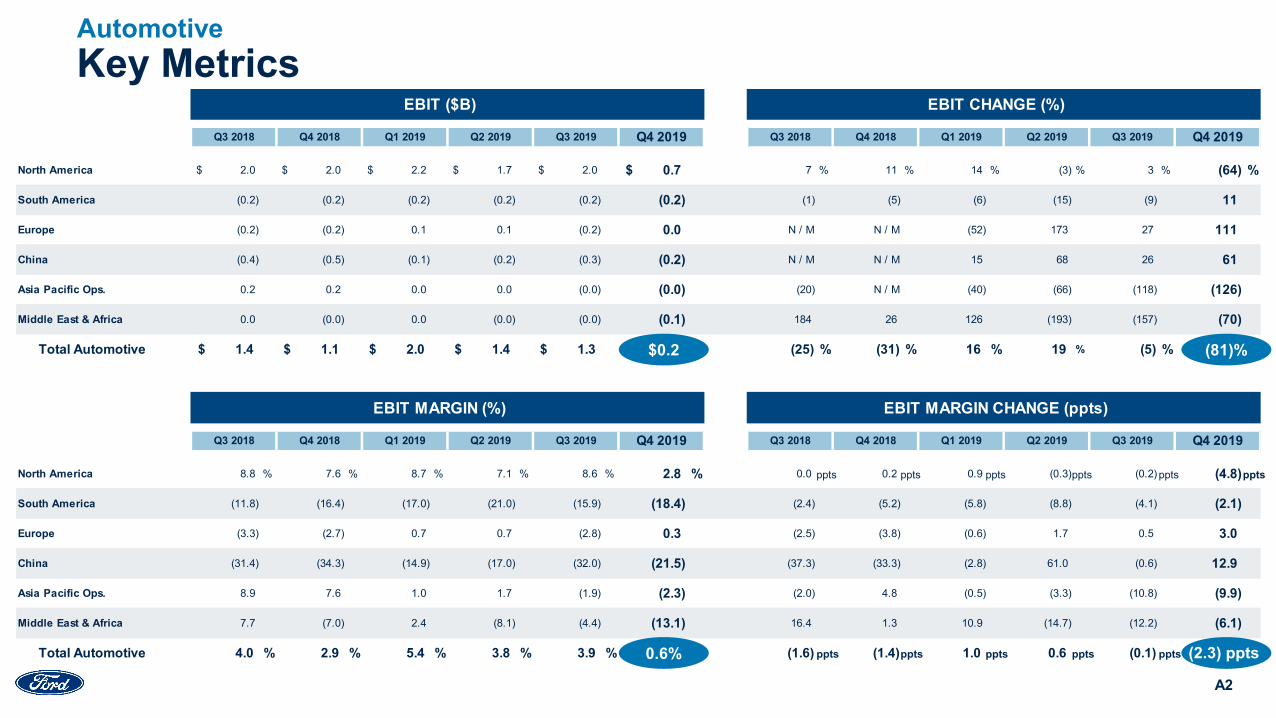
North America 2.0$ 2.0$ 2.2$ 1.7$ 2.0$ 0.7$ 7 % 11 % 14 % (3) % 3 % (64) %
South America (0.2) (0.2) (0.2) (0.2) (0.2) (0.2) (1) (5) (6) (15) (9) 11
Europe (0.2) (0.2) 0.1 0.1 (0.2) 0.0 N / M N / M (52) 173 27 111
China (0.4) (0.5) (0.1) (0.2) (0.3) (0.2) N / M N / M 15 68 26 61
Asia Pacific Ops. 0.2 0.2 0.0 0.0 (0.0) (0.0) (20) N / M (40) (66) (118) (126)
Middle East & Africa 0.0 (0.0) 0.0 (0.0) (0.0) (0.1) 184 26 126 (193) (157) (70)
Total Automotive 1.4$ 1.1$ 2.0$ 1.4$ 1.3$ 0.2$ (25) % (31) % 16 % 19 % (5) % (81) %
North America 8.8 % 7.6 % 8.7 % 7.1 % 8.6 % 2.8 % 0.0 0.2 0.9 (0.3) (0.2) (4.8)
South America (11.8) (16.4) (17.0) (21.0) (15.9) (18.4) (2.4) (5.2) (5.8) (8.8) (4.1) (2.1)
Europe (3.3) (2.7) 0.7 0.7 (2.8) 0.3 (2.5) (3.8) (0.6) 1.7 0.5 3.0
China (31.4) (34.3) (14.9) (17.0) (32.0) (21.5) (37.3) (33.3) (2.8) 61.0 (0.6) 12.9
Asia Pacific Ops. 8.9 7.6 1.0 1.7 (1.9) (2.3) (2.0) 4.8 (0.5) (3.3) (10.8) (9.9)
Middle East & Africa 7.7 (7.0) 2.4 (8.1) (4.4) (13.1) 16.4 1.3 10.9 (14.7) (12.2) (6.1)
Total Automotive 4.0 % 2.9 % 5.4 % 3.8 % 3.9 % 0.6 % (1.6) (1.4) 1.0 0.6 (0.1) (2.3)
Q3 2019 Q4 2019
Q3 2018 Q4 2018 Q1 2019 Q2 2019 Q3 2019 Q4 2019
Q4 2019 Q3 2018 Q4 2018 Q1 2019 Q2 2019Q3 2018 Q4 2018 Q1 2019 Q2 2019 Q3 2019
EBIT MARGIN (%) EBIT MARGIN CHANGE (ppts)
EBIT ($B) EBIT CHANGE (%)
Q3 2018 Q4 2018 Q1 2019 Q2 2019 Q3 2019 Q4 2019
Key MetricsAutomotive
A2
ppts ppts ppts ppts ppts ppts
ppts ppts ppts ppts ppts ppts0.6%
(81)%$0.2
(2.3) ppts
30
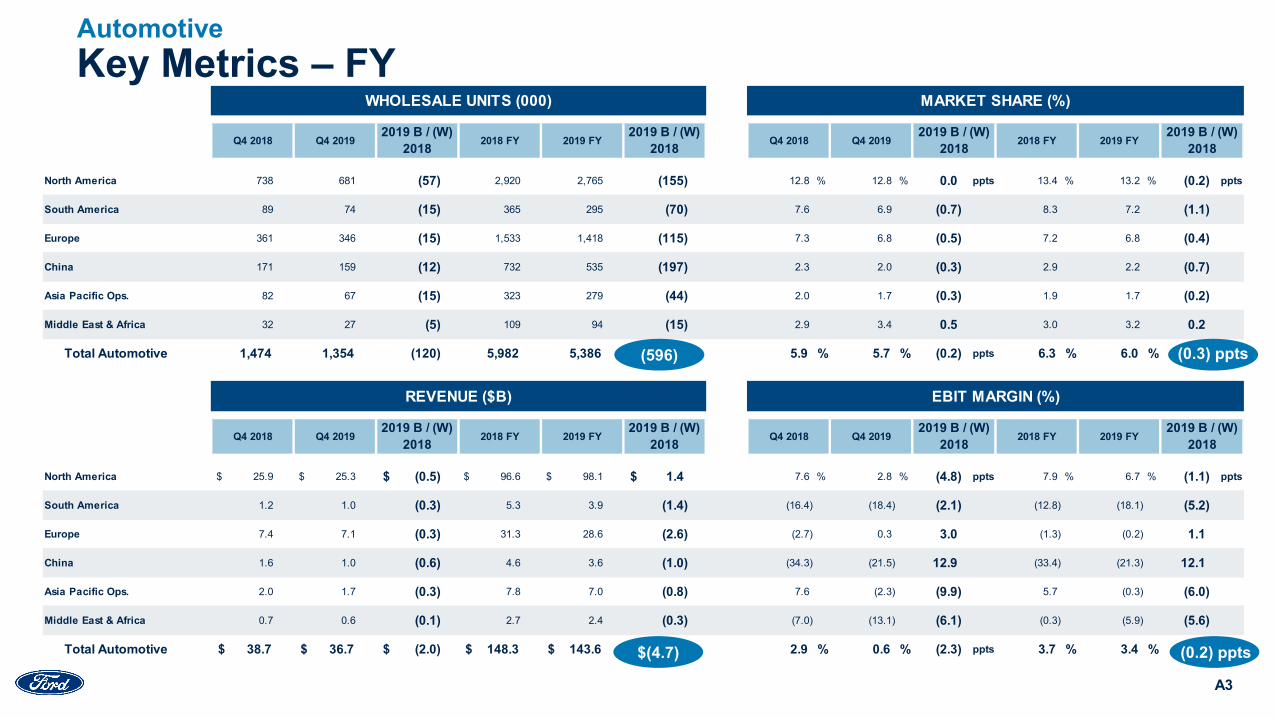
North America 738 681 (57) 2,920 2,765 (155) 12.8 % 12.8 % 0.0 ppts 13.4 % 13.2 % (0.2) ppts
South America 89 74 (15) 365 295 (70) 7.6 6.9 (0.7) 8.3 7.2 (1.1)
Europe 361 346 (15) 1,533 1,418 (115) 7.3 6.8 (0.5) 7.2 6.8 (0.4)
China 171 159 (12) 732 535 (197) 2.3 2.0 (0.3) 2.9 2.2 (0.7)
Asia Pacific Ops. 82 67 (15) 323 279 (44) 2.0 1.7 (0.3) 1.9 1.7 (0.2)
Middle East & Africa 32 27 (5) 109 94 (15) 2.9 3.4 0.5 3.0 3.2 0.2
Total Automotive 1,474 1,354 (120) 5,982 5,386 (596) 5.9 % 5.7 % (0.2) ppts 6.3 % 6.0 % (0.3) ppts
North America 25.9$ 25.3$ (0.5)$ 96.6$ 98.1$ 1.4$ 7.6 % 2.8 % (4.8) ppts 7.9 % 6.7 % (1.1) ppts
South America 1.2 1.0 (0.3) 5.3 3.9 (1.4) (16.4) (18.4) (2.1) (12.8) (18.1) (5.2)
Europe 7.4 7.1 (0.3) 31.3 28.6 (2.6) (2.7) 0.3 3.0 (1.3) (0.2) 1.1
China 1.6 1.0 (0.6) 4.6 3.6 (1.0) (34.3) (21.5) 12.9 (33.4) (21.3) 12.1
Asia Pacific Ops. 2.0 1.7 (0.3) 7.8 7.0 (0.8) 7.6 (2.3) (9.9) 5.7 (0.3) (6.0)
Middle East & Africa 0.7 0.6 (0.1) 2.7 2.4 (0.3) (7.0) (13.1) (6.1) (0.3) (5.9) (5.6)
Total Automotive 38.7$ 36.7$ (2.0)$ 148.3$ 143.6$ (4.7)$ 2.9 % 0.6 % (2.3) ppts 3.7 % 3.4 % (0.2) ppts
MARKET SHARE (%)
EBIT MARGIN (%)
Q4 2018 Q4 20192019 B / (W)
2018 2018 FY 2019 FY2019 B / (W)
2018
Q4 2018 Q4 2019 2018 FY 2019 FY2019 B / (W)
20182019 B / (W)
2018
WHOLESALE UNITS (000)
2019 B / (W)2018 2018 FY 2019 FY
REVENUE ($B)
2019 B / (W)2018Q4 2018 Q4 2019
2019 B / (W)2018Q4 2018 Q4 2019
2019 B / (W)2018 2018 FY 2019 FY
Key Metrics – FYAutomotive
A3
(596)
$(4.7)
(0.3) ppts
(0.2) ppts
31
Results ($M)
A4
Company
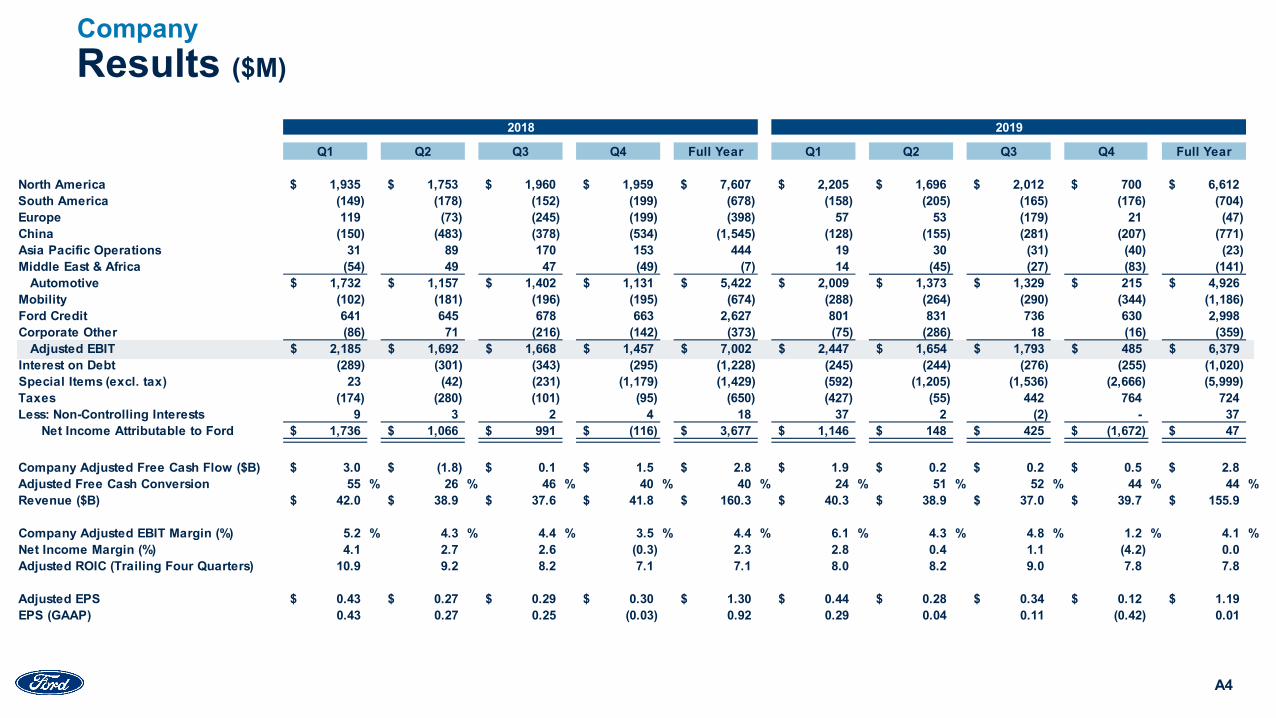
2018 2019
Q1 Q2 Q3 Q4 Full Year Q1 Q2 Q3 Q4 Full Year
North America 1,935$ 1,753$ 1,960$ 1,959$ 7,607$ 2,205$ 1,696$ 2,012$ 700$ 6,612$ South America (149) (178) (152) (199) (678) (158) (205) (165) (176) (704) Europe 119 (73) (245) (199) (398) 57 53 (179) 21 (47) China (150) (483) (378) (534) (1,545) (128) (155) (281) (207) (771) Asia Pacific Operations 31 89 170 153 444 19 30 (31) (40) (23) Middle East & Africa (54) 49 47 (49) (7) 14 (45) (27) (83) (141)
Automotive 1,732$ 1,157$ 1,402$ 1,131$ 5,422$ 2,009$ 1,373$ 1,329$ 215$ 4,926$ Mobility (102) (181) (196) (195) (674) (288) (264) (290) (344) (1,186) Ford Credit 641 645 678 663 2,627 801 831 736 630 2,998 Corporate Other (86) 71 (216) (142) (373) (75) (286) 18 (16) (359)
Adjusted EBIT 2,185$ 1,692$ 1,668$ 1,457$ 7,002$ 2,447$ 1,654$ 1,793$ 485$ 6,379$ Interest on Debt (289) (301) (343) (295) (1,228) (245) (244) (276) (255) (1,020) Special Items (excl. tax) 23 (42) (231) (1,179) (1,429) (592) (1,205) (1,536) (2,666) (5,999) Taxes (174) (280) (101) (95) (650) (427) (55) 442 764 724 Less: Non-Controlling Interests 9 3 2 4 18 37 2 (2) - 37
Net Income Attributable to Ford 1,736$ 1,066$ 991$ (116)$ 3,677$ 1,146$ 148$ 425$ (1,672)$ 47$
Company Adjusted Free Cash Flow ($B) 3.0$ (1.8)$ 0.1$ 1.5$ 2.8$ 1.9$ 0.2$ 0.2$ 0.5$ 2.8$ Adjusted Free Cash Conversion 55 % 26 % 46 % 40 % 40 % 24 % 51 % 52 % 44 % 44 %Revenue ($B) 42.0$ 38.9$ 37.6$ 41.8$ 160.3$ 40.3$ 38.9$ 37.0$ 39.7$ 155.9$
Company Adjusted EBIT Margin (%) 5.2 % 4.3 % 4.4 % 3.5 % 4.4 % 6.1 % 4.3 % 4.8 % 1.2 % 4.1 %Net Income Margin (%) 4.1 2.7 2.6 (0.3) 2.3 2.8 0.4 1.1 (4.2) 0.0 Adjusted ROIC (Trailing Four Quarters) 10.9 9.2 8.2 7.1 7.1 8.0 8.2 9.0 7.8 7.8
Adjusted EPS 0.43$ 0.27$ 0.29$ 0.30$ 1.30$ 0.44$ 0.28$ 0.34$ 0.12$ 1.19$ EPS (GAAP) 0.43 0.27 0.25 (0.03) 0.92 0.29 0.04 0.11 (0.42) 0.01
32
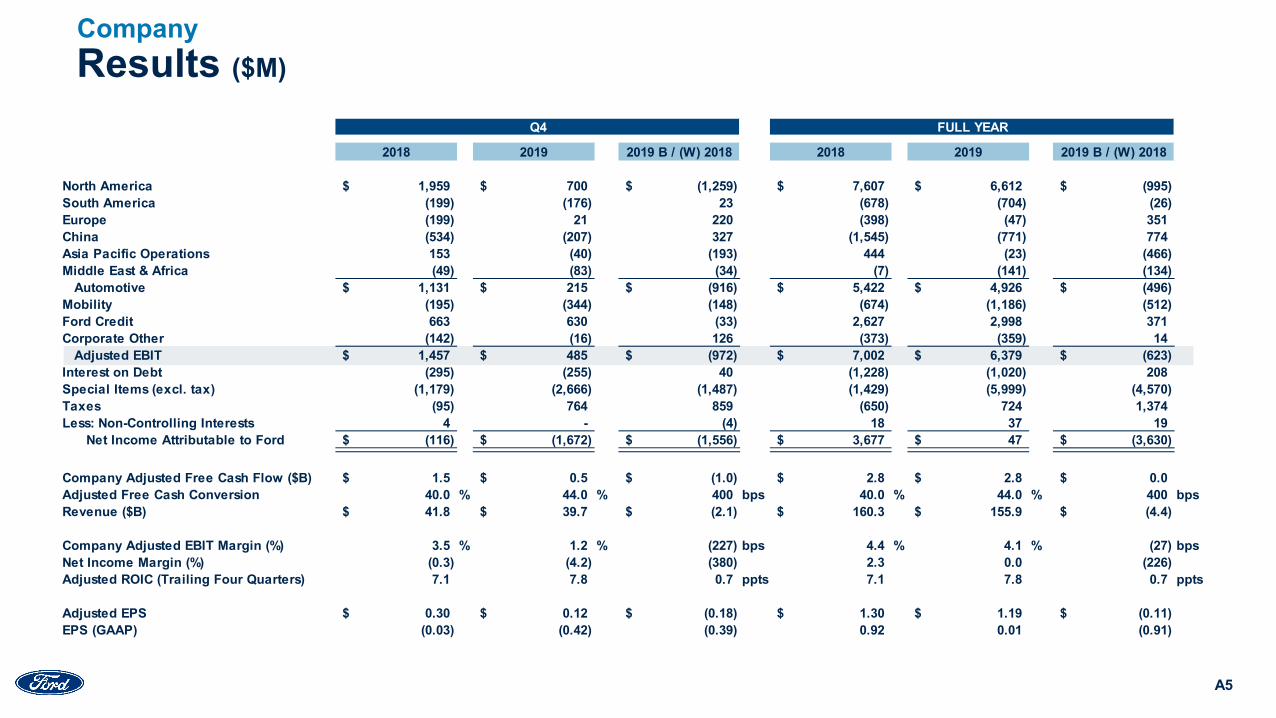
2018 2019 2019 B / (W) 2018 2018 2019 2019 B / (W) 2018
North America 1,959$ 700$ (1,259)$ 7,607$ 6,612$ (995)$ South America (199) (176) 23 (678) (704) (26) Europe (199) 21 220 (398) (47) 351 China (534) (207) 327 (1,545) (771) 774 Asia Pacific Operations 153 (40) (193) 444 (23) (466) Middle East & Africa (49) (83) (34) (7) (141) (134)
Automotive 1,131$ 215$ (916)$ 5,422$ 4,926$ (496)$ Mobility (195) (344) (148) (674) (1,186) (512) Ford Credit 663 630 (33) 2,627 2,998 371 Corporate Other (142) (16) 126 (373) (359) 14
Adjusted EBIT 1,457$ 485$ (972)$ 7,002$ 6,379$ (623)$ Interest on Debt (295) (255) 40 (1,228) (1,020) 208 Special Items (excl. tax) (1,179) (2,666) (1,487) (1,429) (5,999) (4,570) Taxes (95) 764 859 (650) 724 1,374 Less: Non-Controlling Interests 4 - (4) 18 37 19
Net Income Attributable to Ford (116)$ (1,672)$ (1,556)$ 3,677$ 47$ (3,630)$
Company Adjusted Free Cash Flow ($B) 1.5$ 0.5$ (1.0)$ 2.8$ 2.8$ 0.0$ Adjusted Free Cash Conversion 40.0 % 44.0 % 400 bps 40.0 % 44.0 % 400 bpsRevenue ($B) 41.8$ 39.7$ (2.1)$ 160.3$ 155.9$ (4.4)$
Company Adjusted EBIT Margin (%) 3.5 % 1.2 % (227) bps 4.4 % 4.1 % (27) bpsNet Income Margin (%) (0.3) (4.2) (380) 2.3 0.0 (226) Adjusted ROIC (Trailing Four Quarters) 7.1 7.8 0.7 ppts 7.1 7.8 0.7 ppts
Adjusted EPS 0.30$ 0.12$ (0.18)$ 1.30$ 1.19$ (0.11)$ EPS (GAAP) (0.03) (0.42) (0.39) 0.92 0.01 (0.91)
Q4 FULL YEAR
Results ($M)
A5
Company
33
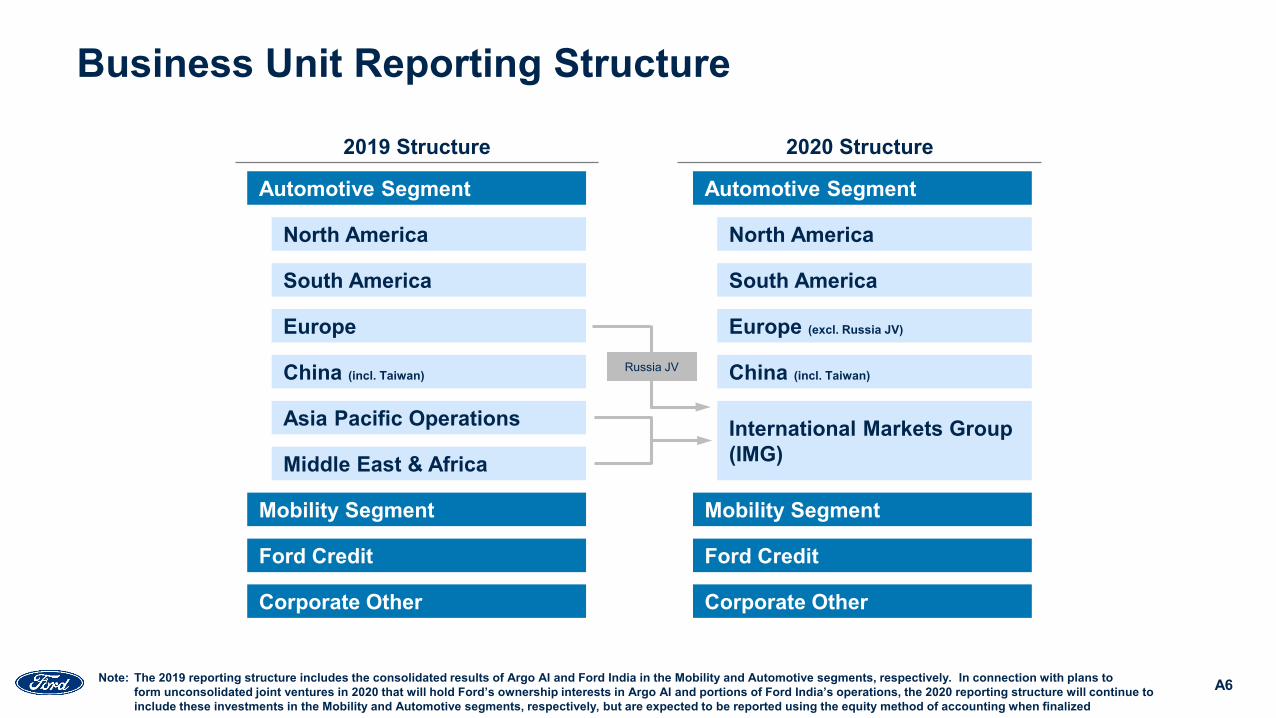
Business Unit Reporting Structure
A6Note: The 2019 reporting structure includes the consolidated results of Argo AI and Ford India in the Mobility and Automotive segments, respectively. In connection with plans to form unconsolidated joint ventures in 2020 that will hold Ford’s ownership interests in Argo AI and portions of Ford India’s operations, the 2020 reporting structure will continue to include these investments in the Mobility and Automotive segments, respectively, but are expected to be reported using the equity method of accounting when finalized
North America
Automotive Segment
South America
Europe
China (incl. Taiwan)
Asia Pacific Operations
Middle East & Africa
Mobility Segment
Ford Credit
Corporate Other
2019 Structure
North America
Automotive Segment
South America
Europe (excl. Russia JV)
China (incl. Taiwan)
International Markets Group (IMG)
Mobility Segment
Ford Credit
Corporate Other
2020 Structure
Russia JV
34
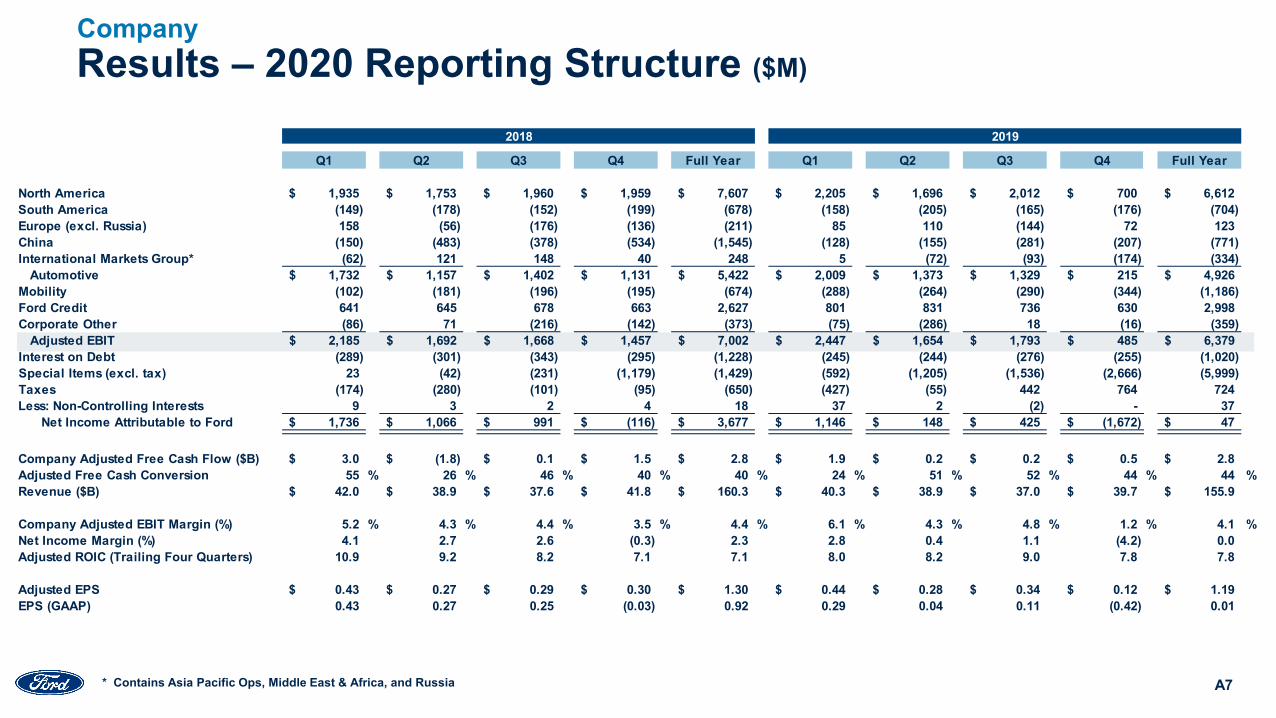
Results – 2020 Reporting Structure ($M)
A7
Company
* Contains Asia Pacific Ops, Middle East & Africa, and Russia
2018 2019
Q1 Q2 Q3 Q4 Full Year Q1 Q2 Q3 Q4 Full Year
North America 1,935$ 1,753$ 1,960$ 1,959$ 7,607$ 2,205$ 1,696$ 2,012$ 700$ 6,612$ South America (149) (178) (152) (199) (678) (158) (205) (165) (176) (704) Europe (excl. Russia) 158 (56) (176) (136) (211) 85 110 (144) 72 123 China (150) (483) (378) (534) (1,545) (128) (155) (281) (207) (771) International Markets Group* (62) 121 148 40 248 5 (72) (93) (174) (334)
Automotive 1,732$ 1,157$ 1,402$ 1,131$ 5,422$ 2,009$ 1,373$ 1,329$ 215$ 4,926$ Mobility (102) (181) (196) (195) (674) (288) (264) (290) (344) (1,186) Ford Credit 641 645 678 663 2,627 801 831 736 630 2,998 Corporate Other (86) 71 (216) (142) (373) (75) (286) 18 (16) (359)
Adjusted EBIT 2,185$ 1,692$ 1,668$ 1,457$ 7,002$ 2,447$ 1,654$ 1,793$ 485$ 6,379$ Interest on Debt (289) (301) (343) (295) (1,228) (245) (244) (276) (255) (1,020) Special Items (excl. tax) 23 (42) (231) (1,179) (1,429) (592) (1,205) (1,536) (2,666) (5,999) Taxes (174) (280) (101) (95) (650) (427) (55) 442 764 724 Less: Non-Controlling Interests 9 3 2 4 18 37 2 (2) - 37
Net Income Attributable to Ford 1,736$ 1,066$ 991$ (116)$ 3,677$ 1,146$ 148$ 425$ (1,672)$ 47$
Company Adjusted Free Cash Flow ($B) 3.0$ (1.8)$ 0.1$ 1.5$ 2.8$ 1.9$ 0.2$ 0.2$ 0.5$ 2.8$ Adjusted Free Cash Conversion 55 % 26 % 46 % 40 % 40 % 24 % 51 % 52 % 44 % 44 %Revenue ($B) 42.0$ 38.9$ 37.6$ 41.8$ 160.3$ 40.3$ 38.9$ 37.0$ 39.7$ 155.9$
Company Adjusted EBIT Margin (%) 5.2 % 4.3 % 4.4 % 3.5 % 4.4 % 6.1 % 4.3 % 4.8 % 1.2 % 4.1 %Net Income Margin (%) 4.1 2.7 2.6 (0.3) 2.3 2.8 0.4 1.1 (4.2) 0.0 Adjusted ROIC (Trailing Four Quarters) 10.9 9.2 8.2 7.1 7.1 8.0 8.2 9.0 7.8 7.8
Adjusted EPS 0.43$ 0.27$ 0.29$ 0.30$ 1.30$ 0.44$ 0.28$ 0.34$ 0.12$ 1.19$ EPS (GAAP) 0.43 0.27 0.25 (0.03) 0.92 0.29 0.04 0.11 (0.42) 0.01
35
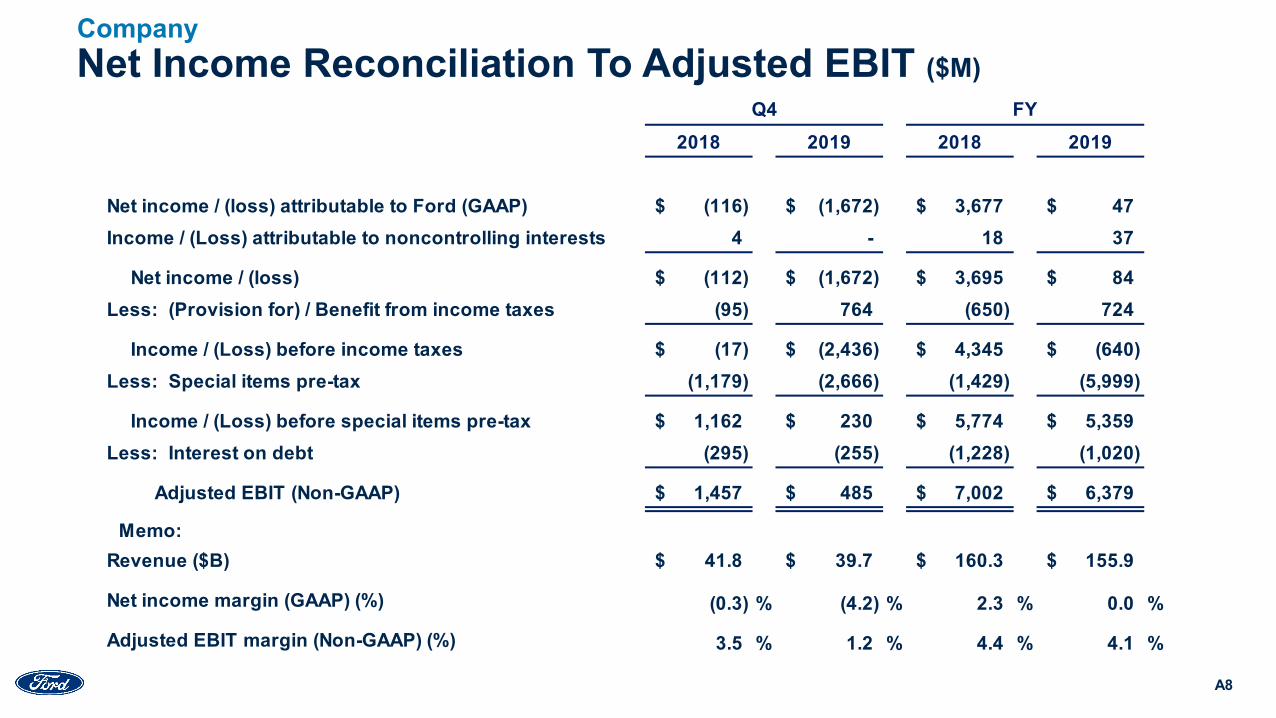
Net Income Reconciliation To Adjusted EBIT ($M)Company
A8
2018 2019 2018 2019
Net income / (loss) attributable to Ford (GAAP) (116)$ (1,672)$ 3,677$ 47$ Income / (Loss) attributable to noncontrolling interests 4 - 18 37
Net income / (loss) (112)$ (1,672)$ 3,695$ 84$ Less: (Provision for) / Benefit from income taxes (95) 764 (650) 724
Income / (Loss) before income taxes (17)$ (2,436)$ 4,345$ (640)$ Less: Special items pre-tax (1,179) (2,666) (1,429) (5,999)
Income / (Loss) before special items pre-tax 1,162$ 230$ 5,774$ 5,359$ Less: Interest on debt (295) (255) (1,228) (1,020)
Adjusted EBIT (Non-GAAP) 1,457$ 485$ 7,002$ 6,379$
Memo:Revenue ($B) 41.8$ 39.7$ 160.3$ 155.9$
Net income margin (GAAP) (%) (0.3) % (4.2) % 2.3 % 0.0 %
Adjusted EBIT margin (Non-GAAP) (%) 3.5 % 1.2 % 4.4 % 4.1 %
Q4 FY
36
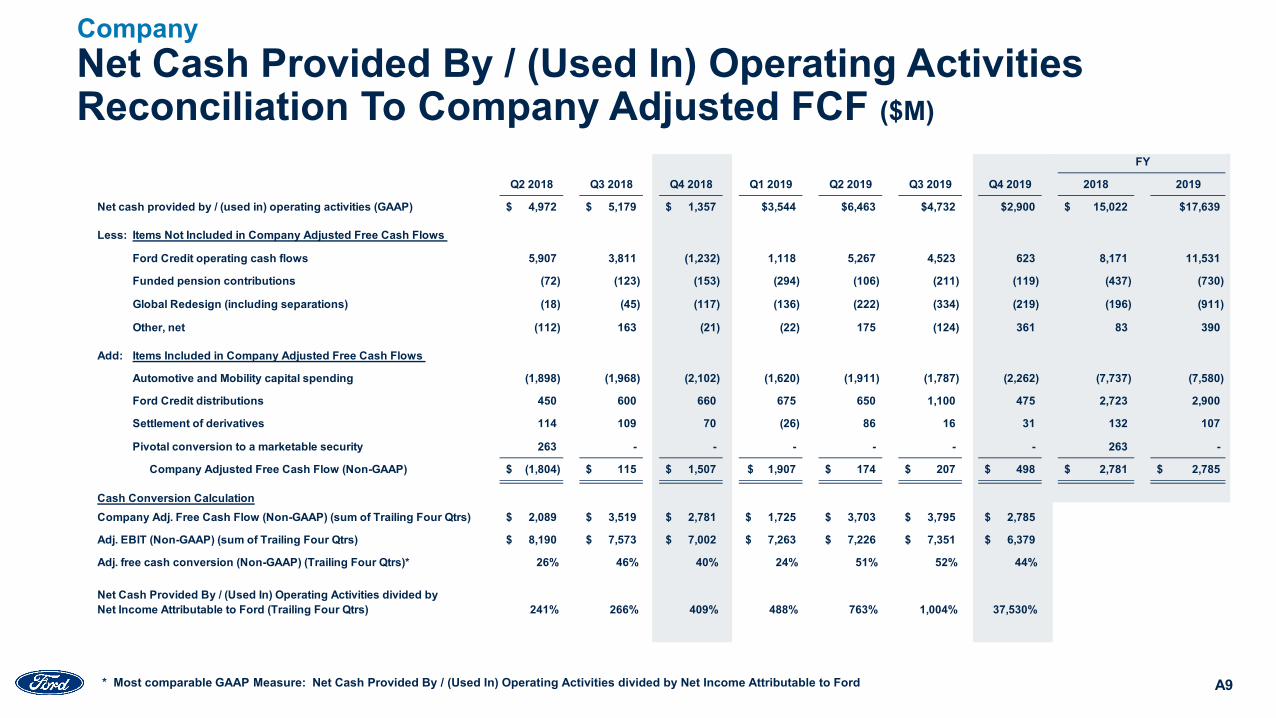
Net Cash Provided By / (Used In) Operating Activities Reconciliation To Company Adjusted FCF ($M)
A9
Company
* Most comparable GAAP Measure: Net Cash Provided By / (Used In) Operating Activities divided by Net Income Attributable to Ford
Q2 2018 Q3 2018 Q4 2018 Q1 2019 Q2 2019 Q3 2019 Q4 2019 2018 2019
Net cash provided by / (used in) operating activities (GAAP) 4,972$ 5,179$ 1,357$ $3,544 $6,463 $4,732 $2,900 15,022$ $17,639
Less: Items Not Included in Company Adjusted Free Cash Flows
Ford Credit operating cash flows 5,907 3,811 (1,232) 1,118 5,267 4,523 623 8,171 11,531
Funded pension contributions (72) (123) (153) (294) (106) (211) (119) (437) (730)
Global Redesign (including separations) (18) (45) (117) (136) (222) (334) (219) (196) (911)
Other, net (112) 163 (21) (22) 175 (124) 361 83 390
Add: Items Included in Company Adjusted Free Cash Flows
Automotive and Mobility capital spending (1,898) (1,968) (2,102) (1,620) (1,911) (1,787) (2,262) (7,737) (7,580)
Ford Credit distributions 450 600 660 675 650 1,100 475 2,723 2,900
Settlement of derivatives 114 109 70 (26) 86 16 31 132 107
Pivotal conversion to a marketable security 263 - - - - - - 263 -
Company Adjusted Free Cash Flow (Non-GAAP) (1,804)$ 115$ 1,507$ 1,907$ 174$ 207$ 498$ 2,781$ 2,785$
Cash Conversion CalculationCompany Adj. Free Cash Flow (Non-GAAP) (sum of Trailing Four Qtrs) 2,089$ 3,519$ 2,781$ 1,725$ 3,703$ 3,795$ 2,785$
Adj. EBIT (Non-GAAP) (sum of Trailing Four Qtrs) 8,190$ 7,573$ 7,002$ 7,263$ 7,226$ 7,351$ 6,379$
Adj. free cash conversion (Non-GAAP) (Trailing Four Qtrs)* 26% 46% 40% 24% 51% 52% 44%
241% 266% 409% 488% 763% 1,004% 37,530%
FY
Net Cash Provided By / (Used In) Operating Activities divided byNet Income Attributable to Ford (Trailing Four Qtrs)
37
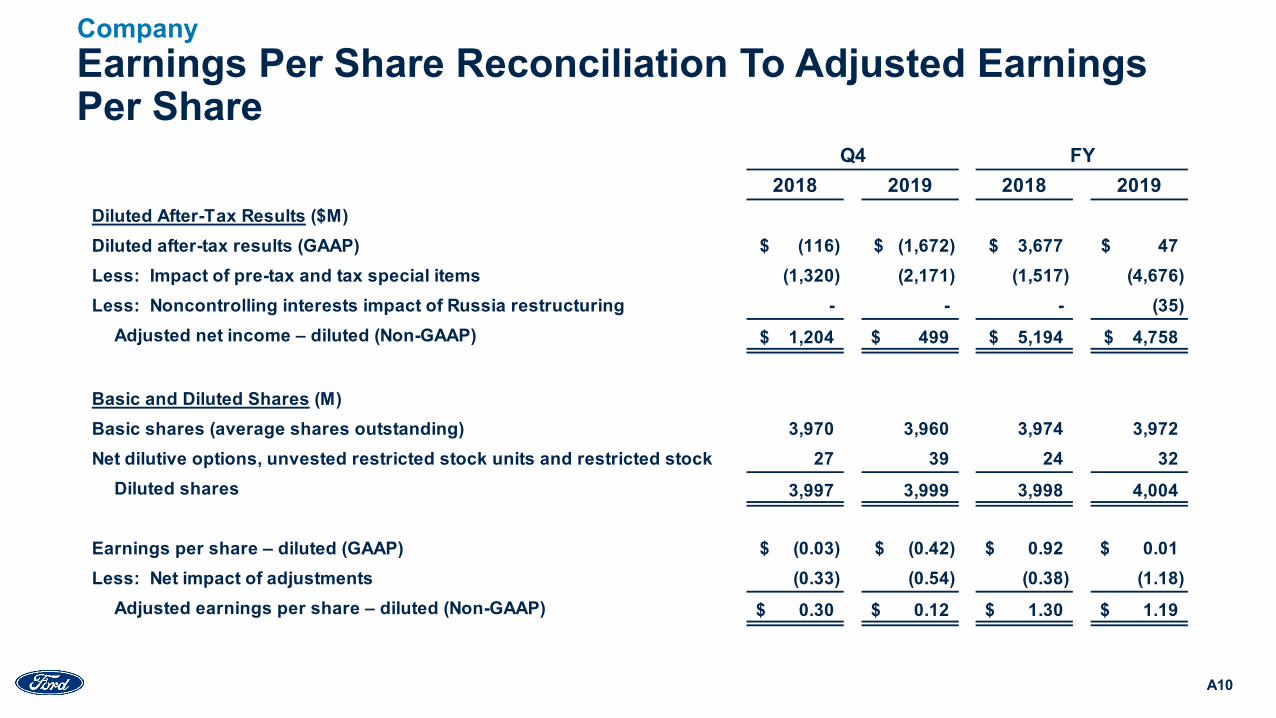
Earnings Per Share Reconciliation To Adjusted Earnings Per Share
2018 2019 2018 2019Diluted After-Tax Results ($M)Diluted after-tax results (GAAP) (116)$ (1,672)$ 3,677$ 47$ Less: Impact of pre-tax and tax special items (1,320) (2,171) (1,517) (4,676) Less: Noncontrolling interests impact of Russia restructuring - - - (35)
Adjusted net income – diluted (Non-GAAP) 1,204$ 499$ 5,194$ 4,758$
Basic and Diluted Shares (M)Basic shares (average shares outstanding) 3,970 3,960 3,974 3,972 Net dilutive options, unvested restricted stock units and restricted stock 27 39 24 32
Diluted shares 3,997 3,999 3,998 4,004
Earnings per share – diluted (GAAP) (0.03)$ (0.42)$ 0.92$ 0.01$ Less: Net impact of adjustments (0.33) (0.54) (0.38) (1.18)
Adjusted earnings per share – diluted (Non-GAAP) 0.30$ 0.12$ 1.30$ 1.19$
Q4 FY
Company
A10
38
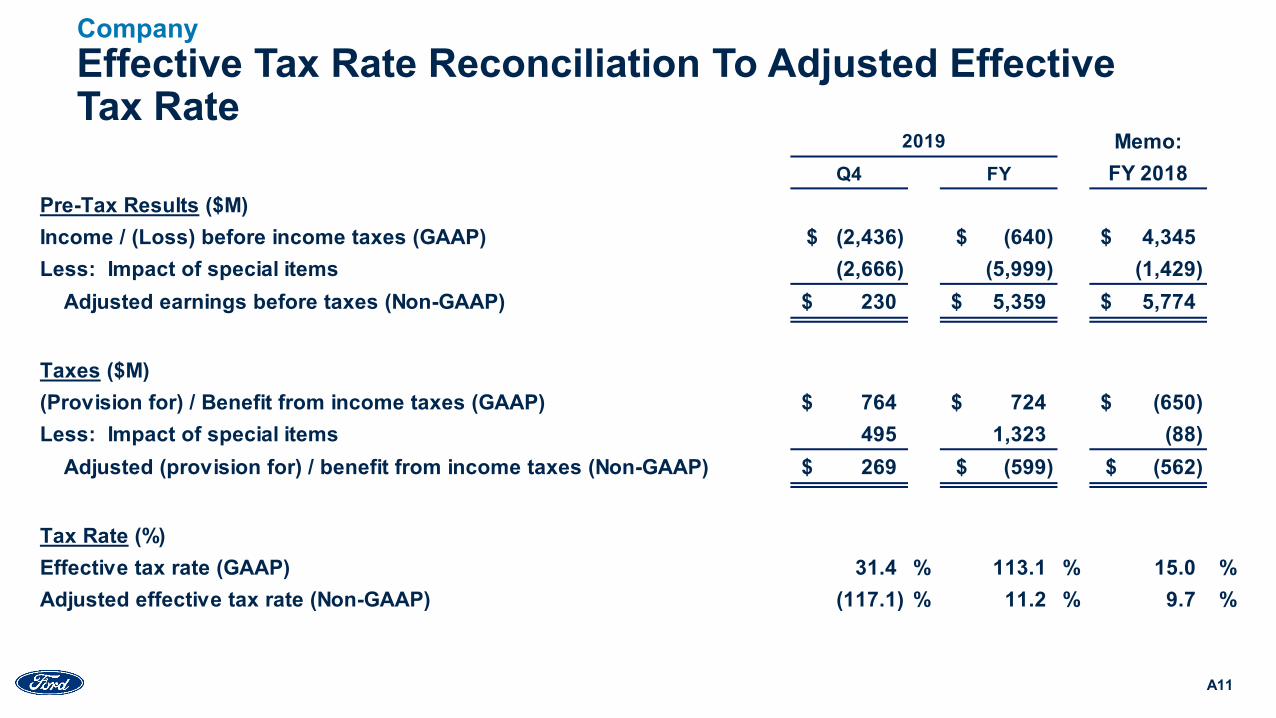
Effective Tax Rate Reconciliation To Adjusted Effective Tax Rate
Company
A11
Memo:Q4 FY FY 2018
Pre-Tax Results ($M)Income / (Loss) before income taxes (GAAP) (2,436)$ (640)$ 4,345$ Less: Impact of special items (2,666) (5,999) (1,429)
Adjusted earnings before taxes (Non-GAAP) 230$ 5,359$ 5,774$
Taxes ($M)(Provision for) / Benefit from income taxes (GAAP) 764$ 724$ (650)$ Less: Impact of special items 495 1,323 (88)
Adjusted (provision for) / benefit from income taxes (Non-GAAP) 269$ (599)$ (562)$
Tax Rate (%)Effective tax rate (GAAP) 31.4 % 113.1 % 15.0 %Adjusted effective tax rate (Non-GAAP) (117.1) % 11.2 % 9.7 %
2019
39
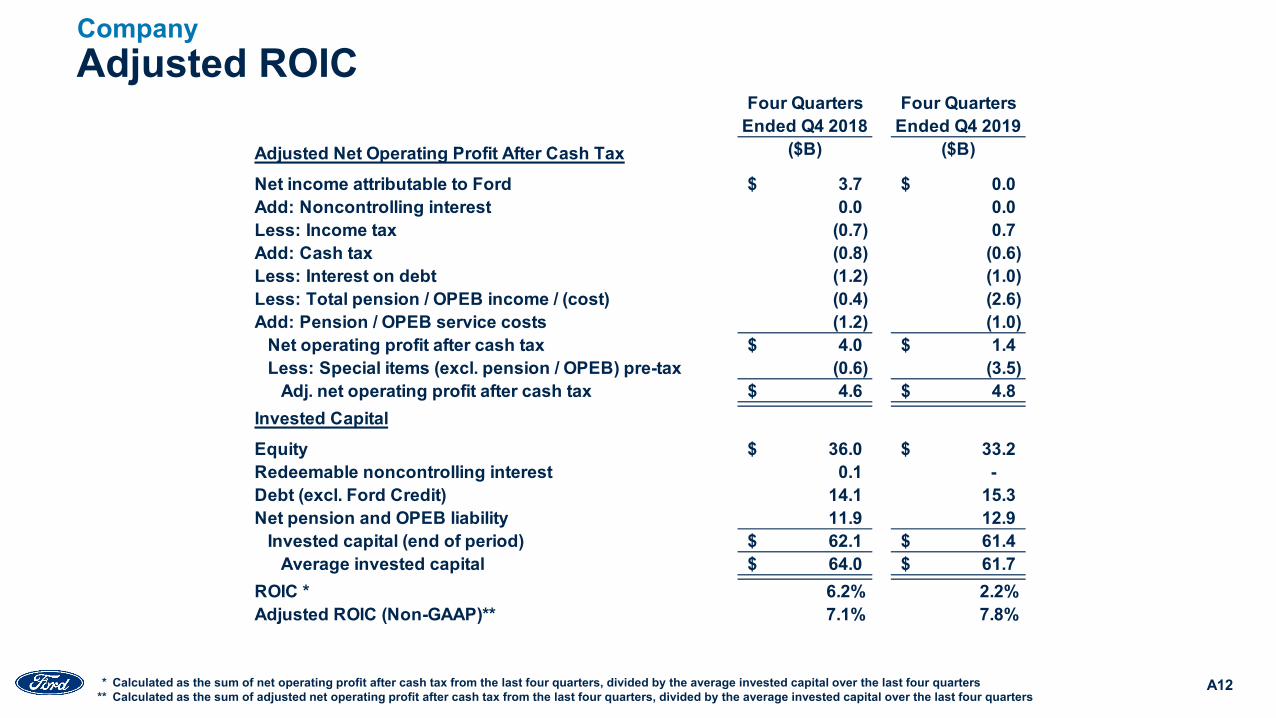
Adjusted ROIC
* Calculated as the sum of net operating profit after cash tax from the last four quarters, divided by the average invested capital over the last four quarters** Calculated as the sum of adjusted net operating profit after cash tax from the last four quarters, divided by the average invested capital over the last four quarters
Company
A12
Four Quarters Four QuartersEnded Q4 2018 Ended Q4 2019
Adjusted Net Operating Profit After Cash Tax ($B) ($B)
Net income attributable to Ford 3.7$ 0.0$ Add: Noncontrolling interest 0.0 0.0 Less: Income tax (0.7) 0.7 Add: Cash tax (0.8) (0.6) Less: Interest on debt (1.2) (1.0) Less: Total pension / OPEB income / (cost) (0.4) (2.6) Add: Pension / OPEB service costs (1.2) (1.0)
Net operating profit after cash tax 4.0$ 1.4$ Less: Special items (excl. pension / OPEB) pre-tax (0.6) (3.5)
Adj. net operating profit after cash tax 4.6$ 4.8$ Invested CapitalEquity 36.0$ 33.2$ Redeemable noncontrolling interest 0.1 - Debt (excl. Ford Credit) 14.1 15.3 Net pension and OPEB liability 11.9 12.9
Invested capital (end of period) 62.1$ 61.4$ Average invested capital 64.0$ 61.7$
ROIC * 6.2% 2.2%Adjusted ROIC (Non-GAAP)** 7.1% 7.8%
40
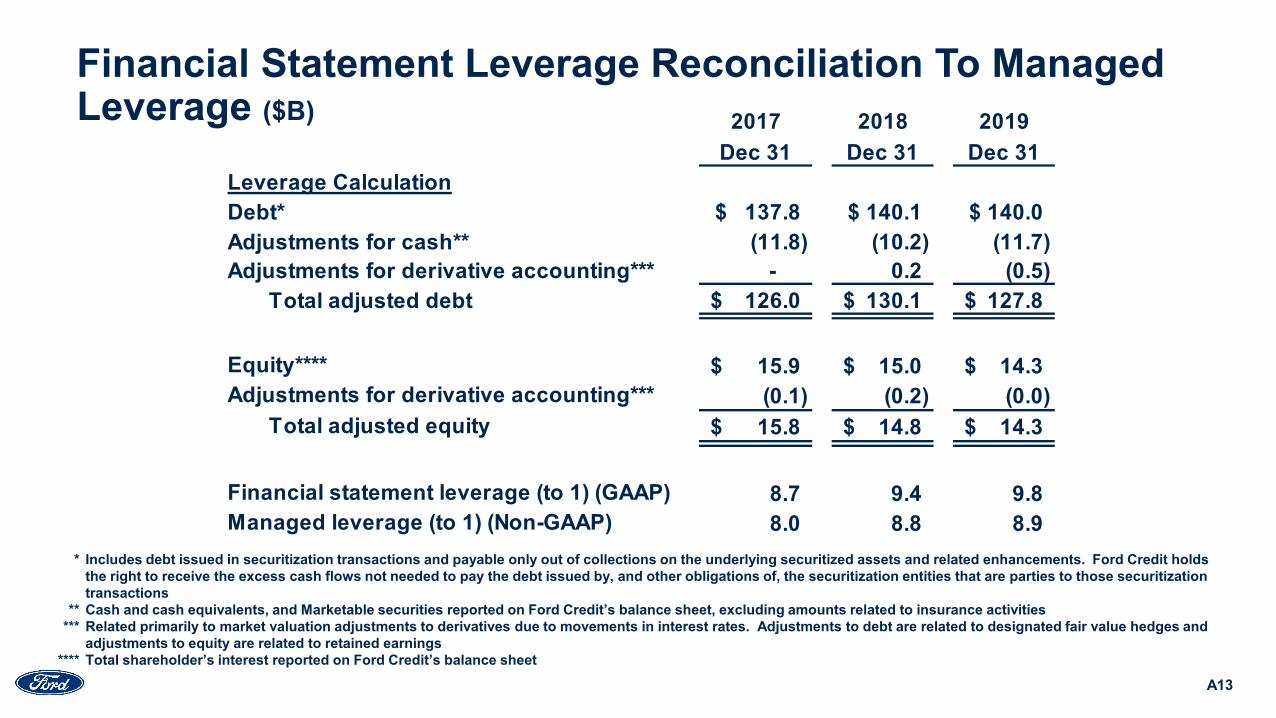
Financial Statement Leverage Reconciliation To Managed Leverage ($B)
* Includes debt issued in securitization transactions and payable only out of collections on the underlying securitized assets and related enhancements. Ford Credit holds the right to receive the excess cash flows not needed to pay the debt issued by, and other obligations of, the securitization entities that are parties to those securitization transactions
** Cash and cash equivalents, and Marketable securities reported on Ford Credit’s balance sheet, excluding amounts related to insurance activities*** Related primarily to market valuation adjustments to derivatives due to movements in interest rates. Adjustments to debt are related to designated fair value hedges and
adjustments to equity are related to retained earnings**** Total shareholder’s interest reported on Ford Credit’s balance sheet
2017 2018 2019Dec 31 Dec 31 Dec 31
Leverage CalculationDebt* 137.8$ 140.1$ 140.0$ Adjustments for cash** (11.8) (10.2) (11.7) Adjustments for derivative accounting*** - 0.2 (0.5)
Total adjusted debt 126.0$ 130.1$ 127.8$
Equity**** 15.9$ 15.0$ 14.3$ Adjustments for derivative accounting*** (0.1) (0.2) (0.0)
Total adjusted equity 15.8$ 14.8$ 14.3$
Financial statement leverage (to 1) (GAAP) 8.7 9.4 9.8 Managed leverage (to 1) (Non-GAAP) 8.0 8.8 8.9
A13
41
Non-GAAP Financial Measures That Supplement GAAP Measures• We use both GAAP and non-GAAP financial measures for operational and financial decision making, and to assess Company and segment business performance. The non-
GAAP measures listed below are intended to be considered by users as supplemental information to their equivalent GAAP measures, to aid investors in better understanding our financial results. We believe that these non-GAAP measures provide useful perspective on underlying business results and trends, and a means to assess our period-over-period results. These non-GAAP measures should not be considered as a substitute for, or superior to, measures of financial performance prepared in accordance with GAAP. These non-GAAP measures may not be the same as similarly titled measures used by other companies due to possible differences in method and in items or events being adjusted.
• Company Adjusted EBIT (Most Comparable GAAP Measure: Net income attributable to Ford) – Earnings before interest and taxes (EBIT) excludes interest on debt (excl. Ford Credit Debt), taxes and pre-tax special items. This non-GAAP measure is useful to management and investors because it allows users to evaluate our operating results aligned with industry reporting. Pre-tax special items consist of (i) pension and OPEB remeasurement gains and losses, (ii) significant personnel expenses, dealer-related costs, and facility-related charges stemming from efforts to match production capacity and cost structure to market demand and changing model mix, and (iii) other items that we do not necessarily consider to be indicative of earnings from ongoing operating activities. When we provide guidance for adjusted EBIT, we do not provide guidance on a net income basis because the GAAP measure will include potentially significant special items that have not yet occurred and are difficult to predict with reasonable certainty prior to year-end, including pension and OPEB remeasurement gains and losses.
• Company Adjusted EBIT Margin (Most Comparable GAAP Measure: Company Net Income Margin) – Company Adjusted EBIT margin is Company Adjusted EBIT divided by Company revenue. This non-GAAP measure is useful to management and investors because it allows users to evaluate our operating results aligned with industry reporting.
• Adjusted Earnings Per Share (Most Comparable GAAP Measure: Earnings Per Share) – Measure of Company’s diluted net earnings per share adjusted for impact of pre-tax special items (described above), tax special items and restructuring impacts in noncontrolling interests. The measure provides investors with useful information to evaluate performance of our business excluding items not indicative of the underlying run rate of our business. When we provide guidance for adjusted earnings per share, we do not provide guidance on an earnings per share basis because the GAAP measure will include potentially significant special items that have not yet occurred and are difficult to predict with reasonable certainty prior to year-end, including pension and OPEB remeasurement gains and losses.
• Adjusted Effective Tax Rate (Most Comparable GAAP Measure: Effective Tax Rate) – Measure of Company’s tax rate excluding pre-tax special items (described above) and tax special items. The measure provides an ongoing effective rate which investors find useful for historical comparisons and for forecasting. When we provide guidance for adjusted effective tax rate, we do not provide guidance on an effective tax rate basis because the GAAP measure will include potentially significant special items that have not yet occurred and are difficult to predict with reasonable certainty prior to year-end, including pension and OPEB remeasurement gains and losses.
A14
42
Non-GAAP Financial Measures That Supplement GAAP Measures• Company Adjusted Free Cash Flow (FCF) (Most Comparable GAAP Measure: Net Cash Provided By / (Used In) Operating Activities) – Measure of Company’s operating cash
flow excluding Ford Credit’s operating cash flows. The measure contains elements management considers operating activities, including Automotive and Mobility capital spending, Ford Credit distributions to its parent, and settlement of derivatives. The measure excludes cash outflows for funded pension contributions, global redesign (including separations), and other items that are considered operating cash flows under GAAP. This measure is useful to management and investors because it is consistent with management’s assessment of the Company’s operating cash flow performance. When we provide guidance for Company Adjusted FCF, we do not provide guidance for net cash provided by/(used in) operating activities because the GAAP measure will include items that are difficult to quantify or predict with reasonable certainty, including cash flows related to the Company's exposures to foreign currency exchange rates and certain commodity prices (separate from any related hedges), Ford Credit's operating cash flows, and cash flows related to special items, including separation payments, each of which individually or in the aggregate could have a significant impact to our net cash provided by/(used in) our operating activities.
• Adjusted Free Cash Flow Conversion (Most Comparable GAAP Measure: Net Cash Provided By / (Used In) Operating Activities divided by Net Income Attributable to Ford) –Company Adjusted Free Cash Flow Conversion is Company Adjusted FCF divided by Company Adjusted EBIT. This non-GAAP measure is useful to management and investors because it allows users to evaluate how much of Ford's Adjusted EBIT is converted into cash flow.
• Adjusted ROIC – Calculated as the sum of adjusted net operating profit after cash tax from the last four quarters, divided by the average invested capital over the last four quarters. This calculation provides management and investors with useful information to evaluate the Company’s after-cash tax operating return on its invested capital for the period presented. Adjusted net operating profit after cash tax measures operating results less special items, interest on debt (excl. Ford Credit Debt), and certain pension/OPEB costs. Average invested capital is the sum of average balance sheet equity, debt (excl. Ford Credit Debt), and net pension/OPEB liability.
• Ford Credit Managed Receivables – (Most Comparable GAAP Measure: Net Finance Receivables plus Net Investment in Operating Leases) – Measure of Ford Credit’s Total net receivables and Held-for-sale receivables, excluding unearned interest supplements and residual support, allowance for credit losses, and other (primarily accumulated supplemental depreciation). The measure is useful to management and investors as it closely approximates the customer’s outstanding balance on the receivables, which is the basis for earning revenue.
• Ford Credit Managed Leverage (Most Comparable GAAP Measure: Financial Statement Leverage) – Ford Credit’s debt-to-equity ratio adjusted (i) to exclude cash, cash equivalents, and marketable securities (other than amounts related to insurance activities), and (ii) for derivative accounting. The measure is useful to investors because it reflects the way Ford Credit manages its business. Cash, cash equivalents, and marketable securities are deducted because they generally correspond to excess debt beyond the amount required to support operations and on-balance sheet securitization transactions. Derivative accounting adjustments are made to asset, debt, and equity positions to reflect the impact of interest rate instruments used with Ford Credit’s term-debt issuances and securitization transactions. Ford Credit generally repays its debt obligations as they mature, so the interim effects of changes in market interest rates are excluded in the calculation of managed leverage.
A15
43
Definitions And Calculations
A16
Automotive Records• References to Automotive records for EBIT margin and business units are since at least 2009Wholesale Units and Revenue• Wholesale unit volumes include all Ford and Lincoln badged units (whether produced by Ford or by an unconsolidated affiliate) that are sold to dealerships, units
manufactured by Ford that are sold to other manufacturers, units distributed by Ford for other manufacturers, and local brand units produced by our China joint venture, Jiangling Motors Corporation, Ltd. (“JMC”), that are sold to dealerships. Vehicles sold to daily rental car companies that are subject to a guaranteed repurchase option (i.e., rental repurchase), as well as other sales of finished vehicles for which the recognition of revenue is deferred (e.g., consignments), also are included in wholesale unit volumes. Revenue from certain vehicles in wholesale unit volumes (specifically, Ford badged vehicles produced and distributed by our unconsolidated affiliates, as well as JMC brand vehicles) are not included in our revenue
Industry Volume and Market Share• Industry volume and market share are based, in part, on estimated vehicle registrations; includes medium and heavy duty trucks SAAR• SAAR means seasonally adjusted annual rateCompany Cash• Company cash includes cash, cash equivalents, marketable securities and restricted cash; excludes Ford Credit’s cash, cash equivalents, marketable securities and
restricted cashMarket Factors• Volume and Mix – primarily measures EBIT variance from changes in wholesale volumes (at prior-year average contribution margin per unit) driven by changes in industry
volume, market share, and dealer stocks, as well as the EBIT variance resulting from changes in product mix, including mix among vehicle lines and mix of trim levels and options within a vehicle line
• Net Pricing – primarily measures EBIT variance driven by changes in wholesale prices to dealers and marketing incentive programs such as rebate programs, low-rate financing offers, special lease offers and stock accrual adjustments on dealer inventory
• Market Factors exclude the impact of unconsolidated affiliate wholesalesEarnings Before Taxes (EBT)• Reflects Income before income taxes