Embed Size (px)
Citation preview

Q4 2017 Earnings
November 1, 2017
Forward-Looking Statementsand Non-GAAP Measures
2
Forward-Looking StatementsThis presentation contains certain “forward-looking statements” within the meaning of the U.S. Private Securities Litigation Reform Act of
1995. These statements are based on management’s current expectations and are subject to risks, uncertainty and changes in
circumstances, which may cause actual results, performance, financial condition or achievements to differ materially from anticipated results,
performance, financial condition or achievements. All statements contained herein that are not clearly historical in nature are forward-looking
and the words “anticipate,” “believe,” “expect,” “estimate,” “plan,” and similar expressions are generally intended to identify forward-looking
statements. We have no intention and are under no obligation to update or alter (and expressly disclaim any such intention or obligation to do
so) our forward-looking statements whether as a result of new information, future events or otherwise, except to the extent required by law.
The forward-looking statements in this presentation include statements addressing our future financial condition and operating results.
Examples of factors that could cause actual results to differ materially from those described in the forward-looking statements include,
among others, business, economic, competitive and regulatory risks, such as conditions affecting demand for products, particularly in the
automotive and data and devices industries; competition and pricing pressure; fluctuations in foreign currency exchange rates and
commodity prices; natural disasters and political, economic and military instability in countries in which we operate; developments in the
credit markets; future goodwill impairment; compliance with current and future environmental and other laws and regulations; and the
possible effects on us of changes in tax laws, tax treaties and other legislation. More detailed information about these and other factors is set
forth in TE Connectivity Ltd.’s Annual Report on Form 10-K for the fiscal year ended Sept. 30, 2016 as well as in our Quarterly Reports on
Form 10-Q, Current Reports on Form 8-K and other reports filed by us with the U.S. Securities and Exchange Commission.
Non-GAAP Financial MeasuresWhere we have used non-GAAP financial measures, reconciliations to the most comparable GAAP measure are provided, along with a
disclosure on the usefulness of the non-GAAP measure, in this presentation.

Record Q4 performance above Guidance with double digit revenue and EPS growth
• Sales of $3.5B, up 12% Y/Y and up 9% organically
• Organic growth across all segments and regions
• Transportation grew 13% organically as content growth continues to drive market outperformance
• Organic growth of 6% in Industrial driven by strength in factory automation & medical applications
• Communications grew 4% organically driven by strength in both Appliances and Data & Devices
• Strong execution drove margin expansion and double digit EPS growth
• Expanded Adjusted Operating margins by 70bps to 16.7%
• Adjusted EPS of $1.25, up 10% Y/Y driven by operational strength partially offset by an $0.08 headwind
from tax
• Free Cash Flow of $691M with $376M returned to shareholders
Note: Comments exclude an additional week in FY16, which contributed sales of $238M and Adjusted EPS of $0.13
Q4 Highlights
3
Net Sales Growth Excluding the Impact of the Additional Week, Organic Net Sales Growth Excluding the Impact of the Additional
Week, Adjusted Operating Margin Excluding the Impact of the Additional Week, Adjusted EPS Excluding the Impact of the
Additional Week, and Free Cash Flow are non-GAAP measures; see Appendix for description and reconciliation.

Sales up 9% and Adjusted EPS up 22% year on year
Continued strong execution with growth above market
• Sales of $13.1B, up 9% Y/Y and up 8% organically
• Double digit organic growth in Transportation with content growth driving significant performance above market
• Industrial Solutions grew 4% organically driven by strength in factory automation and medical applications
• Communications grew 7% organically with growth across all businesses
• Adjusted Operating Margins of 16.8%, up 110bps Y/Y with expansion in all segments
• Adjusted EPS of $4.83, up 22% Y/Y
• Generated $1.7B of Free Cash Flow; returned $1.2B to shareholders
Positioned for continued growth and EPS expansion
• Growth supported by strong secular trends and content growth
• Multiple levers to drive further operating margin expansion
• Portfolio expansion with acquisitions in fast-growing interventional medical and auto applications
• Continuing our balanced capital strategy
• FY18 Guidance of $13.9B and $5.23 Adjusted EPS at the mid-point
• Year over year sales growth of 6% with 4% organic growth
• 8% Adjusted EPS growth despite a $0.17 headwind from tax
Note: Comments exclude an additional week in FY16, which contributed sales of $238M and Adjusted EPS of $0.13
FY17 Highlights
4Organic Net Sales Growth, Net Sales Growth Excluding the Impact of the Additional Week, Organic Net Sales Growth Excluding the Impact of the Additional Week,
Adjusted Operating Margin Excluding the Impact of the Additional Week, Adjusted EPS, Adjusted EPS Excluding the Impact of the Additional Week, and Free Cash
Flow are non-GAAP measures; see Appendix for description and reconciliation.

Reported FY16 FY17 FY17 Q4 Y/Y Growth**
Q4** Q3 Q4 Reported Organic
Transportation 1,704 1,887 1,918 13% 11%
Industrial 830 951 951 15% 8%
Communications
Ex SubCom*412 432 437 6% 6%
Total TE
Ex SubCom*2,946 3,270 3,306 12% 10%
Book to Bill
Ex SubCom*1.03 1.06 1.02
Segment Orders Summary($ in millions)
5
• Transportation Y/Y
growth in all regions
• Industrial Y/Y growth
across regions driven by
Industrial Equipment
• Communications Y/Y
growth driven by strength
in Asia in both Data and
Devices and Appliances
Continued order momentum across segments supporting growth outlook
*SubCom is a project based business and excluded from the summary to provide a comparable view of orders in each period.
** Based on a 13 week quarter.

Y/Y Growth Rates Reported Organic
Automotive $1,350 12% 10%
Commercial
Transportation274 37% 37%
Sensors 220 12% 9%
Transportation
Solutions$1,844 15% 13%
$ in Millions
Sales Business Performance
19.2%18.2%
Q4 2016 Q4 2017
Reported
Up 15%
Organic
Up 13%
Y/Y Growth Rates Reported Organic
Orders $1,918 13% 11%
Adjusted Operating Margin
Segment operating
margins impacted
by ~150bps due to
near term supply
chain inefficiencies
$1,606
$1,844
Q4 2016 Q4 2017
Transportation Solutions
6
Adjusted EBITDA Margin 24.4% 23.4%
• Automotive sales significantly above production of 1%
driven by content expansion and growth in all regions
• Commercial Transportation organic growth well above
market with strength across all regions and content gains
• Sensors organic growth driven by Transportation and
Industrial applications
• Q1 FY18 Adjusted Operating Margin expected to be
above 19%
Note: Amounts and comments exclude an additional week in FY16.
Net Sales Excluding the Impact of the Additional Week, Net Sales Growth Excluding the Impact of the Additional Week, Organic Net Sales Growth Excluding the Impact of the Additional Week,
Adjusted Operating Margin Excluding the Impact of the Additional Week and Adjusted EBITDA Margin Excluding the Impact of the Additional Week are non-GAAP measures: see Appendix for
description and reconciliation.

Y/Y Growth Rates Reported Organic
Industrial Equipment $490 24% 13%
Aerospace, Defense
and Marine 284 2% 1%
Energy 180 -% (2)%
Industrial Solutions $954 12% 6%
$ in Millions
Sales
• Industrial Equipment organic growth across all regions
driven by factory automation and medical applications
• AD&M performance driven by strength in Defense,
partially offset by Commercial Air
• Energy decline driven by Europe partly offset by growth
in the Americas
Business Performance
Reported
Up 12%
Organic
Up 6%
Adjusted Operating Margin
Industrial Solutions
7
Y/Y Growth Rates Reported Organic
Orders $951 15% 8%
$854
$954
Q4 2016 Q4 2017
13.0%
13.8%
Q4 2016 Q4 2017
Margin expansion of
80bps as expected
Adjusted EBITDA Margin 16.9% 18.4%
Note: Amounts and comments exclude an additional week in FY16.
Net Sales Excluding the Impact of the Additional Week, Net Sales Growth Excluding the Impact of the Additional Week, Organic Net Sales Growth Excluding the Impact of the Additional Week,
Adjusted Operating Margin Excluding the Impact of the Additional Week and Adjusted EBITDA Margin Excluding the Impact of the Additional Week are non-GAAP measures: see Appendix for
description and reconciliation.

12.1%
16.4%
Q4 2016 Q4 2017
$634 $658
Q4 2016 Q4 2017
Y/Y Growth Rates Reported Organic
Data & Devices $254 5% 6%
Appliances 182 10% 10%
SubCom 222 (3)% (3)%
Communications
Solutions$658 4% 4%
$ in Millions
Sales
• Data & Devices growth driven by strength in Asia
• Portfolio transformation and footprint optimization
favorably impact operating margins
• Double digit Appliances driven by strength and share
gains in China
• SubCom revenue impacted by program timing but
contributed to segment margin expansion
Business Performance
Reported
Up 4%
Organic
Up 4%
Y/Y Growth Rates Reported Organic
Orders ex SubCom $437 6% 6%
Adjusted Operating Margin
Margin expansion
driven by D&D and
SubCom
8
Communications Solutions
Adjusted EBITDA Margin 16.7% 20.5%
Note: Amounts and comments exclude an additional week in FY16.
Net Sales Excluding the Impact of the Additional Week, Net Sales Growth Excluding the Impact of the Additional Week, Organic Net Sales Growth Excluding the Impact of the Additional Week,
Adjusted Operating Margin Excluding the Impact of the Additional Week and Adjusted EBITDA Margin Excluding the Impact of the Additional Week are non-GAAP measures: see Appendix for
description and reconciliation.

11.4%15.3%
FY16 FY17
FY17 Summary
9
Transportation Solutions
$6,373
$7,039
FY16 FY17
19.0%19.4%
FY16 FY17
Organic
Up 11%
Sales Adjusted
Operating Margin
Communications Solutions
$2,477
$2,567
FY16 FY17
Organic
Up 7%
Sales
$3,150
$3,507
FY16 FY17
12.2%12.7%
FY16 FY17
Organic
Up 4%
Sales
Industrial Solutions
$12,000
$13,113
FY16 FY17
15.7%
16.8%
FY16 FY17
Organic
Up 8%
Sales
TE Connectivity
$ in Millions
Note: Amounts and comments exclude an additional week in FY16.
Net Sales Excluding the Impact of the Additional Week, Organic Net Sales Growth Excluding the Impact of the Additional Week and Adjusted Operating Margin Excluding the Impact of the Additional
Week are non-GAAP measures: see Appendix for description and reconciliation.
Adjusted
Operating Margin
Adjusted
Operating MarginAdjusted
Operating Margin

Net Sales Excluding the Impact of the Additional Week, Adjusted Operating Income, Adjusted Operating Income Excluding the Impact of the Additional Week,
Adjusted Operating Margin, Adjusted Operating Margin Excluding the Impact of the Additional Week, Adjusted EPS and Adjusted EPS Excluding the Impact of the
Additional Week are non-GAAP measures; see Appendix for description and reconciliation.
*Represents Diluted Earnings Per Share from Continuing Operations
13 Week 13 Week
($ in Millions, except per share amounts) Q4 FY16 Q4 FY17
Net Sales $ 3,094 $ 3,456
Operating Income $ 462 $ 552
Operating Margin 14.9% 16.0%
Acquisition Related Charges 4 1
Restructuring & Other Charges, net 30 23
Adjusted Operating Income $ 496 $ 576
Adjusted Operating Margin 16.0% 16.7%
Earnings Per Share* $ 1.09 $ 1.21
Acquisition Related Charges 0.01 -
Restructuring & Other Charges, net 0.04 0.04
Adjusted EPS $ 1.14 $ 1.25
Q4 Financial Summary
10

$ in Millions
Adjusted Gross Margin Percentage
Adjusted Operating Margin
Free Cash Flow
Note: Adjusted Gross Margin Percentage, Adjusted Operating Margin and Adjusted EBITDA Margin exclude an additional week in FY16.
Adjusted Gross Margin Percentage, Adjusted Gross Margin Percentage Excluding the Impact of the Additional Week, Free Cash Flow, Adjusted Operating Margin,
Adjusted Operating Margin Excluding the Impact of the Additional Week, Adjusted EBITDA Margin, and Adjusted EBITDA Margin Excluding the Impact of the Additional
Week are non-GAAP measures; See Appendix for description and reconciliation.
Operating Metrics
11
Adjusted EBITDA Margin
32.8% 33.0% 33.0%
34.0%
Q4 2016 Q4 2017 FY16 FY17
16.0%
16.7%
15.7%
16.8%
Q4 2016 Q4 2017 FY16 FY17
20.7%21.5%
20.5%
21.6%
Q4 2016 Q4 2017 FY16 FY17
$604$691
Q4 2016 Q4 2017
$1,639$1,696
FY16 FY17

Guidance*
Strong start to FY18 with organic growth of 5% and 9% Adjusted EPS growth
Transportation
Solutions
Industrial
Solutions
Communications
Solutions
TE Connectivity
Highlights
Sales $3.35B to $3.45B
Adjusted EPS $1.23 to $1.27
• Sales up 10% Y/Y; Expect organic growth of 5% Y/Y
• Adjusted EPS up 9% Y/Y at the midpoint
• FX tailwind benefiting sales by ~$85M Y/Y and Adjusted
EPS by $0.03 Y/Y
Up Low Double DigitsUp Mid Single Digits Organic
Up Low Single DigitsUp Low Single Digits Organic
Up High Single DigitsUp Mid Single Digits Organic
Q1 Outlook
12
• Automotive mid single digit organic growth
expected on flat global auto production; Continued
strong momentum in Commercial Transportation
and Sensors
• Industrial Solutions growth driven by strength in
factory automation and medical applications
• Communications Solutions growth expected to be
driven by Data & Devices and Appliances
* Assumes foreign exchange rates and commodity prices that are consistent with current levels
Organic Sales Growth and Adjusted EPS are non-GAAP measures; see Appendix for description and reconciliation.

4% organic growth and Adjusted EPS up 8% Y/Y
Sales of $13.7B to $14.1B
Adjusted EPS of $5.13 to $5.33
• Sales up 6% Y/Y; Expect organic growth of 4% Y/Y
• Adjusted EPS up 8% Y/Y at midpoint
• FX tailwind benefiting sales by ~$130M Y/Y and
Adjusted EPS by $0.05 Y/Y
• Y/Y tax rate negatively impacts Adjusted EPS by $0.17
Up High Single DigitsUp Mid Single Digits Organic
Up Low Single Digits Up Low Single Digits Organic
Up Mid Single DigitsUp Mid Single Digits Organic
FY18 OutlookGuidance*
Transportation
Solutions
Industrial
Solutions
TE Connectivity
Highlights
13
Communications
Solutions
• Expect organic Auto growth of mid-single digits
on ~1% production growth, reflecting content
gains; Expect continued market outperformance
in Commercial Transportation and continued
growth in Sensors
• Industrial organic growth driven by factory
automation and medical applications
• Communications organic growth expected to
continue in Data & Devices and Appliances offset
partially by SubCom program timing
* Assumes foreign exchange rates and commodity prices that are consistent with current levels
Organic Sales Growth and Adjusted EPS are non-GAAP measures; see Appendix for description and reconciliation.

Additional Information
14

Y/Y Q4 2017
15
Sales(in millions)
Adjusted
EPS
Q4 2016 Results (13 weeks) $3,094 $1.14
Operational Performance 286 0.14
Acquisitions / Divestitures, net* 35 0.03
Tax Rate Impact - (0.08)
FX Impact 41 0.02
Q4 2017 Results $3,456 $1.25
* The impact of Acquisitions and Divestitures is shown until one year after the event. Upon the annual anniversary, the impact is
considered to be operational.
Net Sales Excluding the Impact of the Additional Week, Adjusted Earnings Per Share Excluding the Impact of the Additional Week, and Adjusted EPS are
non-GAAP measures; See Appendix for description and reconciliation.

Y/Y FY 2017
16
1H 2H FY17
Sales(in millions)
Adjusted
EPS
Sales(in millions)
Adjusted
EPS
Sales(in millions)
Adjusted
EPS
2016 Results – 52
Weeks$5,785 $1.74 $6,215 $2.21 $12,000 $3.95
Operational Performance 429 0.36 545 0.29 974 0.65
Acquisitions /
Divestitures, net*146 0.05 76 0.05 222 0.10
Share Repurchase - 0.12 - 0.02 - 0.14
Tax Rate Impact - 0.10 - (0.07) - 0.03
FX Impact (70) (0.03) (13) (0.01) (83) (0.04)
2017 Results $6,290 $2.34 $6,823 $2.49 $13,113 $4.83
* The impact of Acquisitions and Divestitures is shown until one year after the event. Upon the annual anniversary, the impact is
considered to be operational.
Net Sales Excluding the Impact of the Additional Week, Adjusted Earnings Per Share Excluding the Impact of the Additional Week, and Adjusted EPS are
non-GAAP measures; See Appendix for description and reconciliation.

Y/Y Q1 2018
17
Sales(in millions)
Adjusted
EPS
Q1 2017 Results $3,063 $1.15
Operational Performance 231 0.06
FX Impact 86 0.03
Tax Rate Impact - 0.01
Q1 2018 Guidance $3,380 $1.25
Guidance Range:
Sales of $3.35B - $3.45B
Adjusted EPS of $1.23 – $1.27
New acquisitions minimally accretive in first year
Adjusted EPS is a non-GAAP measures; See Appendix for description and reconciliation.

Y/Y FY 2018
18
Sales(in millions)
Adjusted
EPS
2017 Results $13,113 $4.83
Operational Performance 657 0.39
FX Impact 130 0.05
Share Repurchase / Interest - 0.13
Tax Rate Impact - (0.17)
2018 Guidance $13,900 $5.23
Guidance Range
Sales of $13.7B - $14.1B
Adjusted EPS of $5.13 - $5.33
Adjusted EPS is a non-GAAP measures; See Appendix for description and reconciliation.

($ in Millions) Q4 2016 Q4 2017
Beginning Cash Balance $694 $755
Free Cash Flow 604 691
Dividends (132) (141)
Share repurchases (130) (238)
Acquisitions and Divestiture, net (335) (173)
Net Increase in Debt 32 332
Other (86) (8)
Ending Cash Balance $647 $1,218
Total Debt $4,070 $4,344
($ in Millions) Q4 2016 Q4 2017
Cash from Continuing Operations $782 $873
Capital expenditures, net
Cash paid pursuant to collateral requirements
related to cross currency swaps
Pre-separation and BNS related tax
payments, net
(203)
10
15
(243)
61
-
Free Cash Flow $604 $691
A/R - $ $2,046 $2,290
Days Sales Outstanding* 60 60
Inventory (Excl. CIP) - $ $1,414 $1,696
Days on Hand* 62 66
Accounts Payable - $ $1,090 $1,436
Days Outstanding* 47 56
Free Cash Flow is a non-GAAP measure, see Appendix for description
* Adjusted to exclude the impact of acquisitions
Free Cash Flow and Working Capital Liquidity, Cash & Debt
Q4 Balance Sheet & Cash Flow Summary
19

Impact of Additional Week in Q4 FY16
20
Q4 2016 Q4 2017
Based on comparable 13 week basis
Q4 SalesImpact of
14th WeekSales
(Normalized)Q4 Sales
Reported
Growth
Organic
Growth
Automotive $1,311 $(102) $1,209 $1,350 12% 10%
Commercial Transportation 215 (15) 200 274 37% 37%
Sensors 210 (13) 197 220 12% 9%
Transportation Solutions 1,736 (130) 1,606 1,844 15% 13%
Industrial Equipment 427 (32) 395 490 24% 13%
Aerospace, Defense, Oil & Gas 299 (20) 279 284 2% 1%
Energy 193 (13) 180 180 -% (2)%
Industrial Solutions 919 (65) 854 954 12% 6%
Data and Devices 262 (21) 241 254 5% 6%
Subsea Communications 239 (11) 228 222 (3)% (3)%
Appliances 176 (11) 165 182 10% 10%
Communications Solutions 677 (43) 634 658 4% 4%
Total TE $3,332 $(238) $3,094 $3,456 12% 9%
Net Sales Excluding the Impact of the Additional Week, Net Sales Growth Excluding the Impact of the Additional Week and Organic Net Sales Growth Excluding the Impact of the Additional Week are non-GAAP measures; see Appendix for description and reconciliation.

Appendix
21
22
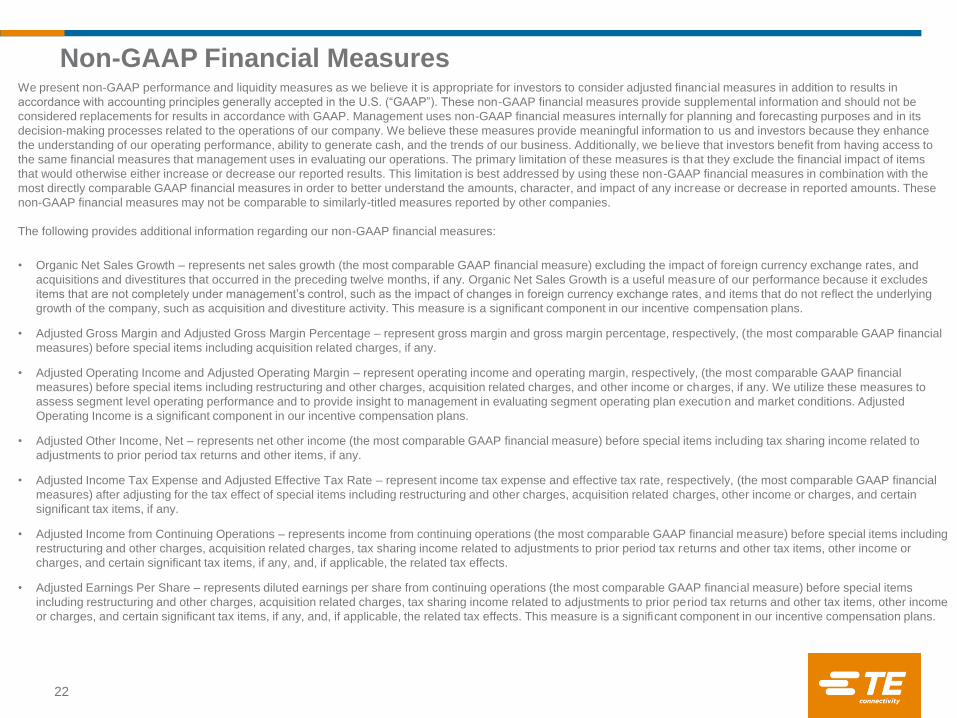
Non-GAAP Financial MeasuresWe present non-GAAP performance and liquidity measures as we believe it is appropriate for investors to consider adjusted financial measures in addition to results in
accordance with accounting principles generally accepted in the U.S. (“GAAP”). These non-GAAP financial measures provide supplemental information and should not be
considered replacements for results in accordance with GAAP. Management uses non-GAAP financial measures internally for planning and forecasting purposes and in its
decision-making processes related to the operations of our company. We believe these measures provide meaningful information to us and investors because they enhance
the understanding of our operating performance, ability to generate cash, and the trends of our business. Additionally, we believe that investors benefit from having access to
the same financial measures that management uses in evaluating our operations. The primary limitation of these measures is that they exclude the financial impact of items
that would otherwise either increase or decrease our reported results. This limitation is best addressed by using these non-GAAP financial measures in combination with the
most directly comparable GAAP financial measures in order to better understand the amounts, character, and impact of any increase or decrease in reported amounts. These
non-GAAP financial measures may not be comparable to similarly-titled measures reported by other companies.
The following provides additional information regarding our non-GAAP financial measures:
• Organic Net Sales Growth – represents net sales growth (the most comparable GAAP financial measure) excluding the impact of foreign currency exchange rates, and
acquisitions and divestitures that occurred in the preceding twelve months, if any. Organic Net Sales Growth is a useful measure of our performance because it excludes
items that are not completely under management’s control, such as the impact of changes in foreign currency exchange rates, and items that do not reflect the underlying
growth of the company, such as acquisition and divestiture activity. This measure is a significant component in our incentive compensation plans.
• Adjusted Gross Margin and Adjusted Gross Margin Percentage – represent gross margin and gross margin percentage, respectively, (the most comparable GAAP financial
measures) before special items including acquisition related charges, if any.
• Adjusted Operating Income and Adjusted Operating Margin – represent operating income and operating margin, respectively, (the most comparable GAAP financial
measures) before special items including restructuring and other charges, acquisition related charges, and other income or charges, if any. We utilize these measures to
assess segment level operating performance and to provide insight to management in evaluating segment operating plan execution and market conditions. Adjusted
Operating Income is a significant component in our incentive compensation plans.
• Adjusted Other Income, Net – represents net other income (the most comparable GAAP financial measure) before special items including tax sharing income related to
adjustments to prior period tax returns and other items, if any.
• Adjusted Income Tax Expense and Adjusted Effective Tax Rate – represent income tax expense and effective tax rate, respectively, (the most comparable GAAP financial
measures) after adjusting for the tax effect of special items including restructuring and other charges, acquisition related charges, other income or charges, and certain
significant tax items, if any.
• Adjusted Income from Continuing Operations – represents income from continuing operations (the most comparable GAAP financial measure) before special items including
restructuring and other charges, acquisition related charges, tax sharing income related to adjustments to prior period tax returns and other tax items, other income or
charges, and certain significant tax items, if any, and, if applicable, the related tax effects.
• Adjusted Earnings Per Share – represents diluted earnings per share from continuing operations (the most comparable GAAP financial measure) before special items
including restructuring and other charges, acquisition related charges, tax sharing income related to adjustments to prior period tax returns and other tax items, other income
or charges, and certain significant tax items, if any, and, if applicable, the related tax effects. This measure is a significant component in our incentive compensation plans.

23
• Adjusted Earnings Per Share Excluding the Impact of Changes in the Adjusted Effective Tax Rate – represents Adjusted Earnings Per Share calculated by applying the
prior period Adjusted Effective Tax Rate to the current period. We believe this measure provides useful information regarding our Adjusted Earnings Per Share.
• Adjusted Earnings Per Share in Constant Currency Excluding the Impact of Changes in the Adjusted Effective Tax Rate – represents Adjusted Earnings Per Share
calculated by excluding the impact of fluctuations in foreign currency exchange rates between periods and by applying the prior period Adjusted Effective Tax Rate to the
current period. We believe this measure provides valuable supplemental information regarding our Adjusted Earnings Per Share.
• Adjusted EBITDA and Adjusted EBITDA Margin - represent net income and net income as a percentage of net sales, respectively, (the most comparable GAAP financial
measures) before interest expense, interest income, income taxes, depreciation, and amortization, as adjusted for net other income, income from discontinued operations,
and special items including restructuring and other charges, acquisition related charges, and other income or charges, if any.
• Net Sales Excluding the Impact of the Additional Week, Net Sales Growth Excluding the Impact of the Additional Week, Organic Net Sales Growth Excluding the Impact of
the Additional Week, Adjusted Gross Margin Excluding the Impact of the Additional Week, Adjusted Gross Margin Percentage Excluding the Impact of the Additional Week,
Adjusted Operating Income Excluding the Impact of the Additional Week, Adjusted Operating Margin Excluding the Impact of the Additional Week, Adjusted Earnings Per
Share Excluding the Impact of the Additional Week, Adjusted EBITDA Excluding the Impact of the Additional Week, and Adjusted EBITDA Margin Excluding the Impact of
the Additional Week – represent certain GAAP and non-GAAP financial measures excluding the impact of the additional week in the fourth quarter of the fiscal year for
fiscal years which are 53 weeks in length. The impact of the additional week is estimated using an average weekly sales figure for the last month of the fiscal year.
• Free Cash Flow (FCF) – is a useful measure of our ability to generate cash. The difference between net cash provided by continuing operating activities (the most
comparable GAAP financial measure) and Free Cash Flow consists mainly of significant cash outflows and inflows that we believe are useful to identify. We believe Free
Cash Flow provides useful information to investors as it provides insight into the primary cash flow metric used by management to monitor and evaluate cash flows
generated from our operations.
Free Cash Flow is defined as net cash provided by continuing operating activities excluding voluntary pension contributions and the cash impact of special items, if any,
minus net capital expenditures. Voluntary pension contributions are excluded from the GAAP financial measure because this activity is driven by economic financing
decisions rather than operating activity. Certain special items, including net payments related to pre-separation tax matters and cash paid (collected) pursuant to collateral
requirements related to cross currency swaps, are also excluded by management in evaluating Free Cash Flow. Net capital expenditures consist of capital expenditures
less proceeds from the sale of property, plant, and equipment. These items are subtracted because they represent long-term commitments.
In the calculation of Free Cash Flow, we subtract certain cash items that are ultimately within management’s and the Board of Directors’ discretion to direct and may imply
that there is less or more cash available for our programs than the most comparable GAAP financial measure indicates. It should not be inferred that the entire Free Cash
Flow amount is available for future discretionary expenditures, as our definition of Free Cash Flow does not consider certain non-discretionary expenditures, such as debt
payments. In addition, we may have other discretionary expenditures, such as discretionary dividends, share repurchases, and business acquisitions, that are not
considered in the calculation of Free Cash Flow.
• Adjusted Return on Invested Capital (ROIC) – represents adjusted net operating profit after tax divided by average invested capital. We use Adjusted Return on Invested
Capital as an indicator of our capital efficiency. Adjusted Return on Invested Capital is not a measure defined by GAAP. It is calculated by us, in part, using non-GAAP
financial measures. We are providing our calculation of Adjusted Return on Invested Capital as this measure may not be defined and calculated by other companies in the
same manner.
Non-GAAP Financial Measures (cont.)

24
Segment Summary
Net Sales Net Sales Net Sales Net Sales
Transportation Solutions 1,844$ 1,736$ 7,039$ 6,503$
Industrial Solutions 954 919 3,507 3,215
Communications Solutions 658 677 2,567 2,520
Total 3,456$ 3,332$ 13,113$ 12,238$
O perating O perating O perating O perating O perating O perating O perating O perating
Income Margin Income Margin Income Margin Income Margin
Transportation Solutions 328$ 17.8% 344$ 19.8% 1,299$ 18.5% 1,191$ 18.3%
Industrial Solutions 113 11.8 119 12.9 364 10.4 343 10.7
Communications Solutions 111 16.9 54 8.0 384 15.0 368 14.6
Total 552$ 16.0% 517$ 15.5% 2,047$ 15.6% 1,902$ 15.5%
Adjusted Adjusted Adjusted Adjusted Adjusted Adjusted Adjusted Adjusted
O perating O perating O perating O perating O perating O perating O perating O perating
Income (1)
Margin (1)
Income (1)
Margin (1)
Income (1)
Margin (1)
Income (1)
Margin (1)
Transportation Solutions 336$ 18.2% 341$ 19.6% 1,369$ 19.4% 1,246$ 19.2%
Industrial Solutions 132 13.8 123 13.4 445 12.7 397 12.3
Communications Solutions 108 16.4 87 12.9 392 15.3 293 11.6
Total 576$ 16.7% 551$ 16.5% 2,206$ 16.8% 1,936$ 15.8%
(1) Adjusted operating income and adjusted operating margin are non-GAAP financial measures. See description of non-GAAP financial measures.
($ in millions)
For the Q uarters Ended For the Years Ended
September 29, September 30, September 29, September 30,
2017 2016 2017 2016

Reconciliation of Net Sales Growth – Q4 17 vs. Q4 16
25
Translation (2)
Acquisitions
Transportation Solutions (3)
:
Automotive 39$ 3.0% 19$ 1.5% 20$ -$
Commercial transportation 59 27.4 58 26.9 1 -
Sensors 10 4.8 5 2.2 5 -
Total 108 6.2 82 4.7 26 -
Industrial Solutions (3)
:
Industrial equipment 63 14.8 21 5.0 7 35
Aerospace, defense, oil, and gas (15) (5.0) (18) (6.0) 3 -
Energy (13) (6.7) (17) (8.5) 4 -
Total 35 3.8 (14) (1.5) 14 35
Communications Solutions (3)
:
Data and devices (8) (3.1) (7) (2.4) (1) -
Subsea communications (17) (7.1) (17) (7.1) - -
Appliances 6 3.4 4 2.9 2 -
Total (19) (2.8) (20) (2.9) 1 -
Total 124$ 3.7% 48$ 1.4% 41$ 35$
(1) Organic net sales growth is a non-GAAP financial measure. See description of non-GAAP financial measures.
(2) Represents the change in net sales resulting from changes in foreign currency exchange rates.
(3) Industry end market information is presented consistently with our internal management reporting and may be periodically revised as
management deems necessary.
O rganic Net
Change in Net Sales for the Q uarter Ended September 29, 2017
Sales Growth (1)
($ in millions)
Sales Growth
Net
versus Net Sales for the Q uarter Ended September 30, 2016

Reconciliation of Net Sales Growth – FY 17 vs. FY 16
26
Acquisitions
Translation (2)
(Divestiture)
Transportation Solutions (3)
:
Automotive 316$ 6.4% 349$ 7.1% (33)$ -$
Commercial transportation 172 20.8 181 21.9 (9) -
Sensors 48 6.3 23 3.0 (5) 30
Total 536 8.2 553 8.5 (47) 30
Industrial Solutions (3)
:
Industrial equipment 328 23.1 77 5.5 (10) 261
Aerospace, defense, oil, and gas (25) (2.3) (19) (1.7) (7) 1
Energy (11) (1.6) (8) (1.0) (3) -
Total 292 9.1 50 1.6 (20) 262
Communications Solutions (3)
:
Data and devices (57) (5.6) 23 2.3 (10) (70)
Subsea communications 43 4.9 43 4.9 - -
Appliances 61 9.9 67 10.8 (6) -
Total 47 1.9 133 5.4 (16) (70)
Total 875$ 7.1% 736$ 6.0% (83)$ 222$
(1) Organic net sales growth is a non-GAAP financial measure. See description of non-GAAP financial measures.
(2) Represents the change in net sales resulting from changes in foreign currency exchange rates.
(3) Industry end market information is presented consistently with our internal management reporting and may be periodically revised as
management deems necessary.
Sales Growth Sales Growth (1)
($ in millions)
Change in Net Sales for the Year Ended September 29, 2017
versus Net Sales for the Year Ended September 30, 2016
Net O rganic Net

Reconciliation of Non-GAAP Financial Measures to GAAP Financial Measures for the Quarter Ended September 29, 2017
27
Restructuring
Acquisition and O ther
Related Charges Adjusted
U.S. GAAP Charges (1)
(Credits), Net (1)
(Non-GAAP) (2)
Operating Income:
Transportation Solutions 328$ 1$ 7$ 336$
Industrial Solutions 113 - 19 132
Communications Solutions 111 - (3) 108
Total 552$ 1$ 23$ 576$
Operating Margin 16.0% 16.7%
Other Expense, Net (3)$ -$ -$ (3)$
Income Tax Expense (91)$ (1)$ (7)$ (99)$
Effective Tax Rate 17.5% 18.2%
Income from Continuing Operations 429$ -$ 16$ 445$
Diluted Earnings per Share from
Continuing Operations 1.21$ -$ 0.04$ 1.25$
(2) See description of non-GAAP financial measures.
(1) The tax effect of each non-GAAP adjustment is calculated based on the jurisdictions in which the expense (income) is incurred and the
tax laws in effect for each such jurisdiction.
Adjustments
($ in millions, except per share data)

Reconciliation of Non-GAAP Financial Measures to GAAP Financial Measures for the Quarter Ended September 30, 2016
28
Restructuring
Acquisition and O ther
Related Charges Adjusted
U.S. GAAP Charges (1)
(Credits), Net (1)
(Non-GAAP) (2)
Operating Income:
Transportation Solutions 344$ 3$ (6)$ 341$
Industrial Solutions 119 1 3 123
Communications Solutions 54 - 33 87
Total 517$ 4$ 30$ 551$
Operating Margin 15.5% 16.5%
Other Expense, Net (1)$ -$ -$ (1)$
Income Tax Expense (52)$ (1)$ (15)$ (68)$
Effective Tax Rate 10.6% 13.0%
Income from Continuing Operations 437$ 3$ 15$ 455$
Diluted Earnings per Share from
Continuing Operations 1.22$ 0.01$ 0.04$ 1.27$
(1) The tax effect of each non-GAAP adjustment is calculated based on the jurisdictions in which the expense (income) is incurred and the
tax laws in effect for each such jurisdiction.(2)
See description of non-GAAP financial measures.
Adjustments
($ in millions, except per share data)

Reconciliation of Non-GAAP Financial Measures to GAAP Financial Measures for the Year Ended September 29, 2017
29
Acquisition Restructuring
Related and O ther Tax Adjusted
U.S. GAAP Charges (1)
Charges, Net (1)
Items (2)
(Non-GAAP) (3)
Operating Income:
Transportation Solutions 1,299$ 3$ 67$ -$ 1,369$
Industrial Solutions 364 8 73 - 445
Communications Solutions 384 - 8 - 392
Total 2,047$ 11$ 148$ -$ 2,206$
Operating Margin 15.6% 16.8%
Other Expense, Net (9)$ -$ -$ 7$ (2)$
Income Tax Expense (255)$ (3)$ (40)$ (66)$ (364)$
Effective Tax Rate 13.2% 17.4%
Income from Continuing Operations 1,673$ 8$ 108$ (59)$ 1,730$
Diluted Earnings per Share from
Continuing Operations 4.67$ 0.02$ 0.30$ (0.16)$ 4.83$
(2) Includes income tax benefits associated with the tax impacts of certain intercompany transactions and the corresponding reduction in the
valuation allowance for U.S. tax loss carryforwards. Also includes income tax benefits associated with pre-separation tax matters and the
related impact to other expense pursuant to the tax sharing agreement with Tyco International and Covidien.
(3) See description of non-GAAP financial measures.
($ in millions, except per share data)
(1) The tax effect of each non-GAAP adjustment is calculated based on the jurisdictions in which the expense (income) is incurred and the tax
laws in effect for each such jurisdiction.
Adjustments

Reconciliation of Non-GAAP Financial Measures to GAAP Financial Measures for the Year Ended September 30, 2016
30
Restructuring
Acquisition and O ther
Related Charges Tax Adjusted
U.S. GAAP Charges (1)(2)
(Credits), Net (2)
Items (3)
(Non-GAAP) (4)
Operating Income:
Transportation Solutions 1,191$ 9$ 46$ -$ 1,246$
Industrial Solutions 343 23 31 - 397
Communications Solutions 368 - (75) - 293
Total 1,902$ 32$ 2$ -$ 1,936$
Operating Margin 15.5% 15.8%
Other Income (Expense), Net (632)$ -$ -$ 650$ 18$
Income Tax (Expense) Benefit 779$ (7)$ (2)$ (1,111)$ (341)$
Effective Tax Rate (67.0)% 18.5%
Income from Continuing Operations 1,941$ 25$ -$ (461)$ 1,505$
Diluted Earnings per Share from
Continuing Operations 5.26$ 0.07$ -$ (1.25)$ 4.08$
(1) Includes $22 million of acquisition and integration costs and $10 million of non-cash amortization associated with fair value adjustments
related to acquired inventories and customer order backlog recorded in cost of sales.
(2) The tax effect of each non-GAAP adjustment is calculated based on the jurisdictions in which the expense (income) is incurred and the tax
laws in effect for each such jurisdiction.(3)
Includes $1,135 million of income tax benefits associated with the settlement of tax matters for the years 1997 through 2000 which
resolved all aspects of the disputed debt matter with the IRS through the year 2007, as well as the related impact of $604 million to other
expense pursuant to the tax sharing agreement with Tyco International and Covidien. Also includes income tax charges related to a $91 million
increase in the valuation allowance for certain U.S. deferred tax assets; and an $83 million net income tax benefit related to tax settlements in
certain other tax jurisdictions, as well as the related impact of $46 million to other expense pursuant to the tax sharing agreement with Tyco
International and Covidien.(4)
See description of non-GAAP financial measures.
Adjustments
($ in millions, except per share data)

Reconciliation of Non-GAAP Financial Measures to GAAP Financial Measures for the Six Months Ended March 31, 2017
31
Acquisition Restructuring
Related and O ther Tax Adjusted
U.S. GAAP Charges (1)
Charges, Net (1)
Items (2)
(Non-GAAP) (3)
Operating Income:
Transportation Solutions 643$ 1$ 57$ -$ 701$
Industrial Solutions 153 5 40 - 198
Communications Solutions 163 - 9 - 172
Total 959$ 6$ 106$ -$ 1,071$
Operating Margin 15.2% 17.0%
Other Expense, Net (2)$ -$ -$ -$ (2)$
Income Tax Expense (93)$ (1)$ (30)$ (52)$ (176)$
Effective Tax Rate 10.3% 17.3%
Income from Continuing Operations 812$ 5$ 76$ (52)$ 841$
Diluted Earnings per Share from
Continuing Operations 2.26$ 0.01$ 0.21$ (0.14)$ 2.34$
(3) See description of non-GAAP financial measures.
Adjustments
($ in millions, except per share data)
(1) The tax effect of each non-GAAP adjustment is calculated based on the jurisdictions in which the expense (income) is incurred and the tax
laws in effect for each such jurisdiction.(2)
Income tax benefits associated with the tax impacts of certain intercompany transactions and the corresponding reduction in the valuation
allowance for U.S. tax loss carryforwards.

Reconciliation of Non-GAAP Financial Measures to GAAP Financial Measures for the Quarter Ended June 30, 2017
32
Acquisition Restructuring
Related and O ther Tax Adjusted
U.S. GAAP Charges (1)
Charges, Net (1)
Items (2)
(Non-GAAP) (3)
Operating Income:
Transportation Solutions 328$ 1$ 3$ -$ 332$
Industrial Solutions 98 3 14 - 115
Communications Solutions 110 - 2 - 112
Total 536$ 4$ 19$ -$ 559$
Operating Margin 15.9% 16.6%
Other Income (Expense), Net (4)$ -$ -$ 7$ 3$
Income Tax Expense (71)$ (1)$ (3)$ (14)$ (89)$
Effective Tax Rate 14.1% 16.7%
Income from Continuing Operations 432$ 3$ 16$ (7)$ 444$
Diluted Earnings per Share from
Continuing Operations 1.21$ 0.01$ 0.04$ (0.02)$ 1.24$
(1) The tax effect of each non-GAAP adjustment is calculated based on the jurisdictions in which the expense (income) is incurred and the tax
laws in effect for each such jurisdiction.(2)
Income tax benefits associated with pre-separation tax matters and the related impact to other expense pursuant to the tax sharing
agreement with Tyco International and Covidien.
(3) See description of non-GAAP financial measures.
Adjustments
($ in millions, except per share data)

Reconciliation of Non-GAAP Financial Measures to GAAP Financial Measures for the Six Months Ended March 25, 2016
33
Restructuring
Acquisition and O ther
Related Charges Tax Adjusted
U.S. GAAP Charges (1)
(Credits), Net (1)(2)
Items (3)
(Non-GAAP) (4)
Operating Income:
Transportation Solutions 550$ 4$ 31$ -$ 585$
Industrial Solutions 129 6 27 - 162
Communications Solutions 254 - (117) - 137
Total 933$ 10$ (59)$ -$ 884$
Operating Margin 16.1% 15.3%
Other Income, Net 20$ -$ -$ -$ 20$
Income Tax Expense (188)$ (3)$ 23$ (25)$ (193)$
Effective Tax Rate 20.9% 22.7%
Income from Continuing Operations 713$ 7$ (36)$ (25)$ 659$
Diluted Earnings per Share from
Continuing Operations 1.88$ 0.02$ (0.09)$ (0.07)$ 1.74$
Adjustments
($ in millions, except per share data)
(1) The tax effect of each non-GAAP adjustment is calculated based on the jurisdictions in which the expense (income) is incurred and the tax
laws in effect for each such jurisdiction.(2)
Includes the gain on the divestiture of our Circuit Protection Devices business.(3)
Includes income tax benefits related to deferred tax assets recognized in connection with the sale of the Circuit Protection Devices business.(4)
See description of non-GAAP financial measures.

Reconciliation of Non-GAAP Financial Measures to GAAP Financial Measures for the Quarter Ended June 24, 2016
34
Acquisition Restructuring
Related and O ther Tax Adjusted
U.S. GAAP Charges (1)(2)
Charges, Net (2)
Items (3)
(Non-GAAP) (4)
Operating Income:
Transportation Solutions 297$ 2$ 21$ -$ 320$
Industrial Solutions 95 16 1 - 112
Communications Solutions 60 - 9 - 69
Total 452$ 18$ 31$ -$ 501$
Operating Margin 14.5% 16.1%
Other Expense, Net (651)$ -$ -$ 650$ (1)$
Income Tax (Expense) Benefit 1,019$ (3)$ (10)$ (1,086)$ (80)$
Effective Tax Rate 446.9% 17.0%
Income from Continuing Operations 791$ 15$ 21$ (436)$ 391$
Diluted Earnings per Share from
Continuing Operations 2.19$ 0.04$ 0.06$ (1.21)$ 1.08$
(1) Includes $11 million of acquisition and integration costs and $7 million of non-cash amortization associated with fair value adjustments
related to acquired inventories and customer order backlog recorded in cost of sales.
(2) The tax effect of each non-GAAP adjustment is calculated based on the jurisdictions in which the expense (income) is incurred and the tax
laws in effect for each such jurisdiction.
(3) Includes $1,135 million of income tax benefits associated with the settlement of tax matters for the years 1997 through 2000 which
resolved all aspects of the disputed debt matter with the IRS through the year 2007, as well as the related impact of $604 million to other
expense pursuant to the tax sharing agreement with Tyco International and Covidien. Also includes income tax charges related to a $91 million
increase in the valuation allowance for certain U.S. deferred tax assets; and an $83 million net income tax benefit related to tax settlements in
certain other tax jurisdictions, as well as the related impact of $46 million to other expense pursuant to the tax sharing agreement with Tyco
International and Covidien.
(4) See description of non-GAAP financial measures.
Adjustments
($ in millions, except per share data)
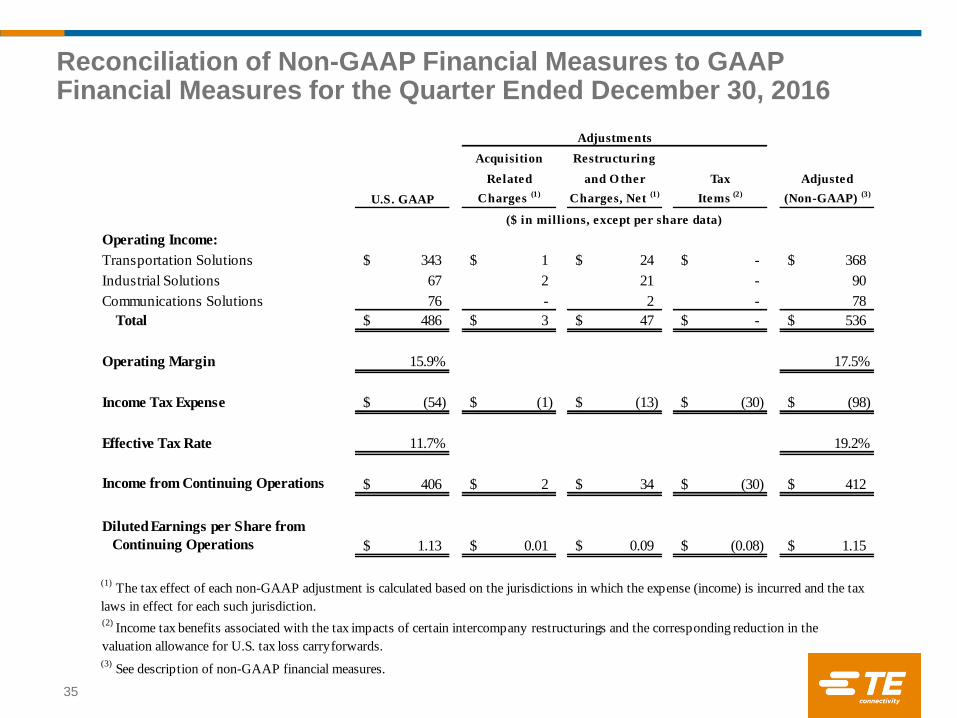
Reconciliation of Non-GAAP Financial Measures to GAAP Financial Measures for the Quarter Ended December 30, 2016
35
Acquisition Restructuring
Related and O ther Tax Adjusted
U.S. GAAP Charges (1)
Charges, Net (1)
Items (2)
(Non-GAAP) (3)
Operating Income:
Transportation Solutions 343$ 1$ 24$ -$ 368$
Industrial Solutions 67 2 21 - 90
Communications Solutions 76 - 2 - 78
Total 486$ 3$ 47$ -$ 536$
Operating Margin 15.9% 17.5%
Income Tax Expense (54)$ (1)$ (13)$ (30)$ (98)$
Effective Tax Rate 11.7% 19.2%
Income from Continuing Operations 406$ 2$ 34$ (30)$ 412$
Diluted Earnings per Share from
Continuing Operations 1.13$ 0.01$ 0.09$ (0.08)$ 1.15$
(1) The tax effect of each non-GAAP adjustment is calculated based on the jurisdictions in which the expense (income) is incurred and the tax
laws in effect for each such jurisdiction.(2)
Income tax benefits associated with the tax impacts of certain intercompany restructurings and the corresponding reduction in the
valuation allowance for U.S. tax loss carryforwards.
(3) See description of non-GAAP financial measures.
Adjustments
($ in millions, except per share data)

Impact of Additional Week for Q4 2016
36
Adjustment Adjustment Adjustment
14 Weeks Impact of 13 Weeks 14 Weeks Impact of 13 Weeks 14 Weeks Impact of 13 Weeks
U.S. GAAP 14th Week (Non-GAAP) (1)(2)
U.S. GAAP 14th Week (Non-GAAP) (1)(2)
(Non-GAAP) (2)
14th Week (Non-GAAP) (1)(2)
Net Sales:
Transportation Solutions
Automotive 1,350$ 1,311$ (102)$ 1,209$ 3.0% 8.7% 11.7% 1.5% 8.6% 10.1%
Commercial transportation 274 215 (15) 200 27.4 9.6 37.0 26.9 9.6 36.5
Sensors 220 210 (13) 197 4.8 6.9 11.7 2.2 6.4 8.6
Total 1,844 1,736 (130) 1,606 6.2 8.6 14.8 4.7 8.5 13.2
Industrial Solutions
Industrial equipment 490 427 (32) 395 14.8 9.3 24.1 5.0 8.4 13.4
Aerospace, defense, oil, and gas 284 299 (20) 279 (5.0) 6.8 1.8 (6.0) 6.7 0.7
Energy 180 193 (13) 180 (6.7) 6.7 - (8.5) 6.8 (1.7)
Total 954 919 (65) 854 3.8 7.9 11.7 (1.5) 7.5 6.0
Communications Solutions
Data and devices 254 262 (21) 241 (3.1) 8.5 5.4 (2.4) 8.4 6.0
Subsea communications 222 239 (11) 228 (7.1) 4.5 (2.6) (7.1) 4.5 (2.6)
Appliances 182 176 (11) 165 3.4 6.9 10.3 2.9 7.4 10.3
Total 658 677 (43) 634 (2.8) 6.6 3.8 (2.9) 6.7 3.8
Total 3,456$ 3,332$ (238)$ 3,094$ 3.7% 8.0% 11.7% 1.4% 7.9% 9.3%
Adjustment
Acquisition Restructuring 14 Weeks 13 Weeks
Related and O ther Adjusted Impact of Adjusted
U.S. GAAP Charges Charges, Net (Non-GAAP) (2)
14th Week (Non-GAAP) (1)(2)
Gross Margin 1,104$ 1$ -$ 1,105$ (89)$ 1,016$
Gross Margin Percentage 33.1% 33.2% 32.8%
Operating Income:
Transportation Solutions 344$ 3$ (6)$ 341$ (33)$ 308$
Industrial Solutions 119 1 3 123 (12) 111
Communications Solutions 54 - 33 87 (10) 77
Operating Income 517$ 4$ 30$ 551$ (55)$ 496$
Operating Margin:
Transportation Solutions 19.8% 19.6% 19.2%
Industrial Solutions 12.9% 13.4% 13.0%
Communications Solutions 8.0% 12.9% 12.1%
Operating Margin 15.5% 16.5% 16.0%
Diluted Earnings per Share from
Continuing Operations 1.22$ 0.01$ 0.04$ 1.27$ (0.13)$ 1.14$
Adjustments
($ in millions, except per share data)
(1) Excludes the impact of an additional week in the fourth quarter of fiscal 2016. The impact of the additional week was estimated using an average weekly sales figure for the last month of the fiscal year.
(2) See description of non-GAAP financial measures.
For the Quarter Ended September 30, 2016
Change in O rganic Net Sales for the Q uarter Ended
September 29, 2017 versus O rganic Net Sales for the
Q uarter Ended September 30, 2016 (2)
Change in Net Sales for the Q uarter Ended
September 29, 2017 versus Net Sales for the
Q uarter Ended September 30, 2016For the
Q uarter Ended
September 29,
2017
For the Q uarter Ended September 30, 2016
($ in millions)

37
Impact of Additional Week for Fiscal 2016
Adjustment Adjustment Adjustment
53 Weeks Impact of 52 Weeks 53 Weeks Impact of 52 Weeks 53 Weeks Impact of 52 Weeks
U.S. GAAP 53rd Week (Non-GAAP) (1)(2)
U.S. GAAP 53rd Week (Non-GAAP) (1)(2)
(Non-GAAP) (2)
53rd Week (Non-GAAP) (1)(2)
Net Sales:
Transportation Solutions
Automotive 5,228$ 4,912$ (102)$ 4,810$ 6.4% 2.3% 8.7% 7.1% 2.3% 9.4%
Commercial transportation 997 825 (15) 810 20.8 2.3 23.1 21.9 2.2 24.1
Sensors 814 766 (13) 753 6.3 1.8 8.1 3.0 1.7 4.7
Total 7,039 6,503 (130) 6,373 8.2 2.3 10.5 8.5 2.1 10.6
Industrial Solutions
Industrial equipment 1,747 1,419 (32) 1,387 23.1 2.9 26.0 5.5 2.4 7.9
Aerospace, defense, oil, and gas 1,075 1,100 (20) 1,080 (2.3) 1.8 (0.5) (1.7) 1.8 0.1
Energy 685 696 (13) 683 (1.6) 1.9 0.3 (1.0) 1.9 0.9
Total 3,507 3,215 (65) 3,150 9.1 2.2 11.3 1.6 2.1 3.7
Communications Solutions
Data and devices 963 1,020 (21) 999 (5.6) 2.0 (3.6) 2.3 2.3 4.6
Subsea communications 928 885 (11) 874 4.9 1.3 6.2 4.9 1.3 6.2
Appliances 676 615 (11) 604 9.9 2.0 11.9 10.8 2.2 13.0
Total 2,567 2,520 (43) 2,477 1.9 1.7 3.6 5.4 1.8 7.2
Total 13,113$ 12,238$ (238)$ 12,000$ 7.1% 2.2% 9.3% 6.0% 2.1% 8.1%
Adjustment
Acquisition Restructuring 53 Weeks 52 Weeks
Related and O ther Adjusted Impact of Adjusted
U.S. GAAP Charges (3)
Charges, Net Tax Items (4)
(Non-GAAP) (2)
53rd Week (Non-GAAP) (1)(2)
Gross Margin 4,033$ 10$ -$ -$ 4,043$ (89)$ 3,954$
Gross Margin Percentage 33.0% 33.0% 33.0%
Operating Income:
Transportation Solutions 1,191$ 9$ 46$ -$ 1,246$ (33)$ 1,213$
Industrial Solutions 343 23 31 - 397 (12) 385
Communications Solutions 368 - (75) - 293 (10) 283
Operating Income 1,902$ 32$ 2$ -$ 1,936$ (55)$ 1,881$
Operating Margin:
Transportation Solutions 18.3% 19.2% 19.0%
Industrial Solutions 10.7% 12.3% 12.2%
Communications Solutions 14.6% 11.6% 11.4%
Operating Margin 15.5% 15.8% 15.7%
Diluted Earnings per Share from
Continuing Operations 5.26$ 0.07$ -$ (1.25)$ 4.08$ (0.13)$ 3.95$
For the Year Ended September 30, 2016
(4) Includes $1,135 million of income tax benefits associated with the settlement of tax matters for the years 1997 through 2000 which resolved all aspects of the disputed debt matter with the IRS through the year 2007, as well as the
related impact of $604 million to other expense pursuant to the tax sharing agreement with Tyco International and Covidien. Also includes income tax charges related to a $91 million increase in the valuation allowance for certain U.S.
deferred tax assets; and an $83 million net income tax benefit related to tax settlements in certain other tax jurisdictions, as well as the related impact of $46 million to other expense pursuant to the tax sharing agreement with Tyco
International and Covidien.
Adjustments
($ in millions, except per share data)
(1) Excludes the impact of an additional week in the fourth quarter of fiscal 2016. The impact of the additional week was estimated using an average weekly sales figure for the last month of the fiscal year.
(2) See description of non-GAAP financial measures.
(3) Includes $22 million of acquisition and integration costs and $10 million of non-cash amortization associated with fair value adjustments related to acquired inventories and customer order backlog recorded in cost of sales.
($ in millions)
Fiscal 2016
Fiscal 2017
Change in Net Sales for Fiscal 2017
versus Net Sales for Fiscal 2016
Change in O rganic Net Sales for Fiscal 2017
versus O rganic Net Sales for Fiscal 2016 (2)

Reconciliation of Gross Margin & Gross Margin Percentage
38
September 29, September 30, September 29, September 30,
2017 2016 2017 2016
Net Sales 3,456$ 3,332$ 13,113$ 12,238$
Cost of Sales 2,317 2,228 8,663 8,205
Gross Margin 1,139 1,104 4,450 4,033
Gross Margin Percentage 33.0% 33.1% 33.9% 33.0%
Acquisition Related Charges - 1 5 10
Adjusted Gross Margin (1)
1,139$ 1,105$ 4,455$ 4,043$
Adjusted Gross Margin Percentage (1)
33.0% 33.2% 34.0% 33.0%
(1) See description of non-GAAP financial measures.
For the Q uarters Ended For the Years Ended
($ in millions)

Reconciliation of Free Cash Flow
39
September 29, September 30, September 29, September 30,
2017 2016 2017 2016
Net cash provided by operating activities:
Net cash provided by continuing operating activities 873$ 782$ 2,322$ 2,044$
Net cash used in discontinued operating activities - (98) (1) (97)
873 684 2,321 1,947
Net cash used in investing activities (394) (524) (932) (1,581)
Net cash used in financing activities (23) (218) (814) (3,055)
Effect of currency translation on cash 7 11 (4) 7
Net increase (decrease) in cash and cash equivalents 463$ (47)$ 571$ (2,682)$
Net cash provided by continuing operating activities 873$ 782$ 2,322$ 2,044$
Excluding:
Payments (receipts) related to pre-separation U.S.
tax matters, net - 5 (23) 150
Payments related to income taxes on the sale of the
Broadband Network Solutions business - 10 - 36
Cash paid pursuant to collateral requirements related
to cross currency swaps 61 10 80 29
Capital expenditures, net (243) (203) (683) (620)
Free cash flow (1)
691$ 604$ 1,696$ 1,639$
(1) Free cash flow is a non-GAAP financial measure. See description of non-GAAP financial measures.
For the Q uarters Ended For the Years Ended
(in millions)
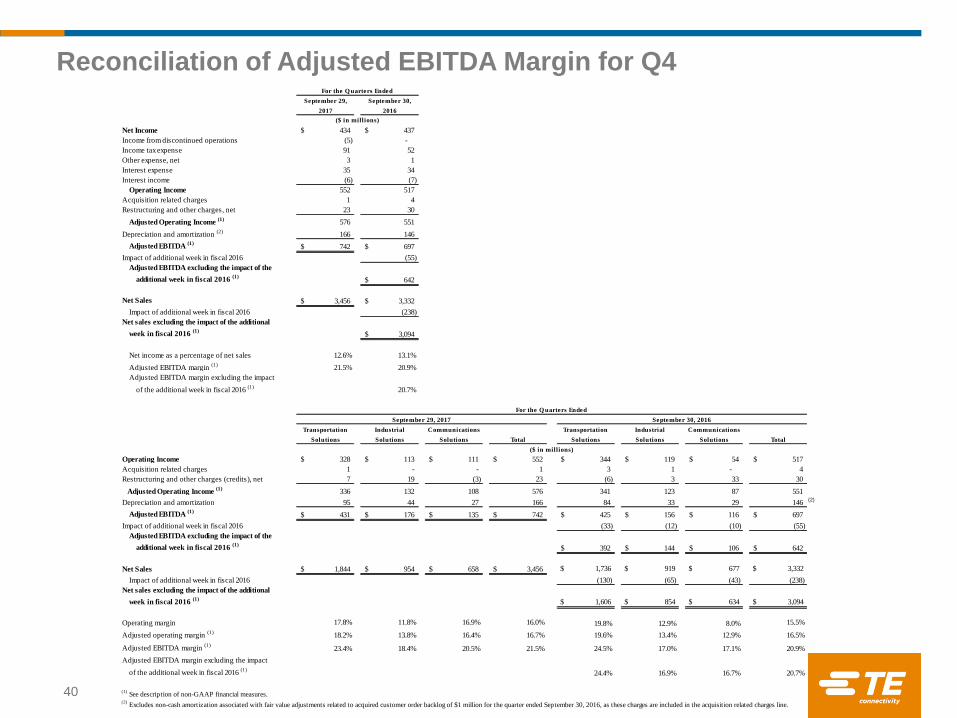
Reconciliation of Adjusted EBITDA Margin for Q4
40
September 29, September 30,
2017 2016
Net Income 434$ 437$
Income from discontinued operations (5) -
Income tax expense 91 52
Other expense, net 3 1
Interest expense 35 34
Interest income (6) (7)
Operating Income 552 517
Acquisition related charges 1 4
Restructuring and other charges, net 23 30
Adjusted Operating Income (1)
576 551
Depreciation and amortization (2)
166 146
Adjusted EBITDA (1)
742$ 697$
Impact of additional week in fiscal 2016 (55)
Adjusted EBITDA excluding the impact of the
additional week in fiscal 2016 (1)
642$
Net Sales 3,456$ 3,332$
Impact of additional week in fiscal 2016 (238)
Net sales excluding the impact of the additional
week in fiscal 2016 (1)
3,094$
Net income as a percentage of net sales 12.6% 13.1%
Adjusted EBITDA margin (1)
21.5% 20.9%
Adjusted EBITDA margin excluding the impact
of the additional week in fiscal 2016 (1)
20.7%
Transportation Industrial Communications Transportation Industrial Communications
Solutions Solutions Solutions Total Solutions Solutions Solutions Total
Operating Income 328$ 113$ 111$ 552$ 344$ 119$ 54$ 517$
Acquisition related charges 1 - - 1 3 1 - 4
Restructuring and other charges (credits), net 7 19 (3) 23 (6) 3 33 30
Adjusted Operating Income (1)
336 132 108 576 341 123 87 551
Depreciation and amortization 95 44 27 166 84 33 29 146 (2)
Adjusted EBITDA (1)
431$ 176$ 135$ 742$ 425$ 156$ 116$ 697$
Impact of additional week in fiscal 2016 (33) (12) (10) (55)
Adjusted EBITDA excluding the impact of the
additional week in fiscal 2016 (1)
392$ 144$ 106$ 642$
Net Sales 1,844$ 954$ 658$ 3,456$ $ 1,736 $ 919 $ 677 $ 3,332
Impact of additional week in fiscal 2016 (130) (65) (43) (238)
Net sales excluding the impact of the additional
week in fiscal 2016 (1)
$ 1,606 $ 854 $ 634 $ 3,094
Operating margin 17.8% 11.8% 16.9% 16.0% 19.8% 12.9% 8.0% 15.5%
Adjusted operating margin (1)
18.2% 13.8% 16.4% 16.7% 19.6% 13.4% 12.9% 16.5%
Adjusted EBITDA margin (1)
23.4% 18.4% 20.5% 21.5% 24.5% 17.0% 17.1% 20.9%
Adjusted EBITDA margin excluding the impact
of the additional week in fiscal 2016 (1)
24.4% 16.9% 16.7% 20.7%
(2) Excludes non-cash amortization associated with fair value adjustments related to acquired customer order backlog of $1 million for the quarter ended September 30, 2016, as these charges are included in the acquisition related charges line.
For the Q uarters Ended
(1) See description of non-GAAP financial measures.
September 29, 2017 September 30, 2016
For the Q uarters Ended
($ in millions)
($ in millions)

Reconciliation of Adjusted EBITDA Margin for Full Year
41
September 29, September 30,
2017 2016
Net Income 1,683$ 2,009$
Income from discontinued operations (10) (68)
Income tax expense (benefit) 255 (779)
Other expense, net 9 632
Interest expense 130 127
Interest income (20) (19)
Operating Income 2,047 1,902
Acquisition related charges 11 32
Restructuring and other charges, net 148 2
Adjusted Operating Income (1)
2,206 1,936
Depreciation and amortization (2)
630 580
Adjusted EBITDA (1)
2,836$ 2,516$
Impact of additional week in fiscal 2016 (55)
Adjusted EBITDA excluding the impact of the
additional week in fiscal 2016 (1)
2,461$
Net Sales 13,113$ 12,238$
Impact of additional week in fiscal 2016 (238)
Net sales excluding the impact of the additional
week in fiscal 2016 (1)
12,000$
Net income as a percentage of net sales 12.8% 16.4%
Adjusted EBITDA margin (1)
21.6% 20.6%
Adjusted EBITDA margin excluding the impact
of the additional week in fiscal 2016 (1)
20.5%
Transportation Industrial Communications Transportation Industrial Communications
Solutions Solutions Solutions Total Solutions Solutions Solutions Total
Operating Income 1,299$ 364$ 384$ 2,047$ 1,191$ 343$ 368$ 1,902$
Acquisition related charges 3 8 - 11 9 23 - 32
Restructuring and other charges (credits), net 67 73 8 148 46 31 (75) 2
Adjusted Operating Income (1)
1,369 445 392 2,206 1,246 397 293 1,936
Depreciation and amortization 359 160 111 630 (2)
337 126 117 580
Adjusted EBITDA (1)
1,728$ 605$ 503$ 2,836$ 1,583$ 523$ 410$ 2,516$
Impact of additional week in fiscal 2016 (33) (12) (10) (55)
Adjusted EBITDA excluding the impact of the
additional week in fiscal 2016 (1)
1,550$ 511$ 400$ 2,461$
Net Sales 7,039$ 3,507$ 2,567$ 13,113$ $ 6,503 $ 3,215 $ 2,520 $ 12,238
Impact of additional week in fiscal 2016 (130) (65) (43) (238)
Net sales excluding the impact of the additional
week in fiscal 2016 (1)
$ 6,373 $ 3,150 $ 2,477 $ 12,000
Operating margin 18.5% 10.4% 15.0% 15.6% 18.3% 10.7% 14.6% 15.5%
Adjusted operating margin (1)
19.4% 12.7% 15.3% 16.8% 19.2% 12.3% 11.6% 15.8%
Adjusted EBITDA margin (1)
24.5% 17.3% 19.6% 21.6% 24.3% 16.3% 16.3% 20.6%
Adjusted EBITDA margin excluding the impact
of the additional week in fiscal 2016 (1)
24.3% 16.2% 16.1% 20.5%
($ in millions)
(1) See description of non-GAAP financial measures.
(2) Excludes non-cash amortization associated with fair value adjustments related to acquired customer order backlog of $5 million for both the years ended September 29, 2017 and September 30, 2016, as these charges are included in the
acquisition related charges line.
For the Years Ended
($ in millions)
For the Years Ended
September 29, 2017 September 30, 2016

Adjusted Return on Invested Capital (ROIC)
42
September 29, September 30, September 25,
2017 2016 2015
Operating income 2,047$ 1,902$
Acquisition related charges 11 32
Restructuring and other charges, net 148 2
Adjusted Operating Income(1)
2,206 1,936
Adjusted amortization expense(2)
164 144
Adjusted operating income plus adjusted amortization expense 2,370$ 2,080$
Income from continuing operations before income taxes 1,928$ 1,162$
Acquisition related charges 11 32
Restructuring and other charges, net 148 2
Tax items 7 650
Adjusted income from continuing operations before income taxes 2,094$ 1,846$
Income taxes paid, net of refunds 323$ 806$
(Payments) refunds for tax deficiencies related to pre-separation tax matters 23 (471)
Payments related to income taxes on the sale of the Broadband Network
Solutions business - (36)
Adjusted income taxes paid, net of refunds 346$ 299$
Adjusted cash tax rate 16.5% 16.2%
Adjusted net operating profit after taxes 1,978$ 1,743$
Total debt 4,344$ 4,070$ 3,884$
Total equity 9,751 8,485 9,585
Invested capital 14,095$ 12,555$ 13,469$
Average invested capital 13,325$ 13,012$
Adjusted ROIC(1)
14.8% 13.4%
(1) See description of non-GAAP financial measures.
(2) Excludes non-cash amortization associated with fair value adjustments related to acquired customer order backlog of $5 million for both the years ended
September 29, 2017 and September 30, 2016 as these charges are included in the acquisition related charges line.
($ in millions)
As of or for the Years Ended

Reconciliation of Forward-Looking Non-GAAP Financial Measures to Forward-Looking GAAP Financial Measures
43
O utlook for
Q uarter Ending
December 29, O utlook for
2017 (1)
Fiscal 2018 (1)
Diluted earnings per share from continuing operations (GAAP) $1.12 - $1.16 $4.78 - $4.98
Restructuring and other charges, net 0.10 0.31
Acquisition related charges 0.01 0.04
Adjusted diluted earnings per share from continuing operations (non-GAAP) (2)
$1.23 - $1.27 $5.13 - $5.33
Net sales growth (GAAP) 9% - 12% 4% - 8%
Translation (3) (1)
(Acquisitions) divestitures, net (2) (1)
Organic net sales growth (non-GAAP) (2)
4% - 7% 2% - 6%
Effective tax rate (GAAP) 17.8% 19.5%
Effective tax rate adjustments (3)
0.7 0.5
Adjusted effective tax rate (non-GAAP) (2)
18.5% 20.0%
(3) Includes adjustments for special tax items and the tax effect of acquisition related charges and restructuring and other charges, calculated based
on the jurisdictions in which the expense (income) is incurred and the tax laws in effect for each such jurisdiction.
(1) Outlook is as of November 1, 2017
(2) See description of non-GAAP financial measures.