Embed Size (px)
Citation preview

Copyright © 2014 Juniper Networks, Inc. 1 Copyright © 2014 Juniper Networks, Inc.
Q4 2013 FINANCIAL RESULTS CONFERENCE CALL
THURSDAY, JANUARY 23, 2014
2:00 P.M. PACIFIC TIME
Copyright © 2014 Juniper Networks, Inc. 2
Forward Looking Statements Information, statements and projections contained in these presentation slides and related conference call concerning Juniper Networks' business outlook, economic and market outlook, future financial and operating results, and overall future prospects are forward looking statements that involve a number of uncertainties and risks. Actual results or events could differ materially from those anticipated in those forward-looking statements as a result of certain factors, including: general economic and political conditions globally or regionally; business and economic conditions in the networking industry; changes in overall technology spending and spending by communication service providers and major customers; the network capacity requirements of communication service providers; contractual terms that may result in the deferral of revenue; increases in and the effect of competition; the timing of orders and their fulfillment; manufacturing and supply chain constraints; ability to establish and maintain relationships with distributors, resellers and other partners; variations in the expected mix of products sold; changes in customer mix; changes in geography mix; customer and industry analyst perceptions of Juniper Networks and its technology, products and future prospects; delays in scheduled product availability; market acceptance of Juniper Networks products and services; rapid technological and market change; adoption of regulations or standards affecting Juniper Networks products, services or the networking industry; the ability to successfully acquire, integrate and manage businesses and technologies; product defects, returns or vulnerabilities; the ability to recruit and retain key personnel; significant effects of tax legislation and judicial or administrative interpretation of tax regulations; currency fluctuations; litigation settlements and resolutions; the potential impact of activities related to the execution of the Juniper Networks Integrated Operating Plans; and other factors listed in Juniper Networks’ most recent report on Form 10-Q filed with the Securities and Exchange Commission. All information, statements and projections contained in these slides and related conference call speak only as of the date of this presentation. Juniper Networks undertakes no obligation to update the information contained in these slides and related conference call in the event facts or circumstances subsequently change.
Use of Non-GAAP Financial Measures These presentation slides contain references to certain non-GAAP financial measures. For detailed reconciliation between the non-GAAP financial results presented in these slides and corresponding GAAP measures, please refer to the appendix at the end of this slide deck. In addition, for important commentary on why Juniper Networks considers non-GAAP information a useful view of the company’s financial results, please see the press release furnished with our Form 8-K filed today with the SEC. With respect to future financial guidance provided on a non-GAAP basis, we have excluded estimates for amortization of intangible assets, share-based and judgment compensation expenses, acquisition related charges, restructuring charges, impairment charges, litigation settlements and resolutions, gain or loss on equity investments, non-recurring income tax adjustments, valuation allowance on deferred tax assets, and income tax effect of non-GAAP exclusions.
A reconciliation of non-GAAP guidance measures to corresponding GAAP measures is not available on a forward-looking basis due to the high variability and low visibility with respect to the charges which are excluded from these non-GAAP measures.

Copyright © 2014 Juniper Networks, Inc. 3 Copyright © 2014 Juniper Networks, Inc.
FINANCIAL REVIEW
ROBYN DENHOLM
CHIEF FINANCIAL AND OPERATIONS OFFICER
Copyright © 2014 Juniper Networks, Inc. 4
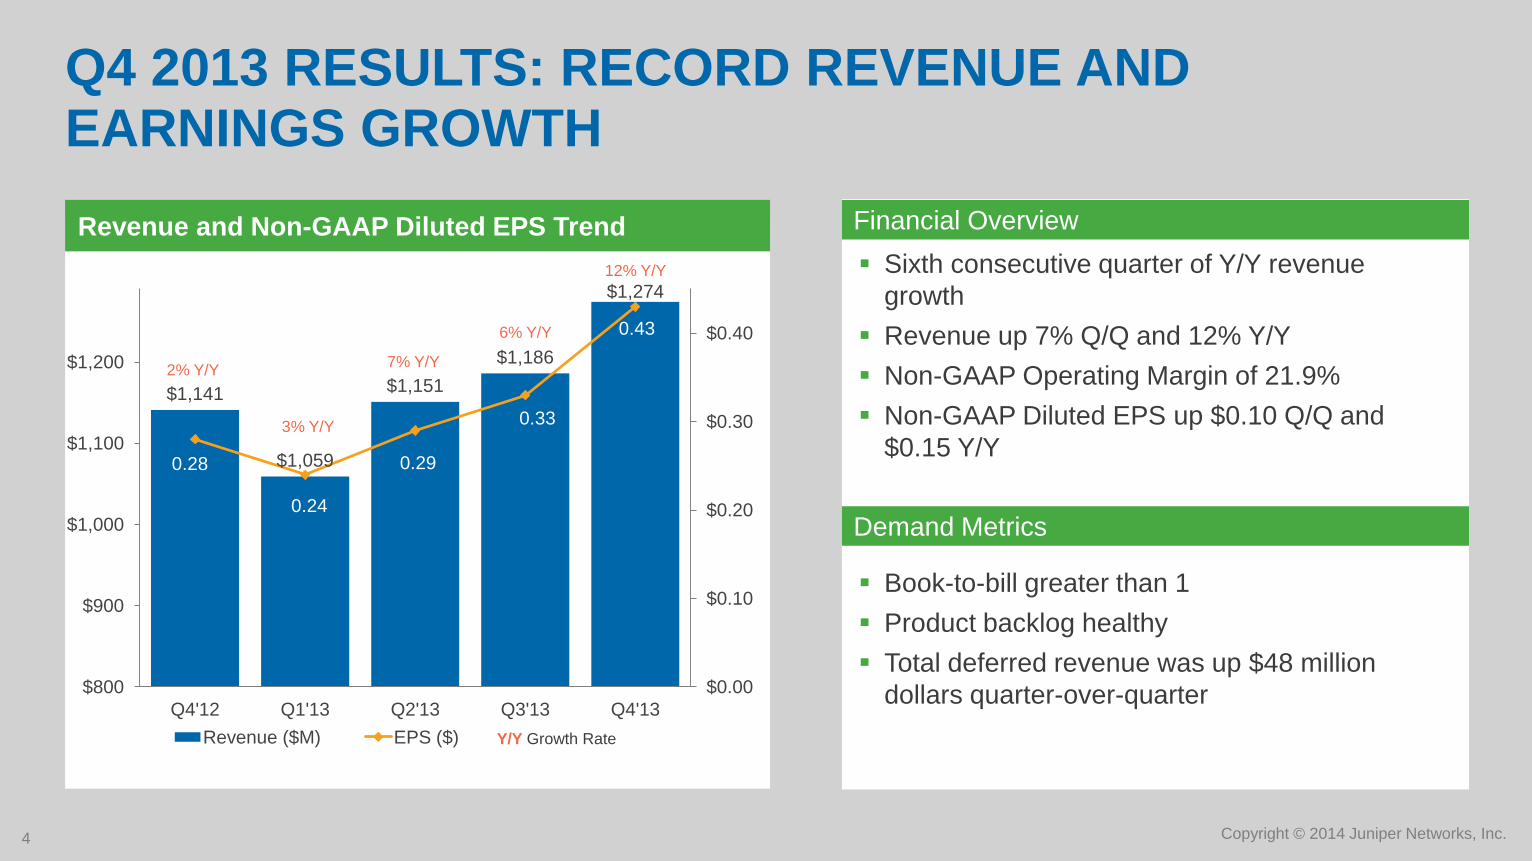
Book-to-bill greater than 1
Product backlog healthy
Total deferred revenue was up $48 million
dollars quarter-over-quarter
Revenue and Non-GAAP Diluted EPS Trend
$1,141
$1,059
$1,151
$1,186
$1,274
0.28
0.24
0.29
0.33
0.43
$0.00
$0.10
$0.20
$0.30
$0.40
$800
$900
$1,000
$1,100
$1,200
Q4'12 Q1'13 Q2'13 Q3'13 Q4'13
Revenue ($M) EPS ($)
Q4 2013 RESULTS: RECORD REVENUE AND EARNINGS GROWTH
Financial Overview
Sixth consecutive quarter of Y/Y revenue
growth
Revenue up 7% Q/Q and 12% Y/Y
Non-GAAP Operating Margin of 21.9%
Non-GAAP Diluted EPS up $0.10 Q/Q and
$0.15 Y/Y
Demand Metrics
12% Y/Y
2% Y/Y
3% Y/Y
Y/Y Growth Rate
6% Y/Y
7% Y/Y

Copyright © 2014 Juniper Networks, Inc. 5
Revenue and Non-GAAP Diluted EPS Trend
$4,449 $4,365
$4,669
$1.19
$0.85
$1.28
$0.00
$0.50
$1.00
$1.50
$2.00
$0
$1,000
$2,000
$3,000
$4,000
$5,000
2011 2012 2013
Revenue ($M) EPS ($)
FY 2013 RESULTS: EXPANDED OPERATING MARGIN AND EPS
Financial Overview
Revenue increased 7%
Non-GAAP Operating Margin of 19.2%
Non-GAAP Diluted EPS of $1.28, up $0.43 Y/Y
Strong Balance Sheet exiting the year with
$3.1B net cash and investments
7% Y/Y (2)% Y/Y
9% Y/Y
Copyright © 2014 Juniper Networks, Inc. 6
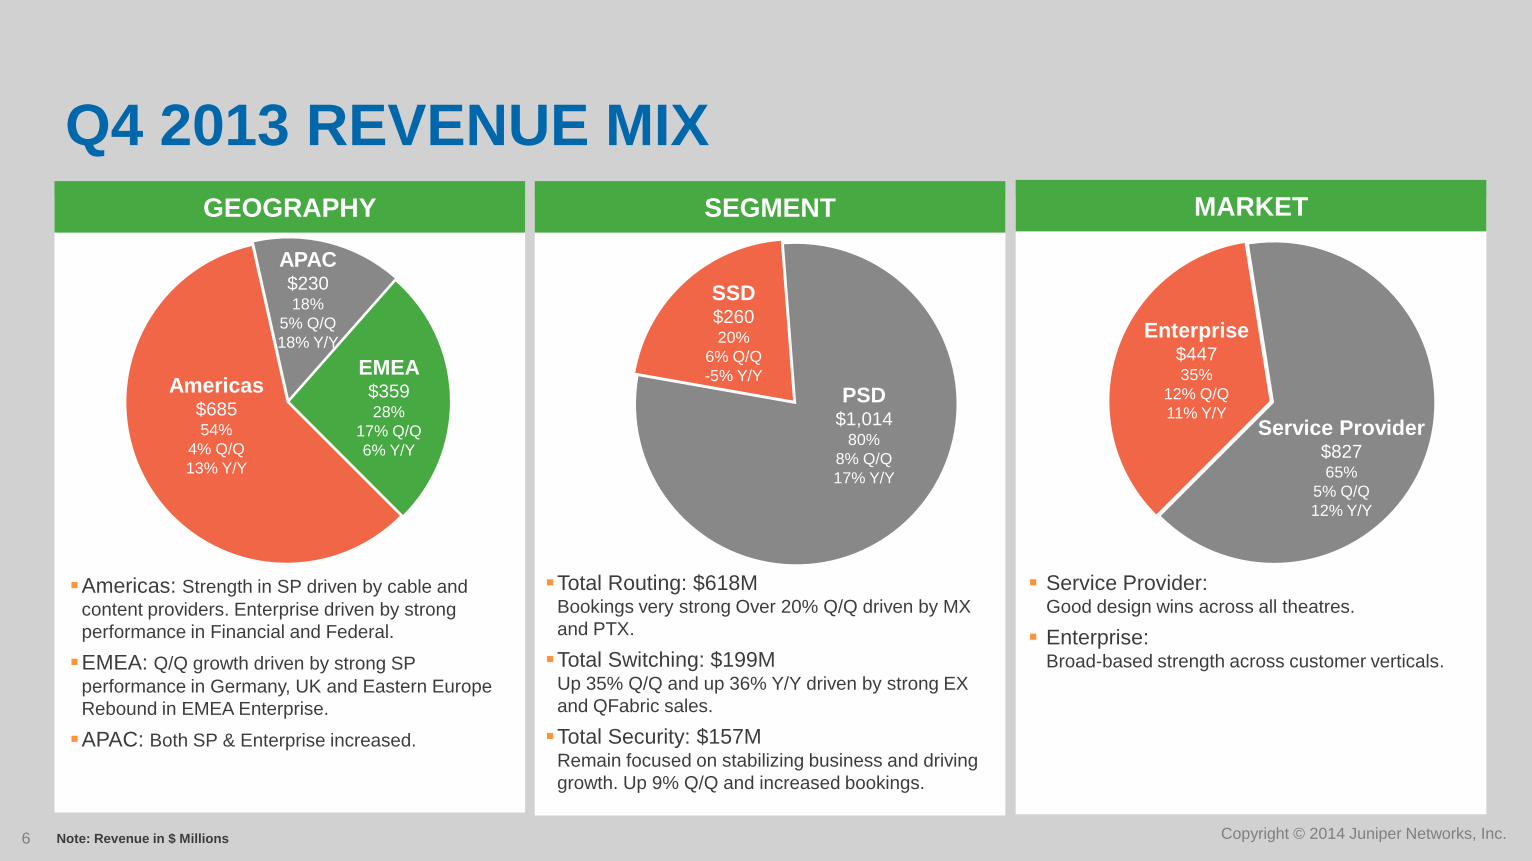
GEOGRAPHY
Q4 2013 REVENUE MIX
Note: Revenue in $ Millions
MARKET SEGMENT
Americas: Strength in SP driven by cable and
content providers. Enterprise driven by strong
performance in Financial and Federal.
EMEA: Q/Q growth driven by strong SP
performance in Germany, UK and Eastern Europe
Rebound in EMEA Enterprise.
APAC: Both SP & Enterprise increased.
EMEA $359 28%
17% Q/Q
6% Y/Y
APAC $230 18%
5% Q/Q
18% Y/Y
Americas $685 54%
4% Q/Q
13% Y/Y
PSD $1,014
80%
8% Q/Q
17% Y/Y
Total Routing: $618M Bookings very strong Over 20% Q/Q driven by MX
and PTX.
Total Switching: $199M Up 35% Q/Q and up 36% Y/Y driven by strong EX
and QFabric sales.
Total Security: $157M Remain focused on stabilizing business and driving
growth. Up 9% Q/Q and increased bookings.
SSD $260 20%
6% Q/Q
-5% Y/Y
Service Provider $827 65%
5% Q/Q
12% Y/Y
Enterprise $447 35%
12% Q/Q
11% Y/Y
Service Provider: Good design wins across all theatres.
Enterprise: Broad-based strength across customer verticals.
Copyright © 2014 Juniper Networks, Inc. 7
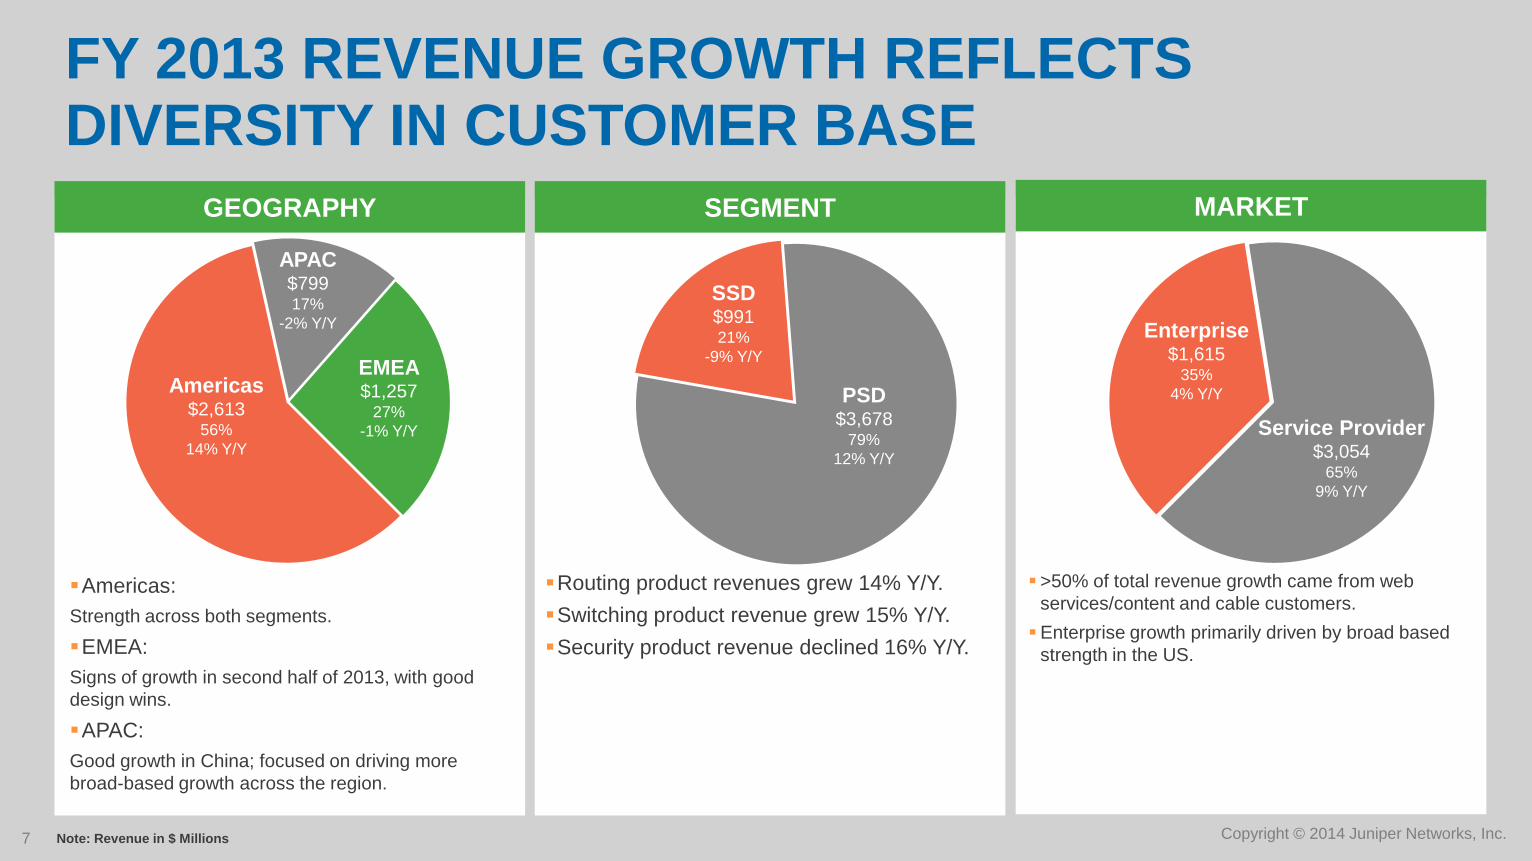
GEOGRAPHY
FY 2013 REVENUE GROWTH REFLECTS DIVERSITY IN CUSTOMER BASE
Note: Revenue in $ Millions
MARKET SEGMENT
Americas:
Strength across both segments.
EMEA:
Signs of growth in second half of 2013, with good
design wins.
APAC:
Good growth in China; focused on driving more
broad-based growth across the region.
EMEA $1,257
27%
-1% Y/Y
APAC $799 17%
-2% Y/Y
Americas $2,613
56%
14% Y/Y
PSD $3,678
79%
12% Y/Y
Routing product revenues grew 14% Y/Y.
Switching product revenue grew 15% Y/Y.
Security product revenue declined 16% Y/Y.
SSD $991 21%
-9% Y/Y
Service Provider $3,054
65%
9% Y/Y
Enterprise $1,615
35%
4% Y/Y
>50% of total revenue growth came from web
services/content and cable customers.
Enterprise growth primarily driven by broad based
strength in the US.

Copyright © 2014 Juniper Networks, Inc. 8
FINANCIAL RESULTS
Q4’13 Q3’13 Q4’12 Q/Q Change Y/Y Change
Revenue $1,273.6M $1,185.6M $1,140.8M 7% 12%
Gross Margin % 64.2% 64.4% 65.3% -0.2 pts -1.1 pts
R&D
Sales & Marketing
G&A
$224.1M
$264.2M
$51.0M
$227.9M
$248.1M
$53.6M
$246.1M
$246.5M
$44.3M
-2%
6%
-5%
-9%
7%
15%
Total Operating Expense
Operating Margin %
$539.3M
21.9%
$529.6M
19.8%
$536.9M
18.2%
2%
2.1 pts
0%
3.7 pts
Net Income
EPS (Diluted)
$215.8M
$0.43
$166.3M
$0.33
$144.6M
$0.28
30%
$0.10
49%
$0.15
Non-GAAP Except Revenue

Copyright © 2014 Juniper Networks, Inc. 9
Q4 2013 CASH FLOW AND BALANCE SHEET METRICS
Cash Position
Net cash, cash equivalents and investments of $3.1B
Net cash flows from operations of $390M
Share Repurchase $242M or 11.8M shares, average price of $20.47/share
DSO 41 days
Product Deferred Revenue Total deferred revenue up $48 million dollars Q/Q
Product deferred down $35 million Q/Q

Copyright © 2014 Juniper Networks, Inc. 10
HISTORICAL SOURCES/USES OF CAPITAL 2008-2013
In Billions
Share Repurchases shown, net of proceeds from share issuances
“Other” consists of change in investments, purchase of licensed software, excess tax benefit, and change in restricted cash
*Fully diluted shares outstanding
Demonstrated ability and commitment to generate strong cash flows,
enabling investments in the business and capital distribution to shareholders
Cash Generated Invested in the
Business Capital
Distribution
FY’08
Beginning
Cash &
Investments
FY’13
Cash &
Investments
Cash from
Operations
Financing
Proceeds Capital
Purchases
M&A
Share
Repurchases
60% Offshore
40% Onshore
Other
$2.0
$5.0
$1.0 ($1.4)
($0.6)
($2.1)
$0.2 $4.1 gross
551.4
Shares* 510.3
Shares*
Copyright © 2014 Juniper Networks, Inc. 11
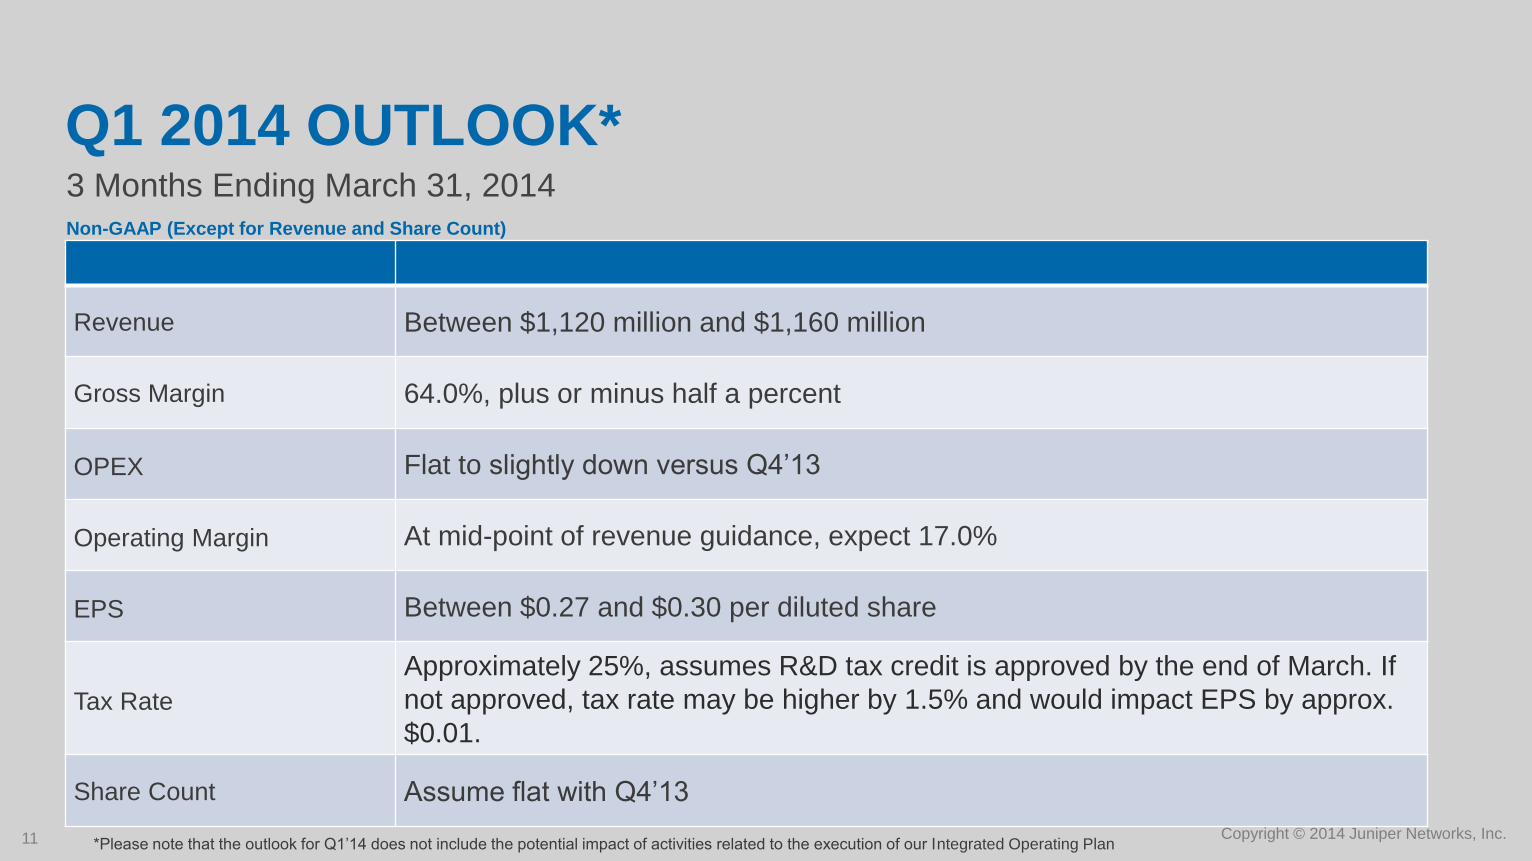
3 Months Ending March 31, 2014
Q1 2014 OUTLOOK*
Revenue Between $1,120 million and $1,160 million
Gross Margin 64.0%, plus or minus half a percent
OPEX Flat to slightly down versus Q4’13
Operating Margin At mid-point of revenue guidance, expect 17.0%
EPS Between $0.27 and $0.30 per diluted share
Tax Rate
Approximately 25%, assumes R&D tax credit is approved by the end of March. If
not approved, tax rate may be higher by 1.5% and would impact EPS by approx.
$0.01.
Share Count Assume flat with Q4’13
Non-GAAP (Except for Revenue and Share Count)
*Please note that the outlook for Q1’14 does not include the potential impact of activities related to the execution of our Integrated Operating Plan

Copyright © 2014 Juniper Networks, Inc. 12 Copyright © 2014 Juniper Networks, Inc.
APPENDIX

Copyright © 2014 Juniper Networks, Inc. 13
SEGMENT OPERATING RESULTS Three Months Ended
(in millions, except per share amounts and percentages) Q4'13 Q3'13 Q4'12
Platform Systems Division Segment:
Product revenue $802.0 $741.9 $659.5
Service revenue 211.7 197.4 206.9
Total PSD revenue $1,013.7 $939.3 $866.4
Non-GAAP PSD contribution margin $ $469.3 $424.1 $365.5
Non-GAAP PSD contribution margin % 46.3% 45.1% 42.2%
Software Solutions Division Segment:
Product revenue $171.5 $158.9 $187.8
Service revenue 88.4 87.4 86.6
Total SSD revenue $259.9 $246.3 $274.4
Non-GAAP SSD contribution margin $ $108.6 $95.2 $116.4
Non-GAAP SSD contribution margin % 41.8% 38.7% 42.4%
Total revenue $1,273.6 $1,185.6 $1,140.8
Copyright © 2014 Juniper Networks, Inc. 14
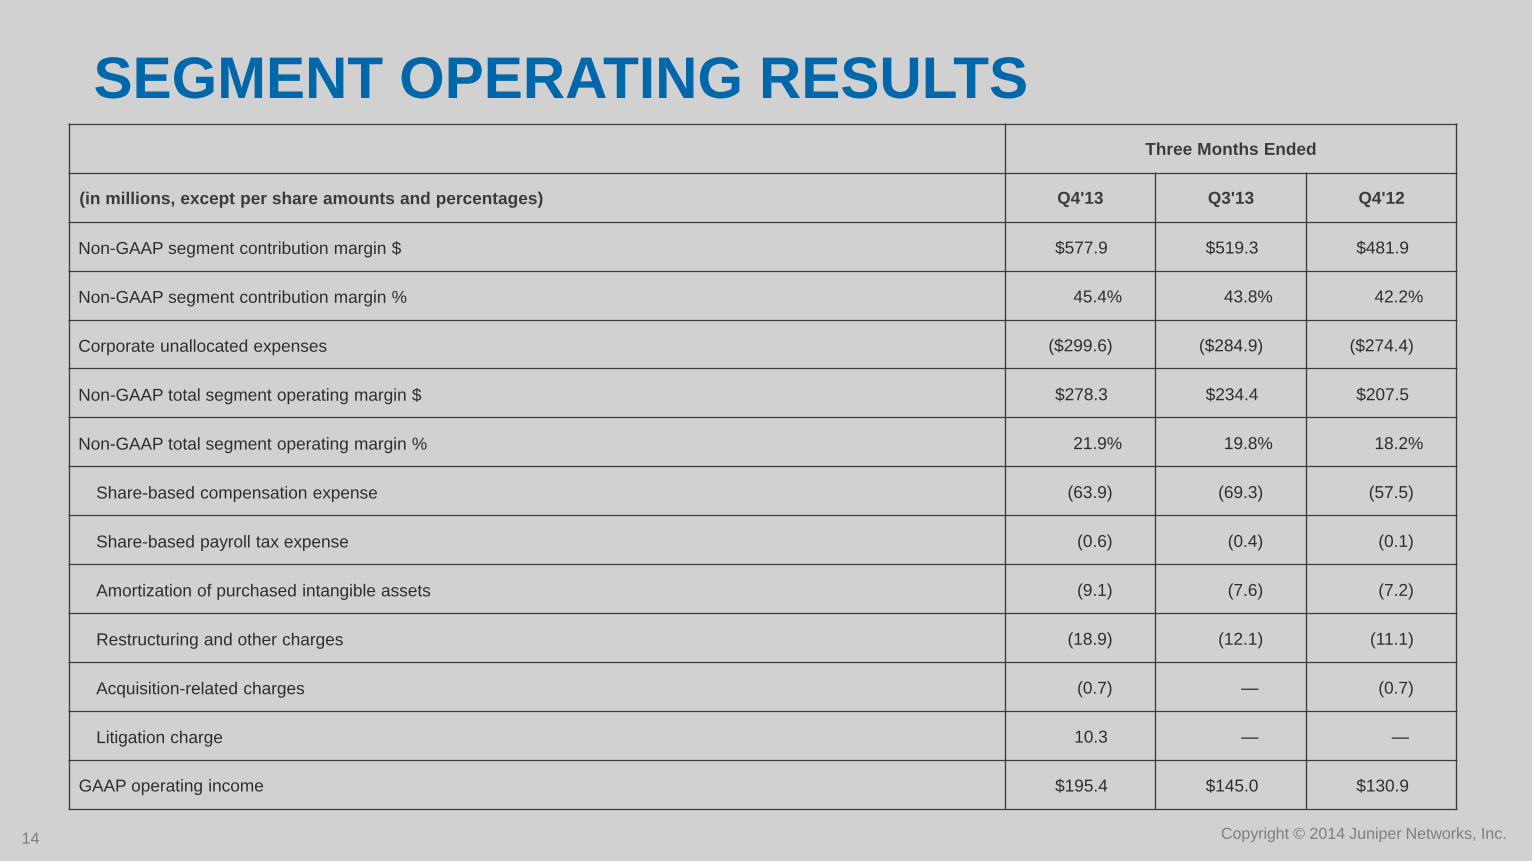
SEGMENT OPERATING RESULTS Three Months Ended
(in millions, except per share amounts and percentages) Q4'13 Q3'13 Q4'12
Non-GAAP segment contribution margin $ $577.9 $519.3 $481.9
Non-GAAP segment contribution margin % 45.4% 43.8% 42.2%
Corporate unallocated expenses ($299.6) ($284.9) ($274.4)
Non-GAAP total segment operating margin $ $278.3 $234.4 $207.5
Non-GAAP total segment operating margin % 21.9% 19.8% 18.2%
Share-based compensation expense (63.9) (69.3) (57.5)
Share-based payroll tax expense (0.6) (0.4) (0.1)
Amortization of purchased intangible assets (9.1) (7.6) (7.2)
Restructuring and other charges (18.9) (12.1) (11.1)
Acquisition-related charges (0.7) — (0.7)
Litigation charge 10.3 — —
GAAP operating income $195.4 $145.0 $130.9
Copyright © 2014 Juniper Networks, Inc. 15
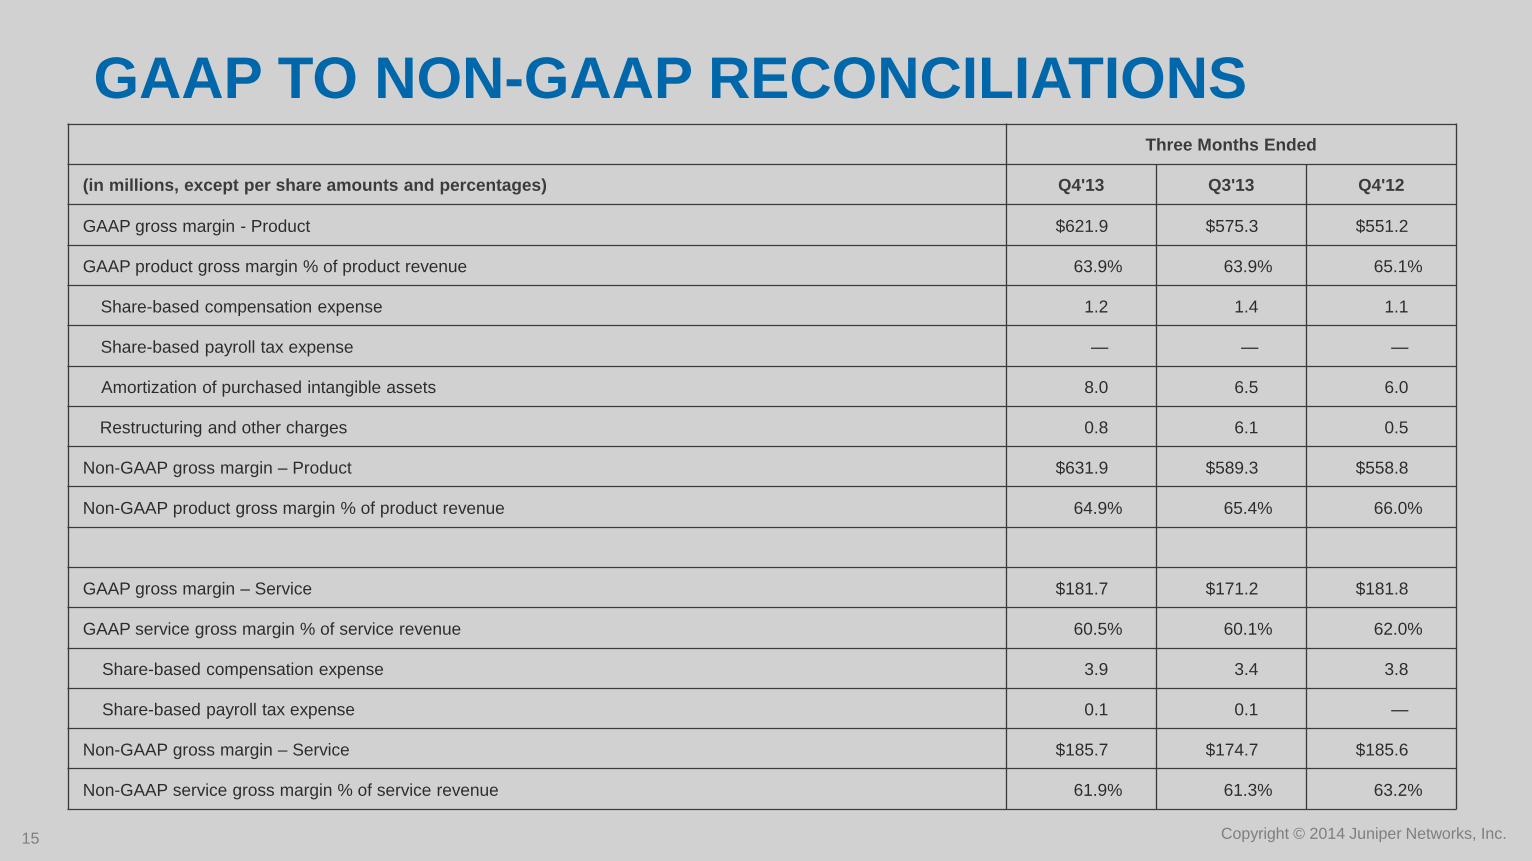
GAAP TO NON-GAAP RECONCILIATIONS Three Months Ended
(in millions, except per share amounts and percentages) Q4'13 Q3'13 Q4'12
GAAP gross margin - Product $621.9 $575.3 $551.2
GAAP product gross margin % of product revenue 63.9% 63.9% 65.1%
Share-based compensation expense 1.2 1.4 1.1
Share-based payroll tax expense — — —
Amortization of purchased intangible assets 8.0 6.5 6.0
Restructuring and other charges 0.8 6.1 0.5
Non-GAAP gross margin – Product $631.9 $589.3 $558.8
Non-GAAP product gross margin % of product revenue 64.9% 65.4% 66.0%
GAAP gross margin – Service $181.7 $171.2 $181.8
GAAP service gross margin % of service revenue 60.5% 60.1% 62.0%
Share-based compensation expense 3.9 3.4 3.8
Share-based payroll tax expense 0.1 0.1 —
Non-GAAP gross margin – Service $185.7 $174.7 $185.6
Non-GAAP service gross margin % of service revenue 61.9% 61.3% 63.2%

Copyright © 2014 Juniper Networks, Inc. 16
GAAP TO NON-GAAP RECONCILIATIONS Three Months Ended
(in millions, except per share amounts and percentages) Q4'13 Q3'13 Q4'12
GAAP gross margin $803.6 $746.5 $733.0
GAAP gross margin % of revenue 63.1% 63.0% 64.3%
Share-based compensation expense 5.1 4.8 4.9
Share-based payroll tax expense 0.1 0.1 —
Amortization of purchased intangible assets 8.0 6.5 6.0
Restructuring and other charges 0.8 6.1 0.5
Non-GAAP gross margin $817.6 $764.0 $744.4
Non-GAAP gross margin % of revenue 64.2% 64.4% 65.3%
Copyright © 2014 Juniper Networks, Inc. 17
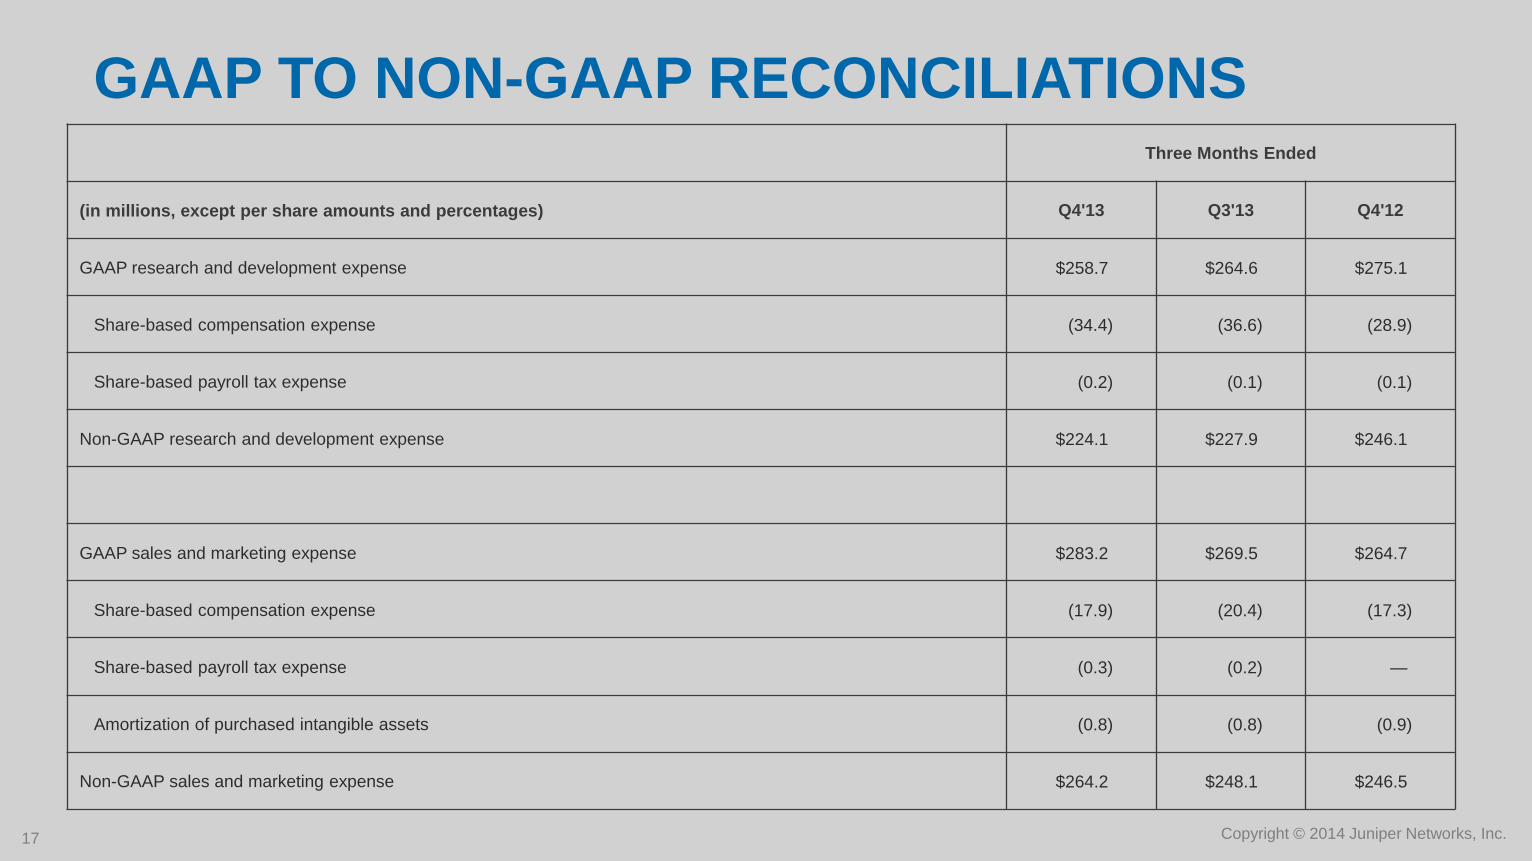
GAAP TO NON-GAAP RECONCILIATIONS
Three Months Ended
(in millions, except per share amounts and percentages) Q4'13 Q3'13 Q4'12
GAAP research and development expense $258.7 $264.6 $275.1
Share-based compensation expense (34.4) (36.6) (28.9)
Share-based payroll tax expense (0.2) (0.1) (0.1)
Non-GAAP research and development expense $224.1 $227.9 $246.1
GAAP sales and marketing expense $283.2 $269.5 $264.7
Share-based compensation expense (17.9) (20.4) (17.3)
Share-based payroll tax expense (0.3) (0.2) —
Amortization of purchased intangible assets (0.8) (0.8) (0.9)
Non-GAAP sales and marketing expense $264.2 $248.1 $246.5
Copyright © 2014 Juniper Networks, Inc. 18
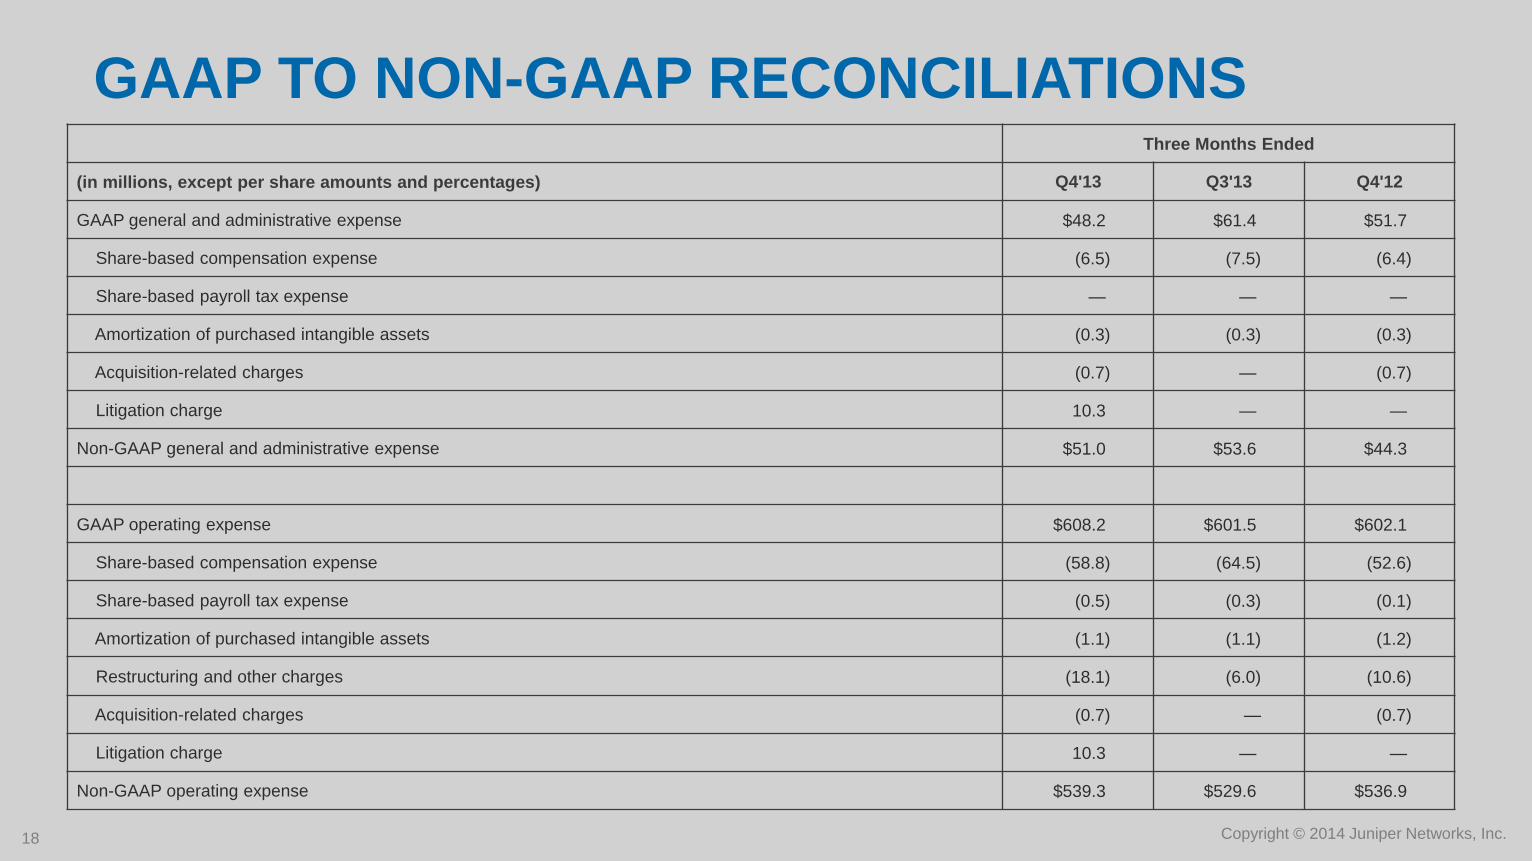
GAAP TO NON-GAAP RECONCILIATIONS Three Months Ended
(in millions, except per share amounts and percentages) Q4'13 Q3'13 Q4'12
GAAP general and administrative expense $48.2 $61.4 $51.7
Share-based compensation expense (6.5) (7.5) (6.4)
Share-based payroll tax expense — — —
Amortization of purchased intangible assets (0.3) (0.3) (0.3)
Acquisition-related charges (0.7) — (0.7)
Litigation charge 10.3 — —
Non-GAAP general and administrative expense $51.0 $53.6 $44.3
GAAP operating expense $608.2 $601.5 $602.1
Share-based compensation expense (58.8) (64.5) (52.6)
Share-based payroll tax expense (0.5) (0.3) (0.1)
Amortization of purchased intangible assets (1.1) (1.1) (1.2)
Restructuring and other charges (18.1) (6.0) (10.6)
Acquisition-related charges (0.7) — (0.7)
Litigation charge 10.3 — —
Non-GAAP operating expense $539.3 $529.6 $536.9

Copyright © 2014 Juniper Networks, Inc. 19
GAAP TO NON-GAAP RECONCILIATIONS
Three Months Ended
(in millions, except per share amounts and percentages) Q4'13 Q3'13 Q4'12
GAAP operating income $195.4 $145.0 $130.9
GAAP operating margin 15.3% 12.2% 11.5%
Share-based compensation expense 63.9 69.3 57.5
Share-based payroll tax expense 0.6 0.4 0.1
Amortization of purchased intangible assets 9.1 7.6 7.2
Restructuring and other charges 18.9 12.1 11.1
Acquisition-related charges 0.7 — 0.7
Litigation charge (10.3) — —
Non-GAAP operating income $278.3 $234.4 $207.5
Non-GAAP operating margin 21.9% 19.8% 18.2%
GAAP income tax provision $33.4 $38.4 $44.2
GAAP income tax rate 18.0% 27.9% 31.6%
Income tax effect of non-GAAP exclusions 16.5 18.6 8.8
Non-GAAP provision for income tax $49.9 $57.0 $53.0
Non-GAAP income tax rate 18.8% 25.5% 26.8%

Copyright © 2014 Juniper Networks, Inc. 20
GAAP TO NON-GAAP RECONCILIATIONS
Three Months Ended
(in millions, except per share amounts and percentages) Q4'13 Q3'13 Q4'12
GAAP net income $151.8 $99.1 $95.7
Share-based compensation expense 63.9 69.3 57.5
Share-based payroll tax expense 0.6 0.4 0.1
Amortization of purchased intangible assets 9.1 7.6 7.2
Restructuring and other charges 18.9 12.1 11.1
Acquisition-related charges 0.7 — 0.7
Litigation charge (10.3) — —
Gain on equity investments (2.4) (3.6) (18.9)
Income tax effect of non-GAAP exclusions (16.5) (18.6) (8.8)
Non-GAAP net income $215.8 $166.3 $144.6
GAAP diluted net income per share $0.30 $0.19 $0.19
Non-GAAP diluted net income per share $0.43 $0.33 $0.28
Shares used in computing diluted net income per share 505.6 508.6 513.1

Copyright © 2014 Juniper Networks, Inc. 21 Copyright © 2014 Juniper Networks, Inc.
THANK YOU


![JUNIPER NETWORKS INC (JNPR) - s1.q4cdn.coms1.q4cdn.com/.../annual_reports/JuniperNetworks_10K_20110225[1].pdf · JUNIPER NETWORKS INC (JNPR) 10-K Annual report pursuant to section](https://img.pdfslide.us/doc/110x75/5afeef4d7f8b9a256b8dc5c8/juniper-networks-inc-jnpr-s1q4cdncoms1q4cdncomannualreportsjunipernetworks10k201102251pdfjuniper.jpg)