Embed Size (px)
Citation preview

2009 Fourth Quarter and 2009 Annual Results

2
This presentation may contain forward-looking statements, including statements regarding the business and anticipated financial performance of TransAlta Corporation. All forward-looking statements are based on our beliefs and assumptions based on information available at the time the assumption was made. These statements are not guarantees of our future performance and are subject to a number of risks and uncertainties that may cause actual results to differ materially from those contemplated by the forward-looking statements. Some of the factors that could cause such differences include cost of fuels to produce electricity, legislative or regulatory developments, competition, global capital markets activity, changes in prevailing interest rates, currency exchange rates, inflation levels, unanticipated accounting or audit issues with respect to our financial statements or our internal control over financial reporting, plant availability, and general economic conditions in geographic areas where TransAlta Corporation operates. Given these uncertainties, the reader should not place undue reliance on this forward-looking information, which is given as of this date. The material assumptions in making these forward-looking statements are disclosed in our 2008 Annual Report to shareholders and other disclosure documents filed with securities regulators.
Unless otherwise specified, all dollar amounts are expressed in Canadian dollars.
Forward looking statements

3
Outline
Fourth Quarter and 2009 Annual ResultsPerformance Against Key Measures2010 Outlook

4
Comparable earnings per share of $0.40; the same as Q4 2008
• Lower planned and unplanned outages at Alberta coal units; lower unplanned outages at Genesee 3
• Lower OM&A driven by lower compensation costs and targeted cost savings across the organization
• Lower Energy Trading gross margins and lower hydro volumes partially offset gains
• Full year 2009 comparable earnings of $0.90 versus $1.46 for same period in 2008 due to higher planned and unplanned outages at Alberta coal plants, reduced earnings from hydro assets as a result of poor water conditions in Alberta, and higher unplanned outages at Centralia Thermal
Cash flow from operations of $246 million compared to $428 million in Q4 2008• Higher cash earnings offset by less favorable changes in working capital
• Full year 2009 cash flow from operations $580 million compared to $1,038 million for same period in 2008 due to lower cash earnings, an extra $116 million PPA payment in 2008, higher inventory balances in 2009, and unfavourable changes in working capital
Improved Alberta Coal performance; partially offset by lower hydro volumes and lower Energy Trading gross margins
Q4 2009

5
45,736
85.1
$1.16
$580
$0.90
$0.90
$181
$181
$378
$1,542
$2,770
2009
12,656
86.2
$0.27
$428
$0.47
$0.40
$94
$79
$127
$410
$808
Q4 2008
48,891
85.8
$1.08
$1,038
$1.18
$1.46
$235
$290
$533
$1,617
$3,110
2008
12,297
87.0
$0.29
$246
$0.37
$0.40
$79
$84
$159
$435
$763
Q4 2009
Availability (%)
Comparable earnings per share
Basic and diluted earnings per share
Comparable earnings
Operating income
Production (GWh)
Cash dividends declared per share
Cash flow from operating activities
Net Earnings
Gross margin
Revenue
Results ($M)
Q4 and YE 2009

6
Significant eventsMedium-Term Notes OfferingNov. 18, TransAlta completed the offering of $400 million medium-term notes maturing in 2019 and bearing an interest rate of 6.4%. Net proceeds from the offering were used to repay a portion of the indebtedness relating to the Canadian Hydro acquisition.
Senior Notes OfferingNov. 13, TransAlta completed the offering of U.S.$500 million senior notes maturing in 2015 bearing an interest rate of 4.75%. Net proceeds from the offering were used to repay a portion of the indebtedness relating to the Canadian Hydro acquisition.
Sale of Common Shares Nov. 5, TransAlta completed the public offering of over 18 million common shares at a price of $20.10 per common share, which resulted in proceeds of $412.5 million, used to repay a portion of the indebtedness relating to the Canadian Hydro acquisition.
Acquisition of Canadian Hydro Nov. 4, TransAlta completed the acquisition of Canadian Hydro for $5.25 cash per share.
Blue TrailNov. 2, TransAlta’s 66MW Blue Trail wind farm began commercial operations on budget and one month ahead of schedule.
Keephills 3Oct. 26, the Board of Directors approved an increase in the construction cost of Keephills 3 to $988 million due to a change in our original expectations of the labour required to complete the project, and a change to the commencement of commercial operations to Q2 2011.
Carbon Capture and StorageOct. 14, the federal and provincial governments announced TransAlta’s Project Pioneer has received committed funding of over $770 million.
Subsequent eventKent Hills ExpansionJan. 11, TransAlta announced a 25 year power purchase agreement with NB power and a 54 MW expansion of its wind farm for a cost of $100 million. The project is expected to be completed in Q4 2010. Summerview 2Feb. 23, TransAlta’s 66MW Summerview 2 wind farm began commercial operation on budget and ahead of schedule.
Q4 2009 Significant events
7
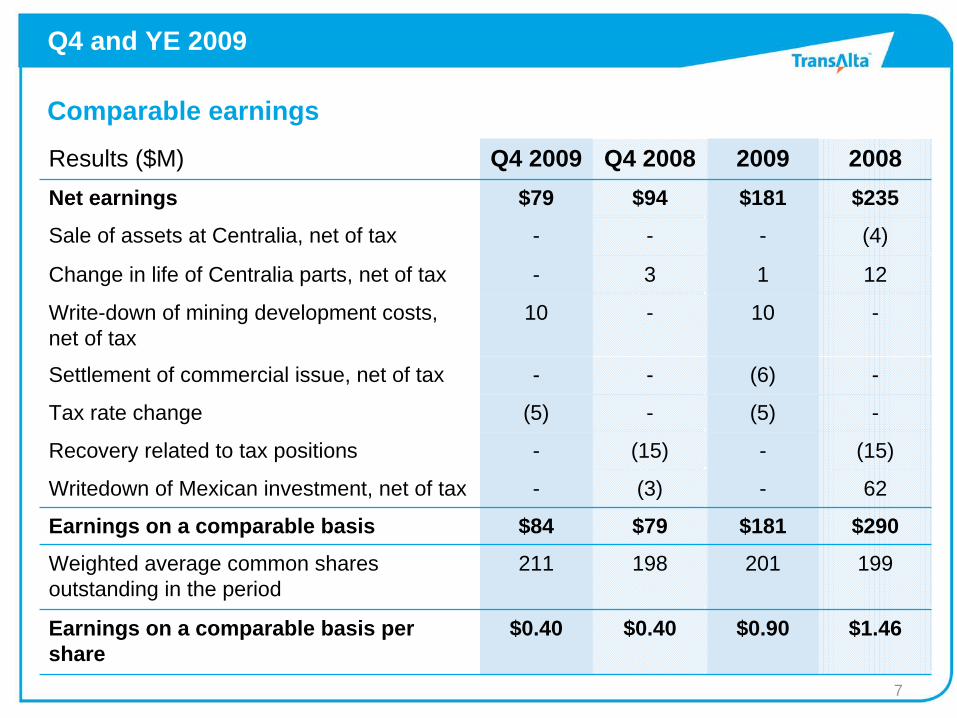
-(5)-(5)Tax rate change
(15)-(15)-Recovery related to tax positions
-(6)--Settlement of commercial issue, net of tax
1213-Change in life of Centralia parts, net of tax
-10-10Write-down of mining development costs, net of tax
$0.40
198
$79
(3)
-
$94
Q4 2008
$0.90
201
$181
-
-
$181
2009
199211Weighted average common shares outstanding in the period
$0.40
$84
-
-
$79
Q4 2009
$290Earnings on a comparable basis
$1.46Earnings on a comparable basis per share
62Writedown of Mexican investment, net of tax
(4)Sale of assets at Centralia, net of tax
$235Net earnings
2008Results ($M)
Comparable earnings
Q4 and YE 2009

8
Net earnings
(16)(16)Writedown of mining development costs
$181$79Net earnings, 20092010Other
97-Decrease in equity loss
8(21)(Increase) decrease in income tax expense
2312Decrease in non-controlling interest
(33)
(13)
21
(14)
3
36
$94Q4 2009
(34)
(47)
(30)
(58)
16
(33)
$2352009
Mark-to-market movements - Generation
Decrease in COD gross margins
Decrease (increase) in operations, maintenance, and admin costsIncrease in depreciation expense
Increase in net interest expense
Increase (decrease) in Generation gross margins
Net earnings, 2008
Q4 and YE 2009

9
Performance goals
Comparable EPS decreased from $1.46 to $0.90 due to higher planned and unplanned outages at Alberta Coal, lower hydro volumes, lower electricity prices in Alberta and the Pacific Northwest, and lower energy trading gross margins.
$0.90>10%/yrComparable EPS Grow Earnings and Cash Flow
5.8%1.4%
4.9X
20.1%
56.1%
$380 MM
$580 MM
$8.91/MWh
1.41
85.1%
2009
Sustaining Capex in line with target and decreased compared to 2008 due to less spending on routine and mine capital and on planned maintenance.
$270 - $390Sustaining CapexMake Sustaining Capex Predictable
Balance sheet ratios remain strong but were tighter in 2009 due to less cash flows generated from operating activities and the issuances of debt to fund growth for the Canadian Hydro acquisition.
4 - 5X
20 - 25%
55 - 60%
Cash Flow to InterestCash Flow to DebtDebt to Total Capital
Maintain InvestmentGrade Ratings
Comparable ROCE was lower due to planned and unplanned outages at Alberta Coal and the acquisition of Canadian Hydro Developers. Given difficult market conditions, TransAlta’s TSR was below 10 per cent.
>10%/yr>10%/yr>10%/yr
Comparable ROCETSRIRR
Deliver Long-termShareowner Value
Lower operating cash flow over 2009 due to lower cash earnings, the receipt of an additional $116 million PPA payment in 2008, higher inventory balances in 2009, and the timing of operational payments.
Accelerated major maintenance drove a three per cent year-over-year increase in OM&A costs per MWh of installed capacity.
IFR increased to 1.41 from 1.28.
Lower availability due to higher planned and unplanned outages at Alberta Coal and higher unplanned outages at Centralia Thermal.
2009 Goals
$800 - 900 MMOperating Cash Flow
90 - 92%AvailabilityAchieve top decile operations
10%/yrInjury Frequency RateImprove Safety
Offset InflationOM&A/installed MWhEnhanceProductivity
Measures ReviewFinancial ratios

10
2009 Highlights
Drive the base:• Enhanced our returns at Sarnia through negotiating a new long-term contract• Completed the Centralia fuel transition• Completed four major maintenance outages and two pitstops at our Alberta coal
operations
Green our portfolio:• Expanded our renewable portfolio by adding over 750 MW through the acquisition of
Canadian Hydro and completing construction of our Blue Trail wind farm• Became the leading publically traded provider of renewable energy in Canada• Announced 87 MW of new capacity with the construction of Ardenville (69 MW) and Bone
Creek (18 MW)
Reposition Coal:• Realigned our major maintenance plans on a unit by unit basis• Awarded over $770 million in government funding to advance the development of North
America’s largest carbon capture and storage project; Project Pioneer
Despite operational challenges, TransAlta successfully advanced on a number of key strategic imperatives throughout the year

11
Drive the base:• Targeting low double digit comparable EPS and EBITDA growth• Approximately 89% of portfolio contracted for 2010 providing a high degree of earnings protection• Target 90% fleet availability for 2010• Energy trading expected to contribute between $50 - $70 million in gross margin
Green our portfolio:• Summerview 2 expansion (66 MW) completed on budget and ahead of schedule, Feb. 2010• Kent Hills expansion (54 MW) expected to come online in Q4 2010• Ardenville (69 MW) wind farm expected to come online in Q1 2011• Bone Creek (18 MW) hydro facility expected to come online in Q1 2011
Reposition coal:• Project Pioneer Front End Engineering and Design (FEED) underway, expected to be completed
in mid-2010• Lifecycle planning and flexibility provided by revising Alberta coal plants major maintenance
schedule on a unit by unit basis
2010 Outlook
Well positioned to improve results in 2010

12
Appendix

13
Income statement
(MM) Q4 '09 Q4 '08 2009 2008
Revenue 763$ 808$ 2,770$ 3,110$ Fuel & purchased power (328) (398) (1228) (1,493)Gross margin 435 410 1,542 1,617
OM&A 142 163 667 637Depreciation & amortization 129 116 475 428Taxes, other than income taxes 5 4 22 19Operating expenses 276 283 1,164 1,084
Operating Income 159 127 378 533
Foreign exchange gain (loss) 4 (7) 8 (12)Writedown of mining development costs (16) - (16) -Net interest expense (42) (9) (144) (110)Equity loss - - - (97)Other income - - 8 5Earnings before non-controlling interest and income taxes 105 111 234 319Non-controlling interests 11 23 38 61EBIT 94 88 196 258
Income tax expense (recovery) 15 (6) 15 23Net earnings 79$ 94$ 181$ 235$ Net earnings per share 0.37$ 0.47$ 0.90$ 1.18$

14
Cash flow($M) Q4 '09 Q4 '08 2009 2008
Operating Activities 266$ 249$ 729$ 828$ Change in non-cash working capital (20) 179 (149) 210
246 428 580 1,038
Investing ActivitiesAcquisiton of Canadian Hydro Developers Inc., net of cash acquired (766) - (766) -Additions to property, plant, and equipment (223) (311) (904) (1,006) Proceeds on sale of property, plant, and equipment 2 4 7 30 Proceeds on sale of minority interest in Kent Hills - - 29 -Restricted Cash 1 1 - 248 Income tax receivable (41) - (41) (8) Realized gains (losses) on financial instruments - 15 (16) 52 Loan to equity investment - - - (245) Proceeds on sale of equity investment - 332 - 332 Net (decrease) increse in collateral received from counterparties (18) - 87 -Net (increase) decrease in collateral paid to counterparties (2) - 7 -Settlement of adjustments on sale of Mexican investment - - (7) -Other 11 4 6 16
(1,036) 45 (1,598) (581) Financing activitiesNet increase (decrease) in credit facilities 320 (350) 620 (243) Repayment of long-term debt (776) (68) (796) (308) Issuance of long-term debt 919 - 1,119 502 Dividends paid on common shares (57) (49) (226) (212) Funds paid to repurchase common shares under NCIB - - - (130) Net procees on issuance of common shares 398 1 398 15 Realized gains on financial instruments - - - 12 Distributions to subsidiaries' non-controlling interests (18) (29) (58) (98) Other 1 (3) (4) (5)
787 (498) 1,053 (467)
Cash flow from (used in) operating, investing, and financing (3) (25) 35 (10) Effect of translation on foreign currency cash (1) 9 (3) 9 Increase (decrease) in cash and cash equivalents (4)$ (16)$ 32$ (1)$

15
$(117)
-
(8)
-
(25)
(58)
(226)
(380)
$580
2009
$154
-
-
-
(25)
(29)
(49)
(171)
$428
Q4 ‘08
2-Cash flows from equity investments
$121
-
(116)
(28)
(98)
(212)
(465)
$1,038
2008
-Timing of contractually scheduled PPA payments
$78Free cash flow (deficiency)
-Other income
(6)Non-recourse debt repayments
(18)Distribution to subsidiaries’ non-controlling interest
(57)Dividends on common shares
(187)Sustaining capital expenditures
Add (Deduct):
$246Cash flow from operating activities
Q4 ‘09($M)
Free cash flow

16
--$21Centralia modifications
$155 - 175$140 - 155$115Major Maintenance
$35 - 40$25 - 30$42Mine
$5 - 10$10 - 15$44Productivity capital
$115 - 130
$310 - 355
2011e
$158
$380
2009
$120 - 140
$295 - 340
2010e
Routine capital
Sustaining
($M)
Sustaining capex supports operational objectives
2009 Sustaining capital

17
Delivering on growth and creating long-term shareholder value
$1233$15 - 25$8166Summerview 2
$ 772---$6053Sun 5 uprate
185
66
MW
$313$228 Total
$1131---$87Blue Trail
2012e Total2010e 2011e2009Completed
41246
69
225
18
54
MW
$100$80 - 85$18Kent Hills 2
$484$40 - 45$4Bone Creek
$9885$20 - 30$225 - 245$231Keephills 3
$135 $95 - 105$27Ardenville
$68$20 - 30$25 - 35$5 - 15$2KI & K2 uprates
$20 - 30
2012e
$1.3B
Total
$445 - 495
2010e
$45 - 65
2011e
$282
2009
Total
In Progress
Growth capital
1. Blue Trail capital spend prior to 2009 was $26M2. Sun 5 uprate capital spend prior to 2009 was $17M3. Summerview II capital spend prior to 2008 was $25M4. Bone Creek capital spend prior to the acquisition was $23M which does not form part of our total project cost5. Keephills 3 capital spend prior to 2009 was $476M

18
Average spot electricity prices
$46 $42
$30
$95
$51 $48$48
$32 $30
$90
$59$49
$0$10$20$30$40$50$60$70$80$90
$100
Alberta Pac NW Ontario
$ per MWh
Q4 2009 Q4 2008 2009 2008

19
Average spark spreads
$14$8
($4)
$49
$7
($9)
$20
$6
($4)
$33
$2
($18)
-$30
-$20
-$10
$0
$10
$20
$30
$40
$50
$60
Alberta Pac NW Ontario
$ per MWh
Q4 2009 Q4 2008 2009 2008