Embed Size (px)
Citation preview
FUCHS PETROLUB AG
Q3 INTERIM REPORTas at september 30, 2011
Double-digit growth in sales revenues EBIT reaches € 200 million Target of exceeding the record EBIT of 2010 remains in place
2
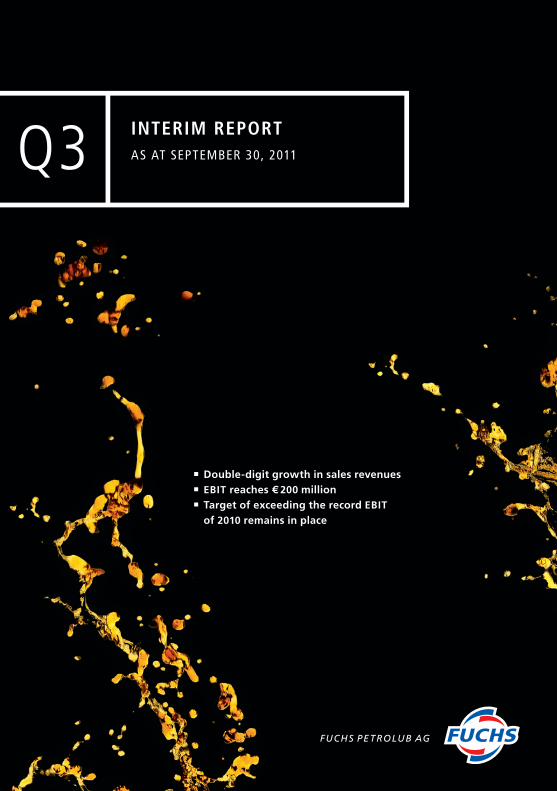
Grou p
Amounts in € million 1 − 9 / 2011 1−9/2010
Sales revenues 1 1,255 1,084
Europe 770 651
Asia-Pacific,Africa 312 281
NorthandSouthAmerica 211 184
Consolidation –38 –32
Earnings before interest and tax (EBIT) 200 191
Profit after tax 137 133
Earnings per share in €
Ordinaryshare 1.91 1.85
Preferenceshare 1.93 1.87
Gross cash flow 149 127
Capital expenditure 2 24 22
Employees (as at September 30) 3,710 3,538
1 by company location2 In property, plant and equipment and intangible assets
The firsT nine monThs of 2011 aT a gl ance
3
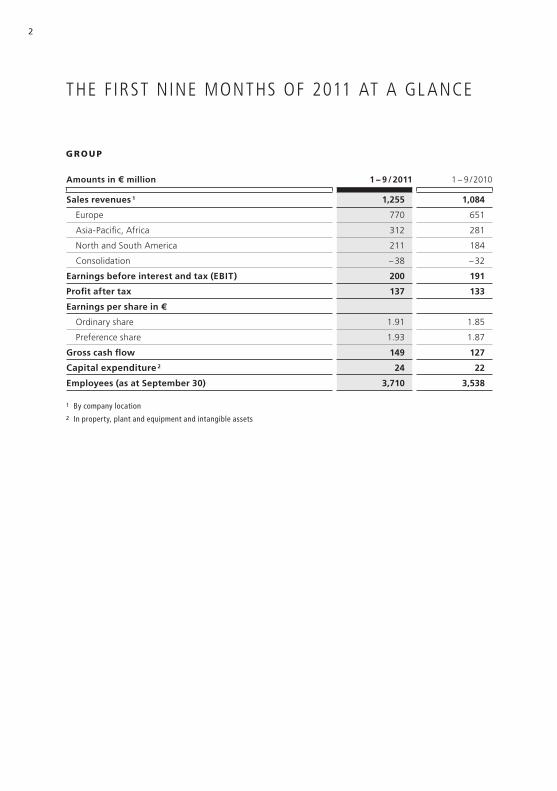
The first nine months of 2011 at a glance
Letter to our shareholders
Group management report
Environment
Performanceinthethirdquarter
Performanceinthefirstninemonths
Netassetsandfinancialposition
Capitalexpenditureandinvestmentsincompanies
Statementofcashflows
Researchanddevelopment
Employees
Opportunitiesandrisks
Businesstransactionswithrelatedcompaniesandpersons
Outlook
The FUCHS shares
Financial report of the Group
Consolidatedincomestatement
Statementofcomprehensiveincome
Consolidatedbalancesheet
Statementofchangesinshareholders’equity
Statementofcashflows
Segments
Notestotheconsolidatedfinancialstatements
Financial calendar
Disclaimer
02
04
06
06
07
09
12
12
12
13
14
14
15
16
17
18
18
20
21
22
24
25
26
30
31
conTenTs
4
leT Ter To our shareholders
Dear ShareholDerS ,
TheFUCHSPETROLUBGroupfurtherincreaseditssalesrevenuesinthethirdquarterof2011andgenerated€1,255millioninrevenuesinthefirstninemonthsoftheyear.Allthreeglobalregionscontributedtothegrowth.Profitaftertaxforthefirstninemonthsoftheyearis€137million.
Freecashflowwasverysatisfactoryinthethirdquarter.Boththisyearandlastyear,fundswerecommittedtothevolume-basedandprice-basedgrowthinsalesrevenues.
Withanequityratioof62%andaliquiditysurplusof€64millionattheendofthequarter,wehaveasolidfinancialstructure.
Wearemakinggoodprogresswithourgrowthinitiative:Additionalstaffinallthreeglobalregionsaswellasinvestmentsinresearchandsales,specialties,keyfacilitiesandemergingmarketsformthebasisforourfutureorganicgrowth.
Globalmarketconditionshavedeteriorated,particularlyduetothenationaldebtcrisisinEurope,theUSandJapan.Rawmaterialcosts,whichincreasedsharplyoverthecourseoftheyear,remainhighoverall.Ourexpensesareincreasingasplanned,duetoboththegrowthinitiativeandtotheinflationarytendenciesinmanycountries.

5
Stefan Fuchs, Chairman of the Executive Board
For the entire year of 2011, we continue to strive to exceed the record earnings before interest and tax of € 250 million achieved in the previous year. The extent of this increase will depend on the sales dynamics at the end of the year.
Stefan Fuchs Chairman of the Executive Board
6
group managemenT reporT
environm ent
Accordingtothejointdiagnosisofleadingeconomicresearchinstitutes,theprospectsfortheglobaleconomydeterioratedsignificantlyatthebeginningoffall2011.Whiletheeconomicslowdownremainedmoderateintheemergingmarketsandwaslargelyintentionalforeconomicreasons,theEuropeandebtcrisisishavinganincreasinglynegativeinfluenceonthedomesticeconomyinEurope.ForGermany,theinstitutesnowexpectGDPtoincreasebyonly2.9%thisyear,comparedtoananticipatedincreaseof3.6%insummer.
Importantend-userindustriesaredevelopingasfollows:
AccordingtotheWorldSteelAssociation,globalsteelproductionincreasedby8.3%throughAugust2011.A6.5%increaseinglobaldemandisanticipatedfortheentirefinan-cialyear.Thisispredominantlyduetogrowthintheemergingmarkets.AccordingtotheGermanSteelTradeAssociation,productioninGermanythroughSeptemberwas3.6%abovethefirstninemonthsof2010.Atotalincreaseinproductionof4%ispredictedfortheyearasawhole.
Despiteinternationalrisks,theGermanEngineeringFederation(VDMA)considersthesitua-tioninthesectortobestableandstillanticipatesa14%increaseinGermanproductionfor2011afteranincreaseof16.7%wasrecordedthroughAugust.
Basedonindustryassessments,globalpassengercarsaleswillincreasebyaround4%in2011.AccordingtotheGermanAssociationoftheAutomotiveIndustry(VDA),productionincreasedby7%,exportsby8%andnewcarregistrationsby11%inGermanyinthefirstninemonthsoftheyear.
Althoughgrowthintheglobalchemicalmarketsloweddown,theAssociationoftheGermanChemicalIndustry(VCI)stillexpectstheindustrytohaveagoodyearinGermanyandhasagainconfirmeditsforecastfortheentireyear.Basedonthisforecast,productioninGermanyisexpectedtoincreaseby5%in2011.
IntheindustrializedcountriesoftheUS,Japan,Germany,FranceandItaly,whichtogethermakeuparoundonethirdofgloballubricantvolumes,demandforlubricantsincreasedbyaround2%onanaccumulatedbasisuptosummer2011.However,demandinsummerwaslowerthaninspring.Wealsoanticipateanincreaseinvolumeofaround2%forthegloballubricantmarketin2011.
7
perFormanC e in the th irD Quarter
Sales revenues
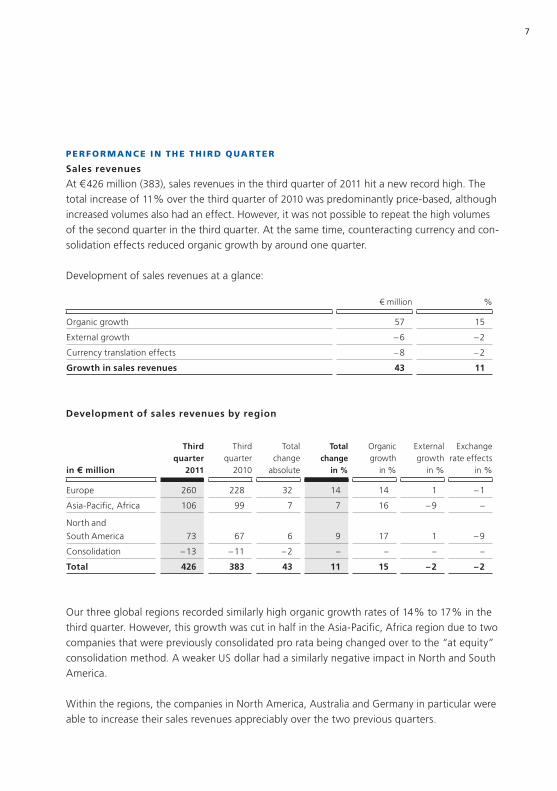
At€426million(383),salesrevenuesinthethirdquarterof2011hitanewrecordhigh.Thetotalincreaseof11%overthethirdquarterof2010waspredominantlyprice-based,althoughincreasedvolumesalsohadaneffect.However,itwasnotpossibletorepeatthehighvolumesofthesecondquarterinthethirdquarter.Atthesametime,counteractingcurrencyandcon-solidationeffectsreducedorganicgrowthbyaroundonequarter.
Developmentofsalesrevenuesataglance:
Development of sales revenues by region
Ourthreeglobalregionsrecordedsimilarlyhighorganicgrowthratesof14%to17%inthethirdquarter.However,thisgrowthwascutinhalfintheAsia-Pacific,Africaregionduetotwocompaniesthatwerepreviouslyconsolidatedproratabeingchangedovertothe“atequity”consolidationmethod.AweakerUSdollarhadasimilarlynegativeimpactinNorthandSouthAmerica.
Withintheregions,thecompaniesinNorthAmerica,AustraliaandGermanyinparticularwereabletoincreasetheirsalesrevenuesappreciablyoverthetwopreviousquarters.
€million %
Organicgrowth 57 15
Externalgrowth –6 –2
Currencytranslationeffects –8 –2
Growth in sales revenues 43 11
in € million
Third quarter
2011
Thirdquarter
2010
Totalchange
absolute
Total change
in %
Organicgrowth
in%
Externalgrowth
in%
Exchangerateeffects
in%
Europe 260 228 32 14 14 1 –1
Asia-Pacific,Africa 106 99 7 7 16 –9 –
Northand
SouthAmerica
73
67
6
9
17
1
–9
Consolidation –13 –11 –2 – – – –
Total 426 383 43 11 15 – 2 – 2
8
Earnings
Withagrowthinsalesrevenuesof11%,theGroupincreaseditsgrossprofitby€6.9millionor4.7%to€154.4million(147.5)inthethirdquarterof2011comparedtothesamequarterinthepreviousyear.Theless-than-proportionateincreaseinearningsisduetothecostsofrawmaterials.Atthesametime,functionalareaexpensesandotherexpenseswentupby€6.4 millionor7.8%,causingearningsbeforeinterest,taxandincomefromparticipationstoincreaseonlyslightlyby€0.5millionto€65.8million(65.3).Theriseinfunctionalareacostsisessentiallyaconsequenceofhighersalesrevenuesandagrowth-drivenincreaseintheworkforce.
At€0.5million(1.6),incomefromparticipationsoriginatingfromourjointventuresintheMiddleEastwasbelowthepreviousyear.Thisisduetoareducedbusinessvolumeandalsoriskprovisionsputinplace.At€66.3million,earningsbeforeinterestandtax(EBIT)arethere-fore€0.6millionlowerthanthesamequarterofthepreviousyear(66.9).Profitaftertaxwas€45.3million(46.2).
With€33.4million(32.8),EuropemadethegreatestcontributiontoGroupEBITinabsoluteterms.TheEBITmarginwas12.9%(14.4%)inthisregion.At21.4%(23.0%),NorthandSouthAmericarecordedthehighestEBITmargin.Thisregion’sabsoluteEBITcontributionwas€15.7million(15.4).EBITof€18.4millionwasrecordedinAsia-Pacific,Africa.TheEBITmargin(beforeincomefromparticipations)was16.9%(18.1%).
9
perFormanC e in the F irSt n ine monthS
Sales revenues
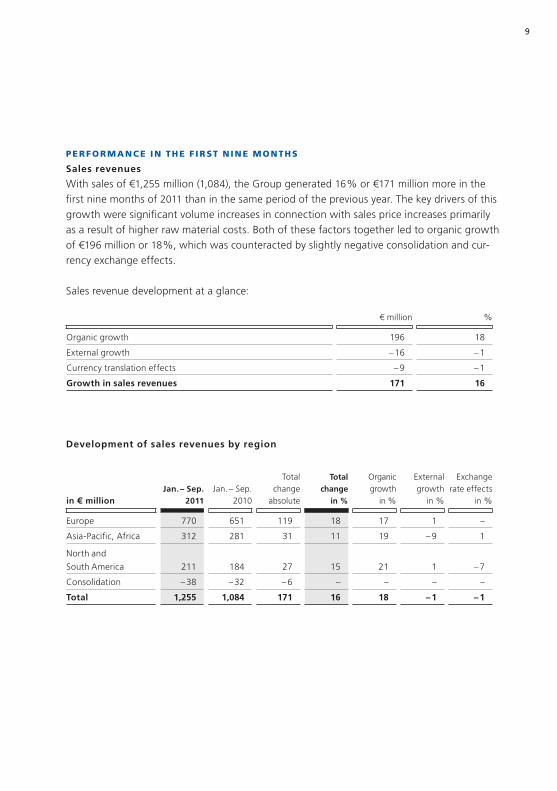
Withsalesof€1,255million(1,084),theGroupgenerated16%or€171millionmoreinthefirstninemonthsof2011thaninthesameperiodofthepreviousyear.Thekeydriversofthisgrowthweresignificantvolumeincreasesinconnectionwithsalespriceincreasesprimarilyasaresultofhigherrawmaterialcosts.Bothofthesefactorstogetherledtoorganicgrowthof€196millionor18%,whichwascounteractedbyslightlynegativeconsolidationandcur-rencyexchangeeffects.
Salesrevenuedevelopmentataglance:
Development of sales revenues by region
€million %
Organicgrowth 196 18
Externalgrowth –16 –1
Currencytranslationeffects –9 –1
Growth in sales revenues 171 16
in € million Jan. – Sep.
2011Jan.–Sep.
2010
Totalchange
absolute
Total change
in %
Organicgrowth
in%
Externalgrowth
in%
Exchangerateeffects
in%
Europe 770 651 119 18 17 1 –
Asia-Pacific,Africa 312 281 31 11 19 –9 1
Northand
SouthAmerica
211
184
27
15
21
1
–7
Consolidation –38 –32 –6 – – – –
Total 1,255 1,084 171 16 18 – 1 – 1
10
At€770million(651),theEuroperegionrecorded18%or€119millionhighersalesrevenuesthaninthesameperiodofthepreviousyear.Theregion’sgrowthof17%wasalmostentirelyorganic.InparticularthecompaniesintheUkraineandRussiaenjoyedgrowthrateswhichwerefaraboveaverage.
TheAsia-Pacific,Africaregionrecordedorganicgrowthof19%or€53million.However,applyingtheequitymethodofaccountingforcompaniesintheMiddleEast,whichwerepre-viouslyconsolidatedonaproratabasis,reducedsalesrevenuesby€29million.Theregionthereforerecordednegativeexternalgrowthof–9%.Takingintoaccountslightlypositivecurrencyexchangeeffectsof€4millionor1%,theregionincreaseditsoverallsalesreve-nuesby11%or€31millionto€312million(281).Thegrowthratesachievedbythecompa-niesinChina,India,SouthKoreaandTurkey,inparticular,wereaboveaverage.
TheNorthandSouthAmericaregionincreaseditssalesrevenuesby€27millionor15%inthefirstninemonthsoftheyear.Thisregionwasevenabletorecordorganicgrowthof€38millionor21%.However,especiallytheweakerUSdollaryearonyearhada–7%impactonsalesrevenuesintheregion.Withabove-averageincreasesinsalesrevenues,particularlyintheUSandCanada,theregionrecordedsalesrevenuesof€211million(184).
Earnings
TheFUCHSPETROLUBGroupincreaseditsgrossprofitinthefirstninemonthsof2011to€463.6million(427.3).Thisrepresentsan8.5%increaseyearonyear.Thissuccessisbasedonhighersalesrevenues(+16%)duetoincreasedvolumesandprices,aswellasproductmixeffects.Thedriverbehindtheincreaseinsalepriceswasthesignificantlyhigherrawmate-rialcosts,theeffectsofwhichcanalsobeseeninthereductionofgrossmarginto37.0%(39.4%).
Atthesametime,otherpersonnelandoverheadcostsincreasedby9.3%or€22.4millionto€263.4million(241.0).Thisincreasewasduetohigherfreightexpensesandcommissionspaidasaresultoftheincreasedvolumes,aswellasincreasedpersonnelcosts.Alongsidehigherglobalwageandsalarycosts,additionalstaffinallthreeglobalregionsandinvestmentsinresearchandsalesduetoourgrowthinitiativealsohadaneffect.AnotherinfluencingfactorfortheriseincostswastheacquisitionofthefoodgradelubricantsbusinessundertheCASSIDAbrand.
11
Earningsbeforeinterest,taxandincomefromparticipationsthereforeroseby7.4%or€13.6 millionto€197.6million(184.0).Relativetosalesrevenues,EBITbeforeincomefromparticipationswas15.8%(17.0%).
RiskprovisionsputinplacewithregardtoourjointventuresintheMiddleEastreducedtheincomefromparticipations.Itwillalsonotbepossibletorepeattherecordearningsrecordedbythesecompaniesin2010thisyear.At€2.6million,incomefromparticipationswasthere-forebelowthepreviousyear(6.8).Earningsbeforeinterestandtax(EBIT)increasedby4.9%or€9.4millionto€200.2million(190.8).
Aftertakingintoaccounttheliquidity-basedimprovementtothefinancialresult(–€3.0millionfollowing–€3.7millioninthepreviousyear)andincometaxesof€60.3million(54.4),theGrouprecordedprofitaftertaxof€136.9million(132.7).
TheincreaseinearningscanbeattributedroughlyequallytothetworegionsofEuropeandNorthandSouthAmerica.NorthandSouthAmericarecordedthestrongestrelativeincreaseinsegmentearnings.Segmentearningsinthisregionroseby12.4%to€46.2million(41.1)andtheEBITmarginreached21.9%(22.4%).TheincreaseinEuropewas6.2%.At€102.2mil-lion(96.2),theEBITmargininthisregionreached13.3%(14.8%).Duetolowerearningsfromparticipationsofthecompaniesconsolidatedatequity,segmentearningsof€54.9mil-lion(58.1)recordedfortheAsia-Pacific,Africaregionremainedbelowthepreviousyear’slevel.TheEBITmargin(beforeincomefromparticipations)was16.8%(18.3%)inthisregion.
Earningsper(split)sharewere€1.91(1.85)perordinaryshareand€1.93(1.87)perpreferenceshare.
12
net aSSetS anD F inanCial poSit ion
Withshareholders’equityof€606.6millionandanequityratioof62.4%,theGroupisinaverystrongfinancialposition.At€86.7million,cashandcashequivalentssignificantlyexceedthefinancialliabilitiesof€22.3million.
C apital expenDitu re anD inveStm entS in Com panieS
Theinvestmentsinproperty,plantandequipmentandintangibleassetsoftheFUCHSPETROLUBGroupwere€23.8million(21.6)inthefirstninemonthsof2011.ThefocuswasthenewR&DcenterinMannheim.
Depreciationofproperty,plantandequipmentandintangibleassetswas€20.7million(16.0).
Statem ent oF C aSh FlowS
Grosscashflowinthefirstninemonthsof2011is€149.2million(127.1).Thisfigureincludesdepreciationandamortizationoflong-termassetsof€20.7million(16.0).
Primarilydrivenbysalesrevenues,butalsoduetoinventories,workingcapitalincreasedby€82.4million(52.7).Yetat€82.5million(79.4),cashflowfromoperatingactivitiesremainedatthepreviousyear’slevel.
Cashflowfrominvestingactivitieswas€17.2million(13.9),resultinginfreecashflowof€65.3million(65.5).
13
reSearC h anD Developm ent
NumerousnewproductsweredevelopedinresearchanddevelopmentdepartmentsatFUCHS’Germancompaniesduringtheperiodunderreview.ThefollowingselectionofnewproductsgivesanindicationofthewiderangeofapplicationsthatFUCHScoversasanichespecialist.
AspecialhighperformancerollingbearinggreaseforextremetemperaturesandhighloadswasdevelopedbyFUCHSLUBRITECHforuseonwindpowergenerators.UrethynXHD2alreadyfulfillsallrequirementsofawell-knownmanufacturer,whichiscurrentlyusingiton5MWsystems.
WithRENOLINUNISYNCLP220PA,anewlydevelopedhighperformanceoilhasbeenlaunchedforapplicationsinthecentralcirculationsystemsofpapermachines.Thisproductwasdevelopedonthebasisoffullysyntheticbaseoilsandmeetsthestrictestrequirementsintermsofthermalstability,corrosionprotectionandwearprotection.RENOLINUNISYNCLP220PAisusedsuccessfullyinextremelylargecirculationsystemsbywell-knownpaper,cardboardboxandhygieneproductmanufacturersandmeetsallrequirementsofboththewetanddrysectionsinpapermachines.Theproductensuresalongservicelifeandreli-ableoperationoftheproductionequipment.
WiththeWISURADSWrange,FUCHShassucceededindevelopinganewwater-basedrangeofproductswhichisideallysuitedforsteel-formingprocesses,eveninhigherdilu-tions.Initialpracticalapplicationsprovedextremelypromising.Evenheavyformingopera-tionsarepossible.Thereleasedpartsshowanearlydrysurfaceaftertheformingprocess,andinthecaseofDSW3001and4002canalsobeweldedoverorannealedwithoutpriorcleaning.Thebenefitsofnothavingtocleanpartspriortoprocessingaresignificantforthecustomer.Themineraloil-freeWISURADSWrangeisbasedonamodifiedvegetableoilester.
14
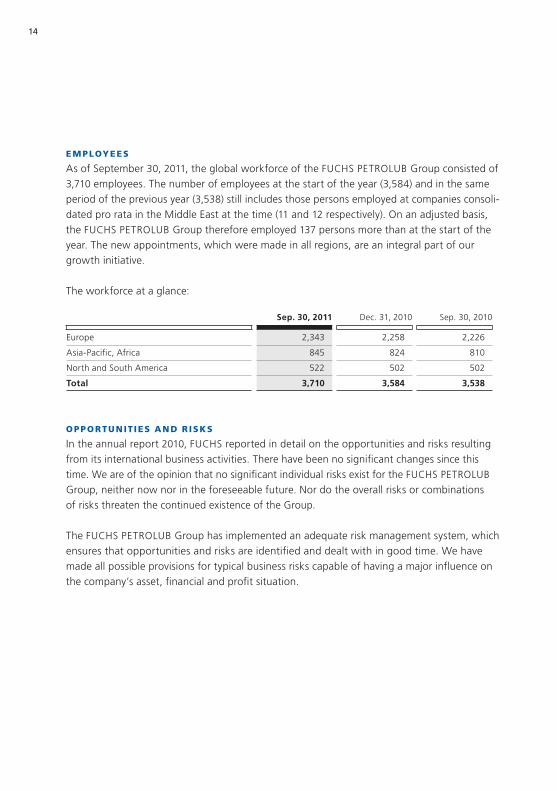
em ployeeS
AsofSeptember30,2011,theglobalworkforceoftheFUCHSPETROLUBGroupconsistedof3,710employees.Thenumberofemployeesatthestartoftheyear(3,584)andinthesameperiodofthepreviousyear(3,538)stillincludesthosepersonsemployedatcompaniesconsoli-datedprorataintheMiddleEastatthetime(11and12respectively).Onanadjustedbasis,theFUCHSPETROLUBGroupthereforeemployed137personsmorethanatthestartoftheyear.Thenewappointments,whichweremadeinallregions,areanintegralpartofourgrowthinitiative.
Theworkforceataglance:
opportunit ieS anD r iSkS
Intheannualreport2010,FUCHSreportedindetailontheopportunitiesandrisksresultingfromitsinternationalbusinessactivities.Therehavebeennosignificantchangessincethistime.WeareoftheopinionthatnosignificantindividualrisksexistfortheFUCHSPETROLUBGroup,neithernownorintheforeseeablefuture.NordotheoverallrisksorcombinationsofrisksthreatenthecontinuedexistenceoftheGroup.
TheFUCHSPETROLUBGrouphasimplementedanadequateriskmanagementsystem,whichensuresthatopportunitiesandrisksareidentifiedanddealtwithingoodtime.Wehavemadeallpossibleprovisionsfortypicalbusinessriskscapableofhavingamajorinfluenceonthecompany’sasset,financialandprofitsituation.
Sep. 30, 2011 Dec.31,2010 Sep.30,2010
Europe 2,343 2,258 2,226
Asia-Pacific,Africa 845 824 810
NorthandSouthAmerica 522 502 502
Total 3,710 3,584 3,538
15
BuSineSS tr anSaC tionS with rel ateD Com panieS anD perSonS
AsofDecember31,2010,adependentcompanyreportwaspreparedpursuanttoSection312oftheGermanStockCorporationAct(AktG)withtheconcludingdeclaration:“Inthelegaltransactionslistedinthedependentcompanyreport,andaccordingtothecircumstancesthatwereknowntouswhenthoselegaltransactionswereperformed,ourcompanyreceivedanappropriateconsiderationineachlegaltransaction.Noactionssubjecttodisclosureoccurredontheinstructionsorintheinterestofthecontrollingcompany.”KPMGAGWirtschafts-prüfungsgesellschaft,Mannheim,theindependentauditorsofFUCHSPETROLUBAG,haveauditedthisdependentcompanyreportandprovideditwithanunqualifiedauditopinion.
UptoSeptember30,2011,therewerenoindicationswhichwouldleadustoreviseourstate-mentregardingbusinesstransactionswithrelatedcompaniesandpersons.
16
outlook
Thenationaldebtcrisis,andtheassociatedriskofanotherglobalfinancialcrisis,sloweddowndevelopmentoftheglobaleconomyinthesecondhalfof2011.Atthesametime,rawmaterialcostsremainataveryhighlevel,presentingmajorchallengestocompanies.ThisalsoaffectsFUCHS.Asexpected,thegrossmarginhasfallen.Atthesametime,personnelandoverheadcostscontinuetobehigherthaninthepreviousyearduetotheongoinggrowthinitiative.
TheFUCHSPETROLUBGroupanticipatesyear-on-yearincreasesinsalesrevenuesandearn-ingsforthefinancialyear2011andcontinuestostrivetoexceedtherecordEBITof€250mil-lionachievedinthepreviousyear.However,inlightoftheeconomicslowdownitwillbedifficulttoreachthehighlevelrecordedinthepreviousyear(€59million)inthefourthquar-terof2010.
Despiteitscontinuinginvestmentsinresearchanddevelopmentandgrowthmarkets,andtakingintoaccounttheincreasedbusinessvolume,theGroupwillachieveagoodleveloffreecashflow.
FromDecember1,2011,theFUCHSPETROLUBGroupintendstotransfercompanypensionswithavalueofapproximately€50millionforaround430employeesinGermanytoexter-nalpensionproviders.Makingtheswitchfrominternallyfinancedpensionprovisionstoasolutionwithanexternalpensionproviderwillreducethebalancesheettotal.Asidefromthis,biometricriskssuchasincreasinglifeexpectancy,deathoroccupationaldisability,andinvestmentriskswillbepassedontotheexternalpensionprovider.
17
The fuchs shares
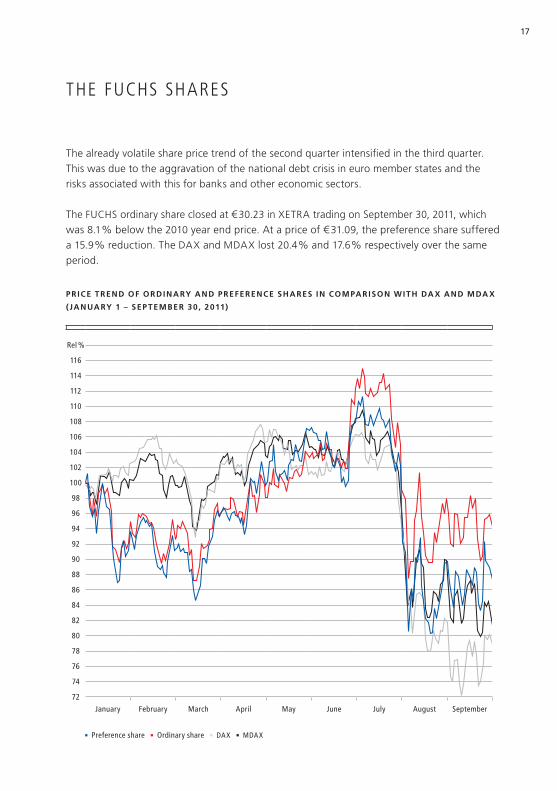
Thealreadyvolatilesharepricetrendofthesecondquarterintensifiedinthethirdquarter.Thiswasduetotheaggravationofthenationaldebtcrisisineuromemberstatesandtherisksassociatedwiththisforbanksandothereconomicsectors.
TheFUCHSordinaryshareclosedat€30.23inXETRAtradingonSeptember30,2011,whichwas8.1%belowthe2010yearendprice.Atapriceof€31.09,thepreferencesharesuffereda15.9%reduction.TheDAXandMDAXlost20.4%and17.6%respectivelyoverthesameperiod.
Pr ICE TrEnD oF orDInAry AnD PrEFErEnCE SHArES In ComPArISon wITH DA X AnD mDA X
( JAnUAry 1 – SEP TEmBEr 30 , 2011)
rel %
116
114
112
110
108
106
104
102
100
98
96
94
92
90
88
86
84
82
80
78
76
74
72
January February march april may June July august september
preference share Ordinary share DaX mDaX
financial reporT of The group
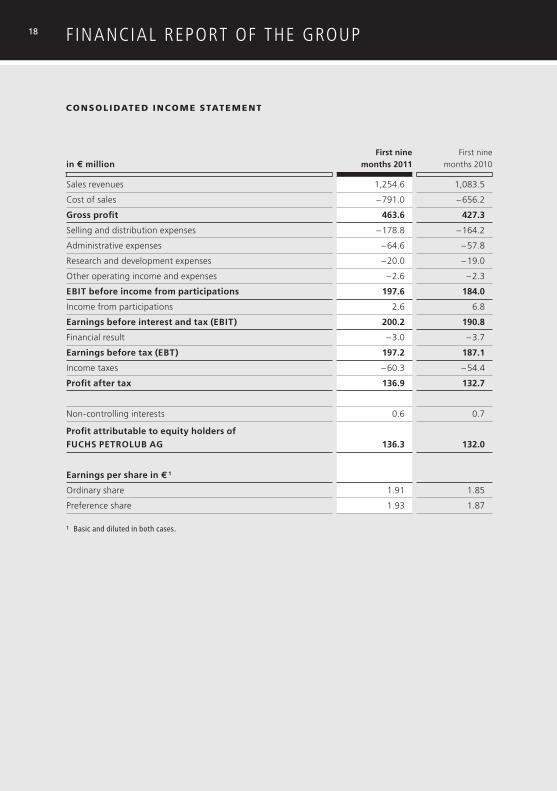
ConSoliDateD inCom e Statem ent
in € millionFirst nine
months 2011Firstnine
months2010
Salesrevenues 1,254.6 1,083.5
Costofsales –791.0 –656.2
Gross profit 463.6 427.3
Sellinganddistributionexpenses –178.8 –164.2
Administrativeexpenses –64.6 –57.8
Researchanddevelopmentexpenses –20.0 –19.0
Otheroperatingincomeandexpenses –2.6 –2.3
EBIT before income from participations 197.6 184.0
Incomefromparticipations 2.6 6.8
Earnings before interest and tax (EBIT) 200.2 190.8
Financialresult –3.0 –3.7
Earnings before tax (EBT) 197.2 187.1
Incometaxes –60.3 –54.4
Profit after tax 136.9 132.7
Non-controllinginterests 0.6 0.7
Profit attributable to equity holders of
FUCHS PETroLUB AG
136.3
132.0
Earnings per share in € 1
Ordinaryshare 1.91 1.85
Preferenceshare 1.93 1.87
1 basic and diluted in both cases.
18
1919
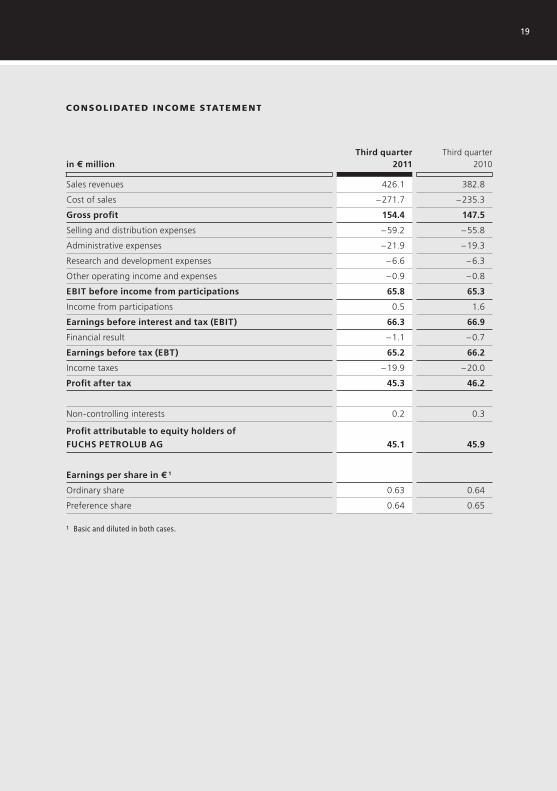
ConSoliDateD inCom e Statem ent
in € millionThird quarter
2011Thirdquarter
2010
Salesrevenues 426.1 382.8
Costofsales –271.7 –235.3
Gross profit 154.4 147.5
Sellinganddistributionexpenses –59.2 –55.8
Administrativeexpenses –21.9 –19.3
Researchanddevelopmentexpenses –6.6 –6.3
Otheroperatingincomeandexpenses –0.9 –0.8
EBIT before income from participations 65.8 65.3
Incomefromparticipations 0.5 1.6
Earnings before interest and tax (EBIT) 66.3 66.9
Financialresult –1.1 –0.7
Earnings before tax (EBT) 65.2 66.2
Incometaxes –19.9 –20.0
Profit after tax 45.3 46.2
Non-controllinginterests 0.2 0.3
Profit attributable to equity holders of
FUCHS PETroLUB AG
45.1
45.9
Earnings per share in € 1
Ordinaryshare 0.63 0.64
Preferenceshare 0.64 0.65
1 basic and diluted in both cases.
20
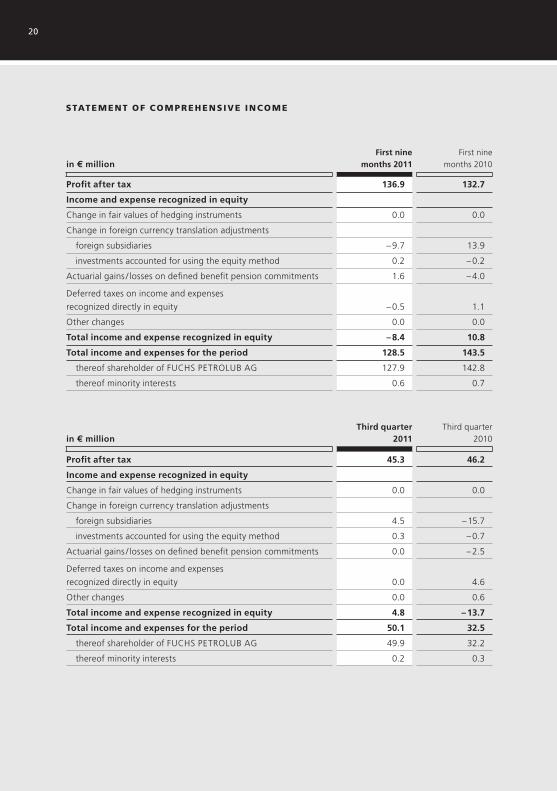
Statem ent oF Com prehenSive inCom e
in € millionFirst nine
months 2011Firstnine
months2010
Profit after tax 136.9 132.7
Income and expense recognized in equity
Changeinfairvaluesofhedginginstruments 0.0 0.0
Changeinforeigncurrencytranslationadjustments
foreignsubsidiaries –9.7 13.9
investmentsaccountedforusingtheequitymethod 0.2 –0.2
Actuarialgains/lossesondefinedbenefitpensioncommitments 1.6 –4.0
Deferredtaxesonincomeandexpenses
recognizeddirectlyinequity
–0.5
1.1
Otherchanges 0.0 0.0
Total income and expense recognized in equity – 8.4 10.8
Total income and expenses for the period 128.5 143.5
thereofshareholderofFUCHSPETROLUBAG 127.9 142.8
thereofminorityinterests 0.6 0.7
in € millionThird quarter
2011Thirdquarter
2010
Profit after tax 45.3 46.2
Income and expense recognized in equity
Changeinfairvaluesofhedginginstruments 0.0 0.0
Changeinforeigncurrencytranslationadjustments
foreignsubsidiaries 4.5 –15.7
investmentsaccountedforusingtheequitymethod 0.3 –0.7
Actuarialgains/lossesondefinedbenefitpensioncommitments 0.0 –2.5
Deferredtaxesonincomeandexpenses
recognizeddirectlyinequity
0.0
4.6
Otherchanges 0.0 0.6
Total income and expense recognized in equity 4.8 – 13.7
Total income and expenses for the period 50.1 32.5
thereofshareholderofFUCHSPETROLUBAG 49.9 32.2
thereofminorityinterests 0.2 0.3
21
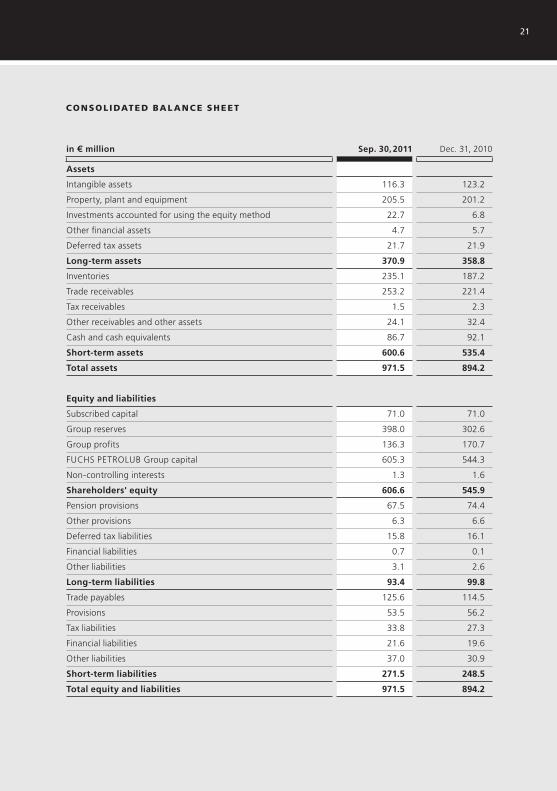
ConSoliDateD Bal anC e Sheet
in € million Sep. 30, 2011 Dec.31,2010
Assets
Intangibleassets 116.3 123.2
Property,plantandequipment 205.5 201.2
Investmentsaccountedforusingtheequitymethod 22.7 6.8
Otherfinancialassets 4.7 5.7
Deferredtaxassets 21.7 21.9
Long-term assets 370.9 358.8
Inventories 235.1 187.2
Tradereceivables 253.2 221.4
Taxreceivables 1.5 2.3
Otherreceivablesandotherassets 24.1 32.4
Cashandcashequivalents 86.7 92.1
Short-term assets 600.6 535.4
Total assets 971.5 894.2
Equity and liabilities
Subscribedcapital 71.0 71.0
Groupreserves 398.0 302.6
Groupprofits 136.3 170.7
FUCHSPETROLUBGroupcapital 605.3 544.3
Non-controllinginterests 1.3 1.6
Shareholders' equity 606.6 545.9
Pensionprovisions 67.5 74.4
Otherprovisions 6.3 6.6
Deferredtaxliabilities 15.8 16.1
Financialliabilities 0.7 0.1
Otherliabilities 3.1 2.6
Long-term liabilities 93.4 99.8
Tradepayables 125.6 114.5
Provisions 53.5 56.2
Taxliabilities 33.8 27.3
Financialliabilities 21.6 19.6
Otherliabilities 37.0 30.9
Short-term liabilities 271.5 248.5
Total equity and liabilities 971.5 894.2
22
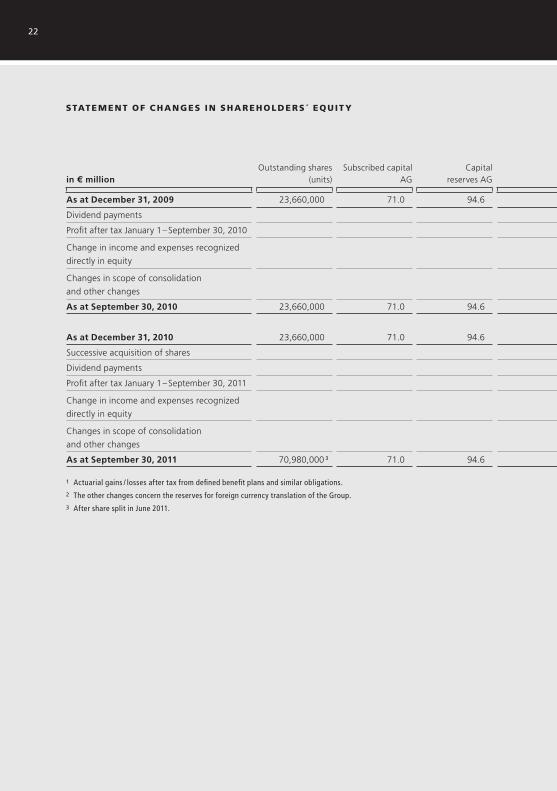
Statem ent oF C hanGeS in ShareholDerS´ eQuit y
in € millionOutstandingshares
(units)Subscribedcapital
AGCapital
reservesAG
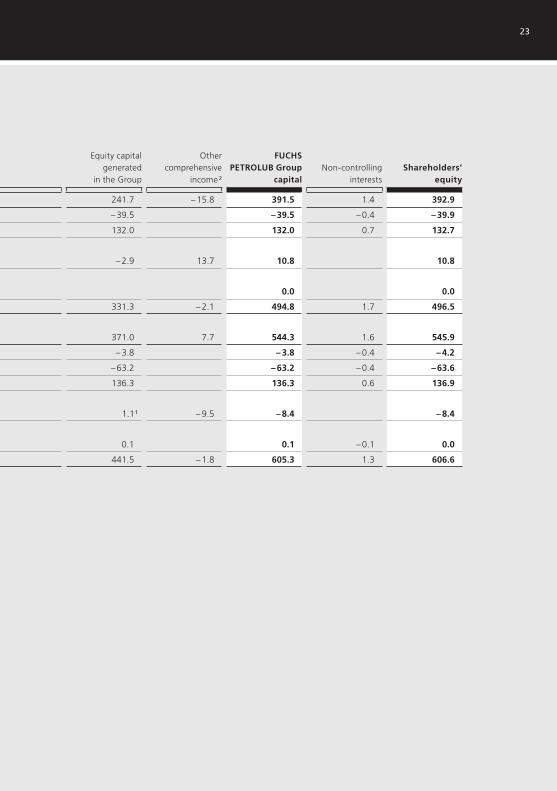
Equitycapitalgenerated
intheGroup
Othercomprehensive
income2
FUCHS PETroLUB Group
capitalNon-controlling
interestsShareholders’
equity
As at December 31, 2009 23,660,000 71.0 94.6 241.7 –15.8 391.5 1.4 392.9
Dividendpayments –39.5 – 39.5 –0.4 – 39.9
ProfitaftertaxJanuary1–September30,2010 132.0 132.0 0.7 132.7
Changeinincomeandexpensesrecognized
directlyinequity
–2.9
13.7
10.8
10.8
Changesinscopeofconsolidation
andotherchanges
0.0
0.0
As at September 30, 2010 23,660,000 71.0 94.6 331.3 –2.1 494.8 1.7 496.5
As at December 31, 2010 23,660,000 71.0 94.6 371.0 7.7 544.3 1.6 545.9
Successiveacquisitionofshares –3.8 – 3.8 –0.4 – 4.2
Dividendpayments –63.2 – 63.2 –0.4 – 63.6
ProfitaftertaxJanuary1–September30,2011 136.3 136.3 0.6 136.9
Changeinincomeandexpensesrecognized
directlyinequity
1.11
–9.5
– 8.4
– 8.4
Changesinscopeofconsolidation
andotherchanges
0.1
0.1
–0.1
0.0
As at September 30, 2011 70,980,0003 71.0 94.6 441.5 –1.8 605.3 1.3 606.6
1 actuarial gains / losses after tax from defined benefit plans and similar obligations.2 the other changes concern the reserves for foreign currency translation of the Group. 3 after share split in June 2011.
23
in € millionOutstandingshares
(units)Subscribedcapital
AGCapital
reservesAG
Equitycapitalgenerated
intheGroup
Othercomprehensive
income2
FUCHS PETroLUB Group
capitalNon-controlling
interestsShareholders’
equity
As at December 31, 2009 23,660,000 71.0 94.6 241.7 –15.8 391.5 1.4 392.9
Dividendpayments –39.5 – 39.5 –0.4 – 39.9
ProfitaftertaxJanuary1–September30,2010 132.0 132.0 0.7 132.7
Changeinincomeandexpensesrecognized
directlyinequity
–2.9
13.7
10.8
10.8
Changesinscopeofconsolidation
andotherchanges
0.0
0.0
As at September 30, 2010 23,660,000 71.0 94.6 331.3 –2.1 494.8 1.7 496.5
As at December 31, 2010 23,660,000 71.0 94.6 371.0 7.7 544.3 1.6 545.9
Successiveacquisitionofshares –3.8 – 3.8 –0.4 – 4.2
Dividendpayments –63.2 – 63.2 –0.4 – 63.6
ProfitaftertaxJanuary1–September30,2011 136.3 136.3 0.6 136.9
Changeinincomeandexpensesrecognized
directlyinequity
1.11
–9.5
– 8.4
– 8.4
Changesinscopeofconsolidation
andotherchanges
0.1
0.1
–0.1
0.0
As at September 30, 2011 70,980,0003 71.0 94.6 441.5 –1.8 605.3 1.3 606.6
1 actuarial gains / losses after tax from defined benefit plans and similar obligations.2 the other changes concern the reserves for foreign currency translation of the Group. 3 after share split in June 2011.
24
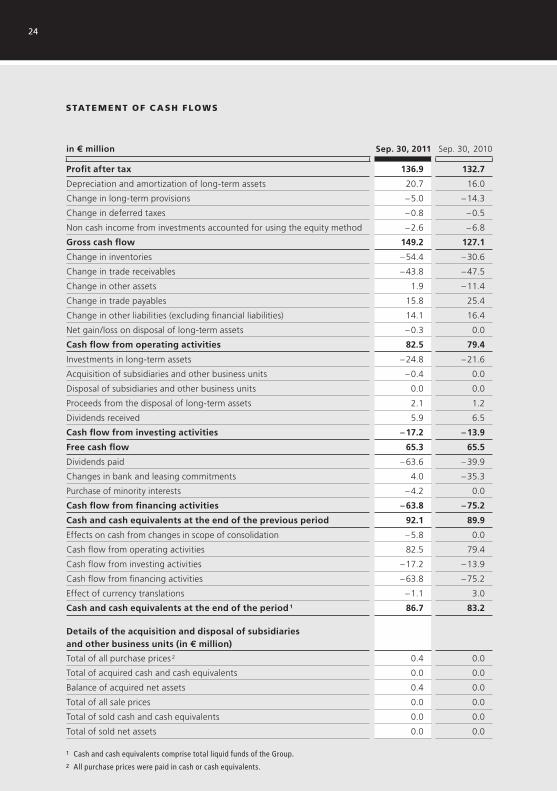
Statem ent oF C aSh FlowS
in € million Sep. 30, 2011 Sep.30,2010
Profit after tax 136.9 132.7
Depreciationandamortizationoflong-termassets 20.7 16.0
Changeinlong-termprovisions –5.0 –14.3
Changeindeferredtaxes –0.8 –0.5
Noncashincomefrominvestmentsaccountedforusingtheequitymethod –2.6 –6.8
Gross cash flow 149.2 127.1
Changeininventories –54.4 –30.6
Changeintradereceivables –43.8 –47.5
Changeinotherassets 1.9 –11.4
Changeintradepayables 15.8 25.4
Changeinotherliabilities(excludingfinancialliabilities) 14.1 16.4
Netgain/lossondisposaloflong-termassets –0.3 0.0
Cash flow from operating activities 82.5 79.4
Investmentsinlong-termassets –24.8 –21.6
Acquisitionofsubsidiariesandotherbusinessunits –0.4 0.0
Disposalofsubsidiariesandotherbusinessunits 0.0 0.0
Proceedsfromthedisposaloflong-termassets 2.1 1.2
Dividendsreceived 5.9 6.5
Cash flow from investing activities – 17.2 – 13.9
Free cash flow 65.3 65.5
Dividendspaid –63.6 –39.9
Changesinbankandleasingcommitments 4.0 –35.3
Purchaseofminorityinterests –4.2 0.0
Cash flow from financing activities – 63.8 – 75.2
Cash and cash equivalents at the end of the previous period 92.1 89.9
Effectsoncashfromchangesinscopeofconsolidation –5.8 0.0
Cashflowfromoperatingactivities 82.5 79.4
Cashflowfrominvestingactivities –17.2 –13.9
Cashflowfromfinancingactivities –63.8 –75.2
Effectofcurrencytranslations –1.1 3.0
Cash and cash equivalents at the end of the period 1 86.7 83.2 Details of the acquisition and disposal of subsidiaries and other business units (in € million)
Totalofallpurchaseprices2 0.4 0.0
Totalofacquiredcashandcashequivalents 0.0 0.0
Balanceofacquirednetassets 0.4 0.0
Totalofallsaleprices 0.0 0.0
Totalofsoldcashandcashequivalents 0.0 0.0
Totalofsoldnetassets 0.0 0.0
1 Cash and cash equivalents comprise total liquid funds of the Group.2 all purchase prices were paid in cash or cash equivalents.
25
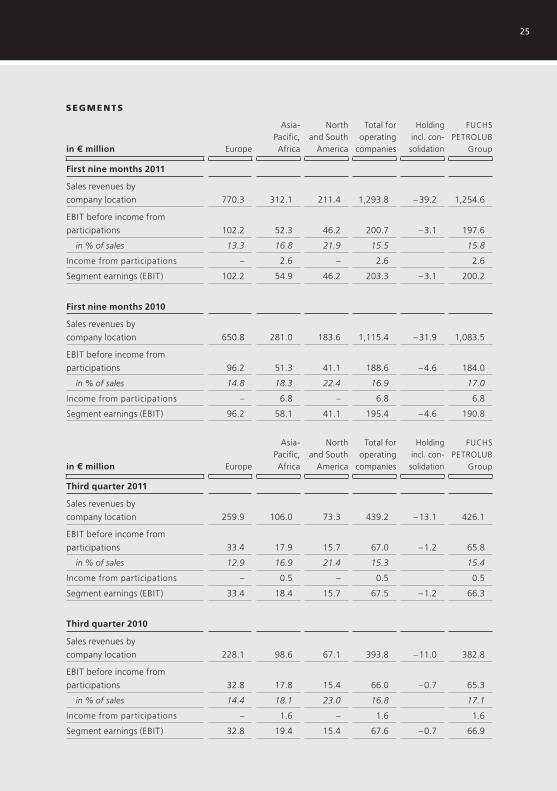
SeGm entS
in € million Europe
Asia-Pacific,Africa
NorthandSouth
America
Totalforoperating
companies
Holdingincl.con-solidation
FUCHSPETROLUB
Group
First nine months 2011
Salesrevenuesby
companylocation
770.3
312.1
211.4
1,293.8
–39.2
1,254.6
EBITbeforeincomefrom
participations
102.2
52.3
46.2
200.7
–3.1
197.6
in%ofsales 13.3 16.8 21.9 15.5 15.8
Incomefromparticipations – 2.6 – 2.6 2.6
Segmentearnings(EBIT) 102.2 54.9 46.2 203.3 –3.1 200.2
First nine months 2010
Salesrevenuesby
companylocation
650.8
281.0
183.6
1,115.4
–31.9
1,083.5
EBITbeforeincomefrom
participations
96.2
51.3
41.1
188.6
–4.6
184.0
in%ofsales 14.8 18.3 22.4 16.9 17.0
Incomefromparticipations – 6.8 – 6.8 6.8
Segmentearnings(EBIT) 96.2 58.1 41.1 195.4 –4.6 190.8
in € million Europe
Asia-Pacific,Africa
NorthandSouth
America
Totalforoperating
companies
Holdingincl.con-solidation
FUCHSPETROLUB
Group
Third quarter 2011
Salesrevenuesby
companylocation
259.9
106.0
73.3
439.2
–13.1
426.1
EBITbeforeincomefrom
participations
33.4
17.9
15.7
67.0
–1.2
65.8
in%ofsales 12.9 16.9 21.4 15.3 15.4
Incomefromparticipations – 0.5 – 0.5 0.5
Segmentearnings(EBIT) 33.4 18.4 15.7 67.5 –1.2 66.3
Third quarter 2010
Salesrevenuesby
companylocation
228.1
98.6
67.1
393.8
–11.0
382.8
EBITbeforeincomefrom
participations
32.8
17.8
15.4
66.0
–0.7
65.3
in%ofsales 14.4 18.1 23.0 16.8 17.1
Incomefromparticipations – 1.6 – 1.6 1.6
Segmentearnings(EBIT) 32.8 19.4 15.4 67.6 –0.7 66.9
26
noteS to the ConSoliDateD F inanCial Statem entS
TheinterimconsolidatedfinancialstatementsofFUCHSPETROLUBAG,Mannheim,havebeenpreparedinaccordancewiththeprinciplesoftheInternationalFinancialReportingStandards(IFRS),takingintoaccountthestandardsandinterpretationslaiddownintheguidelinesoftheInternationalAccountingStandardsBoard(IASB),London–tobeappliedwithintheEUandvalidonthedateofreport.Theaccountingandvaluationprinciples,togetherwiththecalculationmethods,remainedunchangedfromtheconsolidatedfinancialstatementsfor2010;wethereforerefertothenotestotheconsolidatedfinancialstate-mentsmadethere.
Theinterimconsolidatedfinancialstatementsandtheinterimmanagementreportwerenotsubjecttoexaminationbytheauditor.
Changes to the scope of consolidation and expansion of the income statement
structure
WitheffectfromJanuary1,2011,twocompaniesintheAsia-Pacific,Africaregionthatwerepreviouslyconsolidatedonaproratabasisarenowaccountedforusingtheequitymethod.ThecomparabilityoftheGroup’sbalancesheetandincomestatementtothepreviousyearisnotsignificantlyaffectedbythischange.Comparedtothe2010consolidatedfinancialstate-ments,thisleadstoa€3.0millionreductioninthebalancesheettotal.Thesalesrevenuesofthesecompanieswere€29.4millioninthefirstninemonthsof2010.
OnecompanyintheAsia-Pacific,Africaregionwasliquidatedanddeconsolidatedinthethirdquarterof2011.Inadditiontothis,onenewcompanywasfoundedintheAsia-Pacific,Africaregion.Thisnon-operativecompanywillassumethefunctionofaregionalmanagementcenter.Neitherofthesetwoconsolidationmeasureshadanysignificanteffectsonthenetassets,financialpositionorresultsofoperationsoftheFUCHSPETROLUBGroup.Furthermore,theout-standing50%ofsharesinasmalljointventureintheAsia-Pacific,Africaregionwereacquired.TheFUCHSPETROLUBGroupthereforenowholdsallsharesinthiscompany.
27
Atthesametime,disclosuresintheincomestatementwereamendedinsuchawaythatearningsbeforeinterest,taxandincomefromparticipationsisstatedinadditiontotheGroup’searningsbeforeinterestandtax(EBIT).WhencomparingthisnewKPIinrelationtosalesrevenues,onlythoseamountsgeneratedfromthefullyorproportionatelyconsolidatedcompaniesaretakenintoaccountintherelativevalue,bothforincomeandsalesrevenues.EBITalsocontainsincomefromparticipations.ThesalesrevenuesderivedfromincomefromparticipationsarenotincludedinGroupsalesrevenues.
Foundation of FUCHS SmÖrJmEDEL SVErIGE AB
Inthefirsthalfof2011,FUCHSPETROLUBAGfoundedasubsidiaryinSweden,whichwillworkintensivelyontappingtheScandinavianmarket.Theintentionistoincludethiscompanyintheconsolidatedfinancialstatementsfromthefinancialyear2012onward.
Acquisition of non-controlling interests
TheacquisitionofsharesincompanieswhicharealreadycontrolledbyFUCHSPETROLUBAGaretreatedasequitytransactions.Thenon-controllinginterests(15%)inWISURAMINERALÖLWERKGOLDGRABE&SCHEFTGMBH&CO.wereacquiredbyFUCHSPETROLUBAGinApril2011.Thedifferencebetweenthepurchasepriceandtheproportionalnetequityof€3.8millionthatresultedfromthistransactionwasoffsetagainstretainedearnings.
28
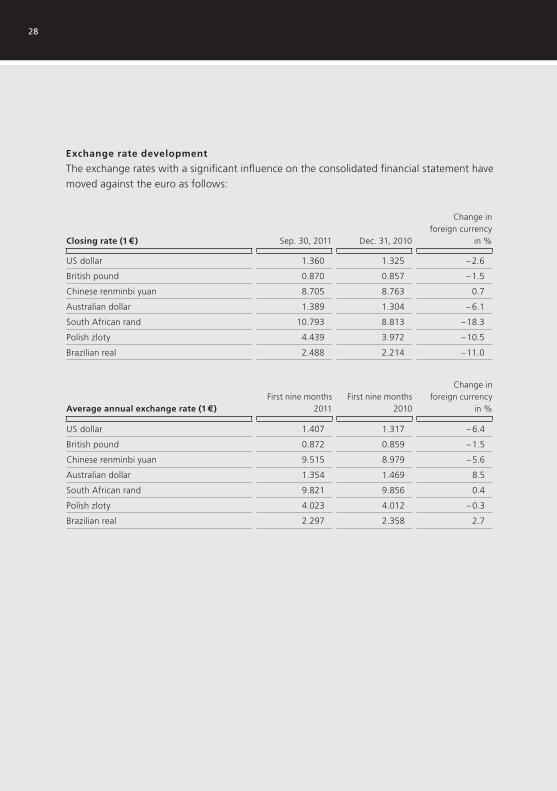
Exchange rate development
Theexchangerateswithasignificantinfluenceontheconsolidatedfinancialstatementhavemovedagainsttheeuroasfollows:
Closing rate (1 €) Sep.30,2011 Dec.31,2010
Changeinforeigncurrency
in%
USdollar 1.360 1.325 –2.6
Britishpound 0.870 0.857 –1.5
Chineserenminbiyuan 8.705 8.763 0.7
Australiandollar 1.389 1.304 –6.1
SouthAfricanrand 10.793 8.813 –18.3
Polishzloty 4.439 3.972 –10.5
Brazilianreal 2.488 2.214 –11.0
Average annual exchange rate (1 €)Firstninemonths
2011Firstninemonths
2010
Changeinforeigncurrency
in%
USdollar 1.407 1.317 –6.4
Britishpound 0.872 0.859 –1.5
Chineserenminbiyuan 9.515 8.979 –5.6
Australiandollar 1.354 1.469 8.5
SouthAfricanrand 9.821 9.856 0.4
Polishzloty 4.023 4.012 –0.3
Brazilianreal 2.297 2.358 2.7
29
Events after the balance sheet date
WitheffectfromDecember1,2011,theFUCHSPETROLUBGroupintendstotransfercom-panypensionswithavalueofapproximately€50millionforaround430employeesinGermanytoexternalpensionproviders(pensionfunds/relieffund).Asidefromreducingthebalancesheettotal,thistransferwillofferimprovedinternationalcomparabilityoftheconsolidatedfinancialstatements.
Mannheim,November2011
FUCHSPETROLUBAG
TheExecutiveBoard
30
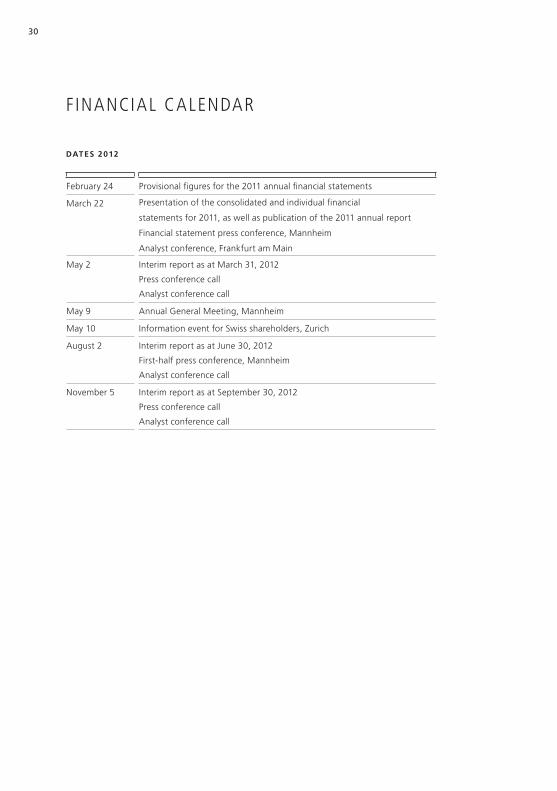
financial calendar
February24 Provisionalfiguresforthe2011annualfinancialstatements
March22 Presentationoftheconsolidatedandindividualfinancial
statementsfor2011,aswellaspublicationofthe2011annualreport
Financialstatementpressconference,Mannheim
Analystconference,FrankfurtamMain
May2 InterimreportasatMarch31,2012
Pressconferencecall
Analystconferencecall
May9 AnnualGeneralMeeting,Mannheim
May10 InformationeventforSwissshareholders,Zurich
August2 InterimreportasatJune30,2012
First-halfpressconference,Mannheim
Analystconferencecall
November5 InterimreportasatSeptember30,2012
Pressconferencecall
Analystconferencecall
DATES 2012
31
ThisinterimreportcontainsstatementsaboutfuturedevelopmentsthatarebasedonassumptionsandestimatesmadebythemanagementofFUCHSPETROLUBAG.Evenifthemanagementisoftheopinionthattheseassumptionsandestimatesareaccurate,futureactualdevelopmentsandfutureactualresultsmaydiffersignificantlyfromtheseassumptionsandestimatesduetoavarietyoffactors.Thesefactorscanincludechangesintheoveralleconomicclimate,changestoexchangeratesandinterestrates,andchangesinthelubricantsindustry.FUCHSPETROLUBAGprovidesnoguaranteethatfuturedevelopmentsandtheresultsactuallyachievedinfuturewillbeinlinewiththeassumptionsandestimatessetoutinthisinterimreportandassumesnoliabilityforsuch.
discl aimer
This interim report is also available in German.Both language versions are accessible via theinternet.
FUCHS PETROLUB AG
Investor Relations Friesenheimer Straße 17
68169 Mannheim, Germany Telephone 0049-(0)621-3802-1105
Fax 0049-(0)621-3802-7274
www.fuchs-oil.com E-Mail: ir @fuchs-oil.de