Embed Size (px)
Citation preview
Q3 FY’17
Industry Update &
Key Performance Highlights
14th February, 2017
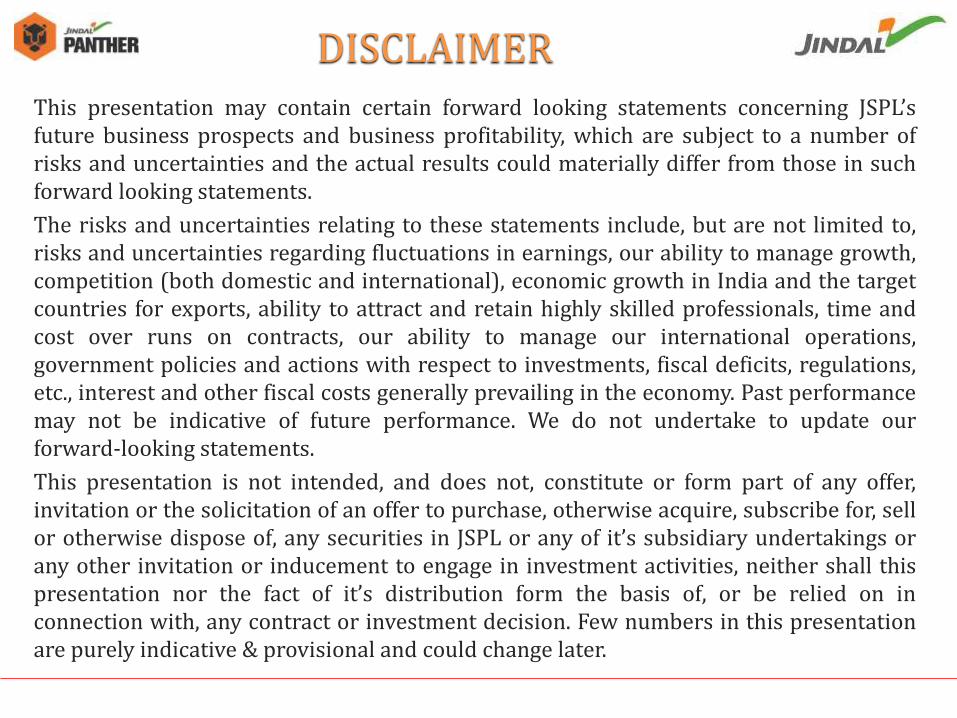
DISCLAIMER This presentation may contain certain forward looking statements concerning JSPL’s future business prospects and business profitability, which are subject to a number of risks and uncertainties and the actual results could materially differ from those in such forward looking statements.
The risks and uncertainties relating to these statements include, but are not limited to, risks and uncertainties regarding fluctuations in earnings, our ability to manage growth, competition (both domestic and international), economic growth in India and the target countries for exports, ability to attract and retain highly skilled professionals, time and cost over runs on contracts, our ability to manage our international operations, government policies and actions with respect to investments, fiscal deficits, regulations, etc., interest and other fiscal costs generally prevailing in the economy. Past performance may not be indicative of future performance. We do not undertake to update our forward-looking statements.
This presentation is not intended, and does not, constitute or form part of any offer, invitation or the solicitation of an offer to purchase, otherwise acquire, subscribe for, sell or otherwise dispose of, any securities in JSPL or any of it’s subsidiary undertakings or any other invitation or inducement to engage in investment activities, neither shall this presentation nor the fact of it’s distribution form the basis of, or be relied on in connection with, any contract or investment decision. Few numbers in this presentation are purely indicative & provisional and could change later.
OUTLOOK
Q3 FY’17
INDUSTRY DEVELOPMENTS
BRIEF BACKGROUND FINANCIAL PERFORMANCE
OPERATIONAL PERFORMANCE
PRESENTATION OUTLINE
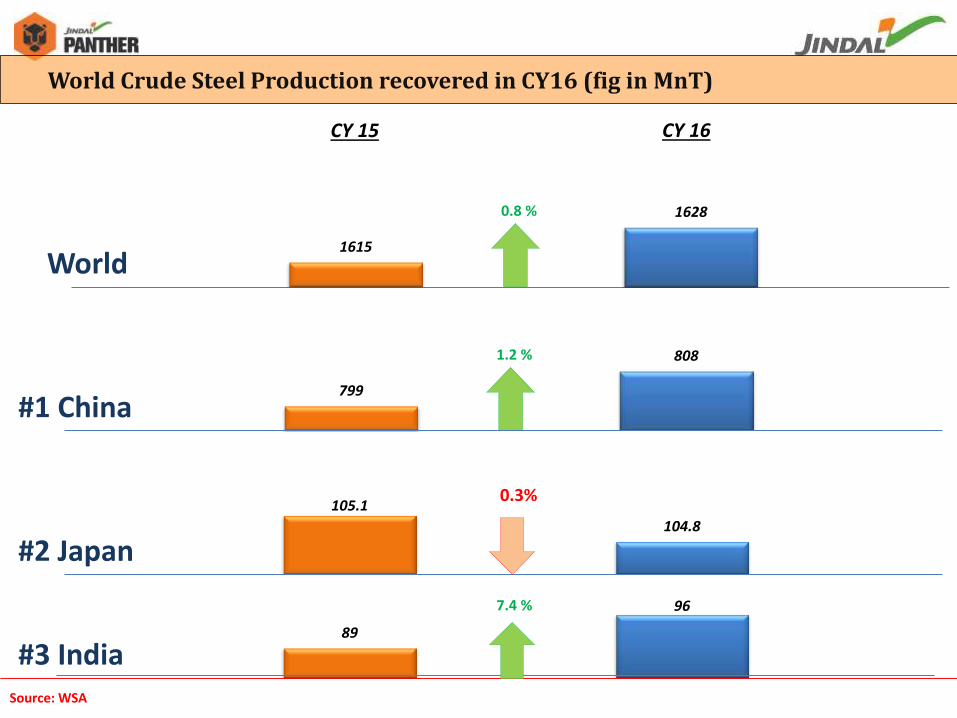
799
808 1.2 %
105.1
104.8
89
96
World Crude Steel Production recovered in CY16 (fig in MnT)
#1 China
#2 Japan
#3 India Source: WSA
CY 15 CY 16
0.3%
7.4 %
World 1615
1628 0.8 %
2.9
1.2
5
-0.1
1.4 1.3
4.7
0.8
-5.6
-3.1
-1.1
3.9 5.2
-8
-6
-4
-2
0
2
4
6
Min
ing
Sec
Gro
wth
(y-
o-y
, %
)
-1.26 -1.5
2.0
0.1
-1.35
1.1
2.1
-2.4
-0.7
0.7
-1.9
5.7 5.3
-3
-2
-1
0
1
2
3
4
5
6
7
Min
ing
Sec
Gro
wth
(y-
o-y
, %
)
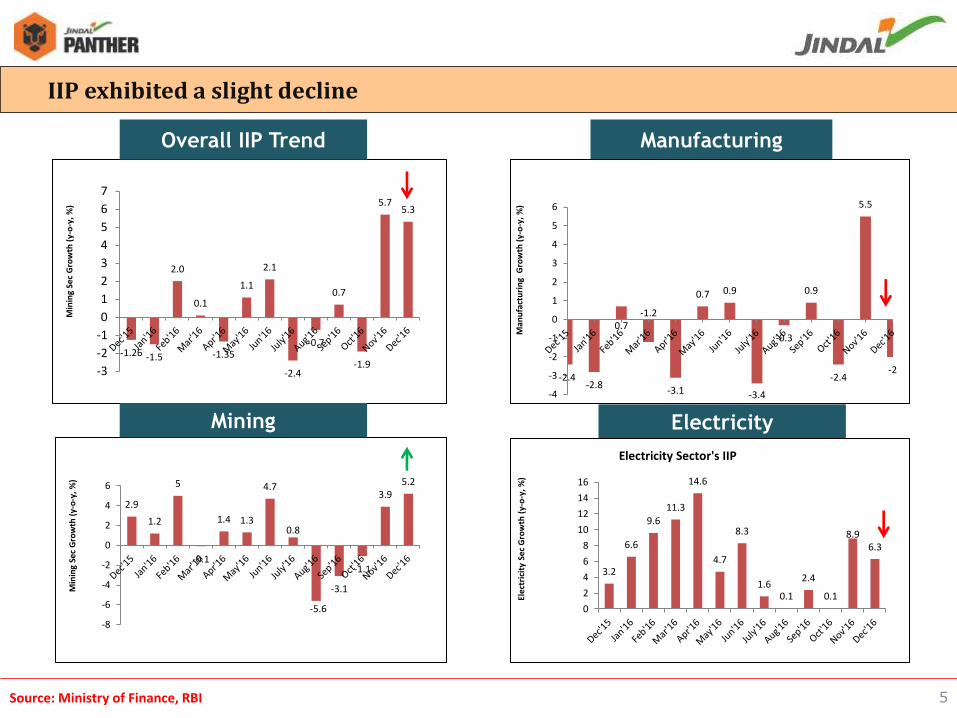
IIP exhibited a slight decline
Overall IIP Trend
Manufacturing
Mining
5
Electricity
-2.4 -2.8
0.7 -1.2
-3.1
0.7 0.9
-3.4
-0.3
0.9
-2.4
5.5
-2
-4
-3
-2
-1
0
1
2
3
4
5
6
Man
ufa
ctu
rin
g G
row
th (
y-o
-y,
%)
3.2
6.6
9.6
11.3
14.6
4.7
8.3
1.6 0.1
2.4
0.1
8.9 6.3
0
2
4
6
8
10
12
14
16
Elec
tric
ity
Sec
Gro
wth
(y-
o-y
, %)
Electricity Sector's IIP
Source: Ministry of Finance, RBI
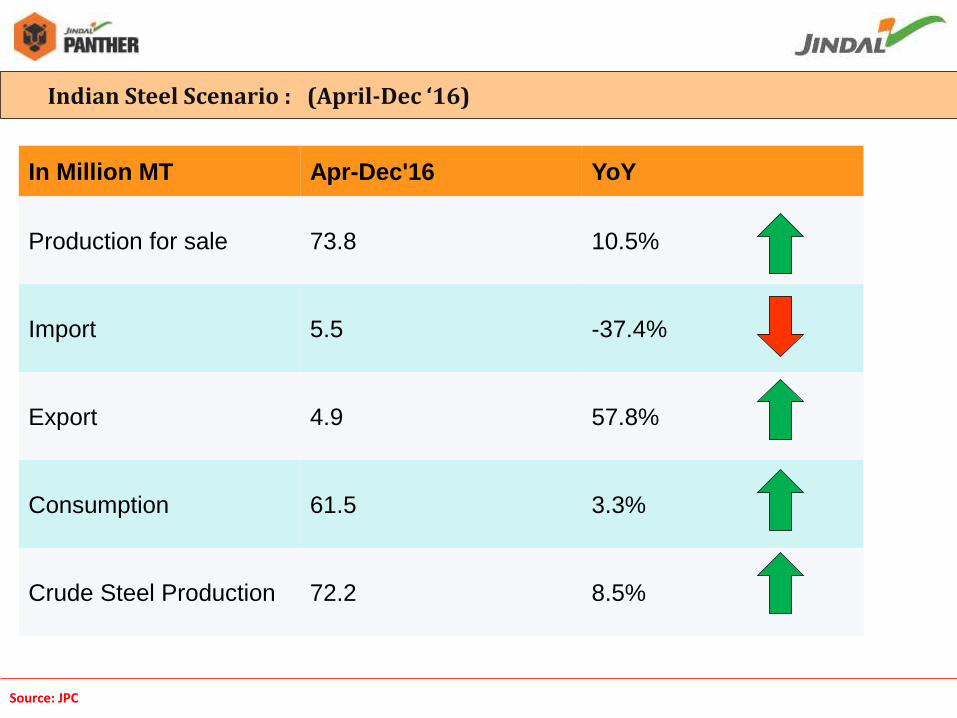
Indian Steel Scenario : (April-Dec ‘16)
In Million MT Apr-Dec'16 YoY
Production for sale 73.8 10.5%
Import 5.5 -37.4%
Export 4.9 57.8%
Consumption 61.5 3.3%
Crude Steel Production 72.2 8.5%
Source: JPC
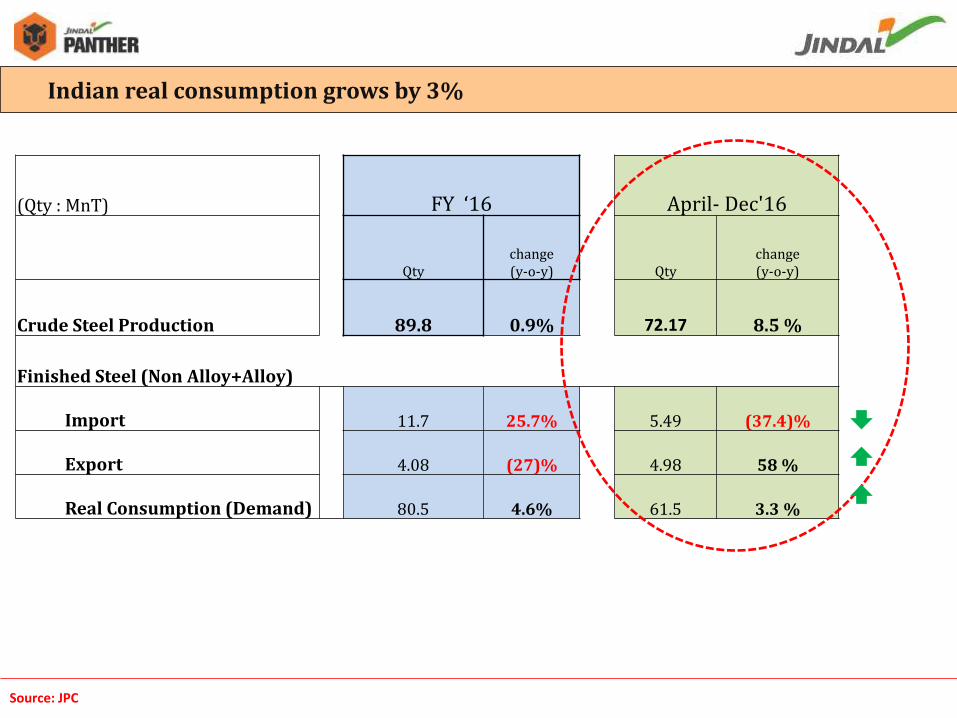
Indian real consumption grows by 3%
(Qty : MnT) FY ‘16 April- Dec'16
Qty change (y-o-y) Qty
change (y-o-y)
Crude Steel Production 89.8 0.9% 72.17 8.5 %
Finished Steel (Non Alloy+Alloy)
Import 11.7 25.7% 5.49 (37.4)%
Export 4.08 (27)% 4.98 58 %
Real Consumption (Demand) 80.5 4.6% 61.5 3.3 %
Source: JPC
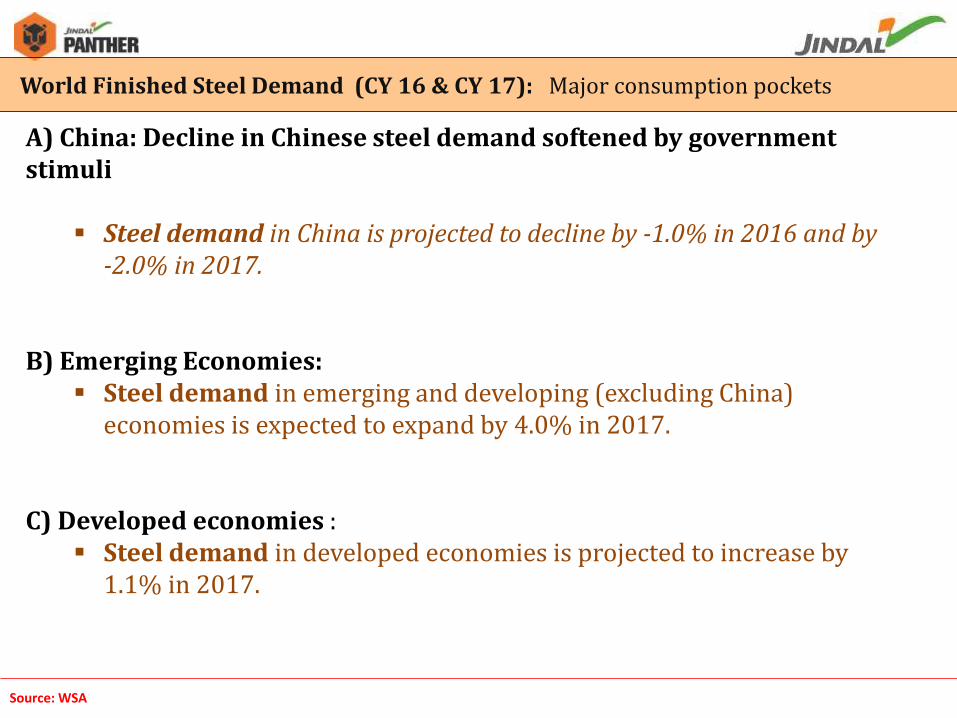
A) China: Decline in Chinese steel demand softened by government stimuli
Steel demand in China is projected to decline by -1.0% in 2016 and by -2.0% in 2017.
B) Emerging Economies:
Steel demand in emerging and developing (excluding China) economies is expected to expand by 4.0% in 2017.
C) Developed economies :
Steel demand in developed economies is projected to increase by 1.1% in 2017.
World Finished Steel Demand (CY 16 & CY 17): Major consumption pockets
Source: WSA

OUTLOOK
Q3 FY’17
INDUSTRY DEVELOPMENTS
BRIEF BACKGROUND FINANCIAL PERFORMANCE
OPERATIONAL PERFORMANCE
PRESENTATION OUTLINE
INDUSTRY UPDATE STEEL SECTOR
23300
19550
21550 21550 21800
25100 24700
24000 23800
12300
11200
13250 13500
13188 13575
15100
14150 14150
17200 17000
18200
17500
18675 19025
19700
18500 18900
April Aug Sept Oct Nov Dec Jan last week Latest
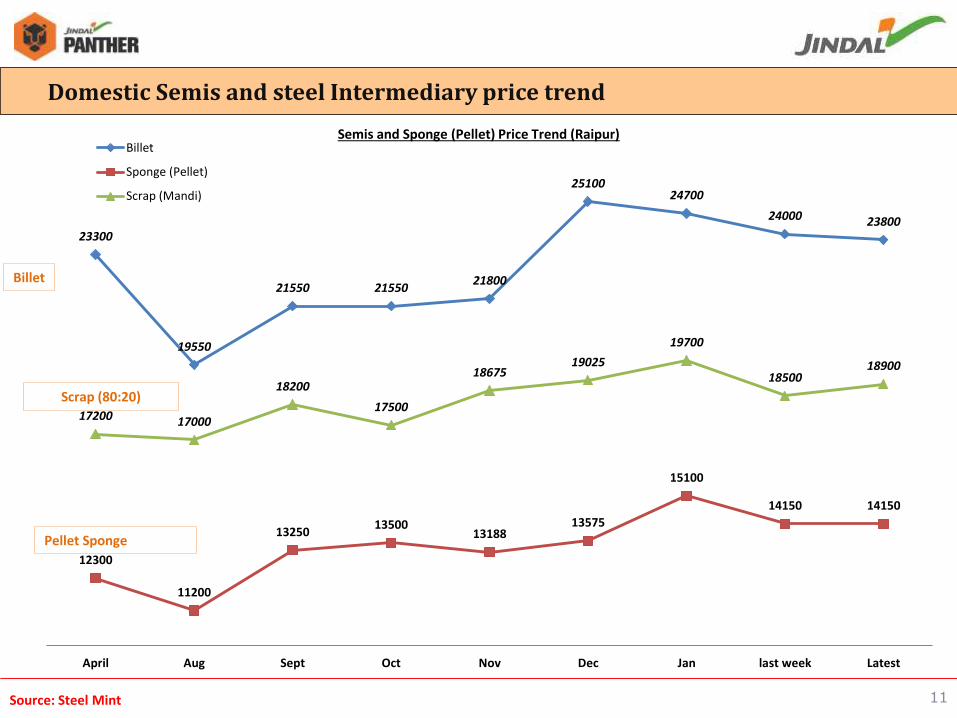
Semis and Sponge (Pellet) Price Trend (Raipur) Billet
Sponge (Pellet)
Scrap (Mandi)
Scrap (80:20)
Pellet Sponge
Domestic Semis and steel Intermediary price trend
11
Billet
Source: Steel Mint
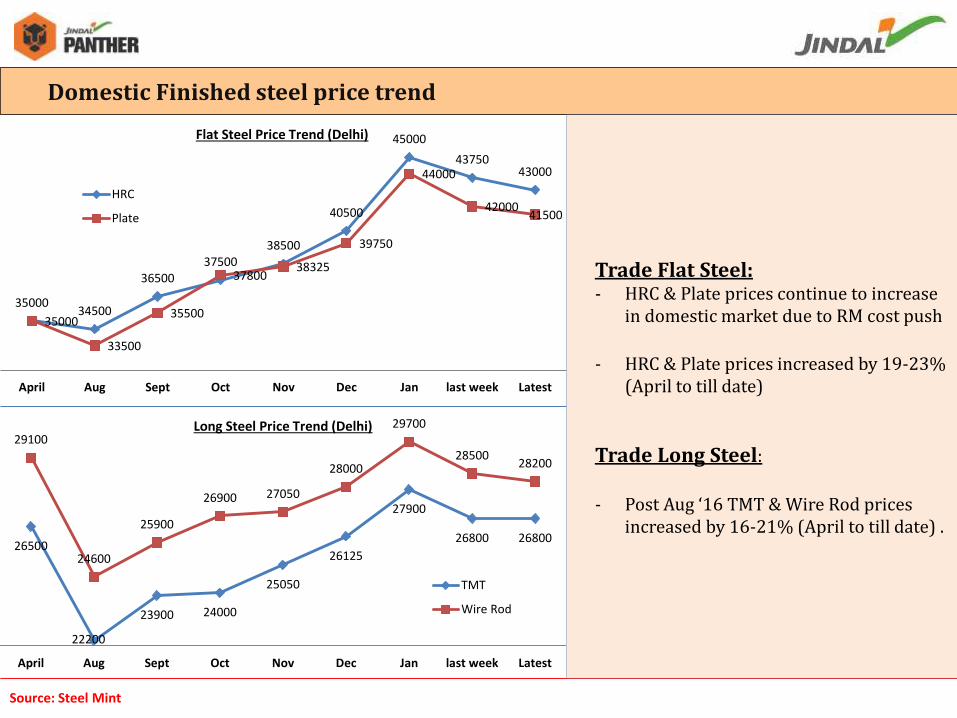
Domestic Finished steel price trend
Trade Flat Steel: - HRC & Plate prices continue to increase
in domestic market due to RM cost push
- HRC & Plate prices increased by 19-23% (April to till date)
Trade Long Steel:
- Post Aug ‘16 TMT & Wire Rod prices increased by 16-21% (April to till date) .
35000 34500
36500 37500
38500
40500
45000
43750 43000
35000
33500
35500
37800 38325
39750
44000
42000 41500
April Aug Sept Oct Nov Dec Jan last week Latest
Flat Steel Price Trend (Delhi)
HRC
Plate
26500
22200
23900 24000
25050
26125
27900
26800 26800
29100
24600
25900
26900 27050
28000
29700
28500 28200
April Aug Sept Oct Nov Dec Jan last week Latest
Long Steel Price Trend (Delhi)
TMT
Wire Rod
Source: Steel Mint
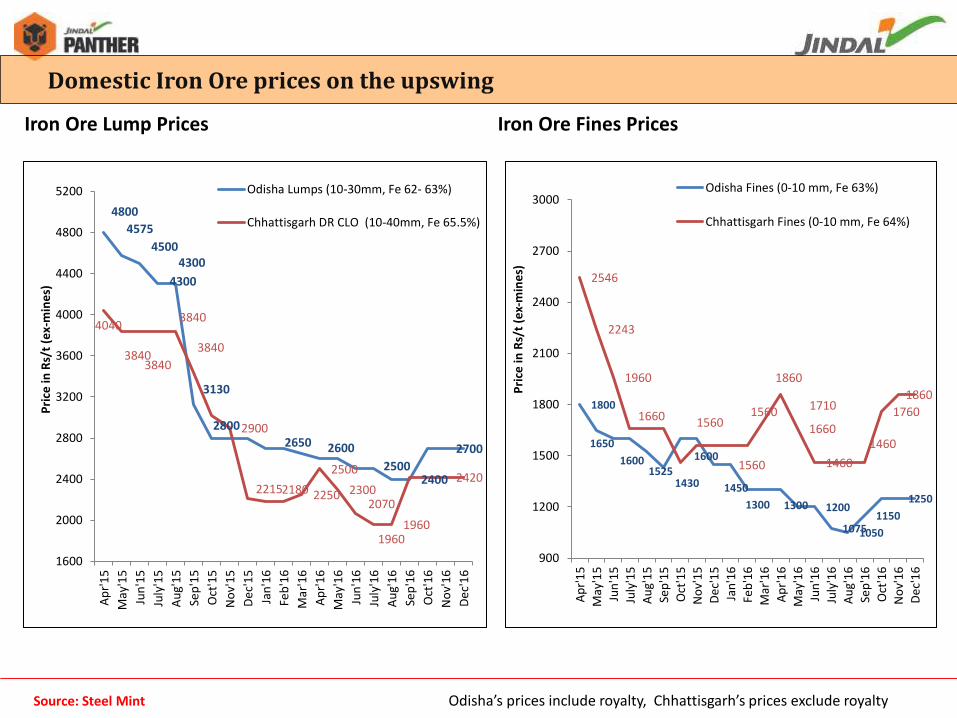
Domestic Iron Ore prices on the upswing
Iron Ore Lump Prices Iron Ore Fines Prices
Source: Steel Mint Odisha’s prices include royalty, Chhattisgarh’s prices exclude royalty
1800
1650
1600 1525
1430
1600
1450
1300 1300 1200
1075 1050
1150
1250
2546
2243
1960
1660 1560
1560
1560 1710
1860
1660
1460
1460
1760
1860
900
1200
1500
1800
2100
2400
2700
3000
Ap
r'1
5
May
'15
Jun
'15
July
'15
Au
g'1
5
Sep
'15
Oct
'15
No
v'1
5
De
c'1
5
Jan
'16
Feb
'16
Mar
'16
Ap
r'1
6
May
'16
Jun
'16
July
'16
Au
g'1
6
Sep
'16
Oct
'16
No
v'1
6
De
c'1
6
Pri
ce in
Rs/
t (e
x-m
ine
s)
Odisha Fines (0-10 mm, Fe 63%)
Chhattisgarh Fines (0-10 mm, Fe 64%)4800
4575
4500
4300
4300
3130
2800
2650 2600
2500 2400
2700
4040
3840 3840
3840
3840
2900
2215 2180 2250
2500
2300 2070
1960 1960
2420
1600
2000
2400
2800
3200
3600
4000
4400
4800
5200
Ap
r'1
5
May
'15
Jun
'15
July
'15
Au
g'1
5
Sep
'15
Oct
'15
No
v'1
5
De
c'1
5
Jan
'16
Feb
'16
Mar
'16
Ap
r'1
6
May
'16
Jun
'16
July
'16
Au
g'1
6
Sep
'16
Oct
'16
No
v'1
6
De
c'1
6
Pri
ce in
Rs/
t (e
x-m
ine
s)
Odisha Lumps (10-30mm, Fe 62- 63%)
Chhattisgarh DR CLO (10-40mm, Fe 65.5%)
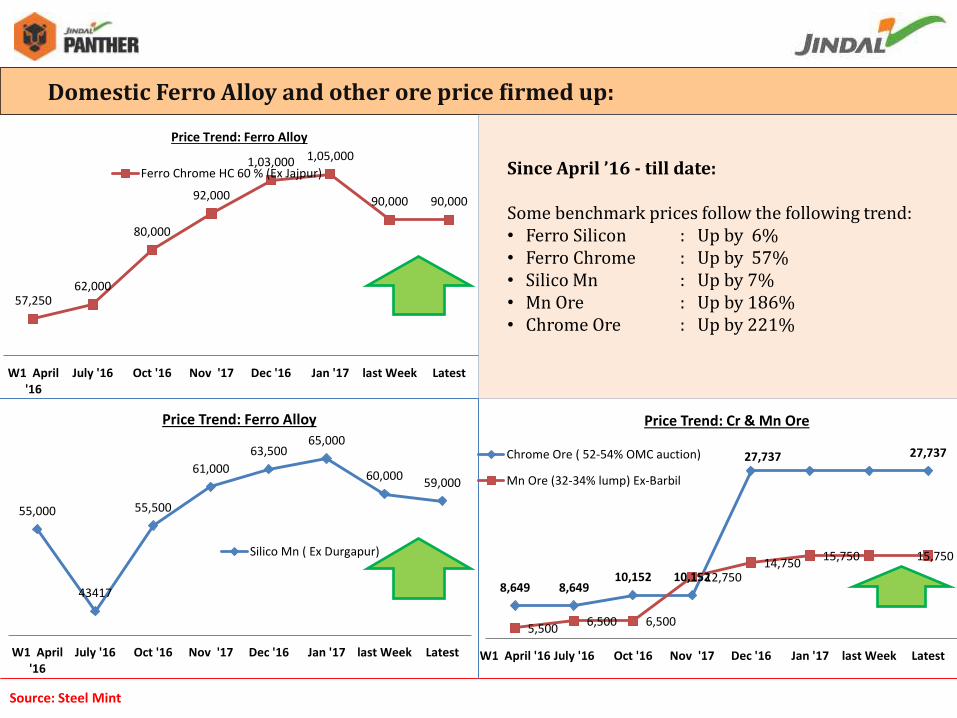
Domestic Ferro Alloy and other ore price firmed up:
Since April ’16 - till date: Some benchmark prices follow the following trend: • Ferro Silicon : Up by 6% • Ferro Chrome : Up by 57% • Silico Mn : Up by 7% • Mn Ore : Up by 186% • Chrome Ore : Up by 221%
57,250 62,000
80,000
92,000
1,03,000 1,05,000
90,000 90,000
W1 April'16
July '16 Oct '16 Nov '17 Dec '16 Jan '17 last Week Latest
Price Trend: Ferro Alloy
Ferro Chrome HC 60 % (Ex Jajpur)
55,000
43417
55,500
61,000
63,500 65,000
60,000 59,000
W1 April'16
July '16 Oct '16 Nov '17 Dec '16 Jan '17 last Week Latest
Price Trend: Ferro Alloy
Silico Mn ( Ex Durgapur)
8,649 8,649 10,152 10,152
27,737 27,737
5,500 6,500 6,500
12,750 14,750
15,750 15,750
W1 April '16 July '16 Oct '16 Nov '17 Dec '16 Jan '17 last Week Latest
Price Trend: Cr & Mn Ore
Chrome Ore ( 52-54% OMC auction)
Mn Ore (32-34% lump) Ex-Barbil
Source: Steel Mint
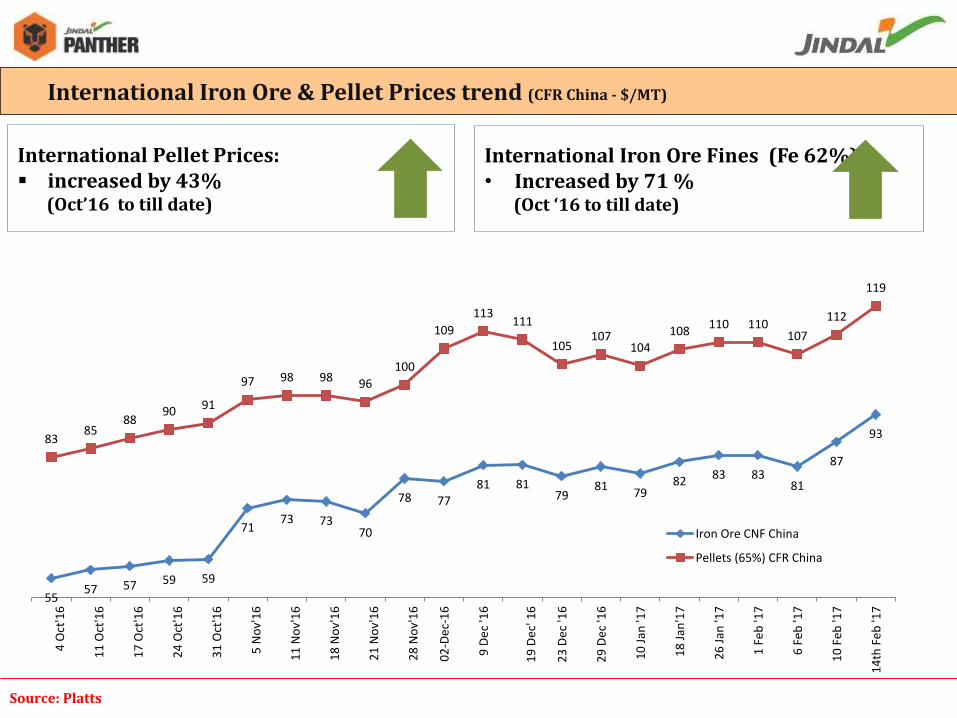
International Iron Ore & Pellet Prices trend (CFR China - $/MT)
International Pellet Prices: increased by 43% (Oct’16 to till date)
International Iron Ore Fines (Fe 62%) • Increased by 71 % (Oct ‘16 to till date)
93
87
81 83 83 82
79 81
79 81 81
77 78
70 73 73
71
59 59 57 57 55
119
112
107 110 110
108 104
107 105
111 113
109
100
96 98 98 97
91 90 88
85 83
14
th F
eb
'17
10
Feb
'17
6 F
eb
'17
1 F
eb
'17
26
Jan
'17
18
Jan
'17
10
Jan
'17
29
Dec
'16
23
Dec
'16
19
Dec
' 16
9 D
ec
'16
02
-De
c-1
6
28
No
v'1
6
21
No
v'1
6
18
No
v'1
6
11
No
v'1
6
5 N
ov'
16
31
Oct
'16
24
Oct
'16
17
Oct
'16
11
Oct
'16
4 O
ct'1
6
Iron Ore CNF China
Pellets (65%) CFR China
Source: Platts
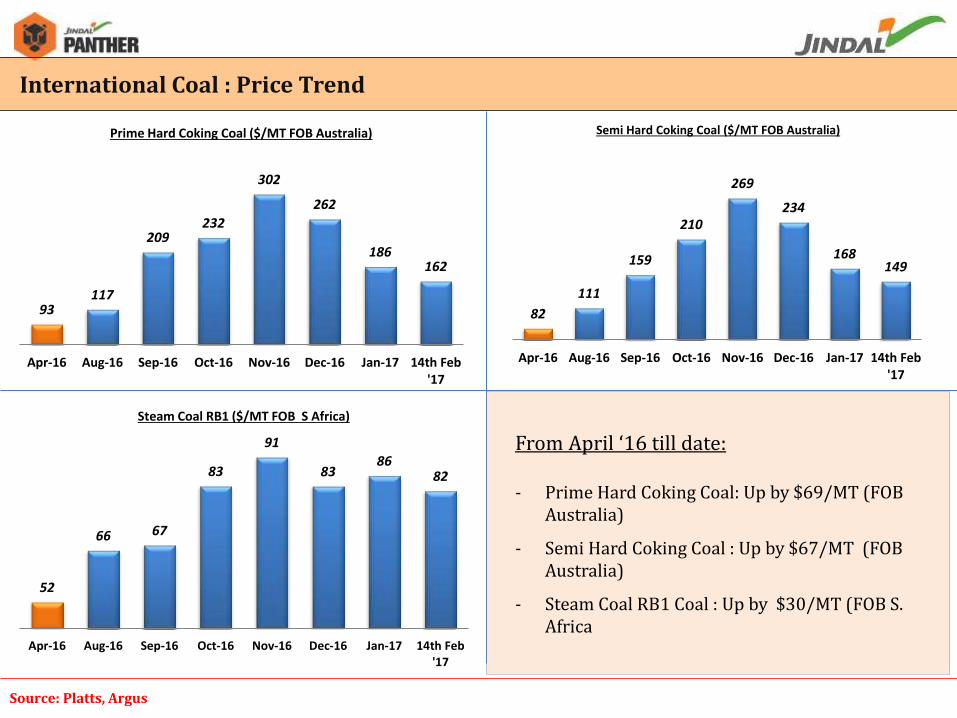
International Coal : Price Trend
From April ‘16 till date: - Prime Hard Coking Coal: Up by $69/MT (FOB
Australia)
- Semi Hard Coking Coal : Up by $67/MT (FOB Australia)
- Steam Coal RB1 Coal : Up by $30/MT (FOB S. Africa
93 117
209 232
302
262
186 162
Apr-16 Aug-16 Sep-16 Oct-16 Nov-16 Dec-16 Jan-17 14th Feb'17
Prime Hard Coking Coal ($/MT FOB Australia)
82
111
159
210
269
234
168 149
Apr-16 Aug-16 Sep-16 Oct-16 Nov-16 Dec-16 Jan-17 14th Feb'17
Semi Hard Coking Coal ($/MT FOB Australia)
52
66 67
83
91
83 86
82
Apr-16 Aug-16 Sep-16 Oct-16 Nov-16 Dec-16 Jan-17 14th Feb'17
Steam Coal RB1 ($/MT FOB S Africa)
Source: Platts, Argus
INDUSTRY UPDATE POWER SECTOR
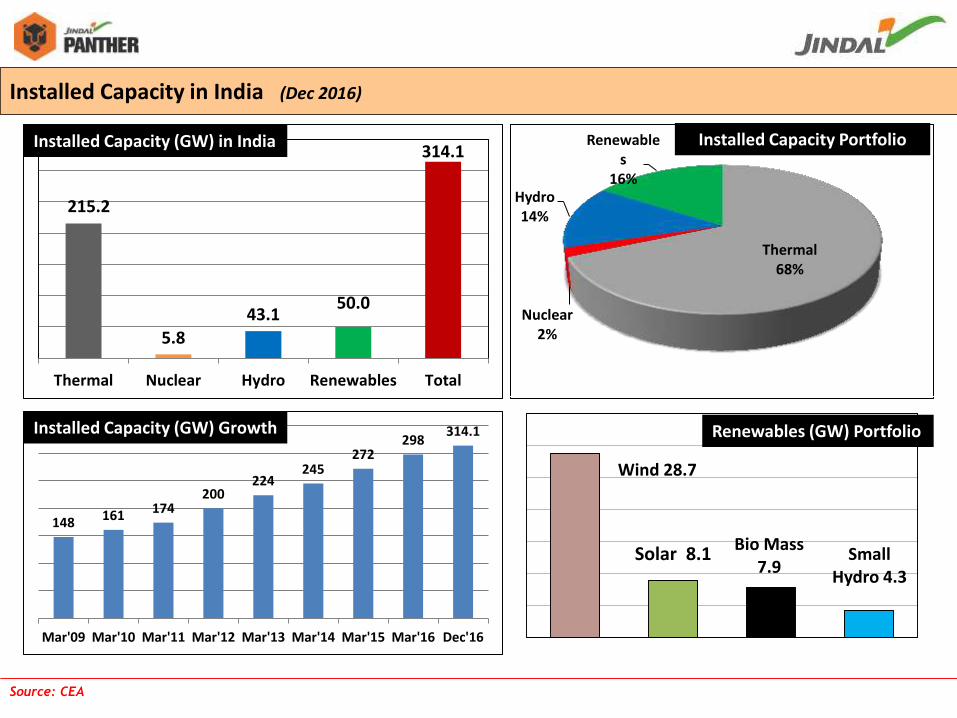
Source: CEA
215.2
5.8 43.1
50.0
314.1
Thermal Nuclear Hydro Renewables Total
Installed Capacity (GW) in India
Thermal 68%
Nuclear 2%
Hydro 14%
Renewables
16%
Wind 28.7
Solar 8.1 Bio Mass
7.9 Small
Hydro 4.3
Renewables (GW) Portfolio
Installed Capacity Portfolio
Installed Capacity in India (Dec 2016)
148 161 174 200
224 245
272 298
314.1
Mar'09 Mar'10 Mar'11 Mar'12 Mar'13 Mar'14 Mar'15 Mar'16 Dec'16
Installed Capacity (GW) Growth
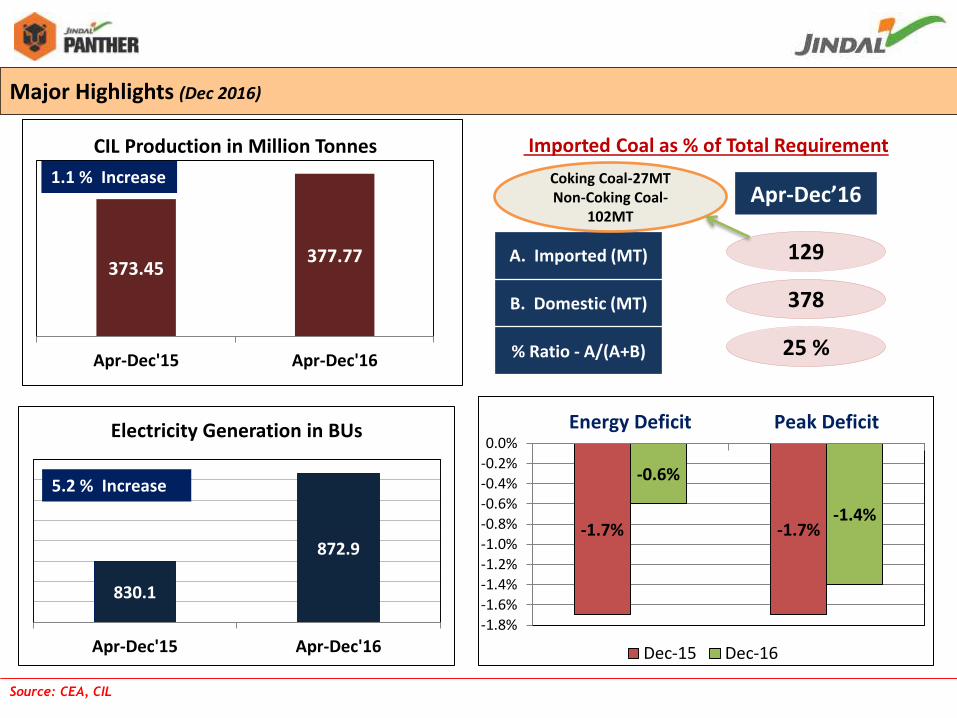
830.1
872.9
Apr-Dec'15 Apr-Dec'16
Electricity Generation in BUs
5.2 % Increase
-1.7% -1.7%
-0.6%
-1.4%
-1.8%
-1.6%
-1.4%
-1.2%
-1.0%
-0.8%
-0.6%
-0.4%
-0.2%
0.0%Energy Deficit Peak Deficit
Dec-15 Dec-16
Major Highlights (Dec 2016)
373.45 377.77
Apr-Dec'15 Apr-Dec'16
CIL Production in Million Tonnes
1.1 % Increase Apr-Dec’16
Imported Coal as % of Total Requirement
A. Imported (MT)
B. Domestic (MT)
% Ratio - A/(A+B)
129
378
25 %
Coking Coal-27MT Non-Coking Coal-
102MT
Source: CEA, CIL
OUTLOOK
Q3’FY17
INDUSTRY DEVELOPMENTS
BRIEF BACKGROUND FINANCIAL PERFORMANCE
PRESENTATION OUTLINE
OPERATIONAL PERFORMANCE
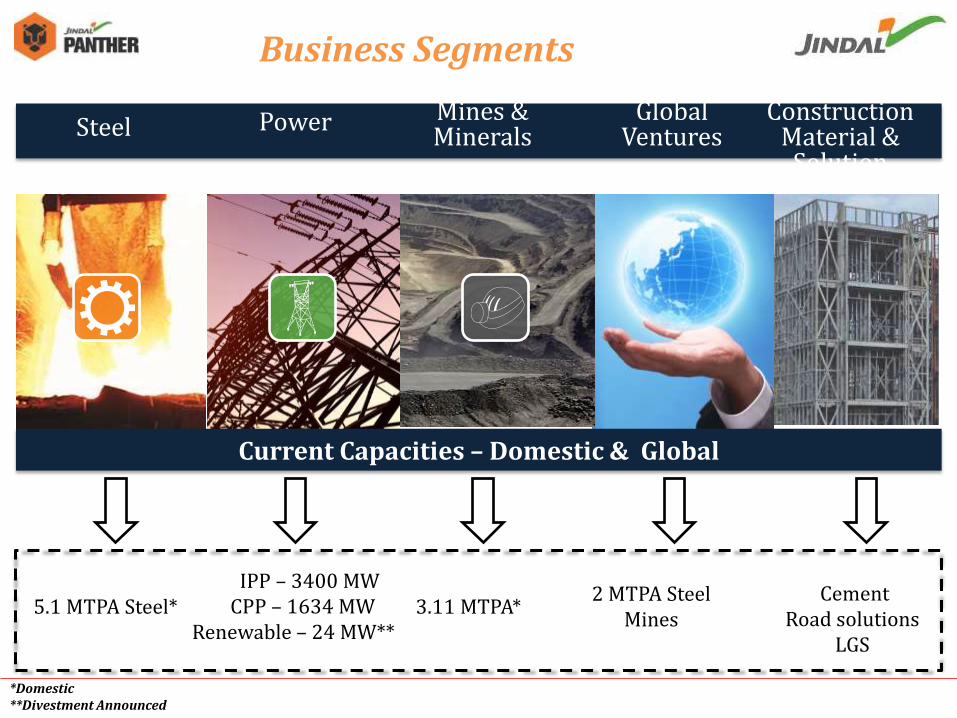
Steel Power Mines & Minerals
Global Ventures
Current Capacities – Domestic & Global
Business Segments
*Domestic **Divestment Announced
Construction Material &
Solution
5.1 MTPA Steel* 3.11 MTPA* IPP – 3400 MW CPP – 1634 MW
Renewable – 24 MW**
2 MTPA Steel Mines
Cement
Road solutions LGS
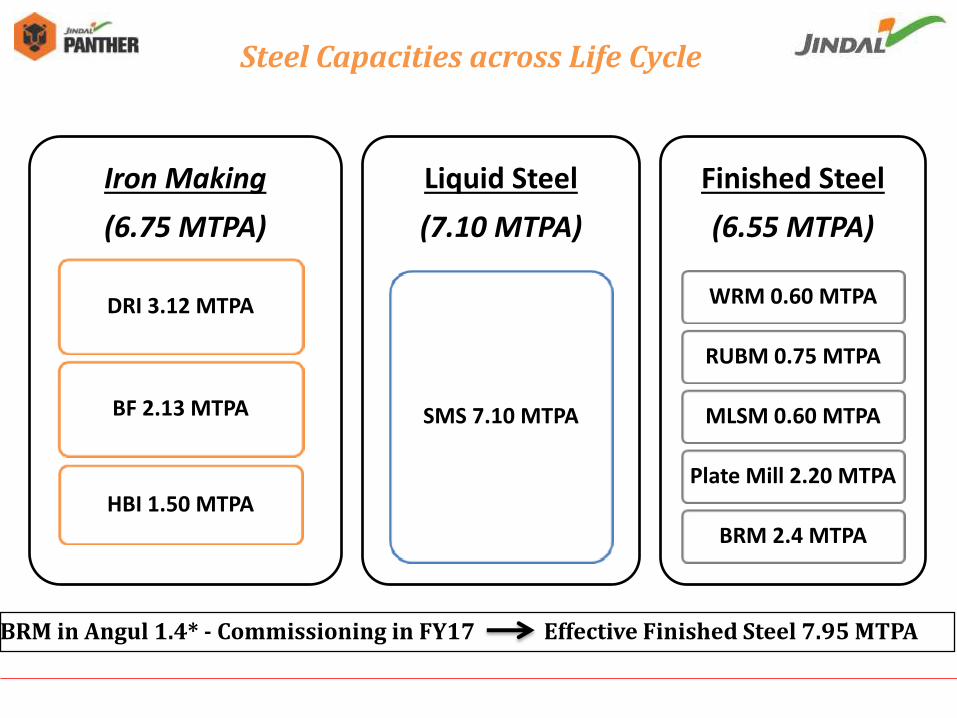
Capacity in deail
Iron Making
(6.75 MTPA)
BF 2.13 MTPA
DRI 3.12 MTPA
HBI 1.50 MTPA
Liquid Steel
(7.10 MTPA)
SMS 7.10 MTPA
Finished Steel
(6.55 MTPA)
WRM 0.60 MTPA
RUBM 0.75 MTPA
MLSM 0.60 MTPA
Plate Mill 2.20 MTPA
BRM 2.4 MTPA
Steel Capacities across Life Cycle
BRM in Angul 1.4* - Commissioning in FY17 Effective Finished Steel 7.95 MTPA
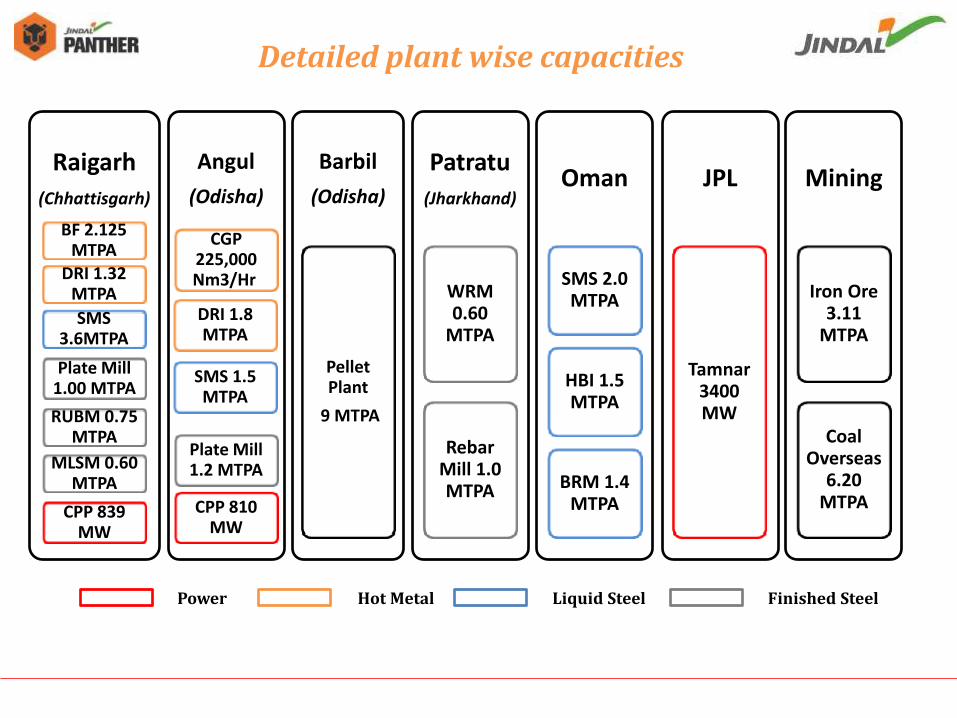
Capacity in deail
Raigarh
(Chhattisgarh)
SMS 3.6MTPA
BF 2.125 MTPA
DRI 1.32 MTPA
Plate Mill 1.00 MTPA
RUBM 0.75 MTPA
MLSM 0.60 MTPA
CPP 839 MW
Angul
(Odisha)
SMS 1.5 MTPA
DRI 1.8 MTPA
CGP 225,000 Nm3/Hr
Plate Mill 1.2 MTPA
CPP 810 MW
Barbil
(Odisha)
Pellet Plant
9 MTPA
Patratu
(Jharkhand)
WRM 0.60
MTPA
Rebar Mill 1.0 MTPA
Oman
SMS 2.0 MTPA
HBI 1.5 MTPA
BRM 1.4 MTPA
JPL
Tamnar 3400 MW
Mining
Iron Ore 3.11
MTPA
Coal Overseas
6.20 MTPA
Detailed plant wise capacities
Power Hot Metal Liquid Steel Finished Steel
Steel Insights into few products…
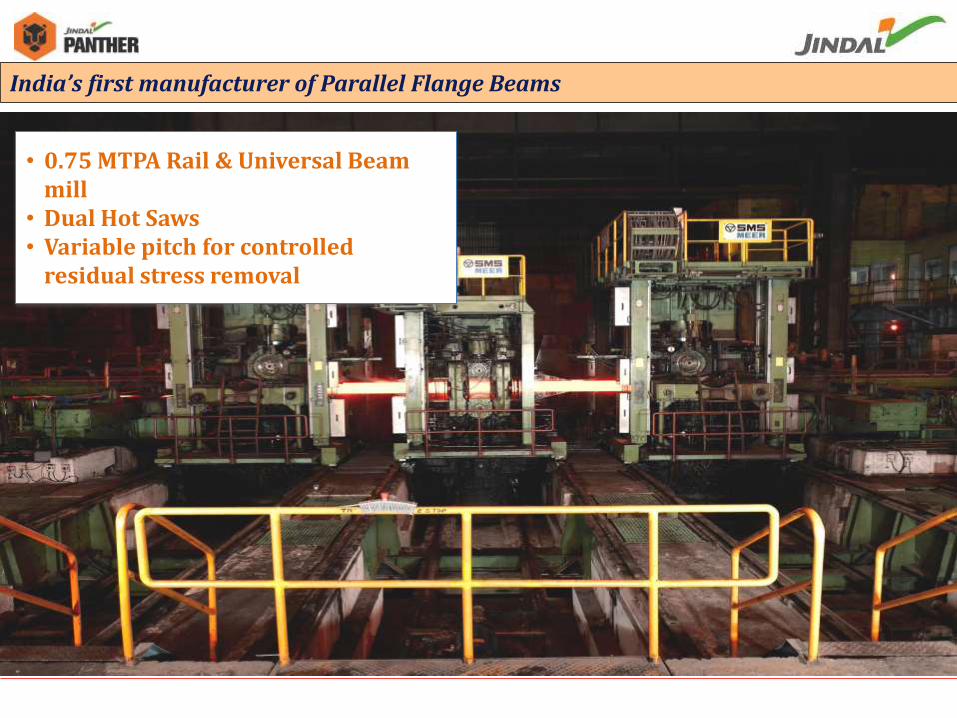
• 0.75 MTPA Rail & Universal Beam mill
• Dual Hot Saws • Variable pitch for controlled
residual stress removal
India’s first manufacturer of Parallel Flange Beams
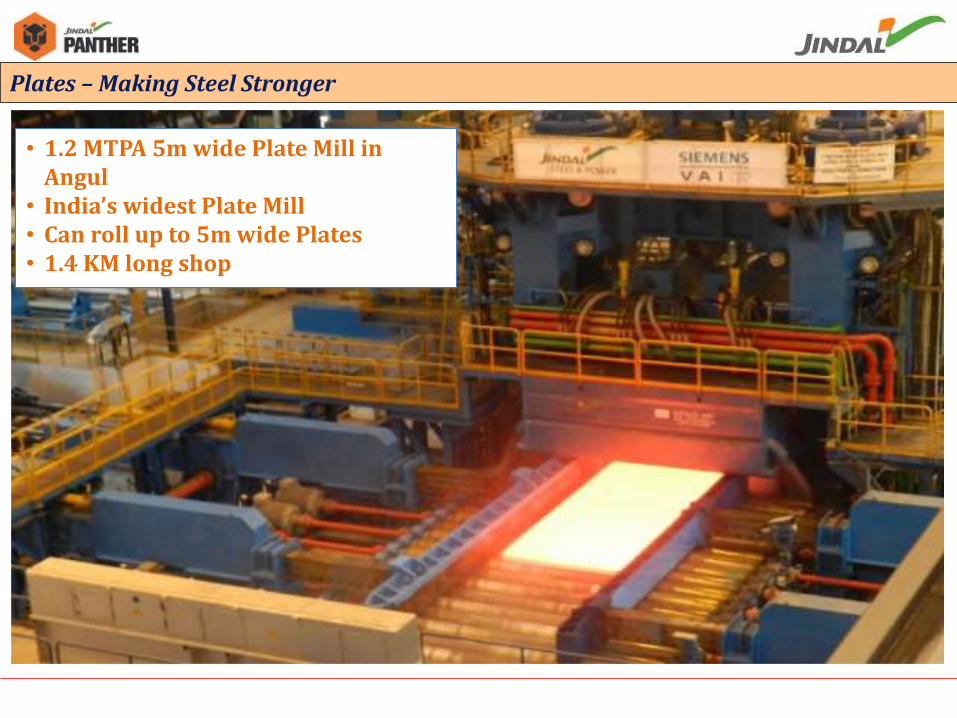
• 1.2 MTPA 5m wide Plate Mill in Angul
• India’s widest Plate Mill • Can roll up to 5m wide Plates • 1.4 KM long shop
Plates – Making Steel Stronger
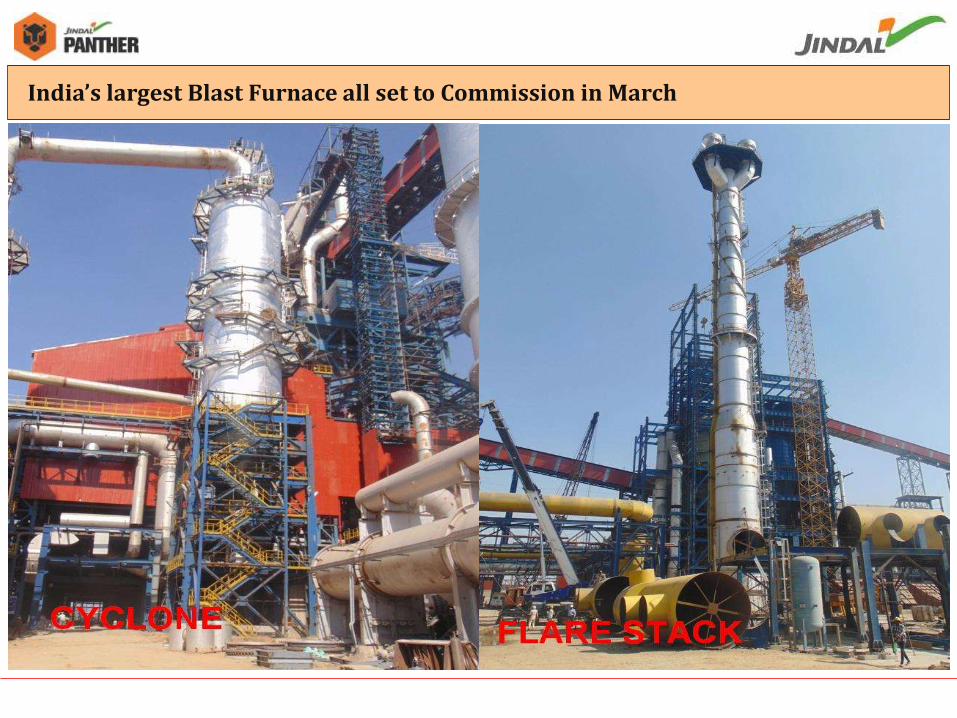
India’s largest Blast Furnace all set to Commission in March
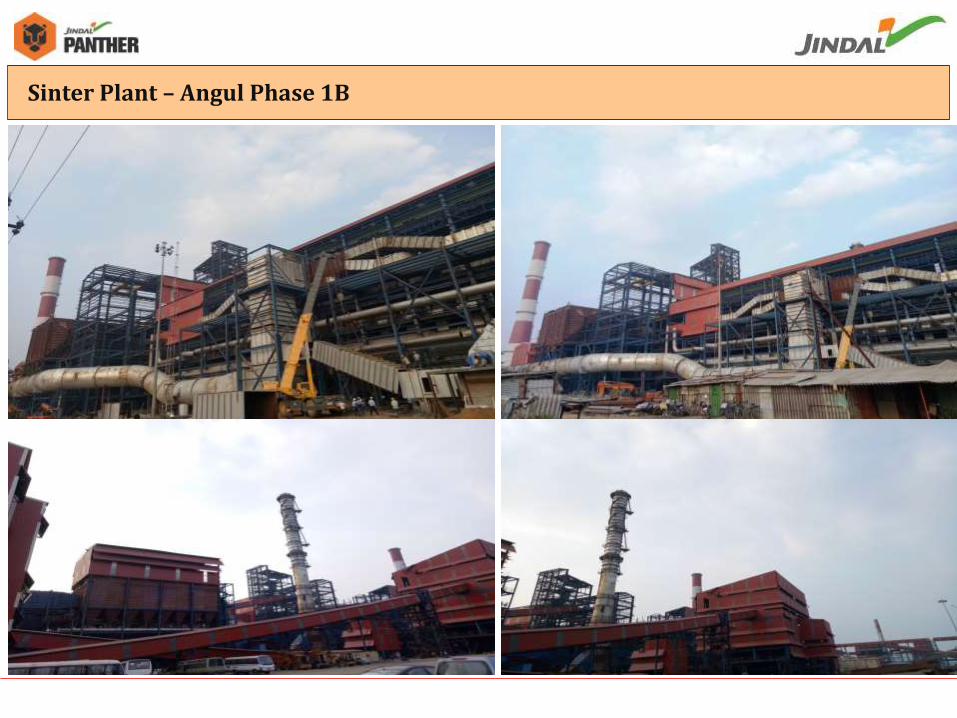
Sinter Plant – Angul Phase 1B
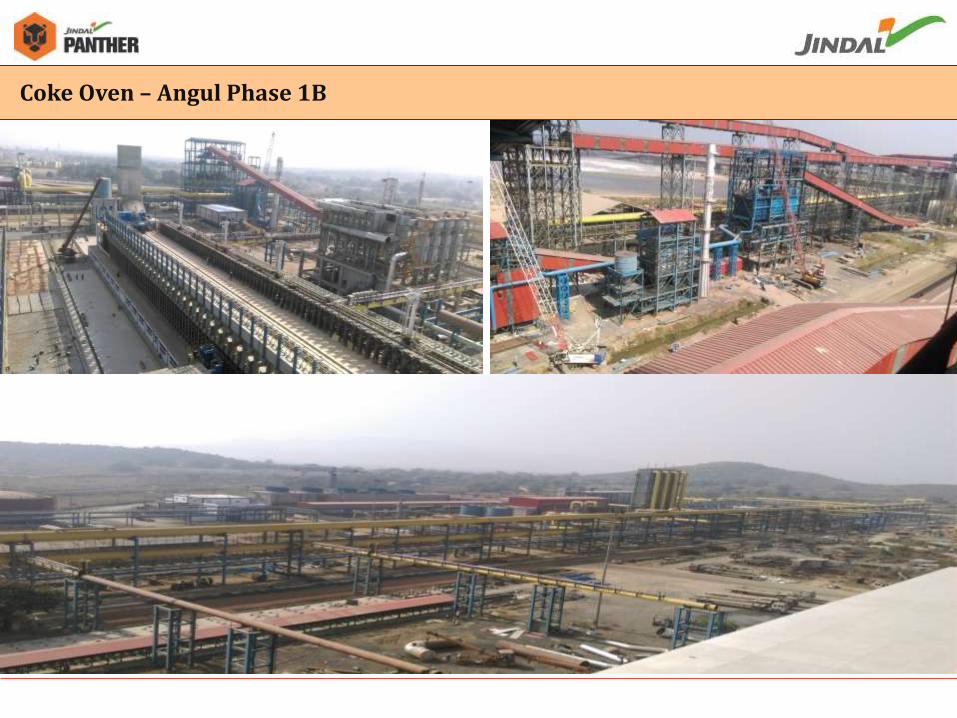
Coke Oven – Angul Phase 1B
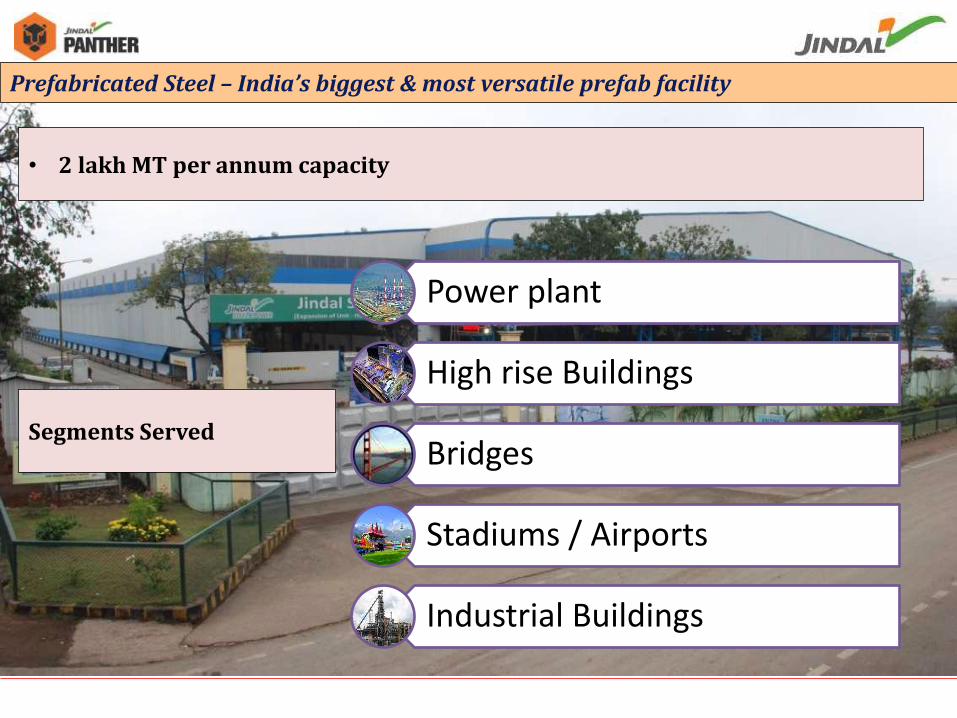
Prefabricated Steel – India’s biggest & most versatile prefab facility
• 2 lakh MT per annum capacity
Power plant
High rise Buildings
Bridges
Stadiums / Airports
Industrial Buildings
Segments Served
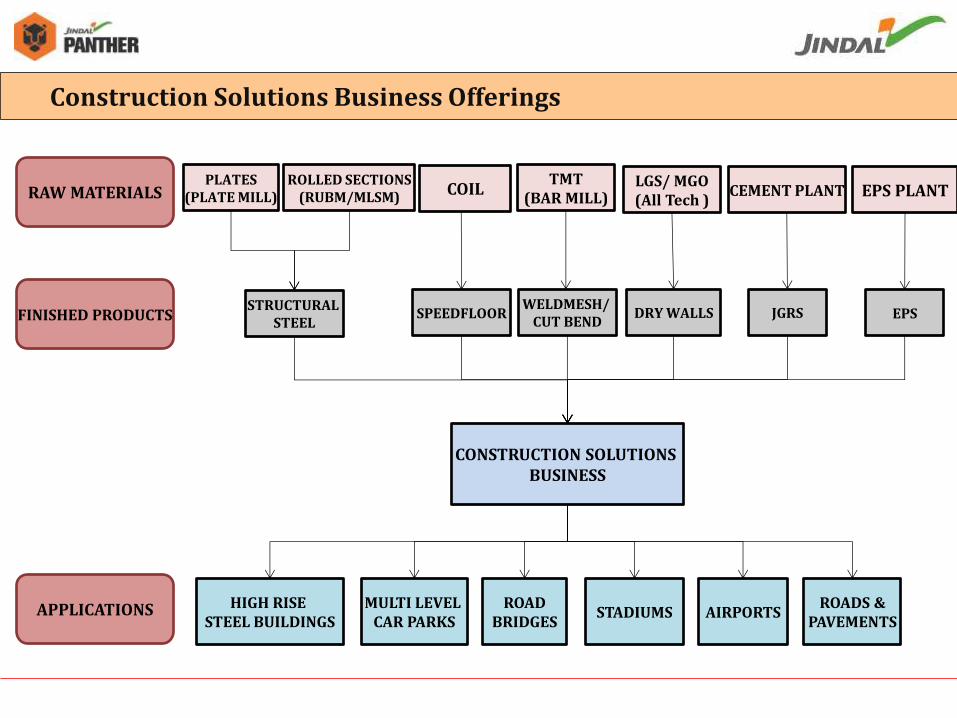
PLATES (PLATE MILL)
ROLLED SECTIONS (RUBM/MLSM)
TMT (BAR MILL)
LGS/ MGO (All Tech )
CEMENT PLANT
STRUCTURAL STEEL
WELDMESH/ CUT BEND
DRY WALLS JGRS
CONSTRUCTION SOLUTIONS BUSINESS
HIGH RISE STEEL BUILDINGS
MULTI LEVEL CAR PARKS
ROAD BRIDGES
STADIUMS AIRPORTS ROADS &
PAVEMENTS
RAW MATERIALS
FINISHED PRODUCTS
APPLICATIONS
COIL
SPEEDFLOOR
Construction Solutions Business Offerings
EPS PLANT
EPS
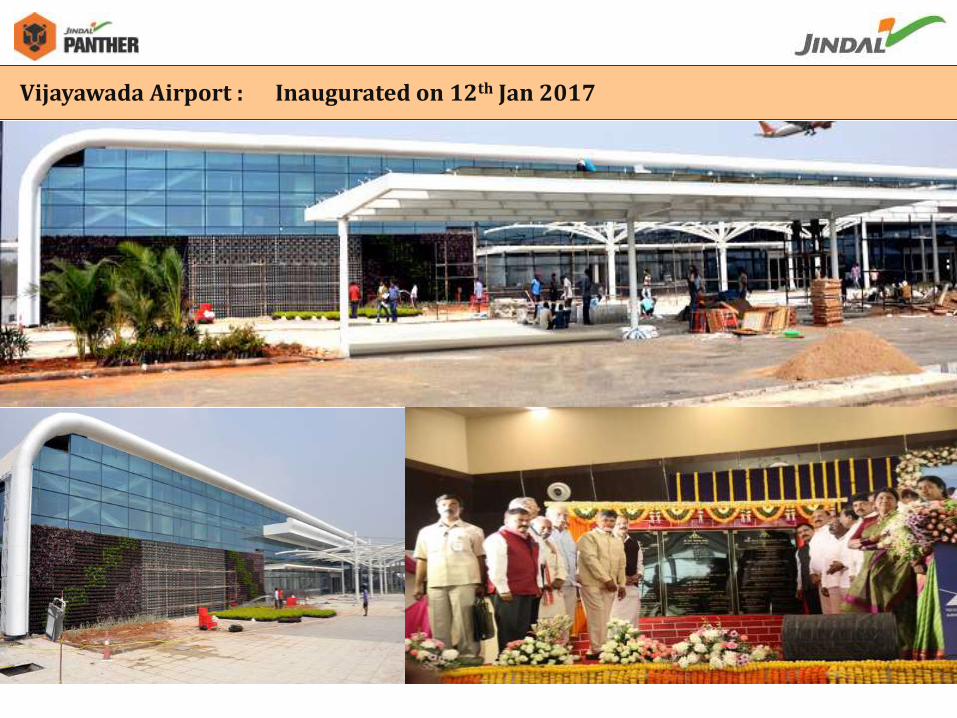
Vijayawada Airport : Inaugurated on 12th Jan 2017
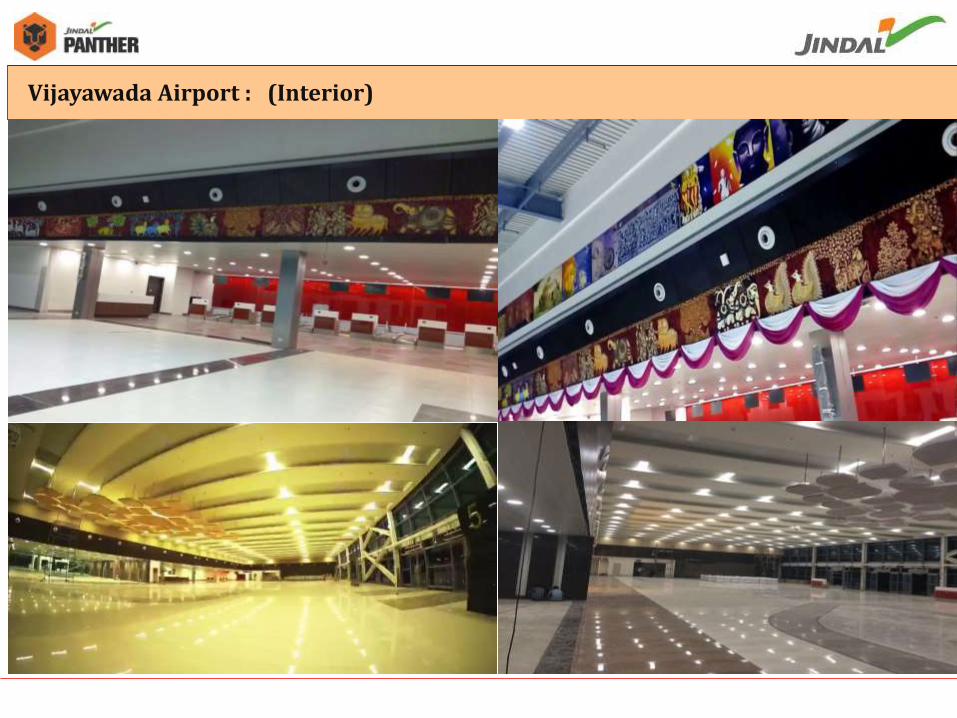
Vijayawada Airport : (Interior)
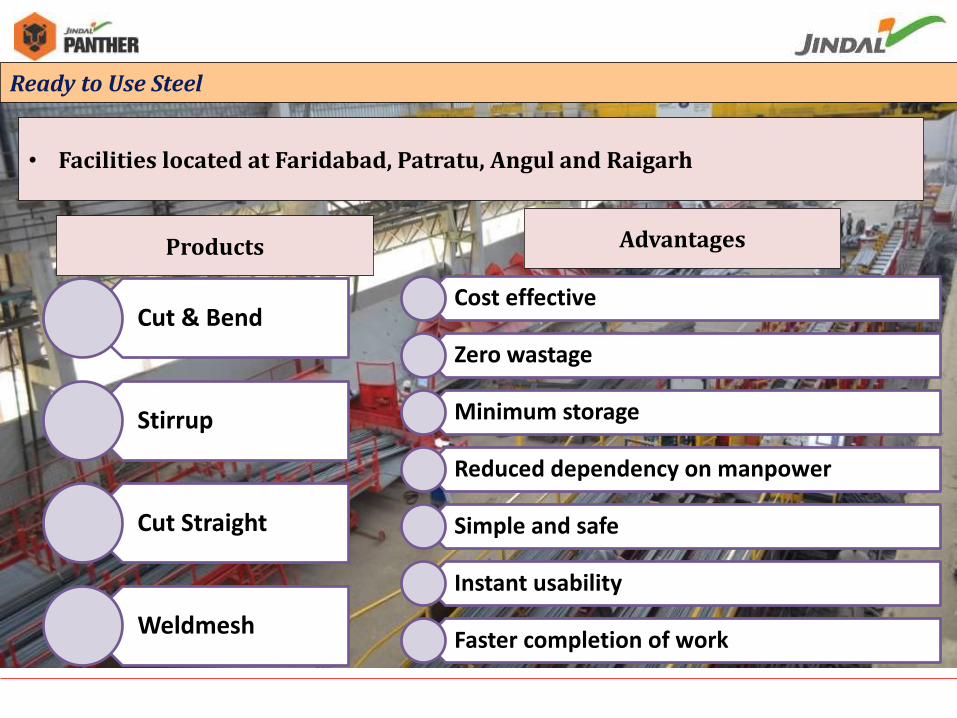
Ready to Use Steel
• Facilities located at Faridabad, Patratu, Angul and Raigarh
Cost effective
Zero wastage
Minimum storage
Reduced dependency on manpower
Simple and safe
Instant usability
Faster completion of work
Advantages
Cut & Bend
Stirrup
Cut Straight
Weldmesh
Products
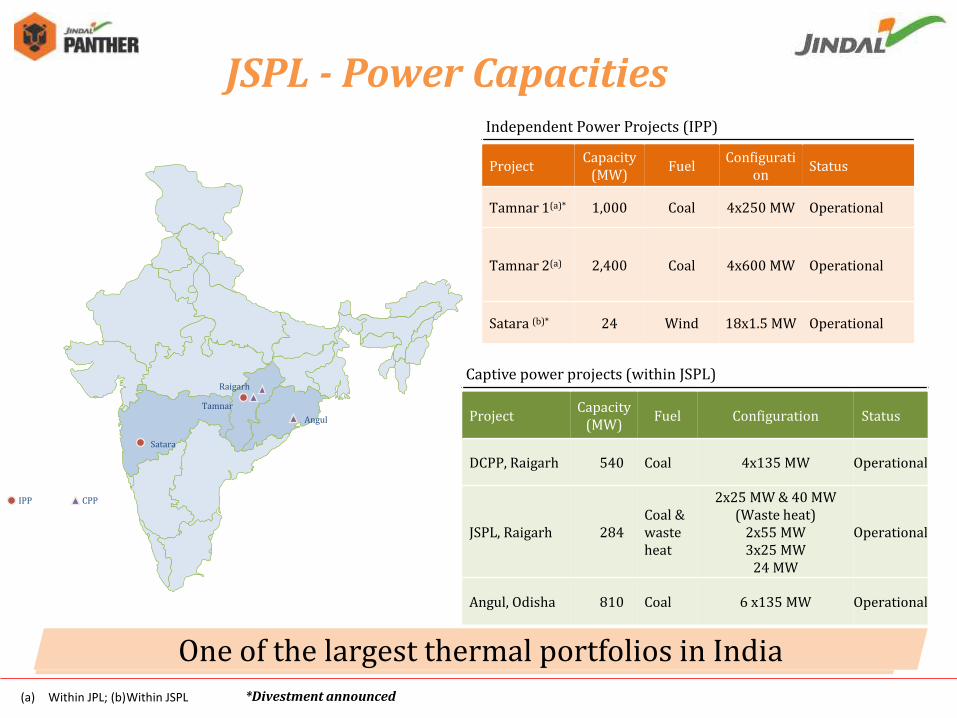
Angul
Satara
Tamnar
Raigarh Captive power projects (within JSPL)
Project Capacity
(MW) Fuel Configuration Status
DCPP, Raigarh 540 Coal 4x135 MW Operational
JSPL, Raigarh 284 Coal & waste heat
2x25 MW & 40 MW (Waste heat)
2x55 MW 3x25 MW
24 MW
Operational
Angul, Odisha 810 Coal 6 x135 MW Operational
Independent Power Projects (IPP)
Project Capacity
(MW) Fuel
Configuration
Status
Tamnar 1(a)* 1,000 Coal 4x250 MW Operational
Tamnar 2(a) 2,400 Coal 4x600 MW Operational
Satara (b)* 24 Wind 18x1.5 MW Operational
(a) Within JPL; (b) Within JSPL
IPP CPP
One of the largest thermal portfolios in India
JSPL - Power Capacities
*Divestment announced
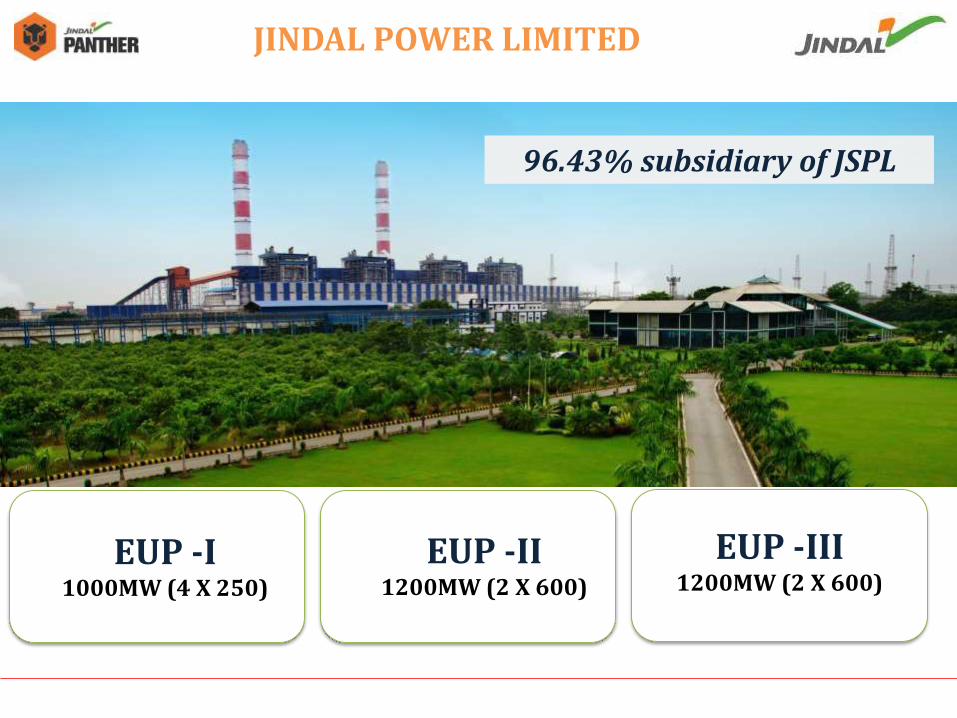
96.43% subsidiary of JSPL
JINDAL POWER LIMITED
EUP -I 1000MW (4 X 250)
EUP -II 1200MW (2 X 600)
EUP -III 1200MW (2 X 600)

Project Buyer Type
Period Quantum (MW) From To
Tamnar II
(Phase 1) Tamil Nadu Long Term Feb-14 Sep-28 400
Tamnar II
(Phase 1) KSEB
Long Term Jun-16 May-41 200
Tamnar II
(Phase 1) Long Term Oct-17 Sep-42 150
Tamnar II
(Phase 1)
Chhattisgarh
Long Term After commercial
operation of Unit and for complete life of plant
60
Tamnar II
(Phase 2) Long Term
After commercial operation of Unit and for
complete life of plant 60
PPA Arrangements
Over 30% of total capacity tied up *
* Out of 3400 MW (IPP)
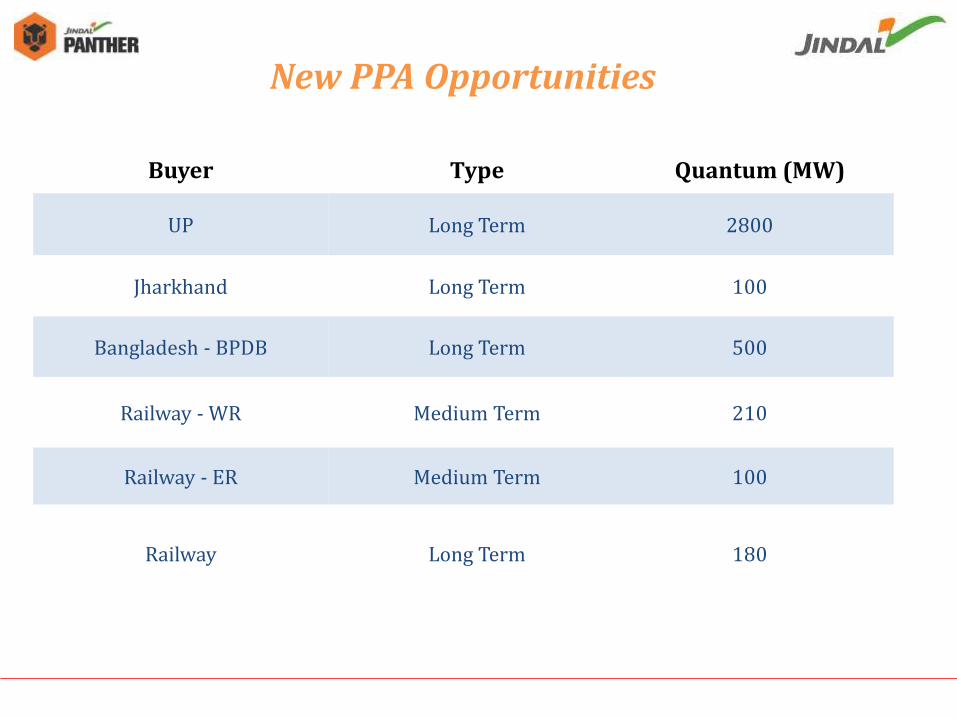
Buyer Type Quantum (MW)
UP Long Term 2800
Jharkhand Long Term 100
Bangladesh - BPDB Long Term 500
Railway - WR Medium Term 210
Railway - ER Medium Term 100
Railway Long Term 180
New PPA Opportunities
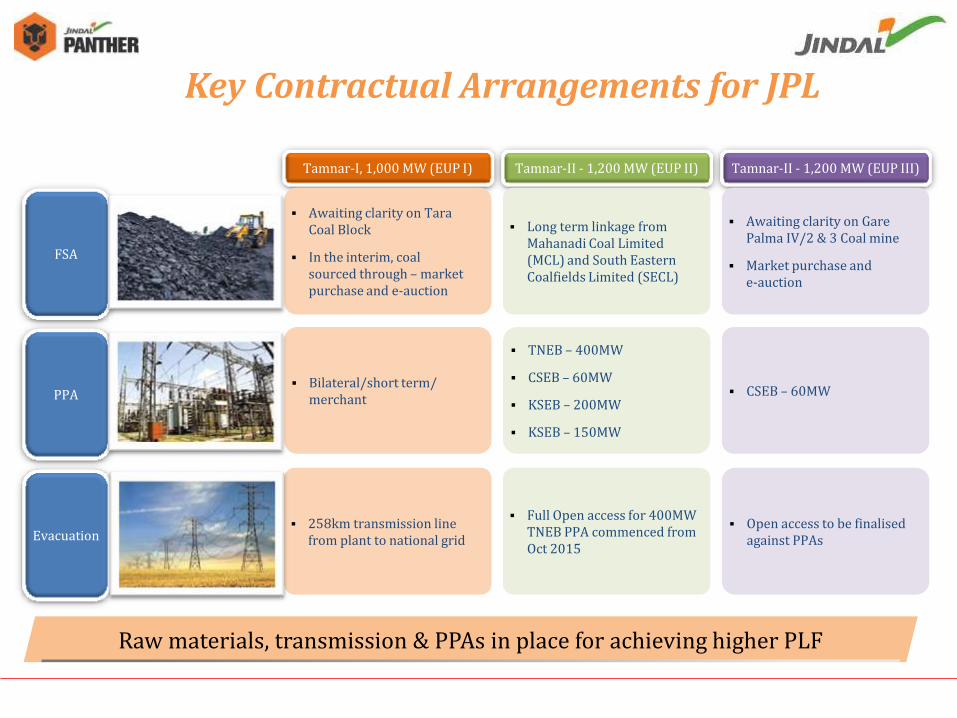
Tamnar-I, 1,000 MW (EUP I)
Awaiting clarity on Tara Coal Block
In the interim, coal sourced through – market purchase and e-auction
Bilateral/short term/ merchant
258km transmission line from plant to national grid
Tamnar-II - 1,200 MW (EUP II)
Long term linkage from Mahanadi Coal Limited (MCL) and South Eastern Coalfields Limited (SECL)
TNEB – 400MW
CSEB – 60MW
KSEB – 200MW
KSEB – 150MW
Full Open access for 400MW TNEB PPA commenced from Oct 2015
Tamnar-II - 1,200 MW (EUP III)
Awaiting clarity on Gare Palma IV/2 & 3 Coal mine
Market purchase and e-auction
CSEB – 60MW
Open access to be finalised against PPAs
FSA
PPA
Evacuation
Raw materials, transmission & PPAs in place for achieving higher PLF
Key Contractual Arrangements for JPL
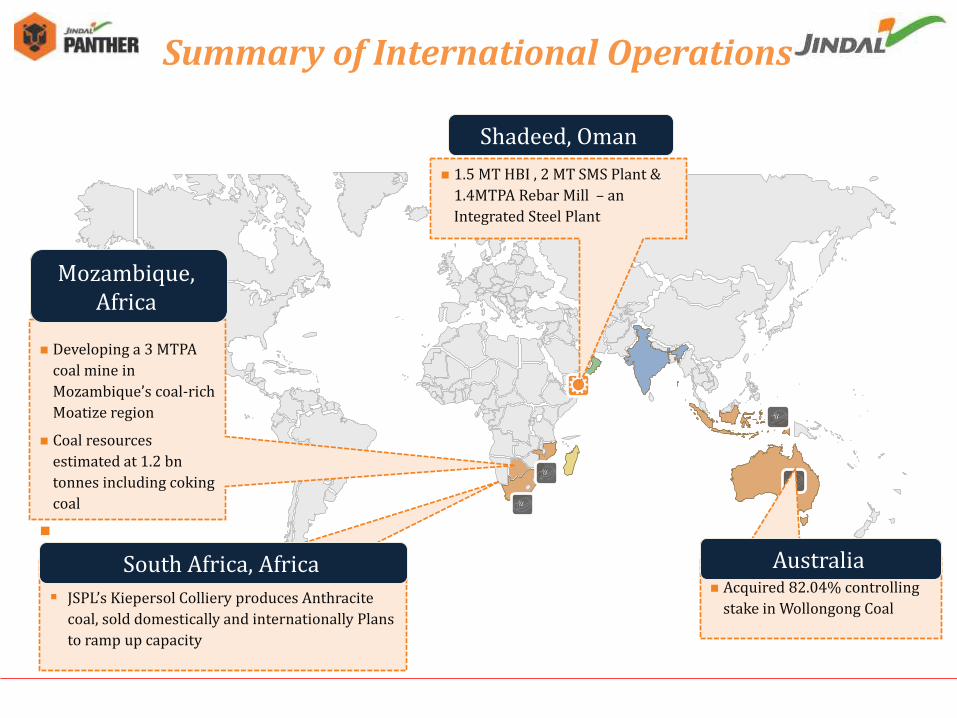
Developing a 3 MTPA
coal mine in
Mozambique’s coal-rich
Moatize region
Coal resources
estimated at 1.2 bn
tonnes including coking
coal
Mozambique, Africa
JSPL’s Kiepersol Colliery produces Anthracite
coal, sold domestically and internationally Plans
to ramp up capacity
South Africa, Africa Acquired 82.04% controlling
stake in Wollongong Coal
Australia
1.5 MT HBI , 2 MT SMS Plant &
1.4MTPA Rebar Mill – an
Integrated Steel Plant
Shadeed, Oman
Summary of International Operations
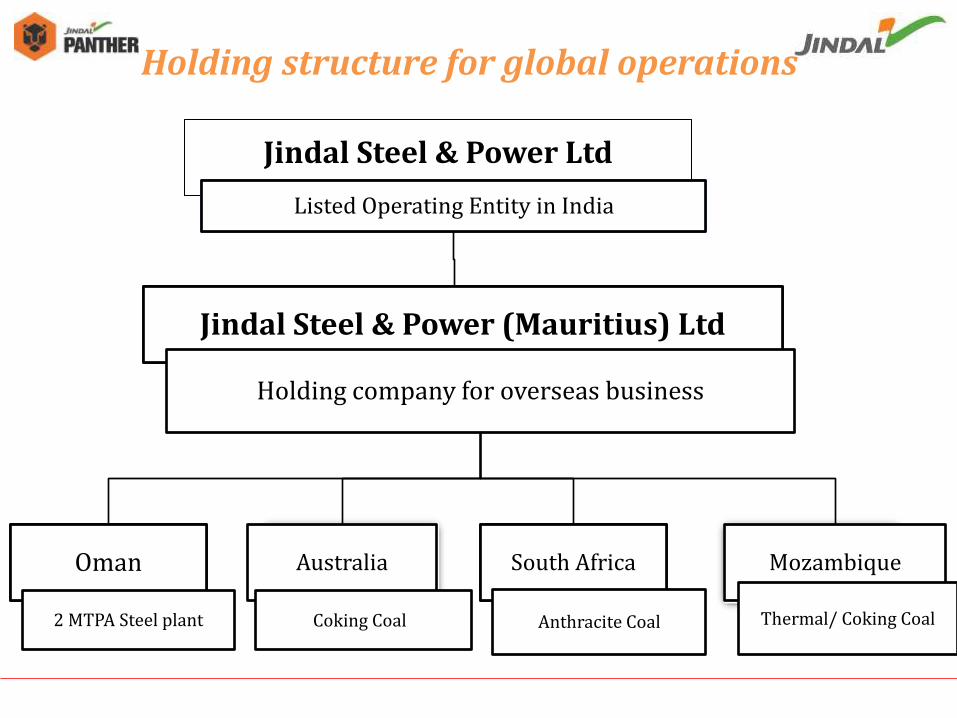
Oman
Holding structure for global operations
Jindal Steel & Power Ltd
Listed Operating Entity in India
Australia
Coking Coal
South Africa
Anthracite Coal
Mozambique
Thermal/ Coking Coal
Jindal Steel & Power (Mauritius) Ltd
Holding company for overseas business
2 MTPA Steel plant
OUTLOOK
Q3 FY’17
INDUSTRY DEVELOPMENTS
BRIEF BACKGROUND FINANCIAL PERFORMANCE
PRESENTATION OUTLINE
OPERATIONAL PERFORMANCE
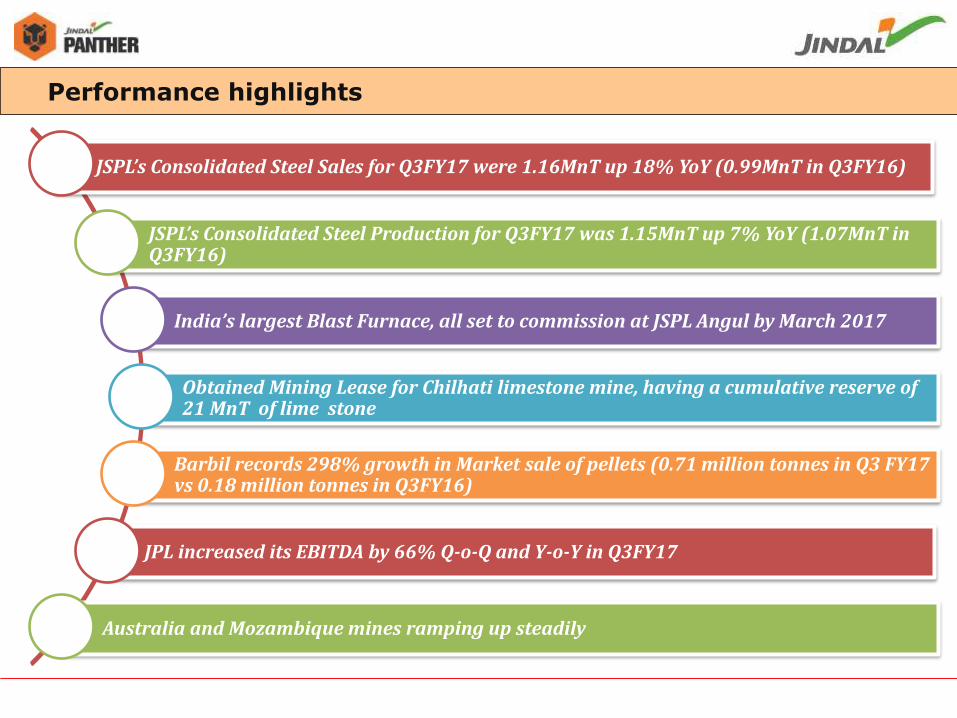
Performance highlights
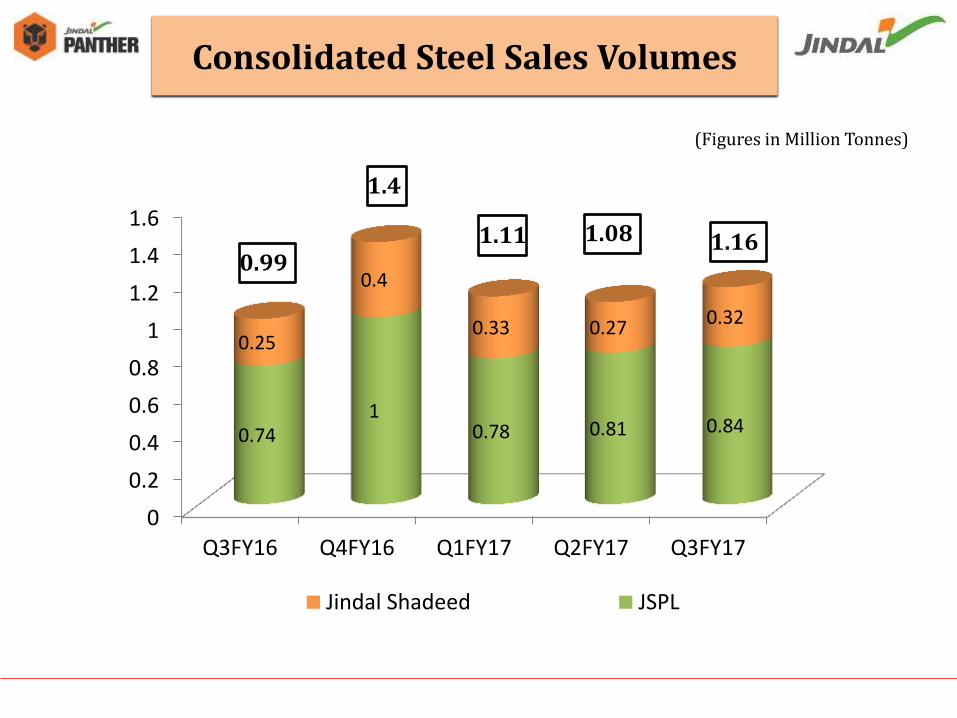
JSPL’s Consolidated Steel Sales for Q3FY17 were 1.16MnT up 18% YoY (0.99MnT in Q3FY16)
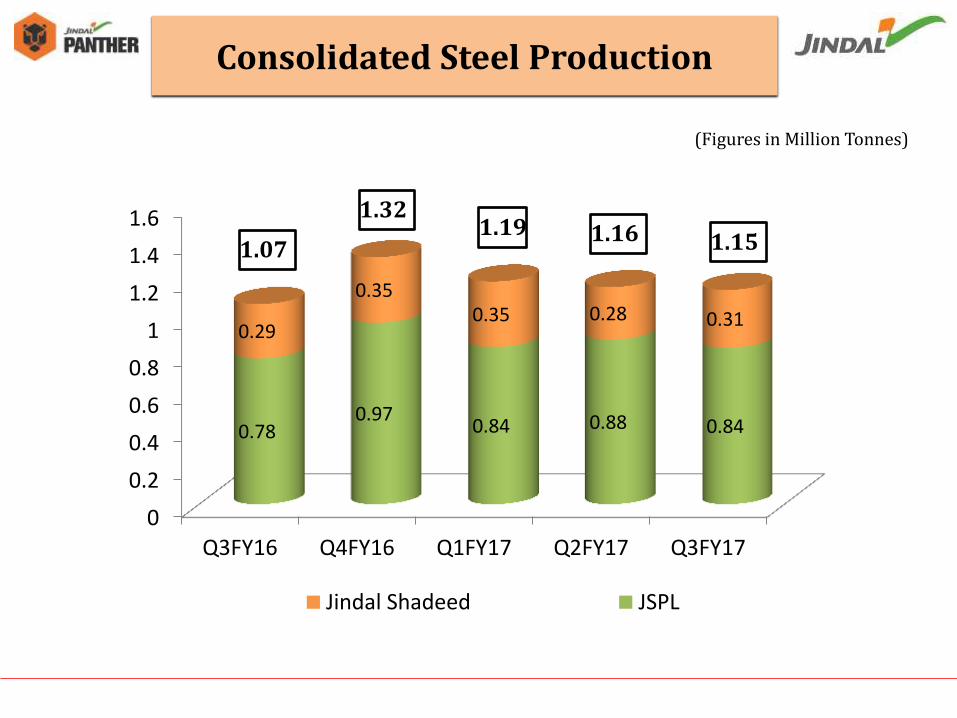
JSPL’s Consolidated Steel Production for Q3FY17 was 1.15MnT up 7% YoY (1.07MnT in Q3FY16)
India’s largest Blast Furnace, all set to commission at JSPL Angul by March 2017
Obtained Mining Lease for Chilhati limestone mine, having a cumulative reserve of 21 MnT of lime stone
Barbil records 298% growth in Market sale of pellets (0.71 million tonnes in Q3 FY17 vs 0.18 million tonnes in Q3FY16)
JPL increased its EBITDA by 66% Q-o-Q and Y-o-Y in Q3FY17
Australia and Mozambique mines ramping up steadily
0
0.2
0.4
0.6
0.8
1
1.2
1.4
1.6
Q3FY16 Q4FY16 Q1FY17 Q2FY17 Q3FY17
0.78 0.97
0.84 0.88 0.84
0.29
0.35 0.35 0.28 0.31
Jindal Shadeed JSPL
1.07
1.32 1.19 1.16 1.15
Consolidated Steel Production
(Figures in Million Tonnes)
0
0.2
0.4
0.6
0.8
1
1.2
1.4
1.6
Q3FY16 Q4FY16 Q1FY17 Q2FY17 Q3FY17
0.74 1
0.78 0.81 0.84
0.25
0.4
0.33 0.27 0.32
Jindal Shadeed JSPL
Consolidated Steel Sales Volumes
0.99
1.4
1.11 1.08 1.16
(Figures in Million Tonnes)
Key Customers & Adding…
OUTLOOK
Q3 FY’17
INDUSTRY DEVELOPMENTS
BRIEF BACKGROUND FINANCIAL PERFORMANCE
PRESENTATION OUTLINE
OPERATIONAL PERFORMANCE
Analyst Presentation
48 - -
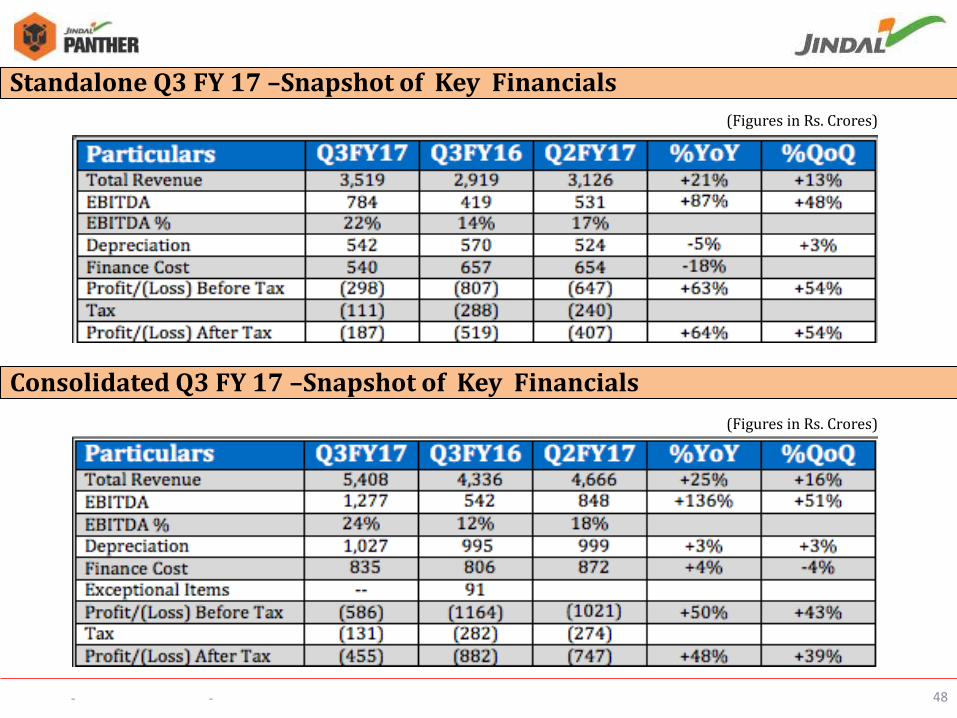
Standalone Q3 FY 17 –Snapshot of Key Financials
Consolidated Q3 FY 17 –Snapshot of Key Financials
(Figures in Rs. Crores)
(Figures in Rs. Crores)
49 - -
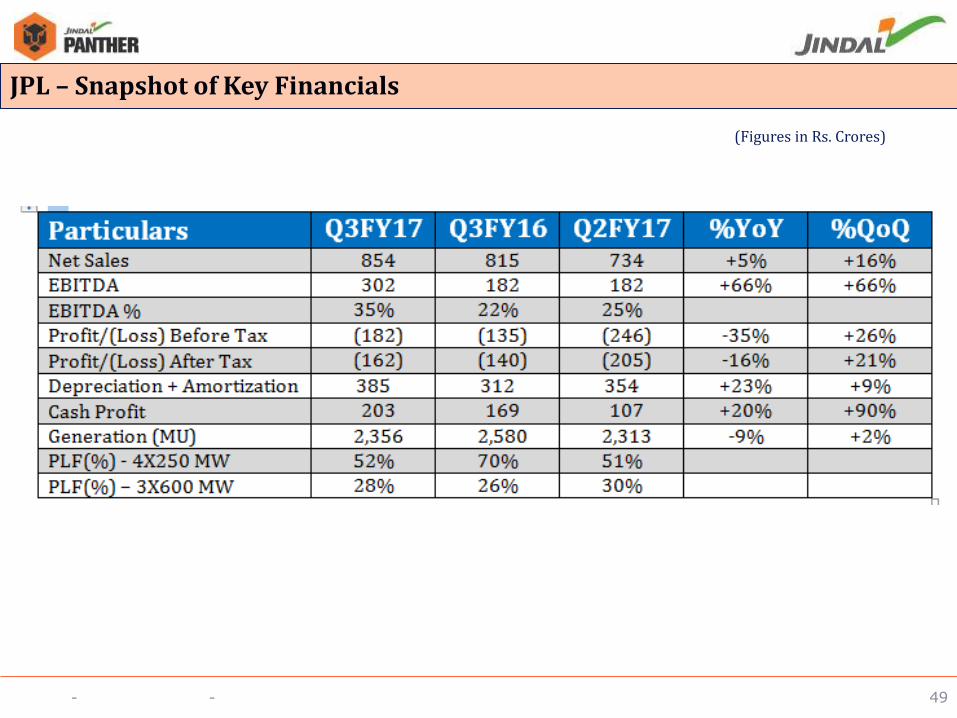
JPL – Snapshot of Key Financials
(Figures in Rs. Crores)
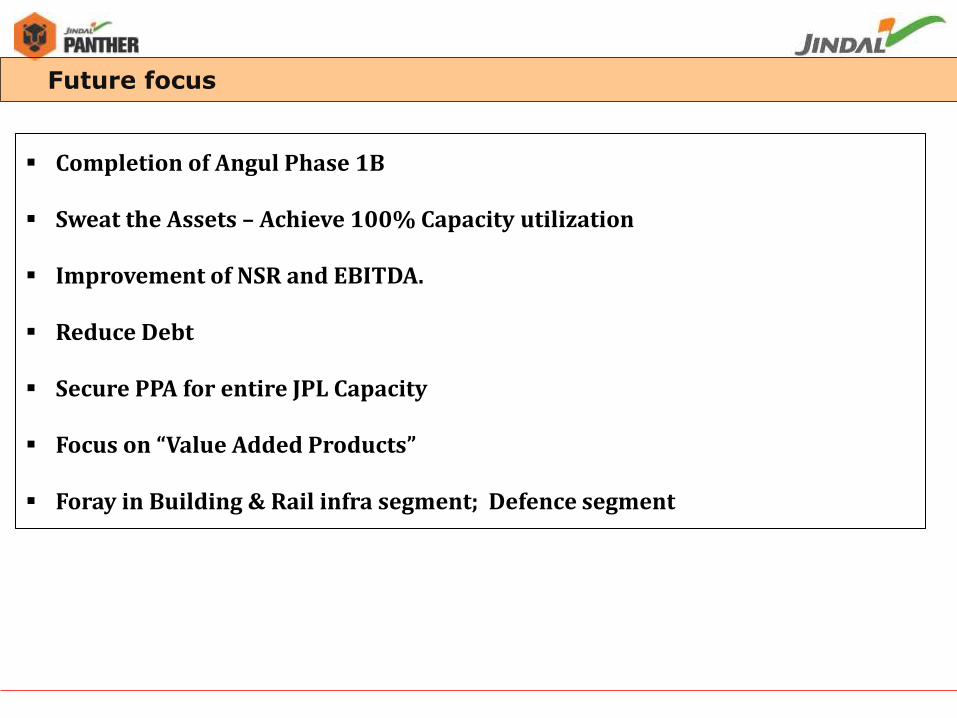
Future focus
Completion of Angul Phase 1B
Sweat the Assets – Achieve 100% Capacity utilization
Improvement of NSR and EBITDA.
Reduce Debt
Secure PPA for entire JPL Capacity
Focus on “Value Added Products”
Foray in Building & Rail infra segment; Defence segment

For any information please contact: - Mr. Nishant Baranwal – Head, Investor Relations Tel : +91 11-41462198 Mobile:+91 8800690255 Email: - [email protected]
THANK YOU